
95% of researchers rate our articles as excellent or good
Learn more about the work of our research integrity team to safeguard the quality of each article we publish.
Find out more
ORIGINAL RESEARCH article
Front. Oncol. , 22 November 2021
Sec. Neuro-Oncology and Neurosurgical Oncology
Volume 11 - 2021 | https://doi.org/10.3389/fonc.2021.731414
This article is part of the Research Topic It Takes a Village: The Expanding Multi-Disciplinary Approach to Brain Metastasis View all 14 articles
Blood vessels in the brain tissue form a compact vessel structure and play an essential role in maintaining the homeostasis of the neurovascular system. The low dosage of photodynamic intervention (PDT) significantly affects the expression of cellular biomarkers. To understand the impact of photodynamic interventions on cerebrovascular endothelial cells, we evaluated the dosage-dependent impact of porfimer sodium-mediated PDT on B.END3 cells using flow cytometer, comet assay, RNA sequencing, and bioinformatics analysis. To examine whether PDT can induce disorder of intracellular organelles, we did not observe any significance damage of DNA and cellular skeleton. Moreover, expression levels of cellular transporters-related genes were significantly altered, implying the drawbacks of PDT on cerebrovascular functions. To address the potential molecular mechanisms of these phenotypes, RNA sequencing and bioinformatics analysis were employed to identify critical genes and pathways among these processes. The gene ontology (GO) analysis and protein-protein interaction (PPI) identified 15 hub genes, highly associated with cellular mitosis process (CDK1, CDC20, MCM5, MCM7, MCM4, CCNA2, AURKB, KIF2C, ESPL1, BUB1B) and DNA replication (POLE2, PLOE, CDC45, CDC6). Gene set enrichment analysis (GSEA) reveals that TNF-α/NF-κB and KRAS pathways may play a critical role in regulating expression levels of transporter-related genes. To further perform qRT-PCR assays, we find that TNF-α/NF-κB and KRAS pathways were substantially up-regulated, consistent with GSEA analysis. The current findings suggested that a low dosage of PDT intervention may be detrimental to the homeostasis of blood-brain barrier (BBB) by inducing the inflammatory response and affecting the expression of surface biomarkers.
Blood circulation system plays a critical role in maintaining the homeostasis physiology and supplying the essential nutrients to the targeted organisms or tissue (1). In the nervous system, the blood-brain barrier (BBB) was composed of endothelial cells and other types of cells, for example pericytes and neuron end-foot, to form the compact vascular system (2, 3). The compact BBB can blockade most of the unnecessary molecules to be diffused to the nervous system, and positively pump harmful metabolism waste into blood circulation (4). However, dysfunction or impairment of BBB involves or promotes some pathological processes, such as promoting neurodegenerative inflammation in the brain (5, 6), breakdown of BBB in stroke (7), and psychosis due to BBB disorder (8). Moreover, cerebrovascular BBB could be stimulated by various exogenous factors, such as vascular endothelial growth factor (VEGF) (9, 10), to promote angiogenesis and support the growth of brain tumor (11) during tumorigenesis. These results indicated that any unexpected interventions might lead to a severe stimulus that would disrupt the homeostasis of the neuron-blood system. Thus, exploring the stimulus response of vasculature after any therapeutic interventions, including the damage and biological impact on the biological functions, is imperative.
Photodynamic therapy (PDT) has been widely utilized in the glioblastoma multiforme (GBM) therapy, including the interstitial PDT (iPDT) and post-PDT (12). PDT requires three essential components: oxygen, radiation light, and photosensitizers (13). The intrinsic mechanism of PDT is the interaction between cellular components and reactive oxygen species (ROS), causing damage of cellular components and leading to cell apoptosis (14). After receiving PDT intervention, the overall survival (OS) of GBM patients can be prolonged from 15 months to 27 months (15). The potential reasons for improving the OS of GBM patients may be attributed to increased permeability of chemotherapeutic drugs (16) across the BBB. These results from clinical reports implied that the PDT intervention might strongly stimulate the BBB endothelial cells for specific responses. To further identify and explore the pivotal changes in endothelial cells after PDT intervention may provide more necessary information to guide the clinical application of PDT on GBM therapy.
The interventional effects of PDT on the endothelial cells are decided by types of photosensitizers and specific cell lines (17, 18). Hitherto, many types of photosensitizers have been clinically approved for disease therapy; for example, 5-aminolevulinic acid (5-ALA) (19), hematoporphyrin derivative (HPD) (20), and porfimer sodium (21, 22). Hemoporfin-mediated photodynamic therapy induces cellular autophagy to prevent cellular apoptosis (23). Aloe-emodin-mediated PDT activates the MAPK signaling pathway on HUVECs to inhibit angiogenesis and cell metastasis (24); verteporfin-mediated PDT promotes the expression of vascular endothelial growth factor (VEGF), VEGF receptor (VEGFR)-3, and pigment epithelium-derived factor (PEDF) (25); a low dose of photofrin-mediated PDT increased the expression of VEGF and promoted endothelial cell proliferation in normal brain (26). However, the effect of PDT on the cerebrovascular endothelial cells, especially at transcriptomic levels, might improve a emerging scope for evaluating the impact of PDT on the nervous system.
Herein, we explored the biological impact of the photodynamic intervention on endothelial cells, including apoptosis, DNA damage, cellular skeleton, and expression levels of critical transporter-related genes. Then, we utilized RNA-seq to analyze the biological impact of porfimer sodium-driven photodynamic intervention on the cerebrovascular endothelial cells of the mouse (B.END3 cells). We identified 187 and 2976 differentially expressed gene (DEG) depending on two different interventional dosages, respectively. Bioinformatics analysis using gene ontology (GO), gene set enrichment analysis (GSEA), and KEGG gene sets identified critical pathways that were confirmed by quantitative real-time PCR. Thus, the current study provides additional information about the transcriptome changes in the cerebrovascular endothelial cells during the PDT process and the scope to further evaluate the impact of the photodynamic intervention on BBB homeostasis.
Rat endothelial B.END3 cells were obtained from the Cell Bank of the Chinese Academy of Sciences and cultured in DMEM medium (SH30022.01B, Gibco, USA) with 10% fetal bovine serum (FBS; SH30084.03, HyClone, USA) and 100 U/mL penicillin-streptomycin (Gibco, Cat. 15140122, USA) under 5% CO2 at 37°C. When the B.END3 cells formed the monolayer, the photosensitizer Porfimer sodium (300 μg/mL) was added to the medium and incubated for 90 min. Then, the B.END3 cells received the laser exposure (635 nm with 100 mW/cm2) and the light doses at 10 J/cm2 and 20 J/cm2, respectively.
After PDT intervention, the cells were lysed, collected, and stored at -80°C until delivered to the Tianjin Novogene Bioinformatic Technology Co., Ltd for further analysis. The whole-genome transcriptome profiling was examined by RNA sequencing process: sequencing on the Illumina Hiseq2500 using 150 bp paired-end reads (6.0 G of throughput). The RNA sequencing data have been deposited to NCBI GEO database (GEO accession cat. GSE172198).
Total RNA was extracted from the cell lysis samples using Total RNA Extraction Kit (R1200/100T, Solarbio Life Sciences, China) and then reverse-transcribed into cDNA using the PrimeScript™ RT MasterMix (Perfect Real Time) (TaKaRa, Japan). The cDNA was used for qPCR using TB Green® Premix Ex Taq™ (Tli RNaseH Plus) (TaKaRa) with gene-specific primers, and the data were normalized against β-actin as the control. PCR primers are listed in Table S1.
Before further analysis, the RNA data were aligned against the mouse genome (GRCm39, GenBank assembly accession: GCA_000001635.9) and deposited in NCBI GEO database. The GO function analysis was performed using g:profilter website (https://biit.cs.ut.ee/gprofiler/gost), in which the “ordered query” was selected and other parameters were set as default. The protein-protein interaction (PPI) network was assessed using the STRING website (https://string-db.org/), while the minimum required interaction score was set as the highest confidence (0.900) and kmeans clustering was set as 5. The PPI network was re-generated using Cytoscape (version 3.6.0) with a circular layout. GSEA was performed using GSEA software (v4.1.0) with the molecular signature database obtained from the GSEA website (http://www.gsea-msigdb.org/gsea/msigdb/index.jsp); number of permutations was set as 10000; no collapse was aligned to gene symbols; permutation type was set as gene set, and other parameters were set as default. The function-related information of above-mentioned genes in this study was obtained from the GENE section of NCBI (https://www.ncbi.nlm.nih.gov/). Transcription factors of DEGs were obtained from TRRUST database (https://www.grnpedia.org/trrust/).
All the statistical results and figures were generated using GraphPad_Prism 5.0, and the Venn diagram was obtained from the Van der Peer Lab bioinformatics website (http://bioinformatics.psb.ugent.be/webtools/Venn/). For GSEA analysis, the significance of enriched pathways was set as |Normal Enrichment Score|>1.0 and NORM p-value < 0.05 and FDR q-value <0.05. For other analyses, p-value < 0.05 was considered statistically significant.
After PDT intervention, 1×10⁵ cells were digested, purified, and mixed with 30 μL of low-melting-point agarose (LMPA, 1% DMEM solution). Then, this cell solution was dropped on the glass slide to form a thin film and cooled for 10 min using ice to allow solidification. Then, an additional 75 μL of LMPA (1% DMEM solution) was dropped on this glass slice as the top layer, and the process was repeated. These samples were dipped in the lysis solution (containing 10 mM Tris-HCl, 2.5 M NaCl, 100 mM Na2EDTA, 1% Triton X-100) overnight. The DNA sample was unwound for 20 min in the alkaline electrophoresis solution and electrophoresis performed for 20 min (voltage 1 V/cm and current 300 mA). Finally, these samples were stained using ethidium bromide (EB; 100 μL, 20 μg/mL). The images of DNA damage were obtained under Zeiss 880 confocal microscopy.
For p53 translocation assay and actin staining assay, B.END3 cells were seeded on glass coverslips and then fixed in 4% paraformaldehyde at room temperature for 10 min. The preparation protocol was performed using standard processes described previously (27, 28). p53 (MA5-12557), Alexa Fluor™ 647 (Invitrogen™, A20186), and Alexa Fluor™ 488 Phalloidin (Invitrogen™, A12379) were purchased from ThermoFisher Scientific.
Statistical examination and image preparation of assays were performed using GraphPad Prism 5.0 software (GraphPad Software Inc.). Student’s t-test was performed: *, p < 0.05; **, p < 0.01; ***, p < 0.001; ****, p < 0.0001; ns, no significance.
The therapeutic products of PDT are reactive oxygen species (ROS) (29) that can strongly interact with cellular components and affect down-stream gene expression. However, the biological impacts of PDT through ROS are complex. Herein, we firstly examined the impact of PDT-generated ROS on cellular apoptosis, which is a major reason to cause tumor cell death. As shown in Figure 1A, we observed that the apoptotic percentage of B.END3 cells after receiving PDT is only 1.49%, similar with control (2.04%) or single-factor interventional group (1.81% and 3.11%, respectively). This result implied that low dosage PDT could not induce cellular apoptosis and corroborate safety on BBB endothelial cells.
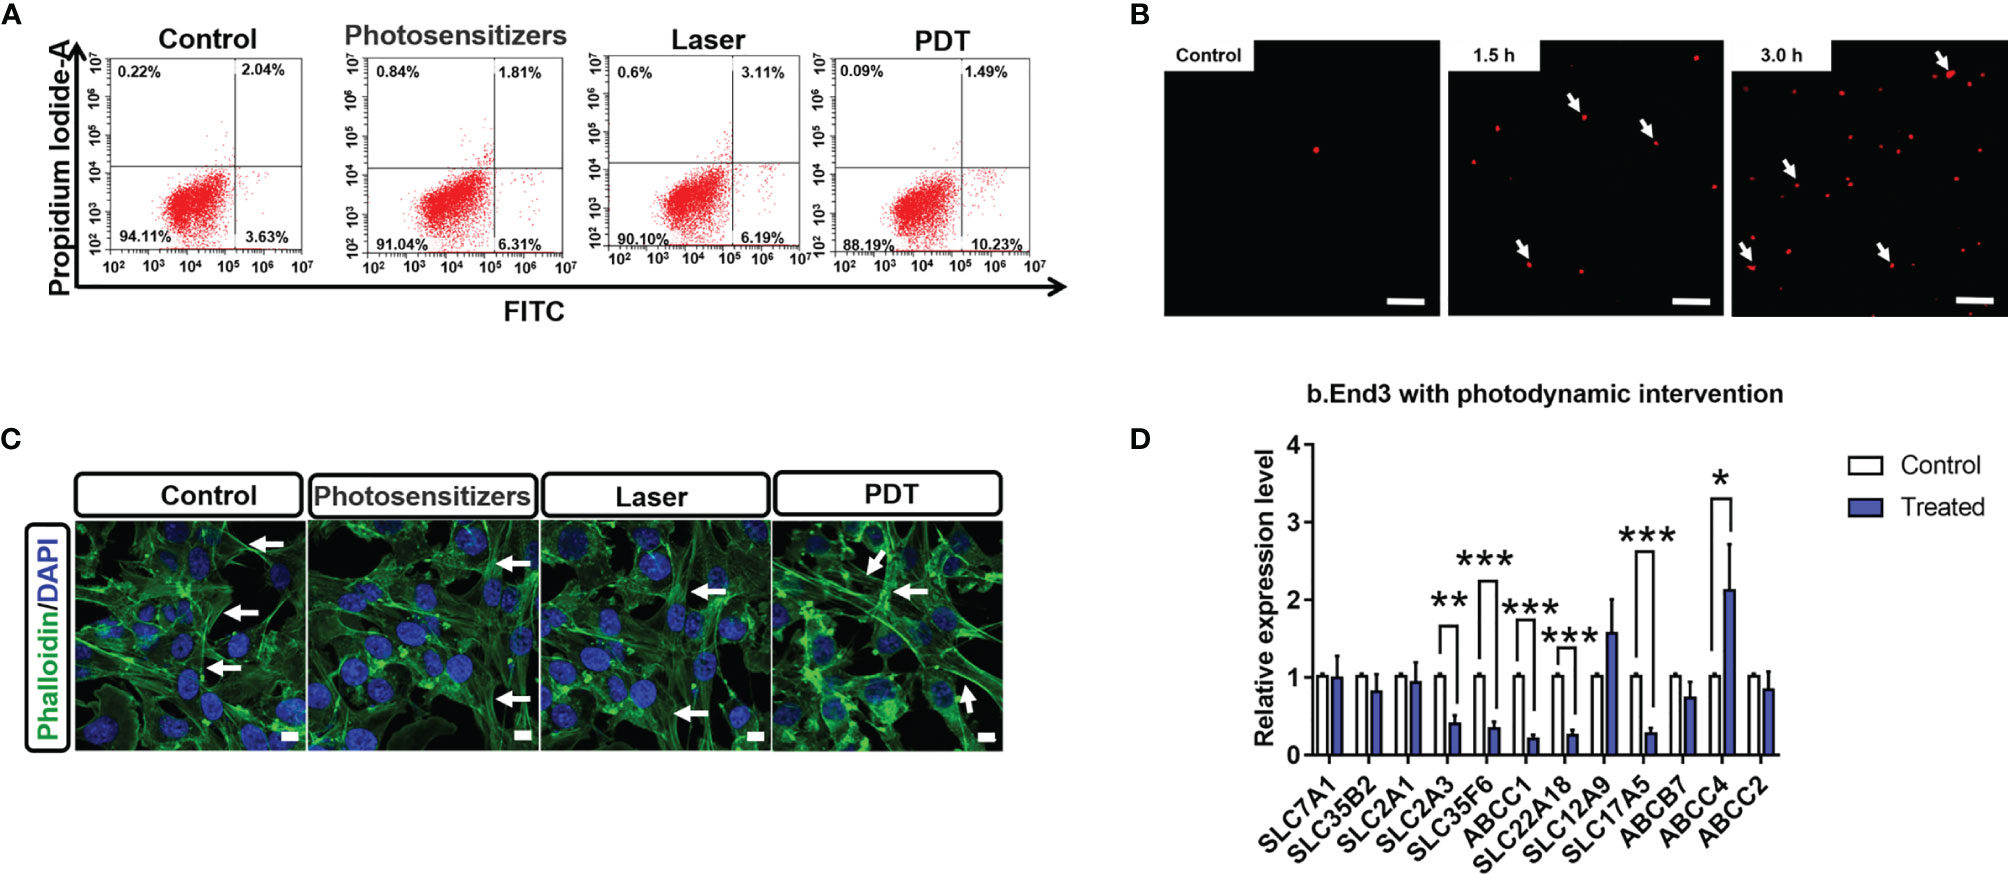
Figure 1 (A) Percentage of apoptotic cells stained by Annexin V-FITC and propidium iodide after PDT intervention at 24 h (B) Comet assays of B.END3 cells with PDT intervention at 1.5 h and 3.0 h compared to the control group. Nucleus is stained by ethidium bromide. The scale bar is 100 μm. (C) Immunostaining for cellular skeletons on control, photosensitizer-treated group, only laser-treated group, and PDT-treated group. Nucleus is stained by DAPI. The scale bar is 50 μm. (D) Quantification for mRNA levels of BBB critical biomarkers in B.End3 cells after photodynamic intervention (dose 20 J/cm2) (n = 3/group). *p<0.05; **p<0.01; ***p<0.001.
Next, we investigated the effects of PDT on DNA and cellular skeleton. To explore the effect of PDT, we performed the comet assay to examine whether PDT intervention caused DNA damage. As shown in Figure 1B, fluorescence tails of DNA after PDT did not display any significant change at 1.5 h and 3.0 h in B.END3 cells, because the length of fluorescence tail is the critical index for evaluating DNA damage. These results implied that PDT at 20 J/cm2 laser dose and 300 μg/mL porfimer sodium could not directly damage the DNA in cerebrovascular endothelial cells.
The cellular skeleton plays an essential role in supporting cellular structure and further affecting the cellular processes (30). Herein, we investigated whether PDT can affect the structure of B.END3 cellular skeletons by immunostaining method (31) as shown in Figure 1C. After intervention, we cannot observe any morphological difference between intervention-treated group and control groups (including sham and single-factor intervention), although the fluorescent intensity of cellular boundary was stronger than that of other groups. These results could be attributed to the cellular stimulus for ROS and may affect the cell migration, requiring further investigation.
The biological integrity of BBB is decided by the compact cell stack and the specific expression of surface biomarkers, i.e. molecular transporters (4). These surface transporters can selectively pump the necessary nutrients into brain parenchyma and the harmful components out of the nervous system (32). To evaluate the impact of PDT on BBB cellular transporters, we quantitatively measured the mRNA expression levels of critical transporters compared to the no intervention group. As shown in Figure 1D, we observed that SLC2A3 (GLUT-3), SLC35F6, ABCC1 (MRP1), SLC22A18 (efflux transporter-like protein), and SLC17A5 (acidic Sugar Transporter) are significantly inhibited, while ABCC4 (MRP4) is significantly up-regulated. The down-regulation of SLC2A3 and SLC17A5 implied that PDT might affect the cellular uptake of glucose into brain parenchyma tissue, owing to that these genes are highly associated with glucose uptake (33, 34). ABCC1, ABCC4, and SLC22A18 participate in the drug resistance pathway (35). The down-regulation of ABCC1 and SLC22A18 implied that PDT improves the BBB uptake of chemotherapeutic drugs, while significant up-regulation of ABCC4 implied that PDT might blockade the pumping of therapeutic drugs out of nervous system. The comprehensive impacts of PDT on BBB functions and therapeutic drugs are unclear and should be well determined in the future.
In order to explore the molecular mechanisms of PDT intervention on the cerebrovascular endothelial cells, we performed an RNA sequencing assay to identify the DEGs in the B.END3 cell line. The schematic illustration of the experimental protocol is illustrated in Figures 2A, B. END3 cells are seeded dish to form the monolayer and then incubated with photosensitizer (300 μg/mL) for 90 min. Then, the cells were exposed to a 635 nm laser with light doses of 10 J/cm2 and 20 J/cm2, respectively. RNA-seq assays were employed to identify the genetic profiles after RNA extraction from these cell samples, and the differentially expressed genes were obtained by the comparative transcriptome analysis between PDT-intervention samples and control samples.
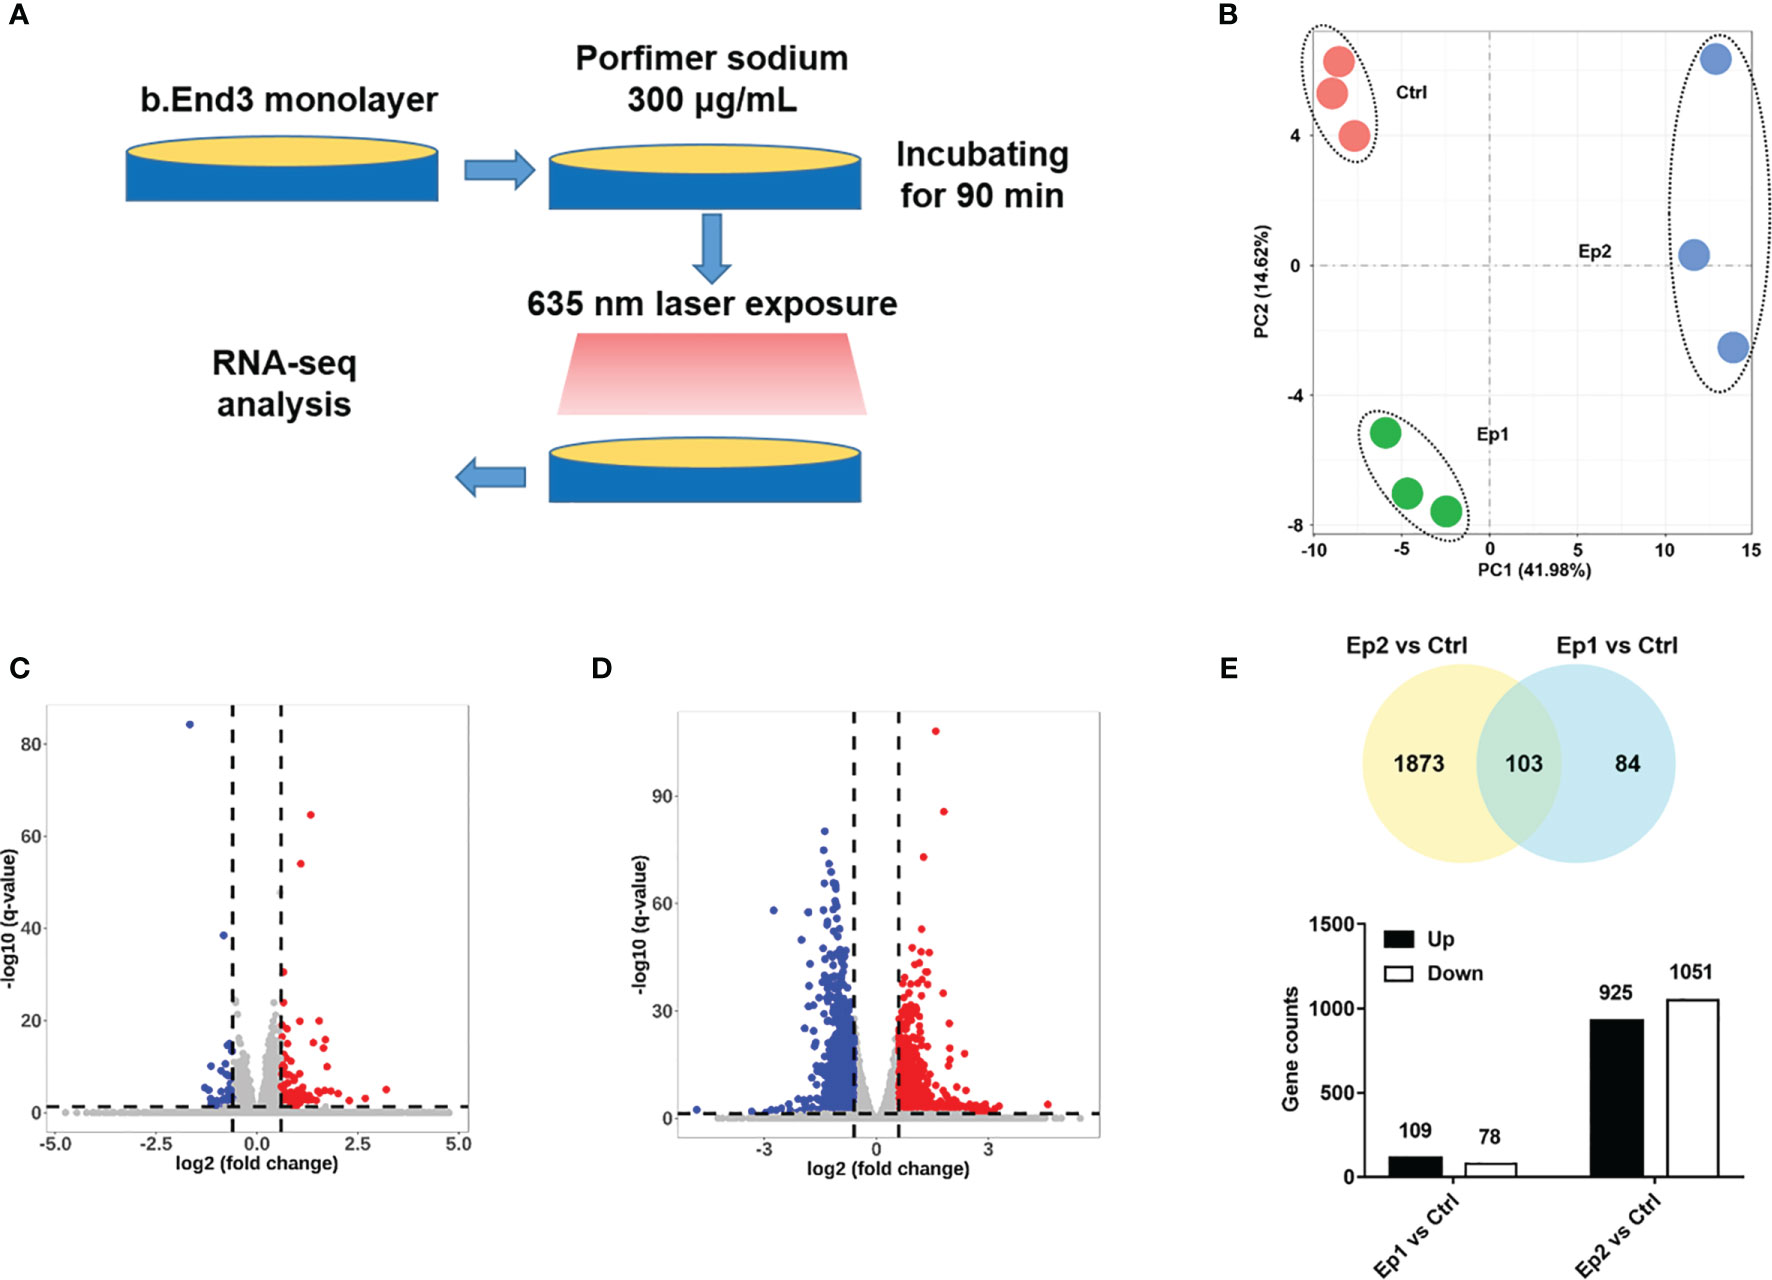
Figure 2 (A) Schematic illustration of RNA-sequencing protocol in this investigation. (B) PCA analysis of RNA-seq samples based on the genetic components. (C, D) Volcano plot of expressed genes based on the intervention dosage. (E) Statistical results of different genes (p-adj <0.05 and |log2FoldChange|>0.6).
Firstly, principal component analysis (PCA) was conducted to analyze the quality of RNA sequencing. As shown in Figure 2B, the PCA score of all samples based on the PKFM values of the gene can be divided into three independent subgroups: Ctrl, Ep1, and Ep2, and confirmed that these RNA sequencing data can be employed in the following assays. The relative expression levels of these genes were plotted as a Volcano map (Figures 2C, D), and DEGs were highlighted with blue and red colors, respectively. The threshold value considered as the significant difference was set as p-adj <0.05 and |log2(foldchange)|>0.6. Herein, we identified 187 and 2976 DEGs in Ep1 and Ep2 groups compared to the control group, respectively. The Venn overlapping diagrams of DEGs in both groups are shown in Figure 2E, and 103 joint genes were observed in both groups. Moreover, the significant increase in the DEGs from 187 to 2976 implied that the higher dose of PDT might activate several pathways or biological annotations for PDT stimulus response.
To elucidate the stimulus response and identify the hub genes of endothelial cells after PDT treatment, PPI analysis of DEGs was employed (threshold value of significant difference: p-adj <0.05 and |log2(foldchange|>1.0). Herein, all the DEGs were uploaded to the STRING website, and 267 interaction nodes were obtained for further analysis. As shown in Figure 3A, we found that three major gene clusters were identified, which can be attributed to DNA repair and cell cycle based on GO analysis. In the largest gene cluster, top-ranked 15 genes (Figure 3B) were identified based on the degree nodes and relative biological functions were presented in Table 1. A total of 14 enriched genes could be attributed to the cellular mitosis process (CDK1, CDC20, MCM5, MCM7, MCM4, CCNA2, AURKB, KIF2C, ESPL1, BUB1B) and DNA replication (POLE2, PLOE, CDC45, CDC6).
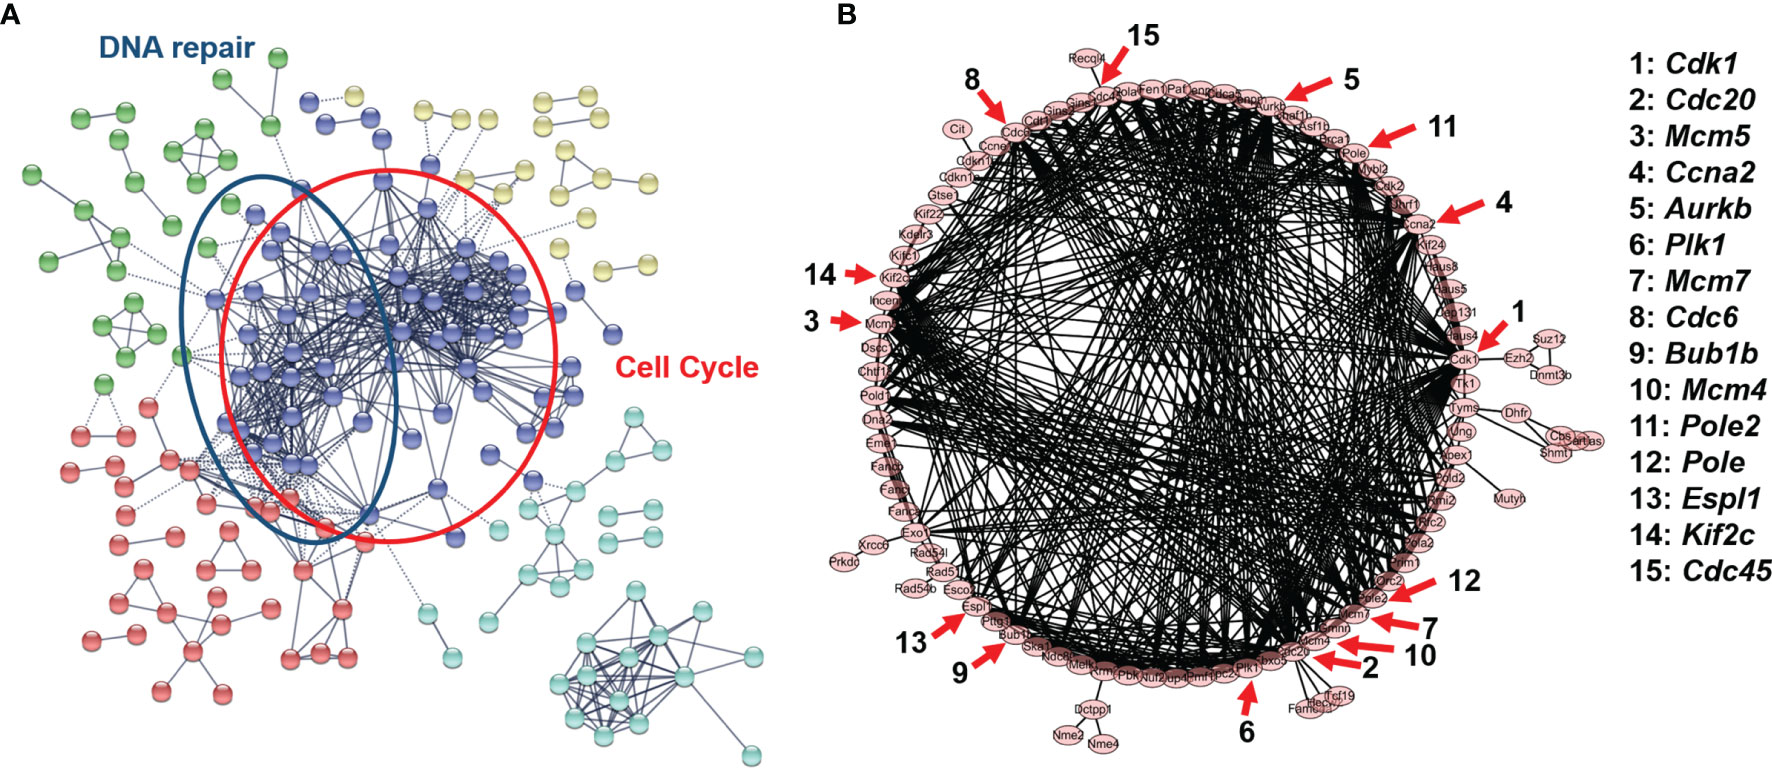
Figure 3 (A) Protein-protein interaction network of B.END3 cells with PDT intervention (p-adj<0.05 and |log2FoldChange|>1.0). (B) Sub-network of cell cycle-related genes and 15-top genes.
For cellular mitosis process-related hub genes, these genes can be attributed to E2F targeted genes and cell cycle pathways. To our knowledge, PDT can up-regulated intracellular ROS levels and induced oxidative stress to further regulate down-stream pathways (36). Higher levels of ROS can activate canonical MAPK pathway, and further regulate E2F-mediated gene transcription by p38/COX2/TGFβ/Rb pathway (37). Enrichment results implied that PDT process may participate into regulation of E2F-mediated gene transcription and further regulate expression of down-stream genes. For these genes, CDK1 is significantly up-regulated after the H2O2-induced oxidative stress by inactivating the PI3K/AKT signaling (38); CCNA2, CDC45, and MCM4 are downstream genes of cyclin-dependent kinase inhibitor p16 in D-galactose-induced aging in mice (39); BUB1B is involved in cell division and induces the vulnerability for oxidative stress (40); PLK1, as the serine/threonine-protein kinase gene, also plays a major role in chromosomal instability (41) and cell cycle progression (42). These hub genes indicated that low-dose PDT intervention induces may participate into regulation of cell cycle-related pathways.
Before further functional analysis, we explored the transcription factors of the DEGs using TRRUST database. As shown in Figure 4A, the top 3 transcription factors of these DEGs are E2F1, TP53, and SP1. By overlapping gene sets based on transcription factors, we can find that several genes are identified as shown in Figure 4B. TP53 is one of the critical transcription factors to regulate the expression of ATP binding cassette (ABC) transporter-related genes and further modulate cerebrovascular functions (43). To corroborate the effect of PDT on p53 activity, an immunostaining assay was performed in B.END3 cell line after PDT. As shown in Figure 4C, fluorescent staining shows that ROS can significantly promote the nuclear translocation of p53 protein to the nucleus, implying that TP53 plays an essential role in affecting the gene expression of DEGs.
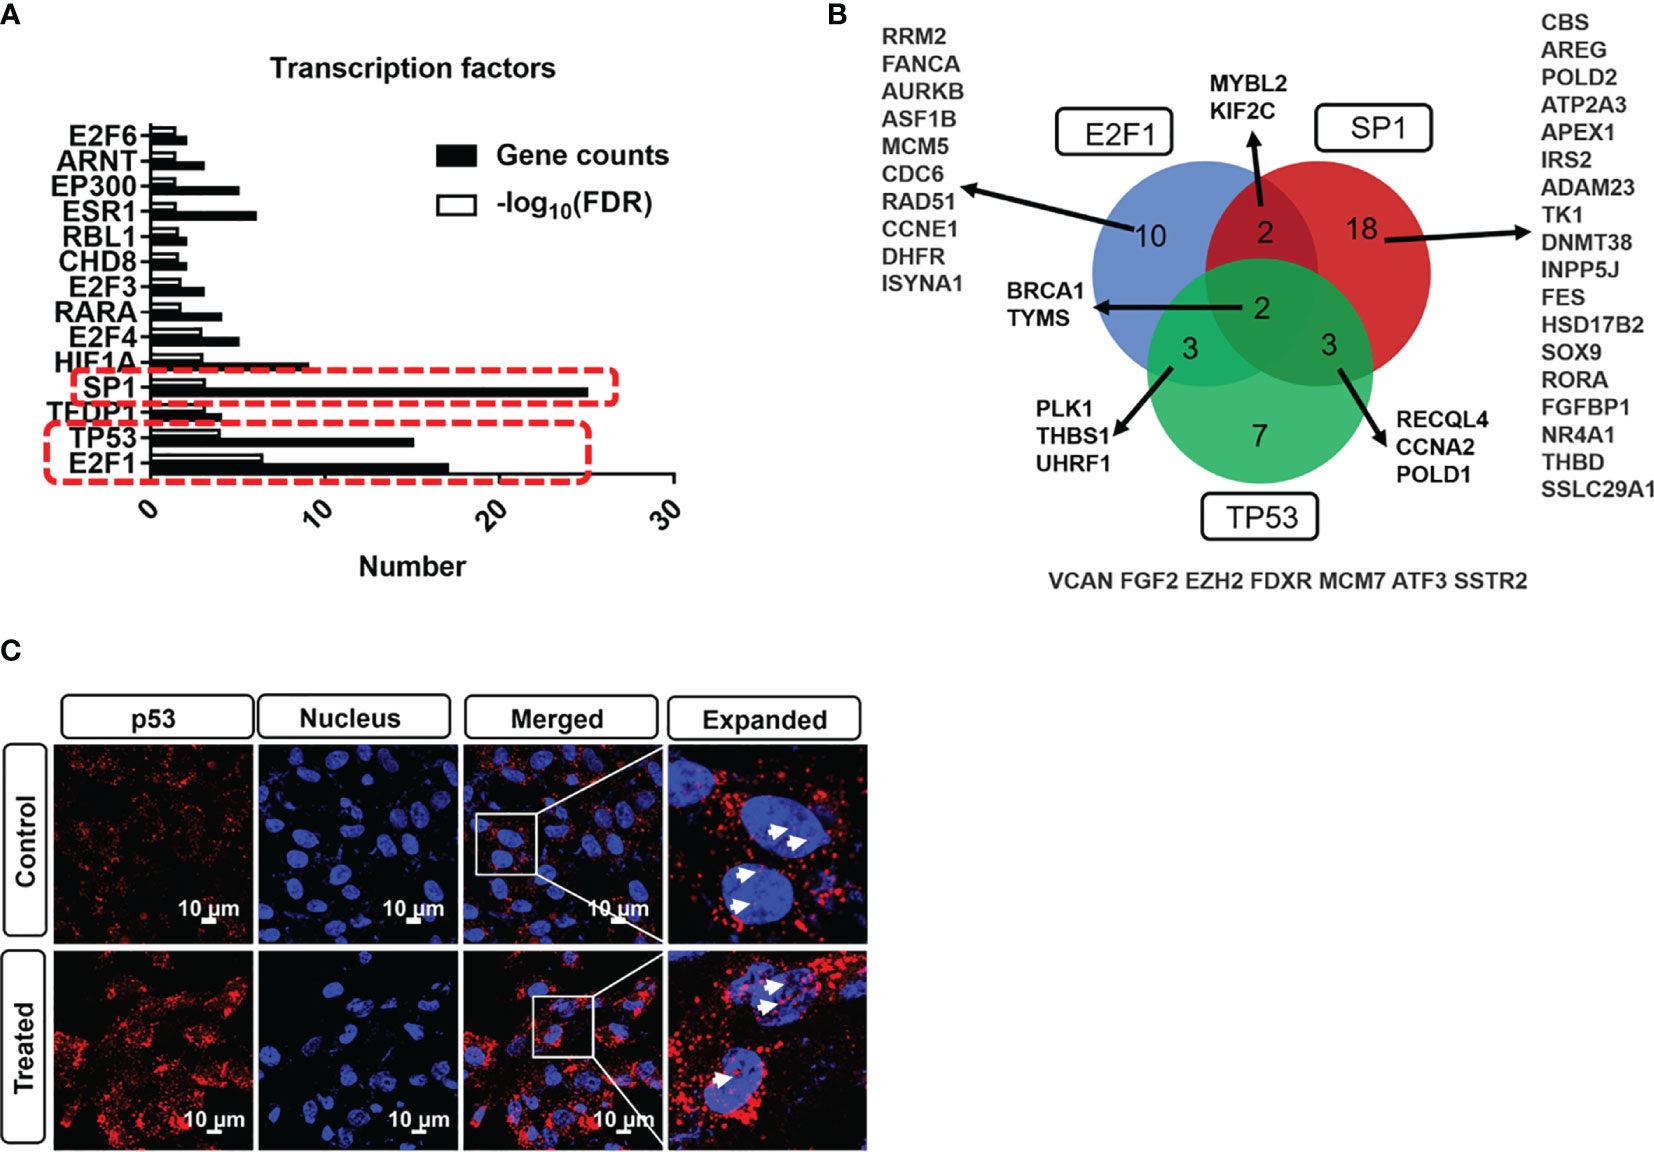
Figure 4 (A) Transcription factor profile of DEGs with photodynamic intervention (dose 20 J/cm2) using TRRUST database. (B) DEGs overlap among E2F1, SP1, and TP53 transcription factors. (C) Immunostaining of p53 nuclear translation after photodynamic intervention (20 J/cm2). Scale bar is 10 μm.
To explore the effect of PDT on biological processes, gene ontology (GO) analysis of DEGs was employed. GO analysis of DEGs can provide the scope of molecular mechanism affected by external stimulus, especially for identifying specific pathway to explain how to affect molecular network. Among these GO analysis tools, GO:profiler is a robust tool for functional enrichment analysis using DEGs (44). Herein, we employed go:profiler for GO analysis and obtained the most affected annotations of DEGs in various groups.
For DEGs in Ep1 group compared to control group, the top 15 enriched annotations are listed in Figure S1, wherein the cutoff of FDR q-value was set as 0.05. Among these annotations, cellular response-related, endogenous stimulus-related, and vasculature development-related annotations (labeled by red square) are highlighted. These annotations could be attributed to the chemical stimulus, which might originate from ROS stimulus by photodynamic photosensitizer. Among these annotations, oxidative stress might be the major pathway for PDT response due to higher levels of intracellular ROS. To the best of our knowledge, oxidative stress is highly related to vascular diseases (45); for example, participating in nitric oxide pathway in atherosclerosis pathogenesis (46) and inducing inflammation in aging (47). These enriched annotations confirmed the potential damage of PDT intervention on the vessels.
When the laser dosage of PDT intervention was increased to 20 J/cm2, number of differentially expressed genes were increased to 2976, and these genes could be divided into up- and down-regulated groups (Figures 5A, B), which would be utilized for further GO analysis. For up-regulated DEGs, the 15 top enriched GO annotations were annotated in Figure 5A, and many annotations about cellular biological functions were enriched. For example, actin cytoskeleton and cell migration-related annotations (i.e., positive regulation of cell migration, cell motility, and location). The migration or motility-related annotations are highly associated with cell skeleton that is regulated by assembly and disassembly of actin filaments (48). These enriched annotations are consistent with the immunostaining data (Figure 1C). Moreover, high migration of endothelial cells promotes angiogenesis in tumor tissue (49, 50) and participates in the vascularization process (51). These enriched annotations of up-regulated DEGs implied that PDT intervention might affect the biological functions of endothelial cell skeleton that need to be determined in the future.
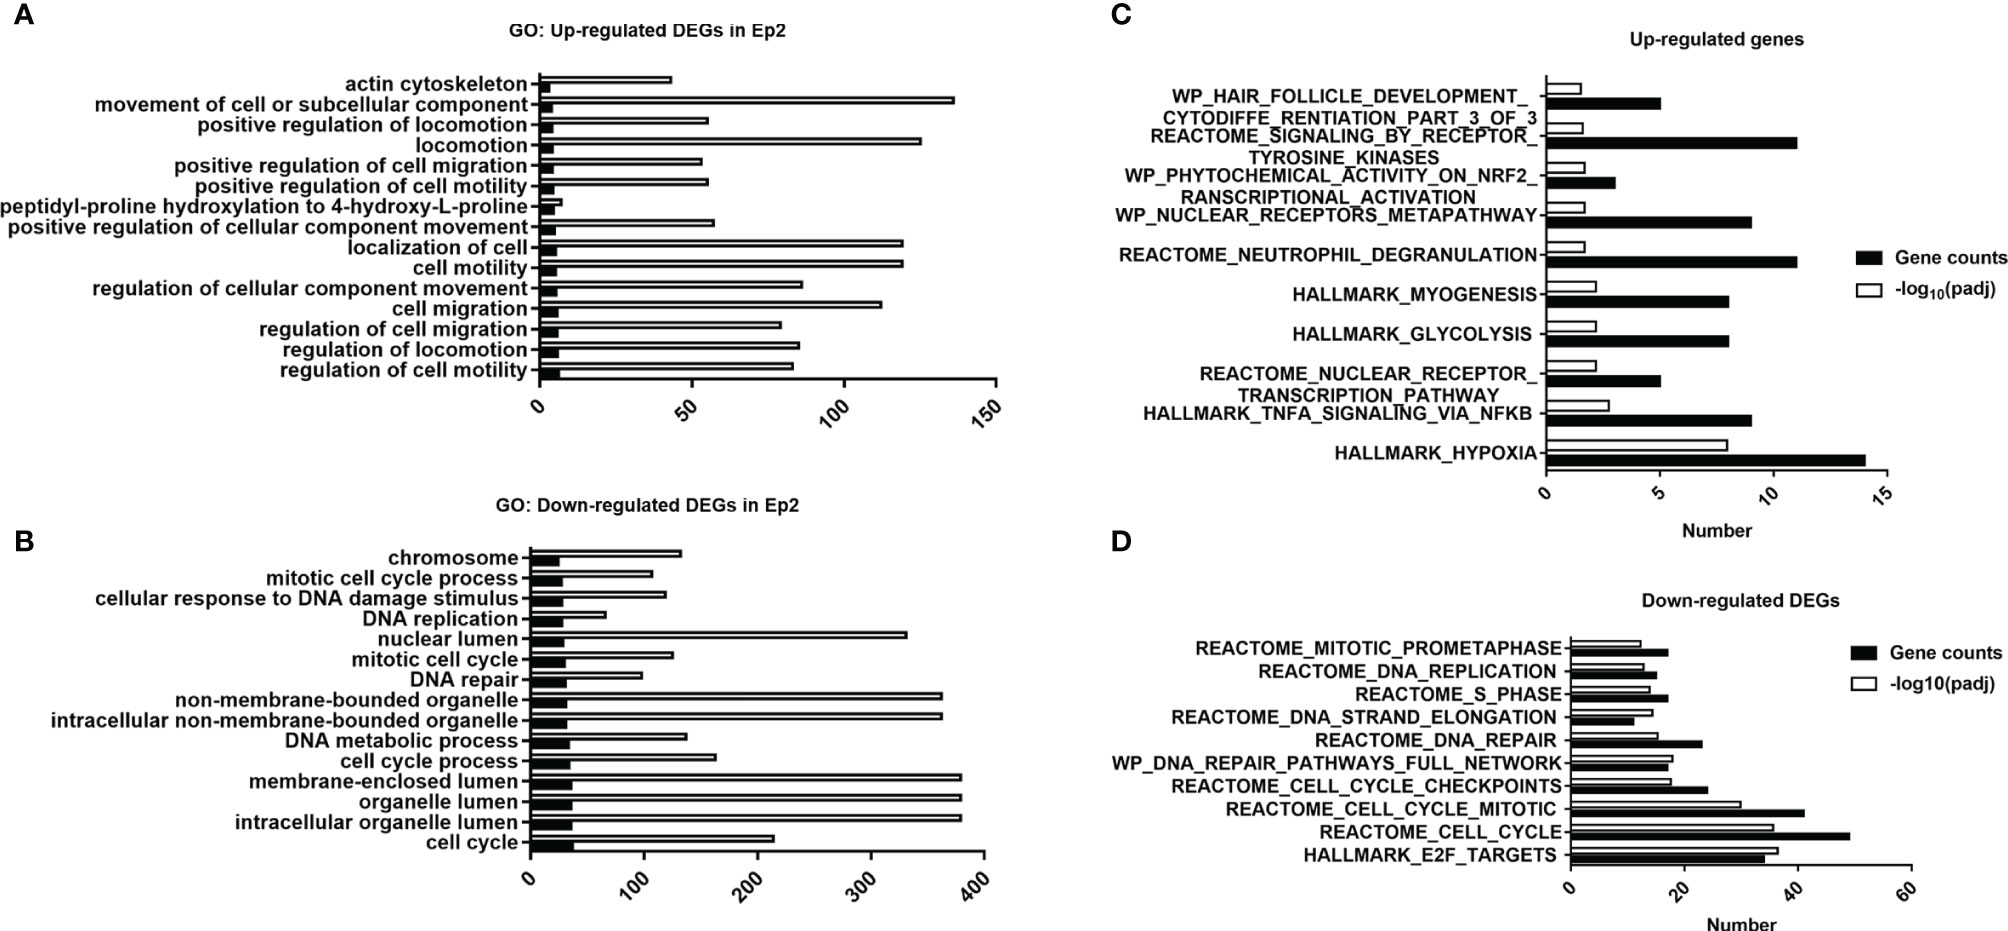
Figure 5 Functional analysis of DEGs in various groups. (A) Top 15 annotations of DEGs in the Ep1 group. (B) Top 15 annotations of up-regulated DEGs in the Ep2 group. (C) Top 15 annotations of down-regulated DEGs in the Ep2 group. (C) Computed overlaps between the up-regulated DEGs and MSigDB gene sets. (D) Computed overlaps between down-regulated DEGs and MSigDB gene sets. The threshold value considered as the significant difference is p < 0.05 and FDR q-value < 0.05.
For down-regulated DEGs, cell cycle-related annotations (for instance, mitotic cell cycle process, DNA replication, and DNA repair) can be obtained as shown in Figure 5B. The down-regulation of these biological pathways indicated that the cell cycle of endothelial cells may be suppressed and cause damage to cellular mitosis process. Moreover, the enrichment of chromosome, DNA repair, and DNA metabolic process confirmed that the PDT process damaged the DNA. The suppression of organelle-related annotations (non-membrane-bounded organelle, lumen-related annotations) indicated that PDT might damage nucleoplasm. However, we did not observe any significant impact of PDT on cell apoptosis (Figure 1A). All the enriched GO terms are related to the translation process and cell cycle. As reported previously, photodynamic therapy induces cellular autophagy to prevent cellular apoptosis (23). These findings implied that PDT might activate cellular autophagy against the exogenous stimulus.
GO and PPI analysis of DEGs could predict the potential impact on the cellular biological processes. However, it is difficult to identify the attribution of PDT to specific pathways. Conversely, GSEA, which ranked all genes based on the expression level, can be employed to evaluate roles of DEGs on targeted pathways (52). Herein, we employed GSEA to identify critical pathways affected by PDT, including Hallmark, KEGG, Wikipathways, and PID pathway gene sets.
Before the GSEA scoring analysis, we firstly analyzed the overlaps between DEGs and pathway gene sets, which can be divided into up- and down-regulated DEGs, and top 10 ranked pathways are listed in Figures 5C, D. For up-regulated DEGs, the top 10 ranked pathways were Hallmark_hypoxia, Hallmark_TNFA_signaling_via_NFKB, Reactome_nuclear_receptor_trascritpion_pathway, Hallmark_glycolysis, Hallmark_myogenesis, Reactome_neutrophil_degranulation, WP_nuclear_receptor_metapathway, WP_phyochemical_activity_on_nrf2_transcription_activation, Reactome_signaling_by_receptor_tyrosine_kinases, and WP_hair_follicle_development_cytodiffe_rentiation_part_3_of_3. For down-regulated DEGs, top 10 ranked pathways were Hall_E2F_targets, Reactme_cell_cycle, Reactome_cll_cycle_mitotic, Reactome_cell_cycle_checkpoints, WP_DNA_repair_pathways_full_network, Reactome_DNA_repair, Reactome_DNA_strand_elongation, Reactome_S_phase, Reactome_DNA_replication and Reactome_mitotic_prometaphase. These results suggested that major pathways affected by PDT may focus on inflammation response and cell cycle regulation, which is consistent with GO analysis.
To address the status of critical pathways after PDT treatment, GSEA plots were performed using Hallmark, KEGG, Wikipathways, and PID pathway gene sets (Normalized enriched score, |NES|>1.0 and NOM p-value < 0.05 and FDR q-value <0.05). However, we did not obtain any GSEA terms in Ep1 group compared to control group. Subsequently, only GSEA results of Ep2 group compared to control group were analyzed. As shown in Figure 6, only 8 pathways are significantly up-regulated (NES>1.0): coagulation, complement, UV response, inflammatory response, protein secretion, hypoxia, KRAS, and TNFA signaling via NFKB. The activation of KRAS signaling in endothelial cells induces ERK activity and promotes the expression of angiogenesis and notch signaling, which enhances the cell migration (53). Coagulation term means regulation of the blood coagulation system, which is also related to platelets (54). Hypoxia is always up-regulated and under low oxygen conditions. Complement, inflammatory response, and TNFA signaling via NF-κB is the major immunological response for the exogenous stimulus that is related to the vasculature disease (55). As above-mentioned assays, expression levels of several transporter-related genes were significantly down-regulated, except ABCC4. As previous reported, inflammation response can suppress the expression of ABC-related transporters through affecting Toll-like receptors (56). Moreover, inflammation-related stimulus can promote the expression of MRP4 (ABCC4) through ROS/NF-κB pathway (57). Moreover, NES value of 48 GSEA terms was less than -1.0, which implied the down-regulation of these pathways, and these annotations were highly associated with cell cycle process. As previous reported, ROS can regulate cell cycle by p38/ERK MAPK (58) or Cdc25C activity (59). As a result, these results indicated that PDT intervention can affect BBB function through inflammatory response, i.e. TNFA signaling via NF-κB.
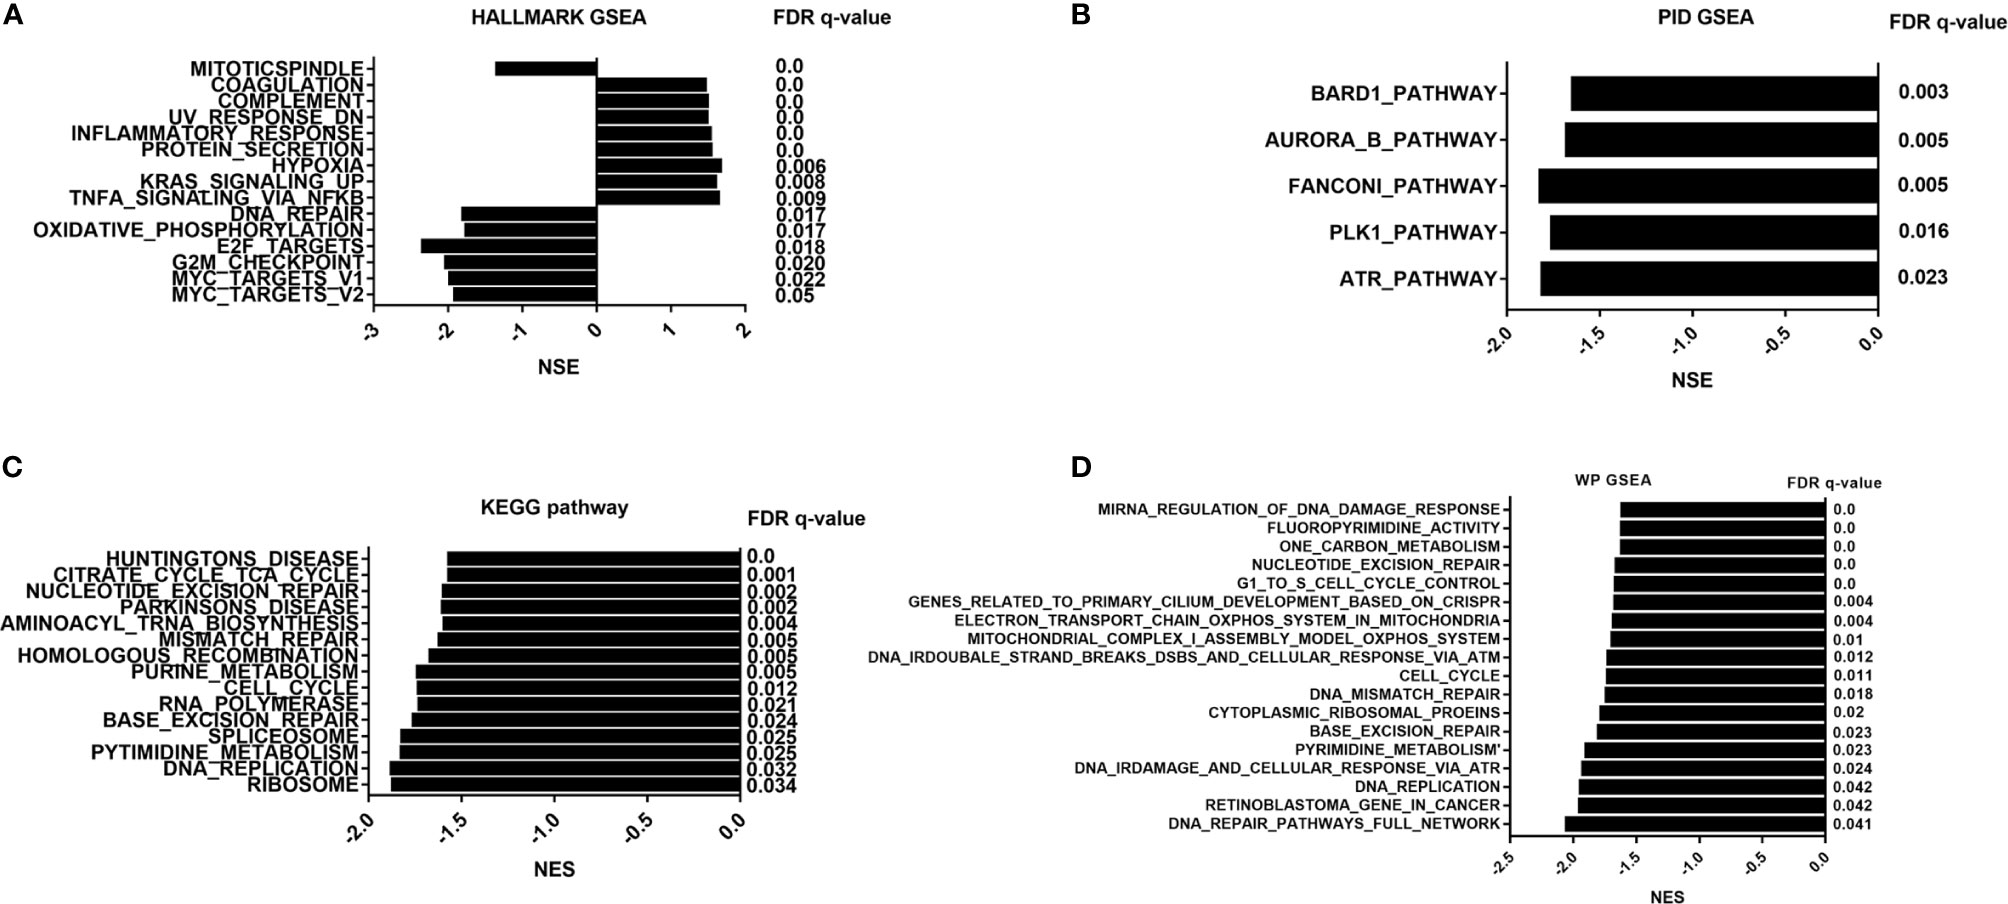
Figure 6 GSEA pathway analysis of B.END3 cells treated with PDT intervention. (A) Hallmark gene set analysis; (B) PID pathway gene set analysis; (C) KEGG pathway gene set analysis; (D) WikiPathways gene set analysis. The threshold value considered as the significant difference is P < 0.05, FDR q-value < 0.05, and |NES|>1.0.
To further determine whether PDT treatment can up-regulate TNFA signaling via NF-κB and KRAS pathways, we utilized qRT-PCR to examine expression levels of critical genes in these pathways. Firstly, we identified the critical genes by overlapping DEGs and pathway gene sets, i.e. TNF-α signaling via NF-κB and KRAS signaling pathways (Figures 7A–H), and these critical genes included NR4A1, NR4A2, NR4A3, F2RL1, FOSB, IRS2, AREG, ATF3, GFPT2, ACE, SOX9, and IL33. The qRT-PCR assays confirmed the up-regulation of NR4A1, NR4A2, NR4A3, IRS2, AREG, GFPT2, ACE, SOX9, and IL33, respectively. These results demonstrated that TNF-α/NF-κB and KRAS pathways were substantially up-regulated after PDT intervention.
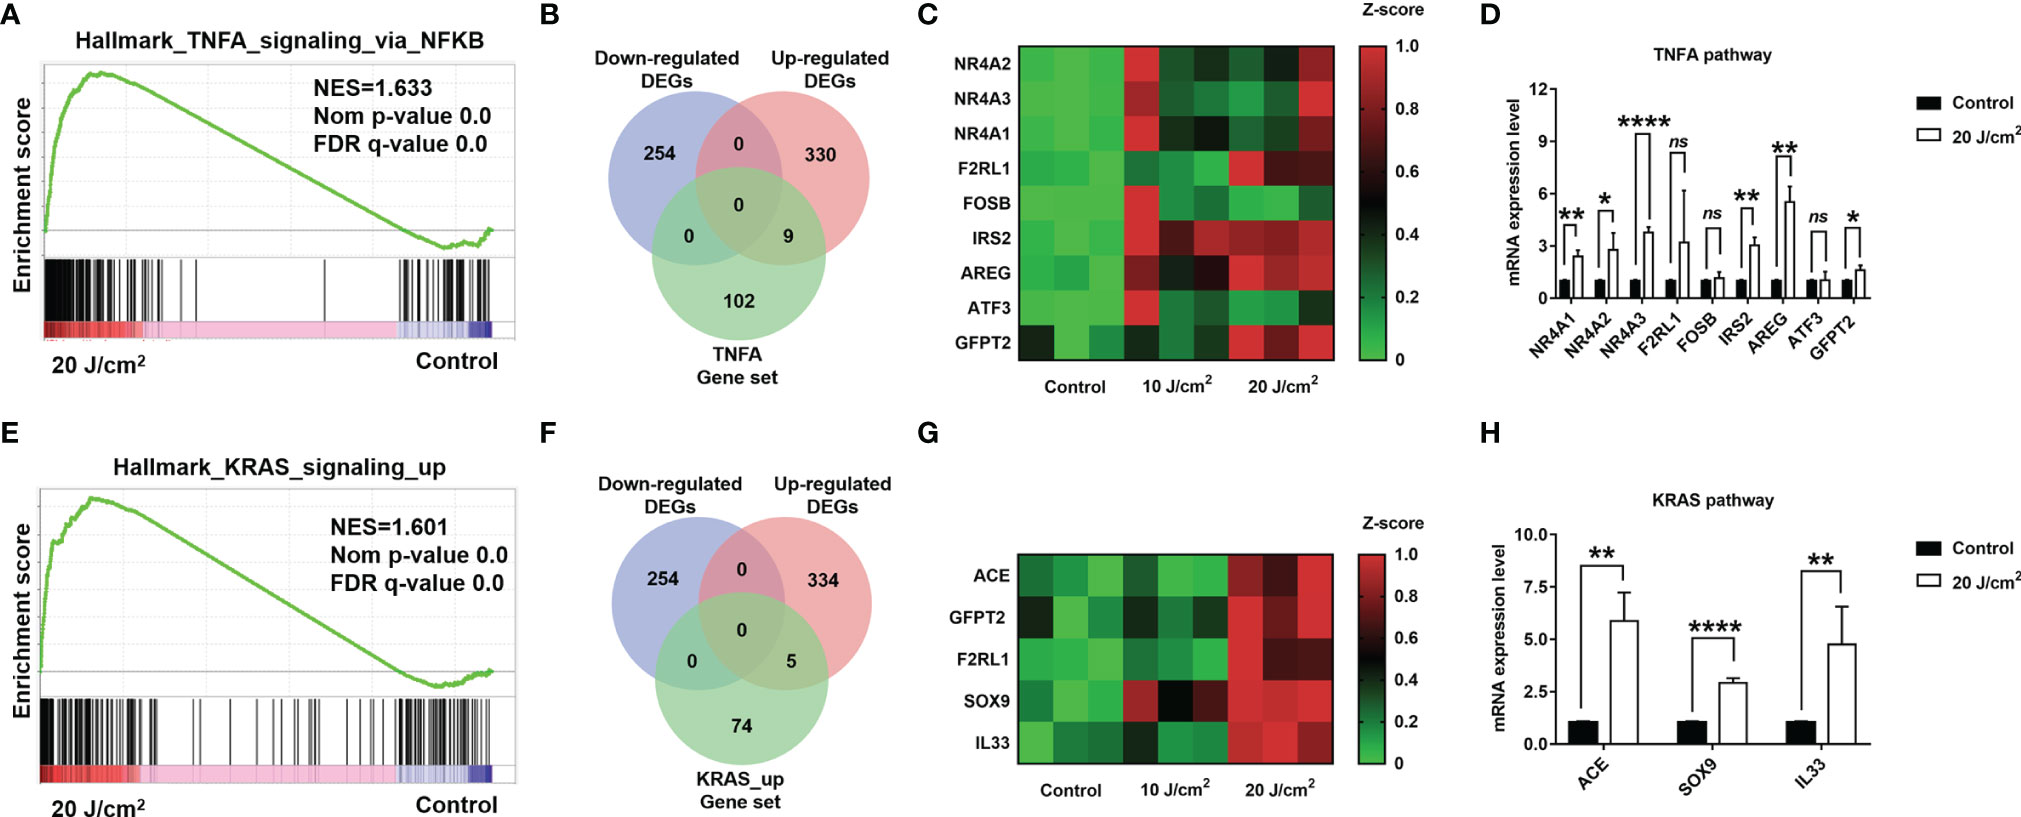
Figure 7 (A) Enrichment score profile of enriched pathway, TNFA_signaling_via_NFKB. (B) Venn diagram of overlapped genes among DEGs and leading edge gene set. (C) Heatmap of overlapped gene expression level. (D) Quantification for mRNA levels of DEGs in TNF-α/NF-κB pathway (dose 20 J/cm2). (E) Enrichment score profile of enriched pathway, KRAS_signaling_up. (F) Venn diagram of overlapped genes among DEGs and leading-edge gene set. (G) Heatmap of overlapped gene expression level. (H) Quantification for mRNA levels of DEGs in KRAS_signaling_up pathway (dose 20 J/cm2). *p<0.05; **p<0.01; ****p<0.0001; ns, no significance.
In summary, we built one approach of RNA sequencing to well-understand the effect of photodynamic intervention in cerebrovascular endothelial cells at cellular transcriptome level. These results provide essential information to elucidate the stimulus response of endothelial cells receiving PDT intervention, which might be associated with affecting the expression of BBB endothelial transporters by activating inflammatory response pathways and cell cycle-related pathways. This stimulus response is crucial for the normal cerebrovascular endothelial cells and to maintain BBB homeostasis. Thus, we speculated that the current study could guide the clinical application of PDT in nervous system diseases and further decrease the drawback of PDT intervention on nervous functions.
The datasets presented in this study can be found in online repositories. The names of the repository/repositories and accession number(s) can be found below: https://www.ncbi.nlm.nih.gov/, GSE172198.
YKH and TXL: Conceptualization, Methodology, Funding acquisition, Supervision. YYH: Investigation, Conceptualization, Methodology, Funding acquisition, Writing – original draft preparation, Resources. LD and HW: Investigation, Writing – original draft preparation, Writing – review & editing. SC and TYL: Methodology, Writing – review & editing, Resources.
This study was supported by funding from Henan Province Excellent Young Talents Training Project (YXKC2020041) and the Key Scientific And Technological Project of Henan Province (202102310037).
The authors declare that the research was conducted in the absence of any commercial or financial relationships that could be construed as a potential conflict of interest.
All claims expressed in this article are solely those of the authors and do not necessarily represent those of their affiliated organizations, or those of the publisher, the editors and the reviewers. Any product that may be evaluated in this article, or claim that may be made by its manufacturer, is not guaranteed or endorsed by the publisher.
The Supplementary Material for this article can be found online at: https://www.frontiersin.org/articles/10.3389/fonc.2021.731414/full#supplementary-material
2. Obermeier B, Daneman R, Ransohoff RM. Development, Maintenance and Disruption of the Blood-Brain Barrier. Nat Med (2013) 19(12):1584–96. doi: 10.1038/nm.3407
3. Kaplan L, Chow BW, Gu C. Neuronal Regulation of the Blood-Brain Barrier and Neurovascular Coupling. Nat Rev Neurosci (2020) 21(8):416–32. doi: 10.1038/s41583-020-0322-2
4. Arvanitis CD, Ferraro GB, Jain RK. The Blood-Brain Barrier and Blood-Tumour Barrier in Brain Tumours and Metastases. Nat Rev Cancer (2020) 20(1):26–41. doi: 10.1038/s41568-019-0205-x
5. Profaci CP, Munji RN, Pulido RS, Daneman R. The Blood-Brain Barrier in Health and Disease: Important Unanswered Questions. J Exp Med (2020) 217(4):e20190062. doi: 10.1084/jem.20190062
6. Daneman R. The Blood-Brain Barrier in Health and Disease. Ann Neurol (2012) 72(5):648–72. doi: 10.1002/ana.23648
7. Knowland D, Arac A, Sekiguchi KJ, Hsu M, Lutz SE, Perrino J, et al. Stepwise Recruitment of Transcellular and Paracellular Pathways Underlies Blood-Brain Barrier Breakdown in Stroke. Neuron (2014) 82(3):603–17. doi: 10.1016/j.neuron.2014.03.003
8. Pollak TA, Drndarski S, Stone JM, David AS, McGuire P, Abbott NJ. The Blood-Brain Barrier in Psychosis. Lancet Psychiatry (2018) 5(1):79–92. doi: 10.1016/S2215-0366(17)30293-6
9. Bao S, Wu Q, Sathornsumetee S, Hao Y, Li Z, Hjelmeland AB, et al. Stem Cell-Like Glioma Cells Promote Tumor Angiogenesis Through Vascular Endothelial Growth Factor. Cancer Res (2006) 66(16):7843–8. doi: 10.1158/0008-5472.CAN-06-1010
10. Gilbertson RJ, Rich JN. Making a Tumour’s Bed: Glioblastoma Stem Cells and the Vascular Niche. Nat Rev Cancer (2007) 7(10):733–6. doi: 10.1038/nrc2246
11. Ricci-Vitiani L, Pallini R, Biffoni M, Todaro M, Invernici G, Cenci T, et al. Tumour Vascularization via Endothelial Differentiation of Glioblastoma Stem-Like Cells. Nature (2010) 468(7325):824–8. doi: 10.1038/nature09557
12. Cramer SW, Chen CC. Photodynamic Therapy for the Treatment of Glioblastoma. Front Surg (2019) 6:81. doi: 10.3389/fsurg.2019.00081
13. Kessel D. Photodynamic Therapy: A Brief History. J Clin Med (2019) 8(10):1581. doi: 10.3390/jcm8101581
14. Chilakamarthi U, Giribabu L. Photodynamic Therapy: Past, Present and Future. Chem Rec (2017) 17(8):775–802. doi: 10.1002/tcr.201600121
15. Nitta M, Muragaki Y, Maruyama T, Iseki H, Komori T, Ikuta S, et al. Role of Photodynamic Therapy Using Talaporfin Sodium and a Semiconductor Laser in Patients With Newly Diagnosed Glioblastoma. J Neurosurg (2018) 131(5):1–8. doi: 10.3171/2018.7.JNS18422
16. Hirschberg H, Uzal FA, Chighvinadze D, Zhang MJ, Peng Q, Madsen SJ. Disruption of the Blood-Brain Barrier Following ALA-Mediated Photodynamic Therapy. Lasers Surg Med (2008) 40(8):535–42. doi: 10.1002/lsm.20670
17. Weijer R, Clavier S, Zaal EA, Pijls MM, van Kooten RT, Vermaas K, et al. Multi-OMIC Profiling of Survival and Metabolic Signaling Networks in Cells Subjected to Photodynamic Therapy. Cell Mol Life Sci (2017) 74(6):1133–51. doi: 10.1007/s00018-016-2401-0
18. Wang X, Guo Y, Yang S, Wang C, Fu X, Wang J, et al. Cellular and Molecular Mechanisms of Photodynamic Hypericin Therapy for Nasopharyngeal Carcinoma Cells. J Pharmacol Exp Ther (2010) 334(3):847–53. doi: 10.1124/jpet.110.168856
19. Collaud S, Juzeniene A, Moan J, Lange N. On the Selectivity of 5-Aminolevulinic Acid-Induced Protoporphyrin IX Formation. Curr Med Chem Anticancer Agents (2004) 4(3):301–16. doi: 10.2174/1568011043352984
20. Ma W, Wang T, Zang L, Jiang Z, Zhang Z, Bi L, et al. Bactericidal Effects of Hematoporphyrin Monomethyl Ether-Mediated Blue-Light Photodynamic Therapy Against Staphylococcus Aureus. Photochemical Photobiological Sci (2019) 18(1):92–7. doi: 10.1039/C8PP00127H
21. Hosokawa S, Takahashi G, Sugiyama KI, Takebayashi S, Okamura J, Takizawa Y, et al. Porfimer Sodium-Mediated Photodynamic Therapy in Patients With Head and Neck Squamous Cell Carcinoma. Photodiagnosis photodynamic Ther (2020) 29:101627. doi: 10.1016/j.pdpdt.2019.101627
22. Benayoun L, Schaffer M, Bril R, Gingis-Velitski S, Segal E, Nevelsky A, et al. Porfimer-Sodium (Photofrin-II) in Combination With Ionizing Radiation Inhibits Tumor-Initiating Cell Proliferation and Improves Glioblastoma Treatment Efficacy. Cancer Biol Ther (2013) 14(1):64–74. doi: 10.4161/cbt.22630
23. Xue J, Gruber F, Tschachler E, Zhao Y. Crosstalk Between Oxidative Stress, Autophagy and Apoptosis in Hemoporfin Photodynamic Therapy Treated Human Umbilical Vein Endothelial Cells. Photodiagnosis Photodynamic Ther (2021) 33:102137. doi: 10.1016/j.pdpdt.2020.102137
24. Chen Q, Li KT, Tian S, Yu TH, Yu LH, Lin HD, et al. Photodynamic Therapy Mediated by Aloe-Emodin Inhibited Angiogenesis and Cell Metastasis Through Activating MAPK Signaling Pathway on HUVECs. Technol Cancer Res Treat (2018) 17:1533033818785512. doi: 10.1177/1533033818785512
25. Schmidt-Erfurth U, Schlötzer-Schrehard U, Cursiefen C, Michels S, Beckendorf A, Naumann GO. Influence of Photodynamic Therapy on Expression of Vascular Endothelial Growth Factor (VEGF), VEGF Receptor 3, and Pigment Epithelium-Derived Factor. Invest Ophthalmol Visual Sci (2003) 44(10):4473–80. doi: 10.1167/iovs.02-1115
26. Zhang X, Jiang F, Zhang ZG, Kalkanis SN, Hong X, deCarvalho AC, et al. Low-Dose Photodynamic Therapy Increases Endothelial Cell Proliferation and VEGF Expression in Nude Mice Brain. Lasers Med Sci (2005) 20(2):74–9. doi: 10.1007/s10103-005-0348-8
27. Leszczynska KB, Foskolou IP, Abraham AG, Anbalagan S, Tellier C, Haider S, et al. Hypoxia-Induced P53 Modulates Both Apoptosis and Radiosensitivity via AKT. J Clin Invest (2015) 125(6):2385–98. doi: 10.1172/JCI80402
28. Guo S, Li K, Hu B, Li C, Zhang M, Hussain A, et al. In Membrane-Destabilizing Ionizable Lipid Empowered Imaging-Guided siRNA Delivery and Cancer Treatment. In: Exploration. Shanghai: Wiley Online Library (2021). p. 35–49.
29. Kwiatkowski S, Knap B, Przystupski D, Saczko J, Kędzierska E, Knap-Czop K, et al. Photodynamic Therapy - Mechanisms, Photosensitizers and Combinations. Biomed Pharmacotherapy = Biomed Pharmacotherapie (2018) 106:1098–107. doi: 10.1016/j.biopha.2018.07.049
30. Unsain N, Bordenave MD, Martinez GF, Jalil S, von Bilderling C, Barabas FM, et al. Remodeling of the Actin/Spectrin Membrane-Associated Periodic Skeleton, Growth Cone Collapse and F-Actin Decrease During Axonal Degeneration. Sci Rep (2018) 8(1):3007. doi: 10.1038/s41598-018-21232-0
31. Yang J, Wang L, Huang L, Che X, Zhang Z, Wang C, et al. In Receptor-Targeting Nanomaterials Alleviate Binge Drinking-Induced Neurodegeneration as Artificial Neurotrophins. In: Exploration. Beijing: Wiley Online Library (2021). p. 61–74.
32. Keaney J, Campbell M. The Dynamic Blood-Brain Barrier. FEBS J (2015) 282(21):4067–79. doi: 10.1111/febs.13412
33. Kramer AC, Steinhauser CB, Gao H, Seo H, McLendon BA, Burghardt RC, et al. Steroids Regulate SLC2A1 and SLC2A3 to Deliver Glucose Into Trophectoderm for Metabolism via Glycolysis. Endocrinology (2020) 161(8):1–19. doi: 10.1210/endocr/bqaa098
34. Kleta R, Morse RP, Orvisky E, Krasnewich D, Alroy J, Ucci AA, et al. Clinical, Biochemical, and Molecular Diagnosis of a Free Sialic Acid Storage Disease Patient of Moderate Severity. Mol Genet Metab (2004) 82(2):137–43. doi: 10.1016/j.ymgme.2004.03.001
35. Choi YH, Yu AM. ABC Transporters in Multidrug Resistance and Pharmacokinetics, and Strategies for Drug Development. Curr Pharm Des (2014) 20(5):793–807. doi: 10.2174/138161282005140214165212
36. Ray PD, Huang B-W, Tsuji Y. Reactive Oxygen Species (ROS) Homeostasis and Redox Regulation in Cellular Signaling. Cell Signal (2012) 24(5):981–90. doi: 10.1016/j.cellsig.2012.01.008
37. Macleod KF. The Role of the RB Tumour Suppressor Pathway in Oxidative Stress Responses in the Haematopoietic System. Nat Rev Cancer (2008) 8(10):769–81. doi: 10.1038/nrc2504
38. Sun W, Zhu J, Li S, Tang C, Zhao Q, Zhang J. Selenium Supplementation Protects Against Oxidative Stress-Induced Cardiomyocyte Cell Cycle Arrest Through Activation of PI3K/AKT. Metallomics: Integrated Biometal Sci (2020) 12(12):1965–78. doi: 10.1039/D0MT00225A
39. Min F, Sun H, Wang B, Ahmad N, Guo H, Gao H, et al. Hepatoprotective Effects of Hydroxysafflor Yellow A in D-Galactose-Treated Aging Mice. Eur J Pharmacol (2020) 881:173214. doi: 10.1016/j.ejphar.2020.173214
40. Chen Q, Ke H, Luo X, Wang L, Wu Y, Tang S, et al. Rare Deleterious BUB1B Variants Induce Premature Ovarian Insufficiency and Early Menopause. Hum Mol Genet (2020) 29(16):2698–707. doi: 10.1093/hmg/ddaa153
41. Cunningham CE, MacAuley MJ, Vizeacoumar FS, Abuhussein O, Freywald A, Vizeacoumar FJ. The CINs of Polo-Like Kinase 1 in Cancer. Cancers (2020) 12(10):2953. doi: 10.3390/cancers12102953
42. Gutteridge RE, Ndiaye MA, Liu X, Ahmad N. Plk1 Inhibitors in Cancer Therapy: From Laboratory to Clinics. Mol Cancer Ther (2016) 15(7):1427–35. doi: 10.1158/1535-7163.MCT-15-0897
43. Miller DS. Regulation of ABC Transporters at the Blood–Brain Barrier. Clin Pharmacol Ther (2015) 97(4):395–403. doi: 10.1002/cpt.64
44. Raudvere U, Kolberg L, Kuzmin I, Arak T, Adler P, Peterson H, et al. G:Profiler: A Web Server for Functional Enrichment Analysis and Conversions of Gene Lists (2019 Update). Nucleic Acids Res (2019) 47(1):191–8. doi: 10.1093/nar/gkz369
45. Siti HN, Kamisah Y, Kamsiah J. The Role of Oxidative Stress, Antioxidants and Vascular Inflammation in Cardiovascular Disease (a Review). Vasc Pharmacol (2015) 71:40–56. doi: 10.1016/j.vph.2015.03.005
46. Förstermann U, Xia N, Li H. Roles of Vascular Oxidative Stress and Nitric Oxide in the Pathogenesis of Atherosclerosis. Circ Res (2017) 120(4):713–35. doi: 10.1161/CIRCRESAHA.116.309326
47. El Assar M, Angulo J, Rodríguez-Mañas L. Oxidative Stress and Vascular Inflammation in Aging. Free Radical Biol Med (2013) 65:380–401. doi: 10.1016/j.freeradbiomed.2013.07.003
48. Pollard TD, Borisy GG. Cellular Motility Driven by Assembly and Disassembly of Actin Filaments. Cell (2003) 112(4):453–65. doi: 10.1016/S0092-8674(03)00120-X
49. Szabo A, Mehes E, Kosa E, Czirok A. Multicellular Sprouting In Vitro. Biophys J (2008) 95(6):2702–10. doi: 10.1529/biophysj.108.129668
50. Szabó A, Unnep R, Méhes E, Twal WO, Argraves WS, Cao Y, et al. Collective Cell Motion in Endothelial Monolayers. Phys Biol (2010) 7(4):46007. doi: 10.1088/1478-3975/7/4/046007
51. Folkman J. The Role of Angiogenesis in Tumor Growth. Semin Cancer Biol (1992) 3(2):65–71. doi: 10.1053/sonc.2002.37263
52. Subramanian A, Tamayo P, Mootha VK, Mukherjee S, Ebert BL, Gillette MA, et al. Gene Set Enrichment Analysis: A Knowledge-Based Approach for Interpreting Genome-Wide Expression Profiles. Proc Natl Acad Sci USA (2005) 102(43):15545–50. doi: 10.1073/pnas.0506580102
53. Nikolaev SI, Vetiska S, Bonilla X, Boudreau E, Jauhiainen S, Rezai Jahromi B, et al. Somatic Activating KRAS Mutations in Arteriovenous Malformations of the Brain. N Engl J Med (2018) 378(3):250–61. doi: 10.1056/NEJMoa1709449
54. Sang Y, Roest M, de Laat B, de Groot PG, Huskens D. Interplay Between Platelets and Coagulation. Blood Rev (2021) 46:100733. doi: 10.1016/j.blre.2020.100733
55. Agita A, Alsagaff MT. Inflammation, Immunity, and Hypertension. Acta Med Indonesiana (2017) 49(2):158–65.
56. Westerterp M, Bochem AE, Yvan-Charvet L, Murphy AJ, Wang N, Tall AR. ATP-Binding Cassette Transporters, Atherosclerosis, and Inflammation. Circ Res (2014) 114(1):157–70. doi: 10.1161/CIRCRESAHA.114.300738
57. Hartz AM, Bauer B, Block ML, Hong J-S, Miller DS. Diesel Exhaust Particles Induce Oxidative Stress, Proinflammatory Signaling, and P-Glycoprotein Up-Regulation at the Blood-Brain Barrier. FASEB J (2008) 22(8):2723–33. doi: 10.1096/fj.08-106997
58. Zhang G, He J, Ye X, Zhu J, Hu X, Shen M, et al. β-Thujaplicin Induces Autophagic Cell Death, Apoptosis, and Cell Cycle Arrest Through ROS-Mediated Akt and P38/ERK MAPK Signaling in Human Hepatocellular Carcinoma. Cell Death Dis (2019) 10(4):1–14. doi: 10.1038/s41419-019-1492-6
Keywords: photodynamic therapy, RNA seq, blood-brain barrier, gliomas, endothelial dysfunction
Citation: He Y, Duan L, Wu H, Chen S, Lu T, Li T and He Y (2021) Integrated Transcriptome Analysis Reveals the Impact of Photodynamic Therapy on Cerebrovascular Endothelial Cells. Front. Oncol. 11:731414. doi: 10.3389/fonc.2021.731414
Received: 27 June 2021; Accepted: 03 November 2021;
Published: 22 November 2021.
Edited by:
Ganesh Rao, University of Texas MD Anderson Cancer Center, United StatesCopyright © 2021 He, Duan, Wu, Chen, Lu, Li and He. This is an open-access article distributed under the terms of the Creative Commons Attribution License (CC BY). The use, distribution or reproduction in other forums is permitted, provided the original author(s) and the copyright owner(s) are credited and that the original publication in this journal is cited, in accordance with accepted academic practice. No use, distribution or reproduction is permitted which does not comply with these terms.
*Correspondence: Yingkun He, aGV5aW5na3VuQGhlbnUuZWR1LmNu; Tianxiao Li, bGl0aWFueGlhb0BoZW51LmVkdS5jbg==
Disclaimer: All claims expressed in this article are solely those of the authors and do not necessarily represent those of their affiliated organizations, or those of the publisher, the editors and the reviewers. Any product that may be evaluated in this article or claim that may be made by its manufacturer is not guaranteed or endorsed by the publisher.
Research integrity at Frontiers

Learn more about the work of our research integrity team to safeguard the quality of each article we publish.