 Kebing Huang1,2†
 Xiaoyu Yue1,2†
 Yinfei Zheng1,2Zhengwei Zhang1,2
 Meng Cheng1,2Lianxin Li1,2Zhigang Chen1,2Zhihao Yang1,2Erbao Bian1,2*
 Bing Zhao1,2*
- 1Department of Neurosurgery, The Second Affiliated Hospital of Anhui Medical University, Hefei, China
- 2Cerebral Vascular Disease Research Center, Anhui Medical University, Hefei, China
Glioma is well known as the most aggressive and prevalent primary malignant tumor in the central nervous system. Molecular subtypes and prognosis biomarkers remain a promising research area of gliomas. Notably, the aberrant expression of mesenchymal (MES) subtype related long non-coding RNAs (lncRNAs) is significantly associated with the prognosis of glioma patients. In this study, MES-related genes were obtained from The Cancer Genome Atlas (TCGA) and the Ivy Glioblastoma Atlas Project (Ivy GAP) data sets of glioma, and MES-related lncRNAs were acquired by performing co-expression analysis of these genes. Next, Cox regression analysis was used to establish a prognostic model, that integrated ten MES-related lncRNAs. Glioma patients in TCGA were divided into high-risk and low-risk groups based on the median risk score; compared with the low-risk groups, patients in the high-risk group had shorter survival times. Additionally, we measured the specificity and sensitivity of our model with the ROC curve. Univariate and multivariate Cox analyses showed that the prognostic model was an independent prognostic factor for glioma. To verify the predictive power of these candidate lncRNAs, the corresponding RNA-seq data were downloaded from the Chinese Glioma Genome Atlas (CGGA), and similar results were obtained. Next, we performed the immune cell infiltration profile of patients between two risk groups, and gene set enrichment analysis (GSEA) was performed to detect functional annotation. Finally, the protective factors DGCR10 and HAR1B, and risk factor SNHG18 were selected for functional verification. Knockdown of DGCR10 and HAR1B promoted, whereas knockdown of SNHG18 inhibited the migration and invasion of gliomas. Collectively, we successfully constructed a prognostic model based on a ten MES-related lncRNAs signature, which provides a novel target for predicting the prognosis for glioma patients.
Introduction
Glioma accounts for 40% of intracranial tumors, which is the most common primary malignant tumor in the central nervous system (CNS) (1). According to the World Health Organization (WHO) classification, gliomas are divided into four different grades (grades I~IV). Among them, WHO II and WHO III are classified as lower grade glioma (LGG) and WHO IV as glioblastoma (GBM), which is the most aggressive type of brain tumor; neo-angiogenesis and invasion are the hallmarks of GBM (2, 3). Despite the existence of surgery, supplemented by chemotherapy, radiotherapy, and other treatment methods, the median survival of GBM patients is approximately 15 months (4, 5), and the 5-year survival rate is below 10% (6, 7). Additionally, based on differences in gene expression, TCGA classifies GBMs into classical, mesenchymal, neural, and proneural subtypes (8). Notably, approximately 45% of GBM tissues have been classified as the mesenchymal subtype, which is particularly malignant as compared to the other subtypes. The mesenchymal subtype is dominated in the relapses of GBM, and it has been revealed that cells of this subtype may have a higher therapy resistance (9). The overexpression of mesenchymal subtype (MES) related genes is adequate to induce invasive behavior in tumors and result in poor prognosis in patients (10).
LncRNA is a type of RNA that is longer than 200 nucleotides and lacks protein-coding ability (11). However, they are identified as having multiple biological functions, including the regulation of transcription, splicing, and translation (12). The biological function and carcinogenic mechanism of lncRNAs have been widely explored. Increasing evidence suggests that abnormal lncRNA expression has important significance in tumorigenesis and aggressiveness. For example, lncRNA ROR1-AS1 promotes glioma progression by inhibiting miR-4686 (12). The expression level of NEAT1 significantly increases in glioma tissues and promoted cell migration and invasion by regulating the miR‐139‐5p/CDK6 pathway (13). MES-related lncRNA miR155HG binds to miR-185 to affect proliferation, cell cycle progression, and apoptosis in GBM cell lines (14). MES-related lncRNA FAM181A-AS1 promotes the growth and survival of glioma cells by enhancing ZRANB2 expression (15). The mesenchymal subtype is characterized by higher percentages of cycling cells and neo-angiogenesis, with a highly invasive nature and poor prognosis (16). Furthermore, biological function analysis revealed that immune checkpoint receptor target was highly enriched in mesenchymal subtype glioma and might be a potential marker of mesenchymal subtype (17, 18).
Although the WHO classification system has been used to predict the prognosis of glioma patients for many years, it is sometimes inaccurate considering the heterogeneity of the tumor. New advances in bioinformatics and genome sequencing technology have helped to predict the prognosis of cancer patients in addition to identifying potential biomarkers (18, 19). Studies have shown that the prognostic value of a single candidate lncRNA biomarker is limited, integrating multiple biomarkers into a single model would be much better (20). For example, based on the metastasis-associated competing endogenous RNA (ceRNA) network, three lncRNAs were confirmed to have the ability to predict colorectal cancer (CRC) prognosis (21). By mining the TCGA data, a four-lncRNA signature could effectively predict the survival time of lung adenocarcinoma (LUAD) (22). Recently, some lncRNA prognostic models have been constructed, and their ability to predict have been validated in glioma. For example, an immune-related lncRNA formula provides a powerful prognostic prediction ability for glioma patients; similarly, ten autophagy-related lncRNAs have prognostic potential for glioma (23, 24).
Therefore, we speculated that identification of MES-related lncRNAs act as prognostic models is of great significance for discovery of prognostic biomarkers, evaluating therapeutic effect and development of more accurate treatment processes. In this study, we first analyzed the MES-related mRNA expression profile data in the TCGA and Ivy GAY databases. Then, the corresponding lncRNAs were obtained through co-expression analysis, and differentially expressed lncRNAs were identified between LGG and GBM samples. Next, MES-related lncRNAs with prognostic value based on Cox analysis were screened. Ultimately, we identified that a ten-lncRNA signature acts as an independent predictive factor for prognosis prediction in glioma patients. Based on the median risk score, glioma patients in the TCGA and CGGA databases were divided into high- and low-risk groups, and the results of the immune cell infiltration profile and GSEA revealed that the high-risk group was closely related to the tumor immune microenvironment and many aspects of glioma progression compared to the low-risk group. In addition, functional experiments further reveal the biological characteristics of glioma cell lines, which will be helpful in advancing the development of targeted treatment in glioma.
Materials and Methods
Data Acquisition
The RNA-seq data of MES-related genes were downloaded from TCGA (https://cancergenome.nih.gov/) and Ivy GAP (http://glioblastoma.alleninstitute.org/). Ivy GAP is a freely accessible online data resource for exploring the anatomic and genetic basis of glioblastoma at the cellular and molecular levels, including digitized tissue pathology slides, and corresponding transcriptomic data of GBM patients (25, 26).
In TCGA, clinical information included gender, cancer type and Karnofsky Performance Score (KPS) score, etc. After 11 patients with incomplete clinical information were excluded, the training set included 666 samples from TCGA. In order to further validated the accuracy of the results, the testing set included 618 samples from the Chinese Glioma Genome Atlas (CGGA, http://www.cgga.org.cn/, freely available) dataset, the clinical information included primary-recurrent-secondary (PRS) type, grade, gender, age, radio status, chemo status, IDH mutation status, 1p19q codeletion status, etc.
Identification of MES-Related LncRNAs
We obtained 303 MES-related encoding genes (mRNAs) from two datasets (TCGA and Ivy GAP). Then, 47 MES-related lncRNAs were identified by constructing MES-related mRNA-lncRNA co-expression network according to the criteria of |Correlation Coefficient| > 0.7 and P <0.001 by Pearson correlation analysis using the Limma R package. Next, we carried out a difference analysis between LGG and GBM samples with the R programming language (http://cran.r-project.org) and 42 differentially expressed lncRNAs were identified.
Construction of a Prognostic Model With MES-Related LncRNA
In order to narrow the scope, univariate and multivariate Cox regression was performed in the TCGA data set, and ultimately, 10 MES-related lncRNAs were used as candidates for the prognostic model. HR<1 was considered a protective factor, whereas HR>1 was considered a risk factor. In order to compute the risk score of each glioma patient, multivariate regression analysis was performed to evaluate the relative contribution of candidate lncRNAs as prognostic models. The formula was as follows:
Coef (i) and X(i) represent the regression coefficient and expression value of MES-related lncRNAs, respectively.
Evaluation of the Prognostic Model
Using the median risk score as the demarcation point, glioma patients were divided into high-risk and low-risk groups. Kaplan-Meier survival curves were used to compare the OS of the two groups of glioma patients. In order to determine whether the risk score model is an independent factor for glioma patients, we performed univariate and multivariate Cox regression analysis of these prognostic factors, and the ROC curves were used to assess the predictive value of the prognostic model. P<0.05 was considered statistically significant.
Estimation of the Immune Cell Composition and Bioinformatics Analysis
The single sample gene set enrichment analysis (ssGSEA) was carried out to explore the different infiltration degrees of 24 immune cell types in two kind risk groups with the R package “GSV A”. We evaluate tumor purity by the R package “ESTIMA TE,” which is based on the estimation of stromal and immune cell markers (27). PCA was performed with R software to explore the expression patterns between low- and high-risk groups based on the ten MES-related lncRNAs. GSEA software (4.0.1) (http://www.broadinstitute.org/gsea/index.jsp) was used for gene set enrichment analysis to discern differences in gene sets between the low- and high-risk groups. To validate these lncRNA expression levels, the Gene Expression Profiling Interactive Analysis (GEPIA, http://gepia.cancer-pku.cn/) was applied to analyze the RNA sequencing data.
Cell Culture and Transfection
The glioma cell lines LN18, SNB19, SW1088, T98G, and U251 were purchased from Shanghai Institute of Cell Biology, Chinese Academy of Sciences (Shanghai, China). All cell lines were cultured in Dulbecco’s Modified Eagle’s medium (DMEM : SH30022.01; HyClone) containing with 10% fetal bovine serum (FBS, Gibco) at the culture condition of 37°C with 5% CO2 in a humidified incubator. The cells grew in a monolayer, with the medium needing to be changed every 48 hours. Then, we used lncRNA Smart Silencer, antisense oligonucleotides (ASOs), and small interfering RNAs (siRNAs), designed by RIBOBIO (Guangzhou Ribobio Co.), to target and knockdown the expression of DGCR10, HAR1B, and SNHG18. The sequences were as follows: DGCR5 Smart Silencer, CCTTCACTCTGGTCATCGTT; ASO-HAR1B, CAACACTTGAACAAGCAAGG; si-SNHG18, CCACTTGGATTTCACCAAA. Next, in accordance with the manufacturer’s instructions in Opti-MEM (Gibco; Thermo Fisher Scientific, Inc.), transfection reagent jetPRIME (Poly plus-transfection®) was used to carry out cell transfection.
RNA Extraction and RT-qPCR
TRIzol reagent (Invitrogen, Thermo Fisher Scientific) was used to extract total RNA from LN18, U251, and T98G cells according to the manufacturer’s protocol. Reverse transcription was performed using PrimeScript RT Master Mix (Perfect Real Time) (RR036A; Takara). Next, RT-qPCR was carried out with TB Green™ Premix Ex Taq™ II (Tli RNaseH Plus) (RR820A; Takara); the steps for RT-qPCR reaction were as follows: predenaturation at 95°C, 30s, one cycle; quantitative analysis at 95°C for 5s, 60°C for 31s, 40 cycles; dissolution curve at 95°C for 15s, 60°C for 1min, 95°C for 15s, 1 cycle. The relative expression level of each lncRNA was calculated using the 2−ΔΔCt method. The primer sequences of GAPDH, DGCR10, HAR1B, and SNHG18 are shown in Table 1.
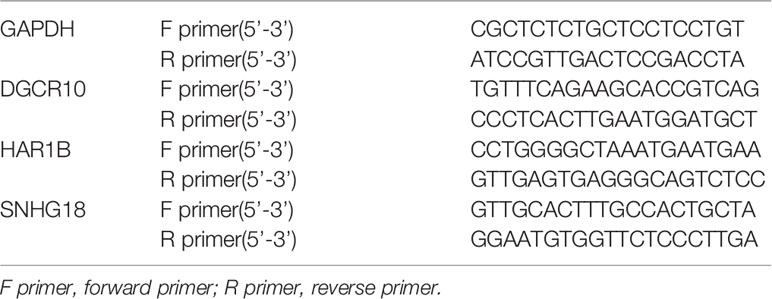
Table 1 The primer sequences of DGCR10, HAR1B, and SNHG18.
Transwell Migration Assay and Matrigel Invasion Assay
First, transwell migration assay were performed to measure LN18, U251, and T98G cell migration ability. Transfected (2×10⁴) cells were added into the upper chamber that contained 200 µl of serum-free DMEM. Meanwhile, the lower chamber contained 600 µl of DMEM with 30% FBS and was cultured at 37°C for 24h. For the invasion assay, 1×10⁵ cells were plated in each chamber that was pre-coated with Matrigel (356234; BD Biosciences) and cultivated for 48h in a culture environment of 37°C and 5% CO2. After incubation, 4% polyoxymethylene and 0.5% crystal violet were used to fix and stain the cells, respectively. Then, a cotton swab was used to remove cells remaining on the upper surface of the parietal chamber. Quantify under a microscope and perform three independent experiments.
Statistical Analysis
GraphPad Prism 8 was used for statistical analysis. A co-expression network of the 47 MES-related mRNA-lncRNA was established and visualized using Cytoscape software(version 3.4.0) (28). ImageJ software for Microsoft Windows was used for the cell number counts. The univariate and multivariate Cox regression analyses were carried out using R version 3.6.2 and relevant packages. Perl version 5.30.2 (http://www.perl.org) was used to process above data.
Statistical significance was denoted as follows: *P < 0.05, **P < 0.01, ***P < 0.001.
Results
Identification and Differential Expression Profiles of MES-Related LncRNAs
A flowchart describing the construction and verification of our prognostic model was first drafted (Figure 1A). The MES-related mRNAs were obtained from the TCGA and Ivy GAP databases, with 204 MES-related mRNAs from TCGA and 120 from Ivy GAP. The Venn diagram shows a total of 303 MES-related mRNAs contained in the two databases (Figure 1B). Next, A total of 47 MES-related lncRNAs were obtained by constructing the co-expression networks with 303 MES-related mRNAs (Figure 1C and Table 2). Then, 42 differentially expressed lncRNAs were identified between the LGG samples and GBM samples in the TCGA database (Figure 2). In order to narrow the scope, 18 MES-related lncRNAs were screened by performing univariate Cox regression analysis (Figure S1A). Multivariate Cox regression analysis showed that 10 MES-related lncRNAs (GDNF-AS1, CRNDE, FAM201A, HAR1B, AGAP2-AS1, RNF219-AS1, DGCR10, SNHG18, LINC00906, HAR1A) were significantly associated with prognosis (Figure S1B), out of which three lncRNAs were unfavorable (CRNDE, AGAP2-AS1, and SNHG18) and the remaining seven were favorable factors.
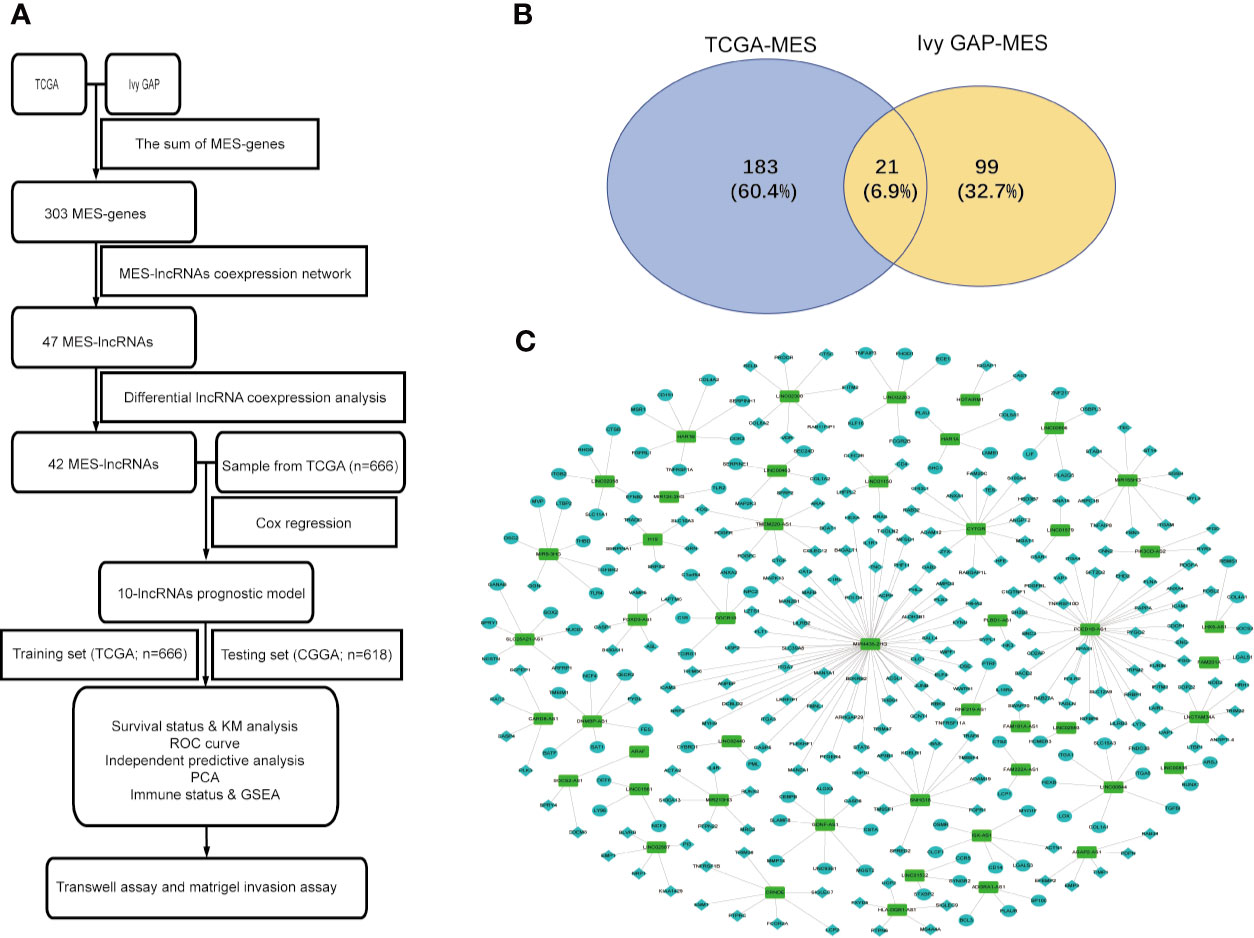
Figure 1 Identification of MES-related lncRNAs. (A) Flowchart of our study. (B) Venn diagram: the sum aggregate of MES-related mRNAs in the TCGA and Ivy GAP data sets. (C) Network of MES-related lncRNAs with co-expressed MES-related genes in glioma. In the centric position, green nodes indicate MES-related lncRNAs and the sky blue indicates MES-related genes, diamonds indicate positive correlation, ellipses indicate negative correlation. The coexpression network is visualized by CYTOSCAPE 3.4 software.

Table 2 Correlation between the MES-related lncRNAs and MES-related genes in glioma.
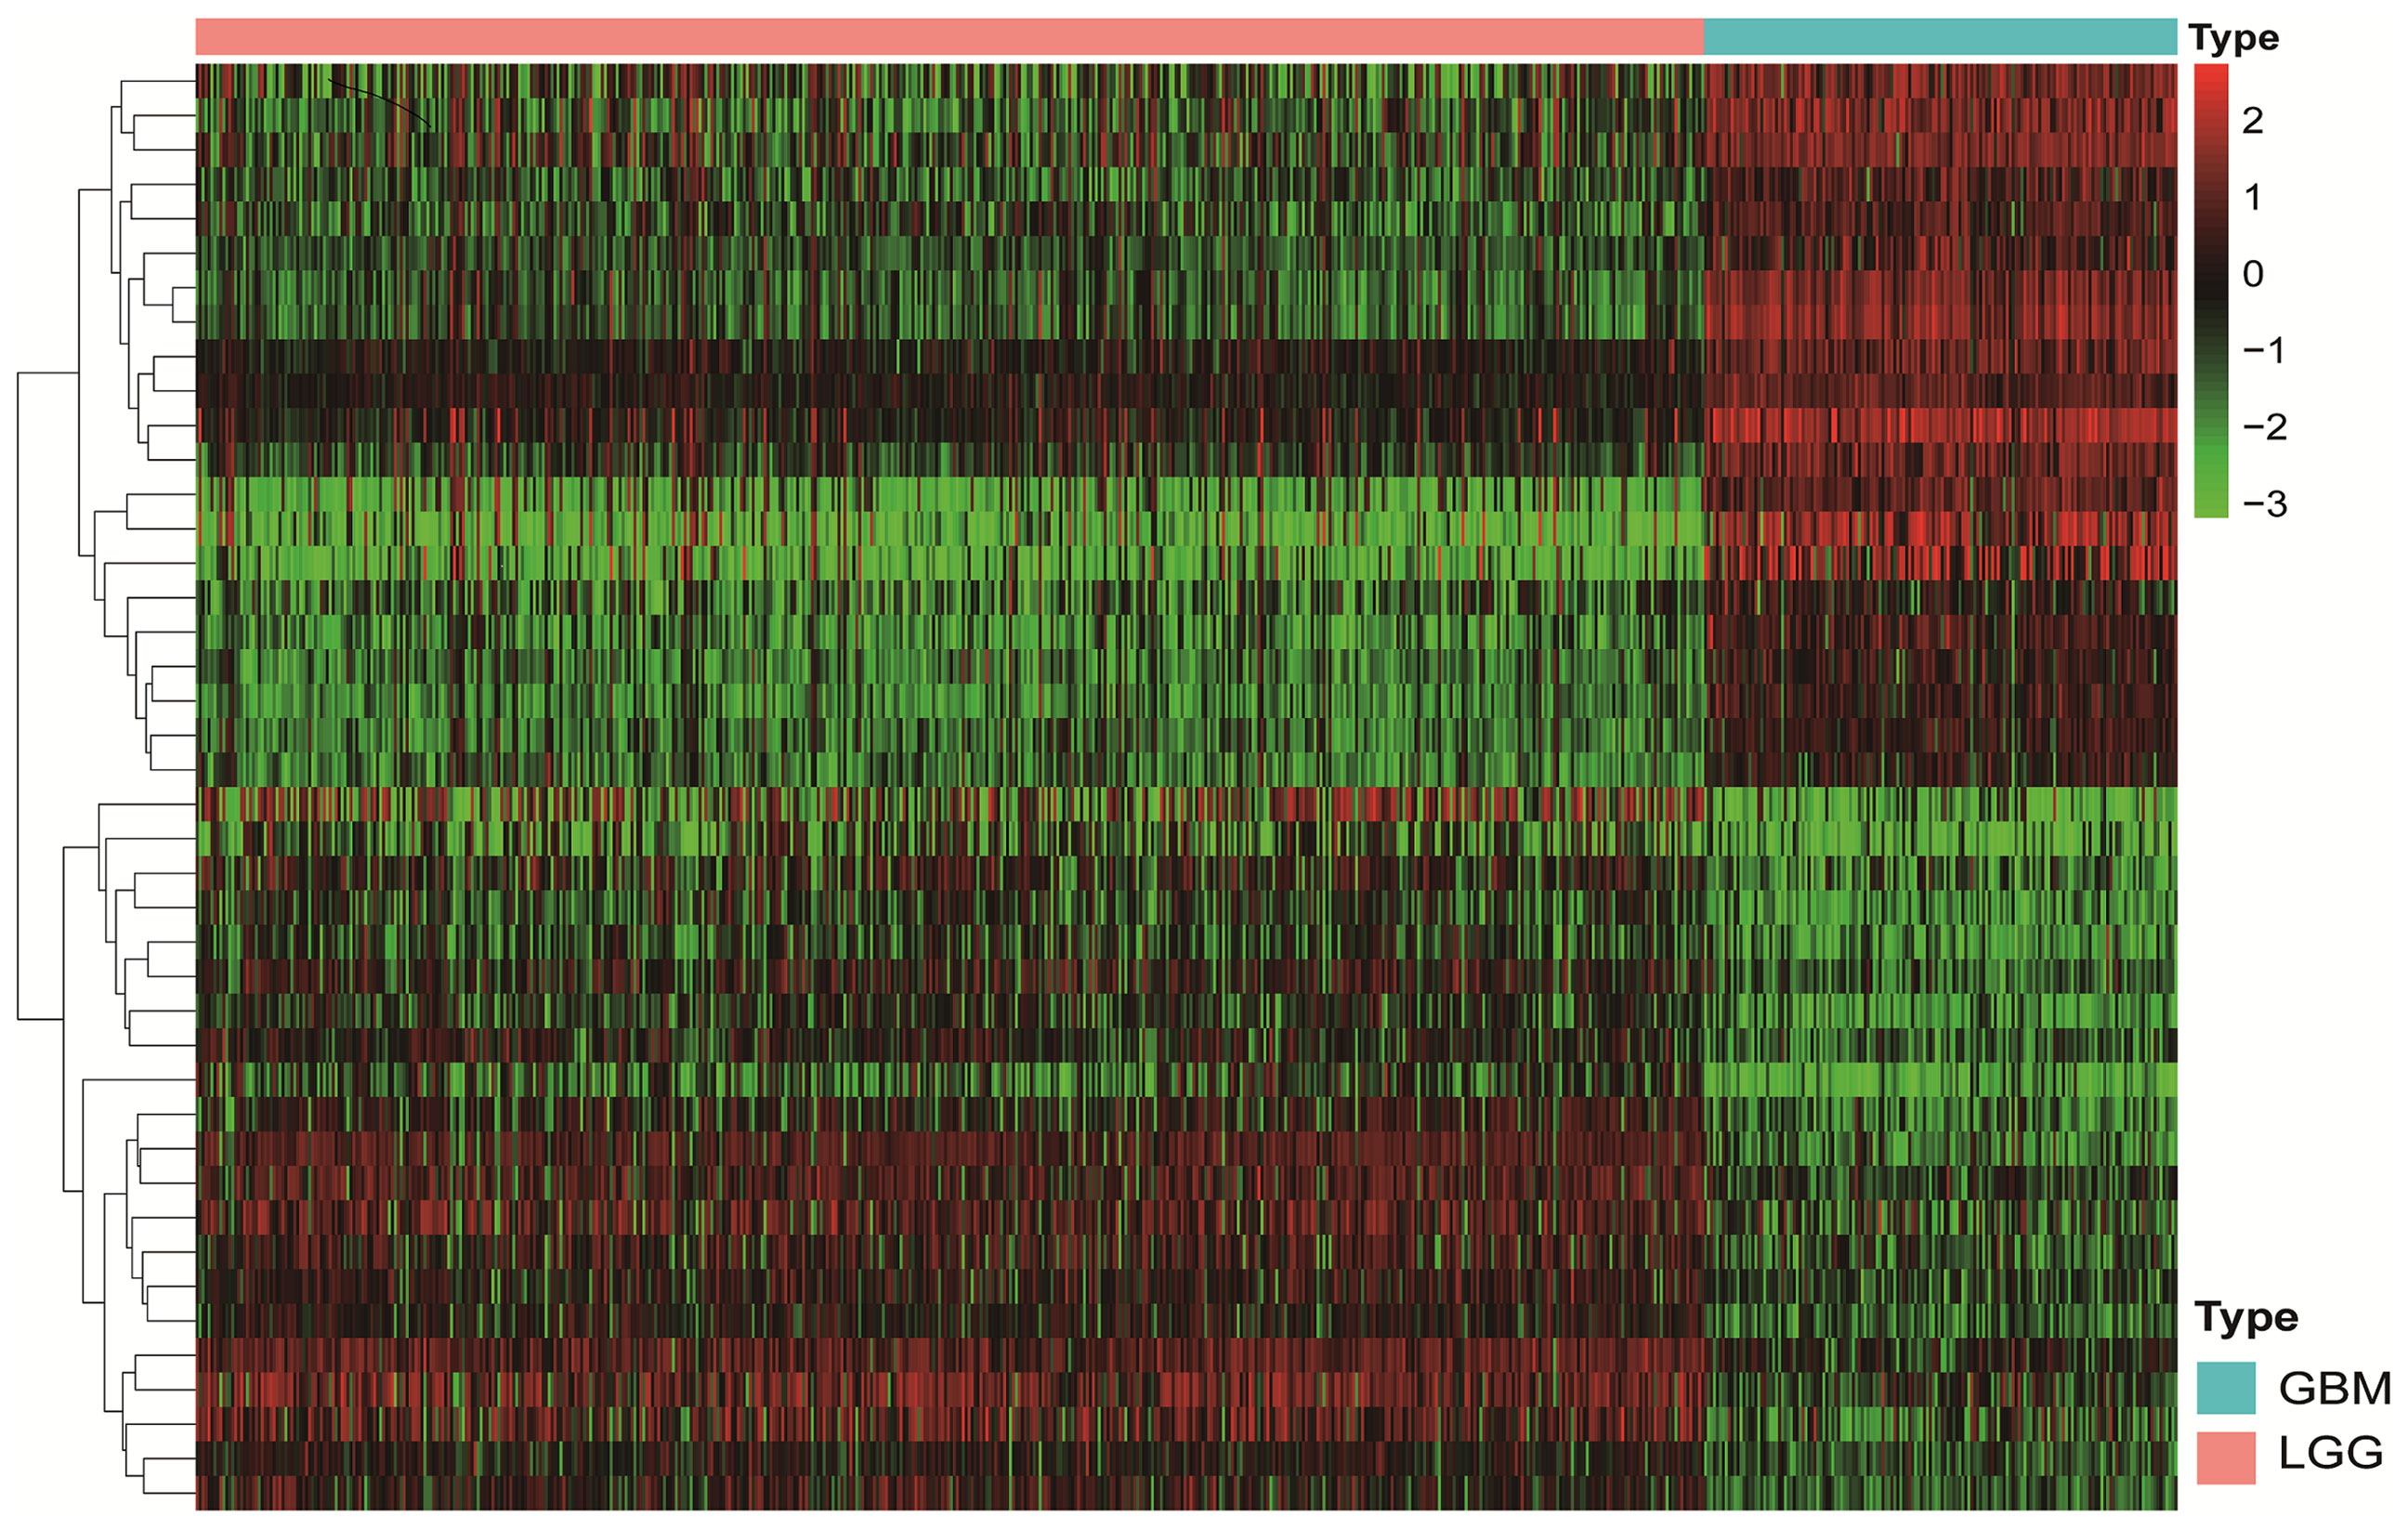
Figure 2 The Heatmap shows that 42 MES-related lncRNAs with obvious discrepancies between LGG and HGG. The color from green to red shows an increasing trend from low levels to high levels.
Construction and Assessment of the Ten MES-Related LncRNAs Risk Score Model for Glioma Patients
Risk score model was constructed by perform multivariate Cox regression analysis. The risk score of each patient was calculated according to the linear combination of regression coefficients and lncRNA expression values in the TCGA database. Based on the median risk score, the patients from TCGA were separated into high- and low-risk groups (Figure 3A); patients with a higher risk score demonstrated lower survival time (Figure 3B).The heatmap showed distinct differences in the expression levels of the ten prognostic-related lncRNAs in the low- and high-risk groups (Figure 3C). In the TCGA data set, compared with the high-risk group, the overall survival (OS) of glioma patients in the low-risk group was longer (Figure 4A). The time-dependent receiver operating characteristic (ROC) curve showed an area under curve (AUC) of 0.878 (Figure 4C), indicating that the model provided higher prediction accuracy. In the CGGA validation data set, we also adopted a median risk score to distinguish between high- and low-risk groups (Figure 3D). As expected, patients in the database with a higher risk score demonstrated lower survival time and the expression patterns of these lncRNAs were similar to those in the TCGA data set (Figures 3E, F). Supplementally, the high-risk group showed poor prognosis in the CGGA dataset, with an AUC of 0.762 (Figures 4B, D).
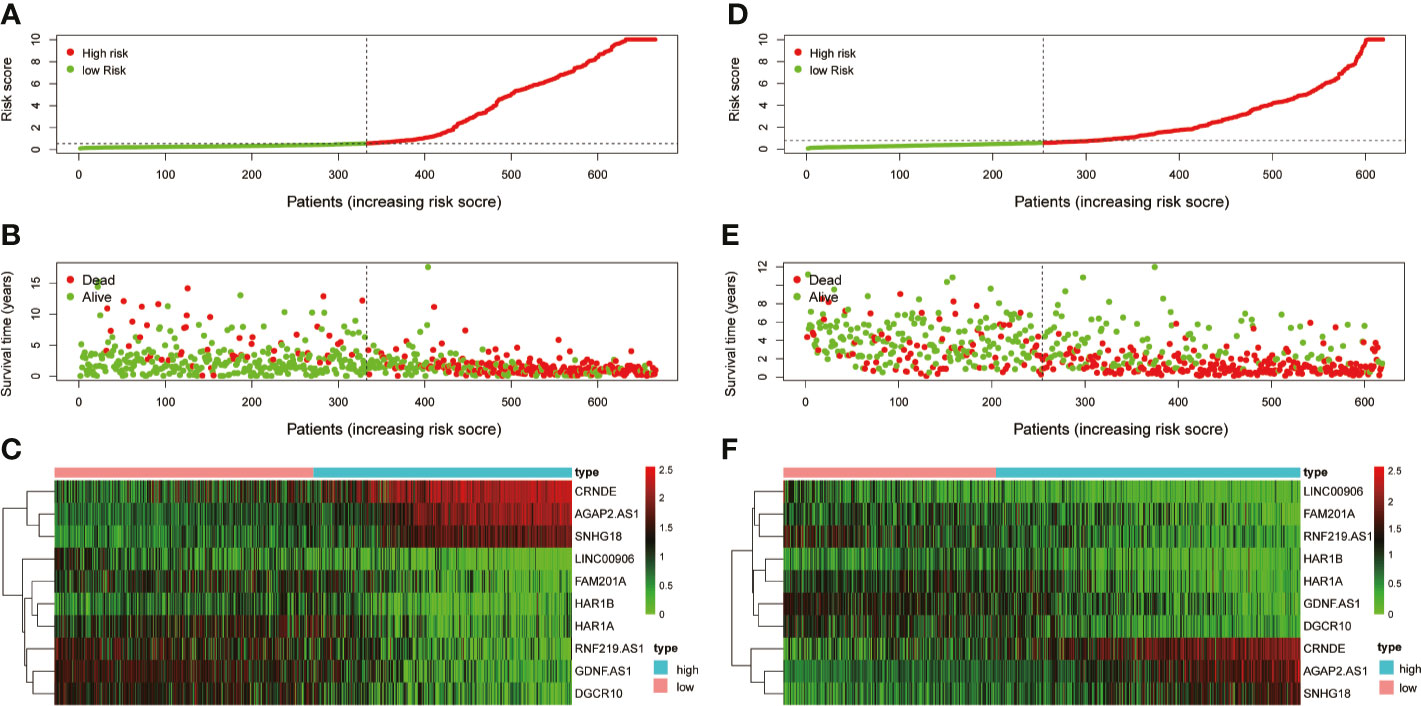
Figure 3 Examination and validation prognostic models based on candidate lncRNAs signatures. (A) Risk score distribution in the TCGA database. (B) Survival status and time of glioma patients in the TCGA database. (C) The heatmap shows the expression profiles of 10 MES-related lncRNAs between the high- and low-risk groups in the TCGA database. (D) Risk score distribution validation in CGGA database. (E) Survival status and time of glioma patient validation in CGGA database. (F) The heatmap shows the expression profiles of 10 MES-related lncRNAs between the high- and low-risk groups validation in the CGGA database.
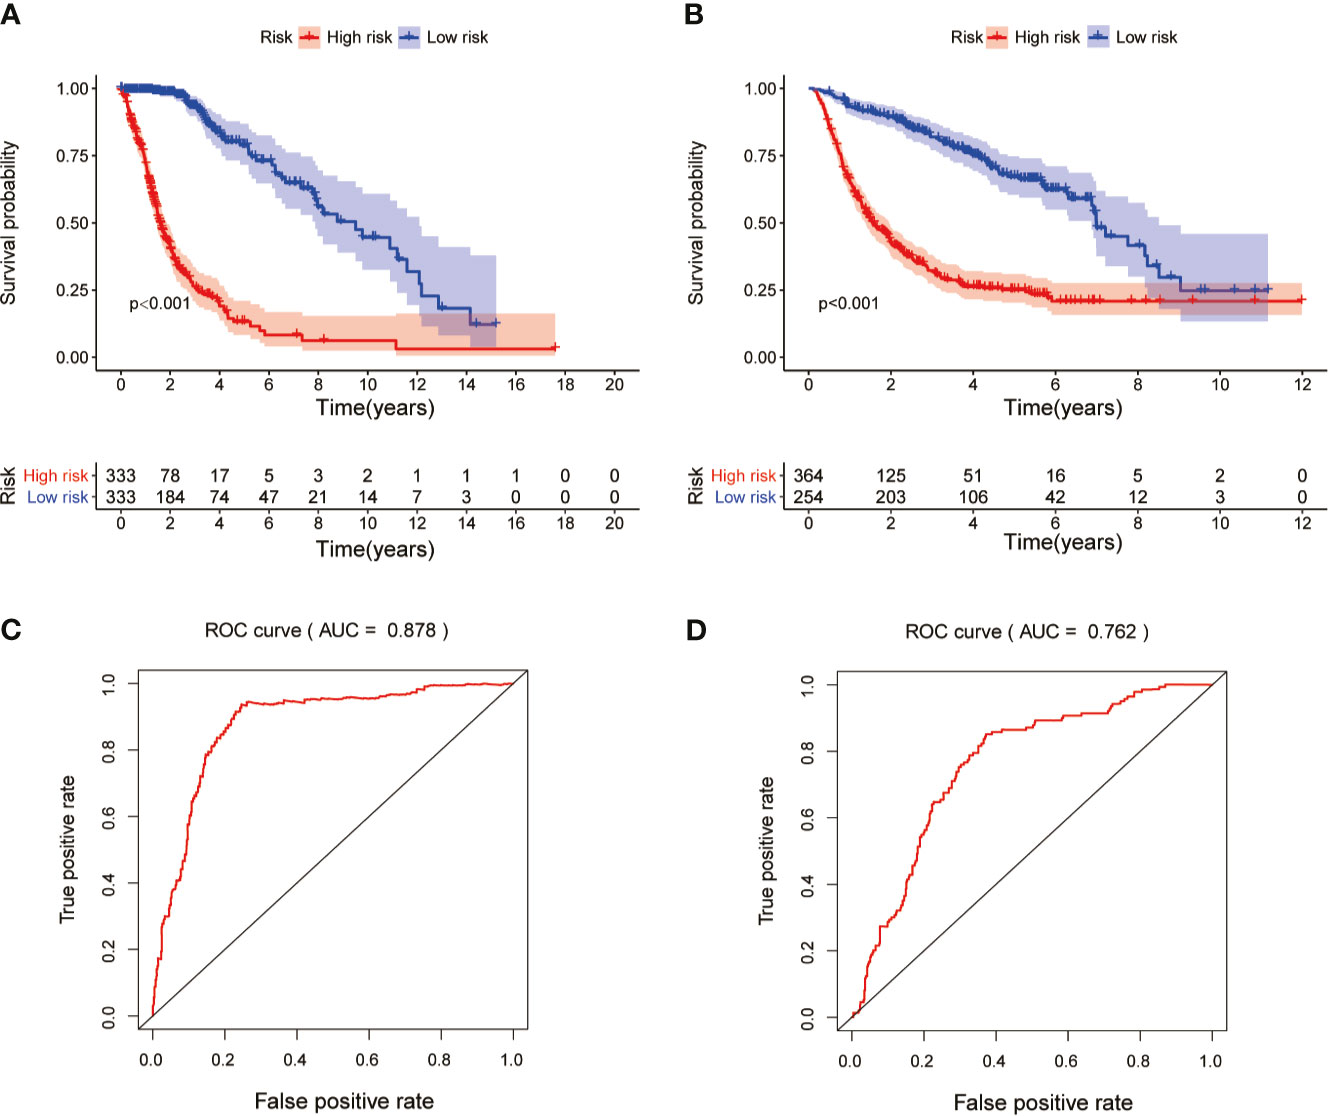
Figure 4 Kaplan-Meier survival and ROC curve analysis in the TCGA and CGGA data sets. (A) Kaplan-Meier survival analysis based on 10 MES-related lncRNAs between the high- and low-risk groups in TCGA testing set. (B) Kaplan-Meier survival curve for CGGA independent validation set. (C) ROC curve shows the performance of the prognostic models in predicting OS of glioma patients from TCGA testing set. (D) ROC curve analysis for CGGA independent validation set.
The Ten MES-Related LncRNAs as a Prognostic Model Is an Independent Factor for Glioma Patients
To determine whether the prognostic model of the above ten MES-related lncRNAs was an independent factor for glioma patients, we conducted univariate and multivariate Cox regression analyses in with the TCGA dataset. The hazard ratio (HR) of the risk score and 95% CI were 1.331 and 1.279-1.386 (P<0.001) in univariate (Figure 5A), and 1.236 and 1.162-1.315 (P<0.001) in multivariate Cox regression analyses (Figure 5B), respectively. In order to evaluate the predictive accuracy of the risk score on the prognosis of glioma patients, the AUC of the risk score was calculated to be 0.902, which was more than the AUCs of gender, cancer type, and KPS score (Figure 5C). Furthermore, we conducted the same analysis with the CGGA database for verification. The HR of the risk score and 95% CI were 1.184 and 1.149-1.219 (P< 0.001) in univariate (Figure 5D), and 1.068 and 1.021-1.117 (P< 0.05) in multivariate Cox regression analyses (Figure 5E), respectively. The ROC curve showed that the AUC of the risk score was 0.775, similar to the AUC of grade (0.778) (Figure 5F). These results indicate that the ten MES-related lncRNAs signature as a prognostic model is a significant independent prognostic factor for glioma patients.
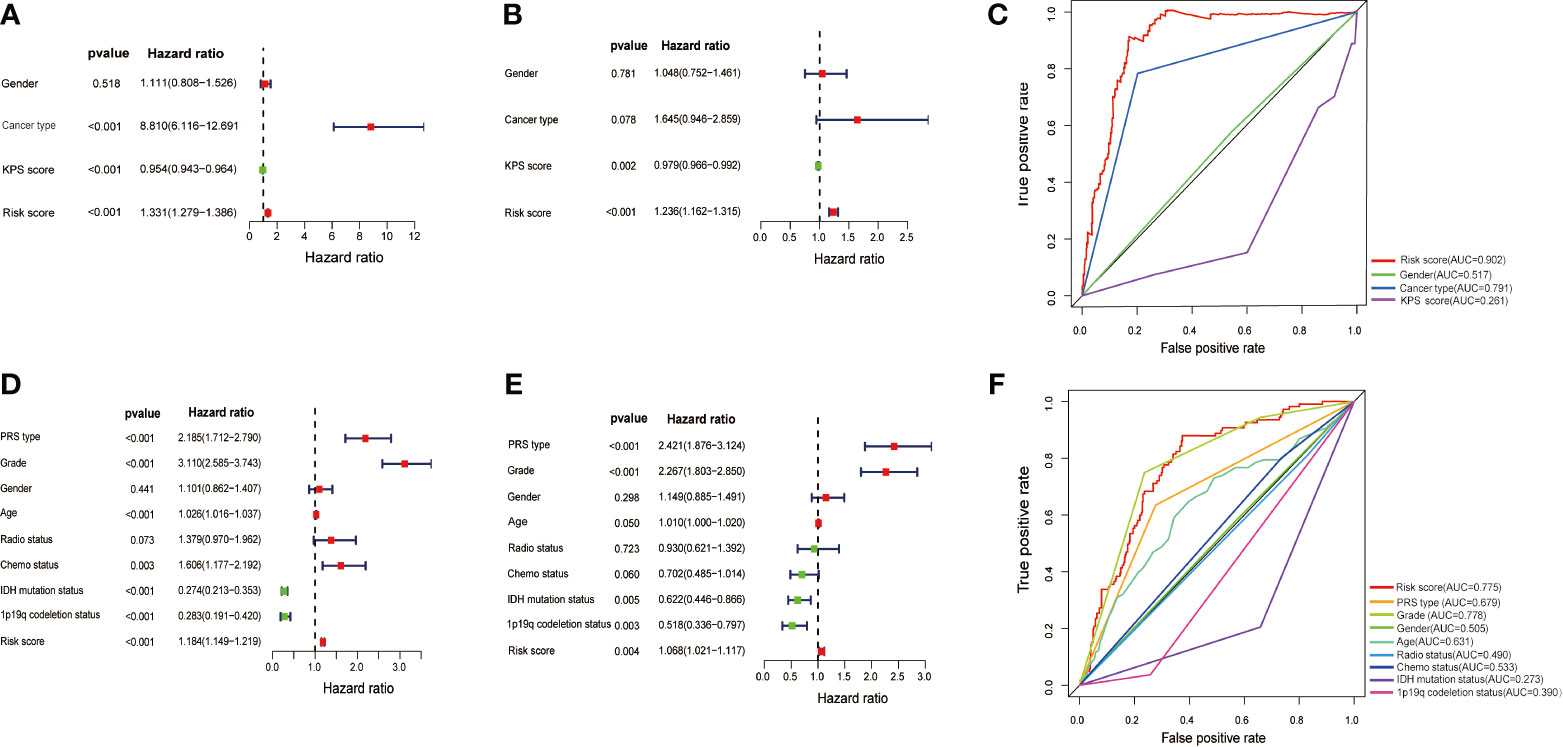
Figure 5 Assessment of the independent prognostic value of the risk score model based on a 10 MES-related lncRNAs signature. (A) Univariate and (B) multivariate Cox regression analyses of risk score and other clinical factors in the TCGA data set. (C) The AUC based on the ROC curves for risk score and other clinical factors in the TCGA data set; Clinical factors: gender, cancer type, KPS score, risk score. (D) Univariate and (E) multivariate Cox regression analysis of risk score and other clinical factors in the CGGA data set. (F) The AUC for risk score and other clinical factors in the CGGA data set; Clinical factors: PRS type, grade. gender, age, radio status, chemo status, IDH mutation status, 1p19q codeletion status, risk score.
PCA and Immune Infiltration in Different Risk Groups
Principal component analysis (PCA) showed a distinctive distribution between low- and high-risk groups based on the ten MES-related lncRNAs in TCGA, suggesting that the risk model could divide glioma patients into two parts. The samples in the low- and high-risk groups are represented by green and red dots, respectively in Figure S2. MES subtype is closely associated with immune. Next, we calculated the stromal score, immune score, ESTIMA TE score and tumor purity of every glioma patients adopting the ESTIMA TE algorithm. Compared with high-risk group, the box chart showed that the low-risk group was significantly lower in stromal score, immune score and ESTIMA TE score, meanwhile, had higher tumor purity (Figures 6A–D). The heatmap and violin plot showed that there were marked differences in the relative proportions of 6 out of 22 immune cells. Among them, T cells regulatory(Tregs), T cells gamma delta, Macrophages M0 and Macrophages M2(all above p < 0.001) presented higher proportions in high-risk group compared with low-risk group, and Monocytes and Eosinophils(all above p < 0.001) were significantly upregulated in the low-risk group (Figures 6E, F).
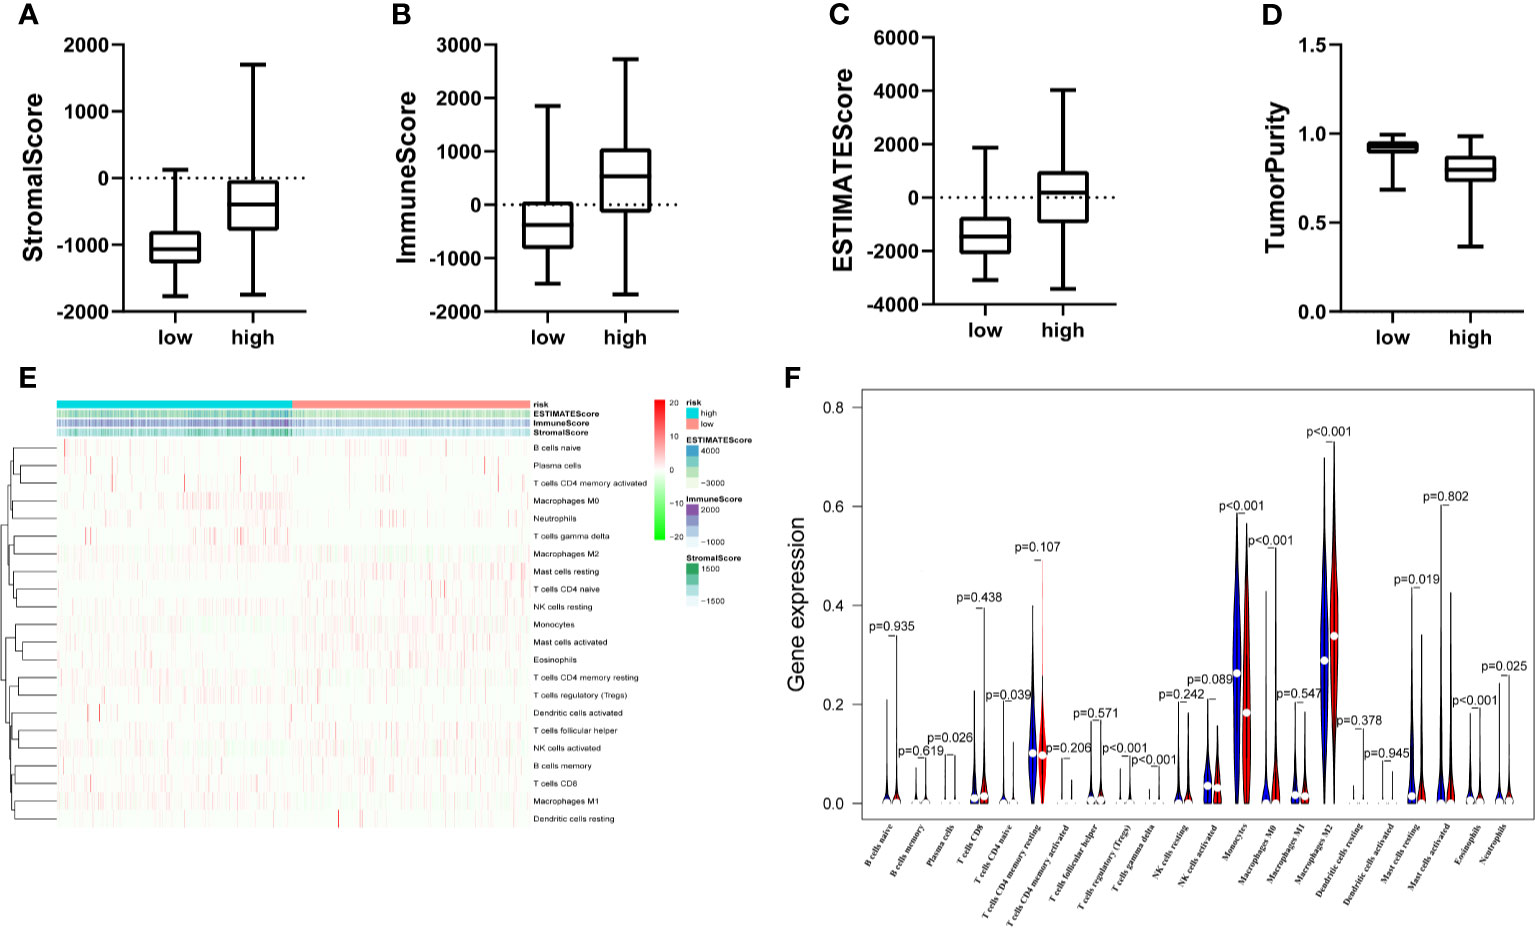
Figure 6 The landscape of immune infiltration and estimating tumor purity. (A–D) There is a statistical difference of the stromal score (A) immune score (B) ESTIMA TE score (C) and Tumor Purity (D) between the high- and the low-risk groups. (E) The heatmap shows the stromal score immune score, ESTIMATE score and corresponding 22 immune cell proportions of each glioma patient in the two risk groups. The horizontal axis shows the samples which were divided into two risk groups. (F) The violin plot revealed the distribution of same immune cells between two risk groups. (Blue was low-risk group and red was high-risk group).
Functional Enrichment Analysis based on the Ten MES-Related LncRNAs Signature
Further functional annotation was conducted using GSEA. In the high-risk group, we discovered that a total of six gene sets were significantly enriched in tumor-related pathways, including inflammatory response, interleukin (IL)2/signal transducer and activator of transcription (STAT) 5 signaling and tumor necrosis factor α (TNFα) signaling via nuclear factor-κB (NFκB) were closely associated with tumorigenesis and malignant phenotypes such as migration and invasion of glioma (Figures 7A–C). Additionally, hypoxia, angiogenesis, and epithelial mesenchymal transition (EMT) were closely related to the invasion and metastasis of glioma (Figures 7D–F). The above results further revealed that the prognosis model based on the ten MES-related lncRNAs may illustrate the underlying mechanism of the occurrence and development of glioma, which leads to a worse prognosis for the patients.
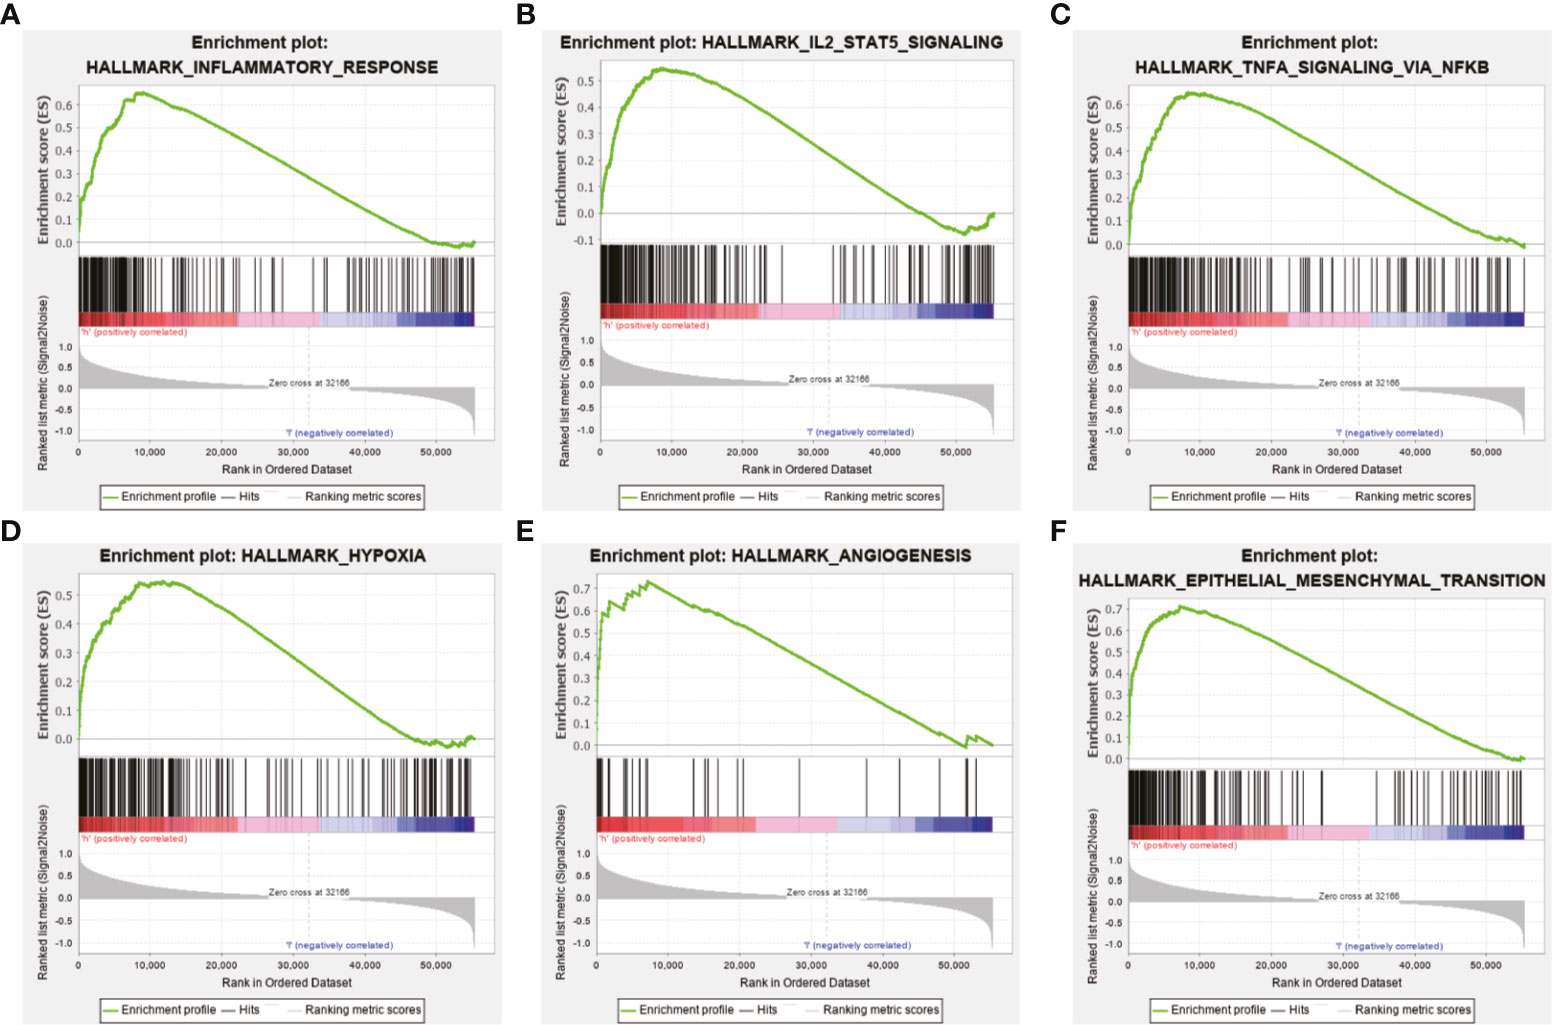
Figure 7 Functional enrichment analysis based on the prognostic model in the TCGA data set. GSEA indicated obvious enrichment of (A) inflammatory response, (B) IL 2/STAT5 signaling, (C) TNFα signaling via NF-κB, (D) hypoxia, (E) angiogenesis, and (F) EMT in the high-risk group.
Knocking Down the Expression of DGCR10, HRA1B, and SNHG18 Can Significantly Impact Glioma Cells Migration and Invasion
Based on the samples from the TCGA and Genotype-Tissue Expression Portal (GTEx) datasets, the RNA sequencing expression data retrieved from the GEPIA website were used to analyze the differential expression level of the ten lncRNAs between the normal group and tumor group of glioma (Figures 8A, D, G and Figure S3). Given that the functions of DGCR10, HAR1B, and SNHG18 are rarely studied in gliomas, the patients from the TCGA database were classified into high- and low-expression groups according to the median expression level of these three lncRNAs. Disease-free survival and overall survival rates showed that the expression of DGCR10 and HAR1B are positively correlated with the OS of glioma patients (Figures 8B, C, E, F). In contrast, the expression levels of SNHG18 are negatively correlated with OS (Figures 8H, I). Subsequently, functional studies were carried out in different glioma cell lines. Real-time quantitative PCR (RT-qPCR) was carried out to detect the expression levels of DGCR10, HAR1B, and SNHG18 in five glioma cell lines. It was found that DGCR10 and HAR1B were expressed at a relatively high level in LN18 and T98G, whereas SNHG18 was expressed at a high level in U251 and T98G (Figure 9A). Next, nucleocytoplasmic fractionation was performed to determine the locations of DGCR10, HAR1B, and SNHG18 in glioma cells. The results revealed that DGCR10 and SNHG18 were mainly expressed in the cytoplasm, whereas HAR1B were mainly expressed in the nucleus(Figures 9B–D). To verify the effects of these lncRNAs on the migration and invasion of glioma cells, we knocked down the expressions of DGCR10, HAR1B, and SNHG18 in glioma cells (Figures 9E–G and Table 3), and the knockdown efficiency was verified in T98G cells (Figures 9H–J and Table 3). The results of transwell and matrigel invasion assays showed that T98 cells’ ability to migrate and invade was significantly increased after knockdown of DGCR10 and HAR1B, while the ability was significantly decreased after knockdown of SNHG18 (Figures 10A–L and Table 4). In addition, we obtained the same results of migration and invasion in LN18 and U251 cell lines (Figures S4A–L).
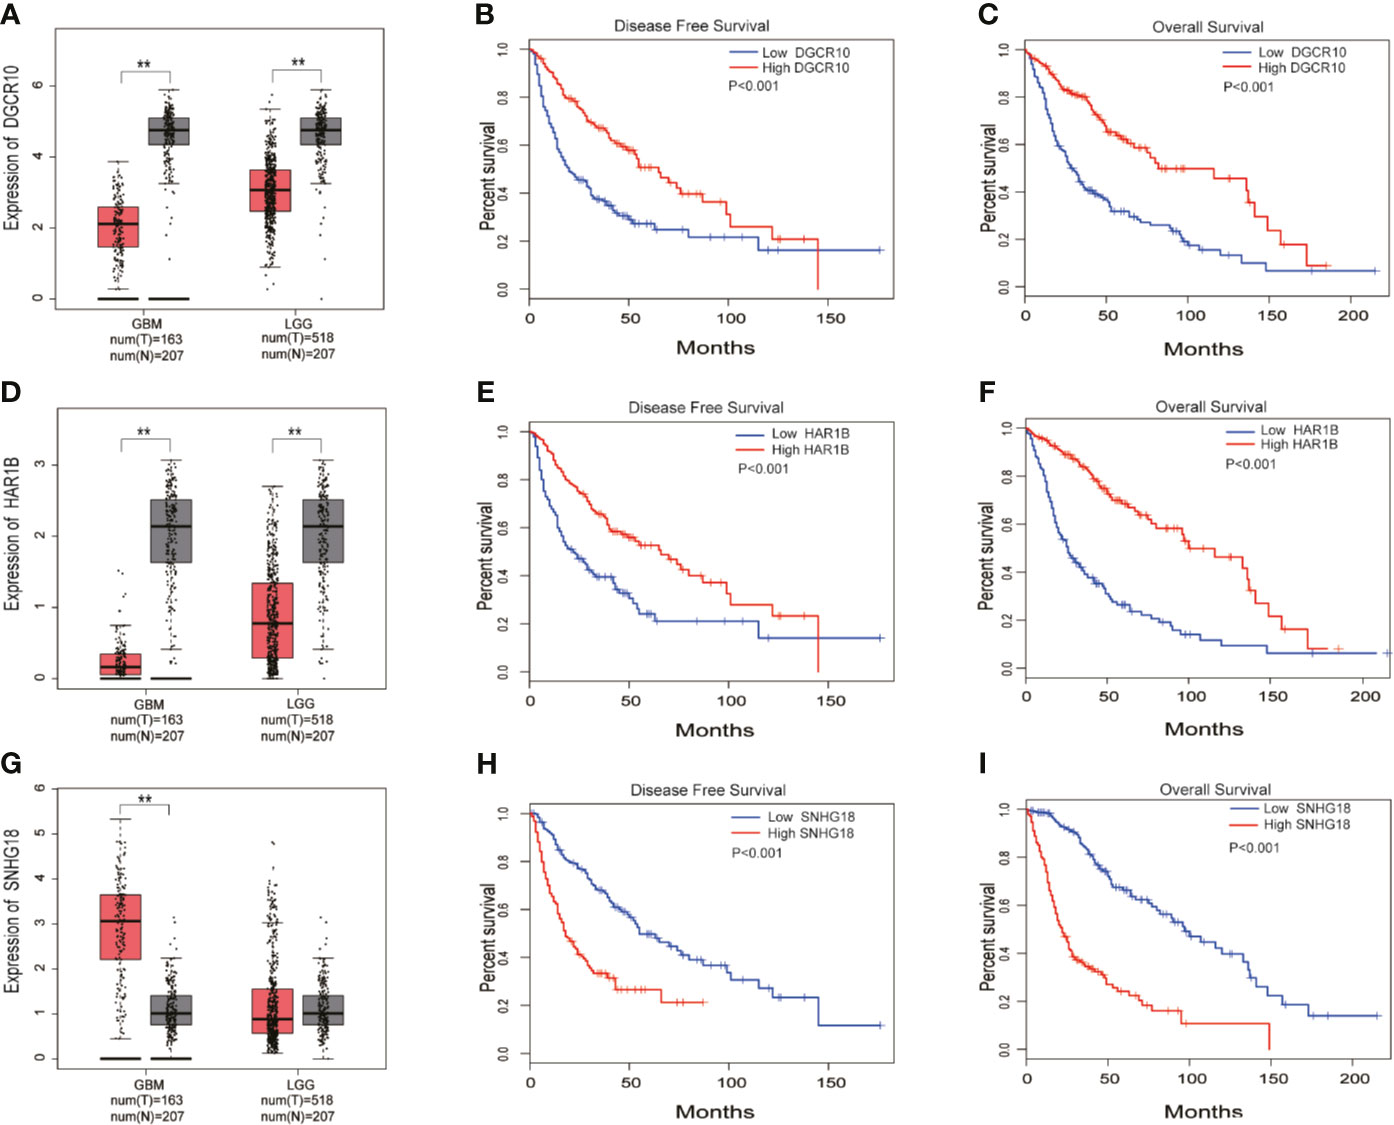
Figure 8 DGCR10, HAR1B, and SNHG18 were selected from the 10 MES-related lncRNAs. (A) Differences in DGCR10 expression between the normal and glioma groups from the TCGA and GTEX data sets. (B) Disease-free survival analysis of DGCR10 from the TCGA database. (C) Overall survival analysis of DGCR10 from the TCGA database. (D) Differences in HAR1B expression between the normal and the glioma groups from the TCGA and GTEX data sets. (E) Disease-free survival analysis of HAR1B from the TCGA database. (F) Overall survival analysis of HAR1B from the TCGA database. (G) Differences in SNHG18 expression between the normal and glioma groups from the TCGA and GTEX data sets. (H) Disease-free survival analysis of SNHG18 from the TCGA database. (I) Overall survival analysis of SNHG18 from the TCGA database. **p < 0.01.
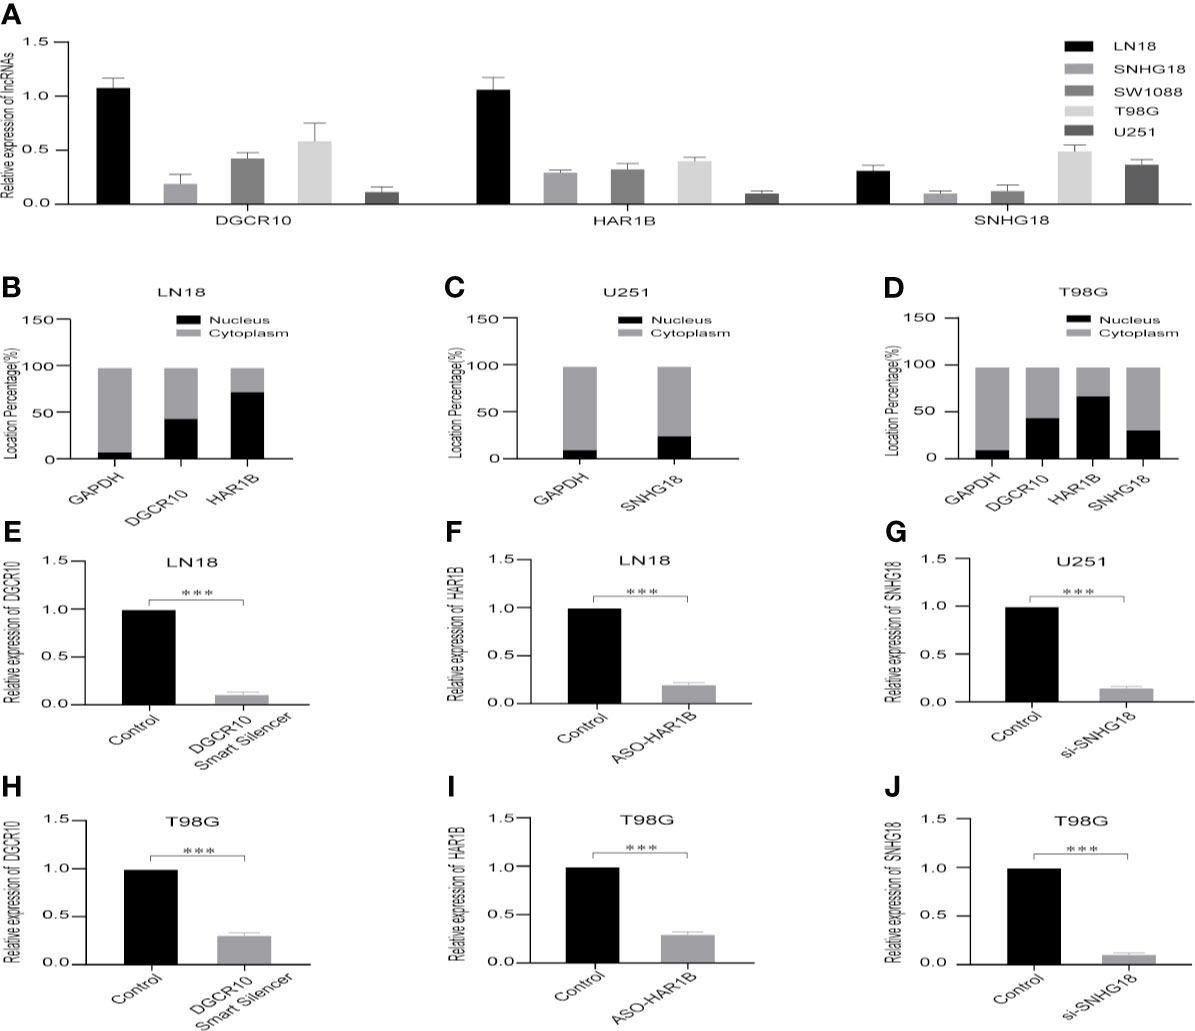
Figure 9 Selection of cell lines and verification of the knockdown effect. (A) Relative expression levels of DGCR10, HAR1B, and SNHG18 in five cell lines. (B) The nuclear and cytoplasmic percentage of DGCR10 and HAR1B in LN18 cells. (C) The nuclear and cytoplasmic percentage of SNHG18 in U251 cells. (D) The nuclear and cytoplasmic percentage of DGCR10, HAR1B, and SNHG18 in T98 cells. (E) The relative expression level of DGCR10 in LN18 cells after knockdown. (F) The relative expression level of HAR1B in LN18 cells after knockdown. (G) The relative expression level of SNHG18 in U251 cells after knockdown. (H) The relative expression level of DGCR10 in T98G cells after knockdown. (I) The relative expression level of HAR1B in T98G cells after knockdown. (J) The relative expression level of SNHG18 in T98G cells after knockdown. ***p < 0.001.
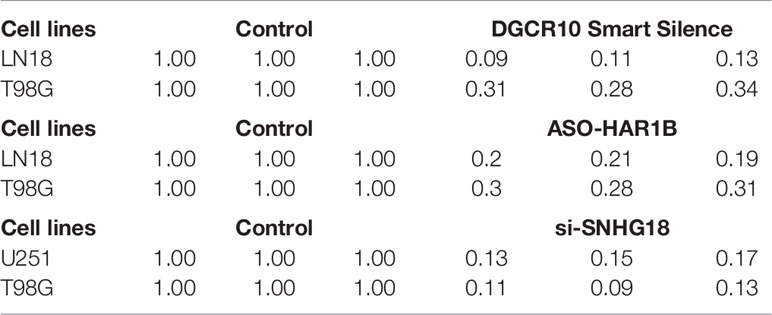
Table 3 The relative expression level of DGCR10, HAR1B and SNHG18 in different glioma cell lines after knockdown.
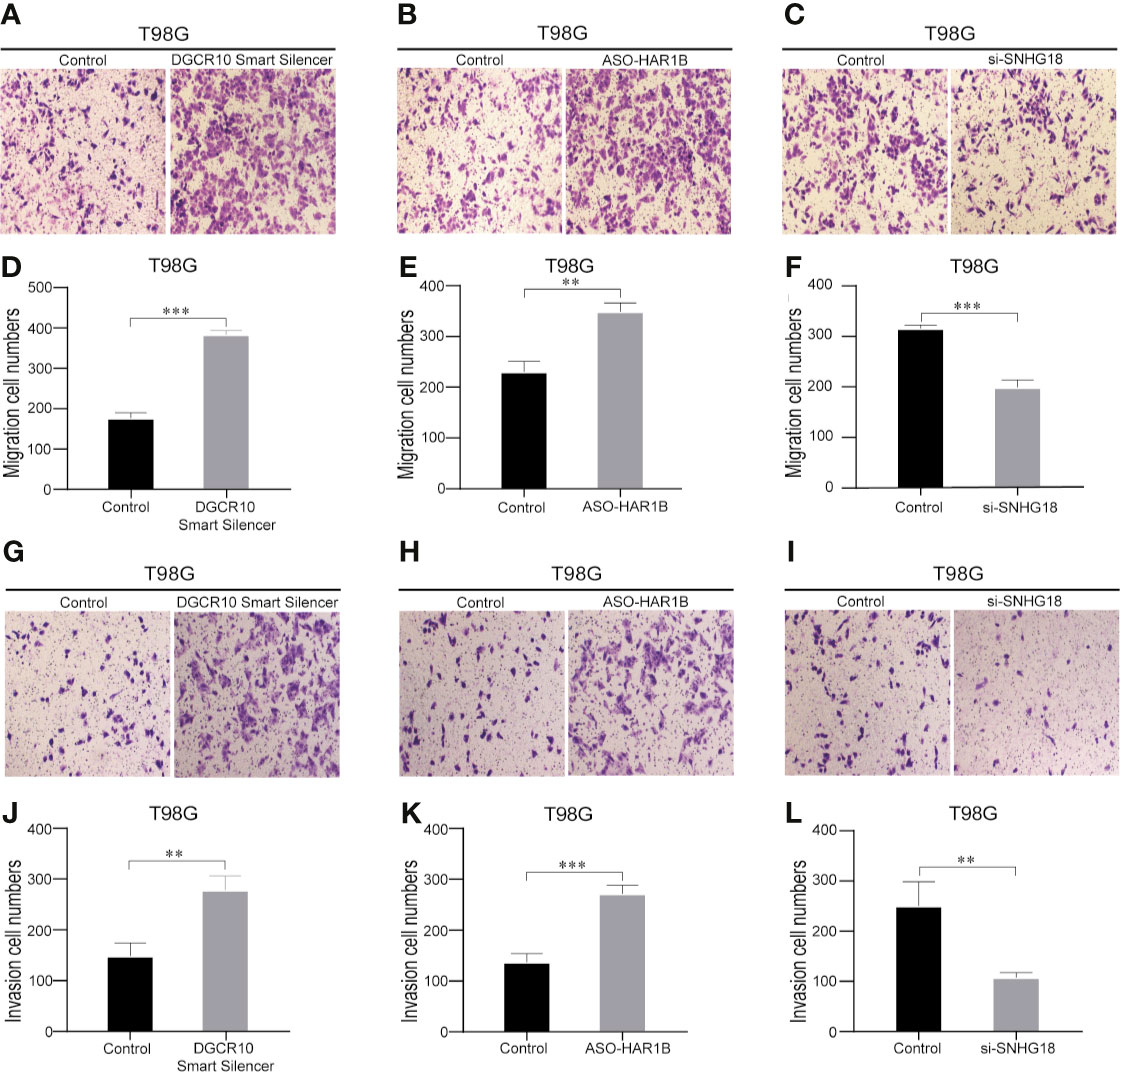
Figure 10 Knockdown of DGCR10, HAR1B and SNHG18 impact the T98G cell migration and invasion ability. Representative imaging (A–C) or counting (D–F) of migration assays after knockdown of DGCR10, HAR1B, and SNHG18 in T98G cell lines. Scale bar, 200μm. Representative imaging (G–I) or counting (J–L) of invasion assays after knockdown of DGCR10, HAR1B, and SNHG18 in T98G cell lines. Scale bar, 200μm; **p < 0.01; ***p < 0.001.
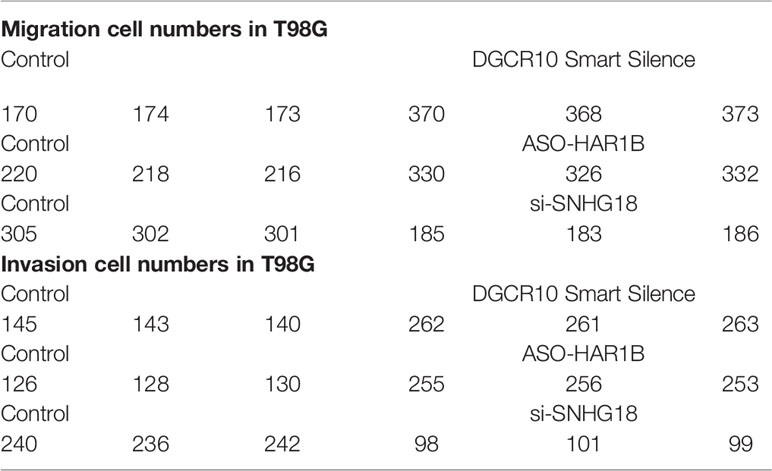
Table 4 Representative counting of migration and invasion assays after knockdown of DGCR10, HAR1B, and SNHG18 in different glioma cell lines.
Discussion
Glioma, especially glioblastoma, is the most destructive tumor of the human nervous system (29). In recent years, despite the progress in the diagnosis and treatment owing to the infiltration and rapid proliferation of gliomas, the tumor is difficult to cure by surgery alone. The prognosis of patients who relapse after surgery is poor, and the median survival time is only extended by a few months (23, 24, 30). The complexity of glioma is reflected by molecular heterogeneity; molecular subtyping offers better predictions of the development of polymorphisms in glioma, and guides scientific treatment strategies (31). The mesenchymal subtypes are especially malignant as compared to the others (neural, classic, and pre-neural types), and the relapsed GBM is always lethal and usually shows a mesenchymal phenotype (32–35). In addition, mesenchymal tumors express higher levels of angiogenic markers besides higher levels of necrosis (8, 33). The transition from proneural to mesenchymal subtype is closely related to treatment resistance and poor prognosis (36).
Next-generation sequencing technology in a growing number of cancer transcriptomes has revealed thousands of lncRNAs whose aberrant expression is associated with the tumor cell biology function, including cell cycle, proliferation, apoptosis, metastasis, invasion, and migration (37, 38). For example, in colorectal cancer (CRC), LINC00460 increases and adjusts the expression of ANXA2, which is associated with the expression of E-cadherin and N-cadherin, which promote cell invasion and EMT (39). Many lncRNAs are upregulated in gliomas and promote the malignant progression of glioma cells. NEAT1 is an lncRNA confirmed to be upregulated in gliomas and promotes cell migration and invasion, in addition to suppressing apoptosis in glioma cells (40). MES-related lncRNAs such as CRNDE can promote cell proliferation, migration, and invasion (41). Notably, the MES is a more malignant molecular subtype with a higher tendency for relapse, metastasis, and increased vascularity compared with the others (42). The study of molecular characteristics aims to determine new markers for the prognosis of cancer patients and therapeutic targets. In the past decade, new advances in bioinformatics and high-throughput technologies have helped improve our ability to understand the pathogenesis and predict the prognosis of cancer patients besides identifying potential biomarkers (43). For example, recent research has shown that ten autophagy-related lncRNAs possess prognostic value for glioma patients (24).Wang et al. confirmed a prognosis model consisting of nine immune-related lncRNAs in anaplastic glioma patients (44). Given the molecular diversity of glioma and the malignant manifestations of mesenchymal subtypes, it is essential to construct a prognostic model based on molecular characteristics (45).
In this work, we used bioinformatics and statistical tools to systematically analyze the prognostic accuracy of lncRNAs associated with mesenchymal subtype, similar to the construction of immune-related lncRNAs model (46). We integrated multiple MES-related lncRNAs into a single model and explored whether the model played a more important role in the prognostic evaluation of gliomas. First, 303 MES-related genes were obtained from the TCGA and Ivy GAP data sets, and 47 corresponding lncRNAs were acquired by performing co-expression analysis (47). Then, 42 differentially expressed lncRNAs were screened between LGG and GBM samples. Finally, a candidate prognosis model consisting of ten OS-related lncRNAs was constructed by performing univariate and multivariate Cox analyses. The accuracy and predictability of the model were tested and verified in TCGA and CGGA databases. The results showed that the risk score model could accurately predicted the prognosis of glioma. In clinical work, risk scores of glioma patients can be calculated based on the regression coefficients and the expression values of the ten MES-related lncRNAs, and determine whether the patient is low- or high-risk group and predict their prognosis.
Increasing evidence indicated that immune checkpoint receptor target was highly enriched in mesenchymal subtype glioma and might be a potential marker of mesenchymal subtype (17, 18). Moreover, research shows that Tumor-infiltrating immune cells (TIICs) play diverse roles in glioma and low tumor purity is related to unfavorable prognosis in glioma (48–50). Our ESTIMA TE algorithm showed high-risk group had higher stromal score, immune score, ESTIMA TE score and lower tumor purity. Regulatory T-cells (Tregs) are immunosuppressive T-cells that normally prevent autoimmunity when the human immune response is evoked. In addition, hypoxia is characteristic of tumor development and is also correlated with induction of Tregs (51). The phenotype of glioma-associated macrophages might be quite different from the other malignant solid tumors and is prone to M0-like phenotype (52). Study indicates that M2-like macrophages drove glioma Vasculogenic mimicry (VM) through amplifying IL-6 secretion in glioma cells via PKC pathway (53). Monocytes bridge innate and adaptive immune responses and can affect the tumor microenvironment through give rise to antitumor effectors and activate antigen-presenting cells (54). A negative correlation between peripheral eosinophils and glioma grade was found in one study. Numerous cytokines derived from eosinophils could regulate the immune response and affect the tumor microenvironment (55). Consistent with above conclusions, the landscape of immune infiltration indicated that T cells regulatory(Tregs), Macrophages M0 and Macrophages M2 presented higher proportions in high-risk group compared with low-risk group. The relative proportions of Monocytes and Eosinophils were significantly upregulated in the low-risk group. These results suggest that the heterogeneity of TIICs in gliomas is evident and may play a role in the malignant progression of glioma.
Next, we further explored the potential mechanisms by functional analysis. Inflammatory factors such as TNF‐α was reported to be significantly associated with the malignant progression of glioma cells and sustained activation of NFκB, which is caused by TNFα, leading to neuroblastoma recrudescence and regulation of cell invasion and metastasis (56, 57). As an inflammatory mediator, STAT5 also promotes motility and proliferation of glioma cells (58). In addition, hypoxia acquires the process of carcinogenesis and angiogenesis, which leads to the migration and invasion of glioma cell lines, and angiogenesis significantly worsens prognosis of cancer patients (59–62). Notably, hypoxia has been shown to promote EMT, which is crucial for malignant progression of tumors (63–65). Consistent with these studies, the results of GSEA showed that the high-risk group was enriched in the inflammation-related pathways and malignant biological processes such as hypoxia, angiogenesis, and EMT. Considering that the high-risk group is closely related to the malignant progression of tumors, especially the migration and invasion of cells, we selected the protective factors DGCR10 and HAR1B, and risk factor SNHG18 for migration and invasion experiments. Compared with other lncRNAs in our prognostic model, the effect of these three lncRNAs on the function of glioma cells is rarely reported. Overexpression of DGCR10 inhibits non-small cell lung cancer (NSCLC) cell migration and invasion. Moreover, DGCR10 acts as a tumor suppressor via sequestering miR-2861 in papillary thyroid carcinoma (66, 67). Research has confirmed that elevated expression of HAR1B was significant for better OS in hepatocellular carcinoma (68). High expression of SNHG18 may be a marker of poor prognosis in multiple myeloma (MM) (69). Similar to the function of these lncRNAs reported in other types of tumors, in our study, knockdown of DGCR10 and HAR1B promoted, whereas knockdown of SNHG18 inhibited the migration and invasion of glioma cells.
In summary, we screened ten MES-related lncRNAs and classified low- and high-risk groups based on the median risk score, which can be used to identify glioma patients with poor prognosis. Further GSEA and functional experiments confirmed that DGCR10, HAR1B, and SNHG18 can be potentially used as personalized biomarkers to predict treatment outcomes. In recent years, there have been many studies based on the generation of models for prediction of prognosis for glioma patients, but there have been no similar studies using MES-related lncRNAs as a prognostic model (70). We believe that these ten MES-related lncRNAs are potential prognostic markers, which will provide a good reference for cancer researchers. In order to complete a more comprehensive research, focus on the following points is required in the future. First, other well-known clinical prognostic factors that could not be obtained from the database should be the focus of research. Second, in-depth studies of the 10 MES-related lncRNAs, such as molecular mechanisms and animal experiments, are needed.
Data Availability Statement
The original contributions presented in the study are included in the article/Supplementary Material. Further inquiries can be directed to the corresponding authors.
Author Contributions
BZ and EB designed this article and provided funding support. KH and XY were responsible for software analysis and conducting experience. YZ and ZZ was responsible for collating the data and recording the experience results. MC and LL was in charge of article figure. ZC and ZY drafted the article. All authors contributed to the article and approved the submitted version.
Funding
This project was supported by the National Natural Science Foundation of China (No. 81972348), Key Research and Development Plan Project of Anhui Province (No.1804h08020270), College Excellent Youth Talent Support Program in Anhui Province (No.gxypZD2019019), Key Projects of Natural Science Research in Anhui Province (KJ2019A0267), Academic Funding Project for Top Talents in Colleges and Universities in Anhui Province (No. gxbjZD10), Nova Pew Plan of the Second Affiliated Hospital of Anhui Medical University (No.2017KA01). Open Projects of Key Laboratory in Medical Physics and Technology of Anhui Province (LHJJ202001).
Conflict of Interest
The authors declare that the research was conducted in the absence of any commercial or financial relationships that could be construed as a potential conflict of interest.
Publisher’s Note
All claims expressed in this article are solely those of the authors and do not necessarily represent those of their affiliated organizations, or those of the publisher, the editors and the reviewers. Any product that may be evaluated in this article, or claim that may be made by its manufacturer, is not guaranteed or endorsed by the publisher.
Supplementary Material
The Supplementary Material for this article can be found online at: https://www.frontiersin.org/articles/10.3389/fonc.2021.726745/full#supplementary-material
Supplementary Figure 1 | Construction of MES-related lncRNAs prognostic models in glioma patients. (A) The forest plot showing the candidate 18 MES-related lncRNAs correlated with OS by univariate Cox analysis in the TCGA data set. (B) Multivariate Cox analysis showing the 10 MES-related lncRNAs correlated with OS in the TCGA data set.
Supplementary Figure 2 | PCA between low- and high- risk groups based on the 10 MES-related lncRNAs expression profiles.
Supplementary Figure 3 | The relative expression of the remaining 7 lncRNAs contained in the prognostic model. (A) Differences in GDNF-AS1 expression between the normal and glioma groups from the TCGA and GTEX data sets. (B) Differences in CRNDE expression between the normal and glioma groups from the TCGA and GTEX data sets. (C) Differences in FAM201A expression between the normal and glioma groups from the TCGA and GTEX data sets. (D) Differences in AGAP2-AS1 expression between the normal and glioma groups from the TCGA and GTEX data sets. (E) Differences in RNF219-AS1 expression between the normal and glioma groups from the TCGA and GTEX data sets. (F) Differences in LINC00906 expression between the normal and glioma groups from the TCGA and GTEX data sets. (G) Differences in HAR1A expression between the normal and glioma groups from the TCGA and GTEX data sets. **p < 0.01; ***p < 0.001.
Supplementary Figure 4 | Knockdown of DGCR10, HAR1B, and SNHG18 impact the LN18 and U251 cell migration and invasion ability. Representative imaging (A, B) or counting (D, E) of migration assays after knockdown of DGCR10 and HAR1B in LN18 cell lines. Representative imaging (C) or counting (F) of migration assays after knockdown of SNHG18 in U251 cell lines. Representative imaging (G, H) or counting (J, K) of invasion assays after knockdown of DGCR10 and HAR1B in LN18 cell lines. Representative imaging (I) or counting (L) of invasion assays after knockdown of SNHG18 in U251 cell lines. Scale bar, 200μm; **p < 0.01; ***p < 0.001.
References
1. Fan R, Wang H, Zhang L, Ma T, Tian Y, Li H. Nanocrystallized Oleanolic Acid Better Inhibits Proliferation, Migration and Invasion in Intracranial Glioma via Caspase-3 Pathway. J Cancer (2020) 11:1949–58. doi: 10.7150/jca.38847
2. Cooper LA, Gutman DA, Chisolm C, Appin C, Kong J, Rong Y, et al. The Tumor Microenvironment Strongly Impacts Master Transcriptional Regulators and Gene Expression Class of Glioblastoma. Am J Pathol (2012) 180:2108–19. doi: 10.1016/j.ajpath.2012.01.040
3. Wang K, Huang R, Li G, Zeng F, Zhao Z, Liu Y, et al. CKAP2 Expression is Associated With Glioma Tumor Growth and Acts as a Prognostic Factor in High−Grade Glioma. Oncol Rep (2018) 40:2036–46. doi: 10.3892/or.2018.6611
4. Stupp R, Hegi ME, Mason WP, van den Bent MJ, Taphoorn MJ, Janzer RC, et al. Effects of Radiotherapy With Concomitant and Adjuvant Temozolomide Versus Radiotherapy Alone on Survival in Glioblastoma in a Randomised Phase III Study: 5-Year Analysis of the EORTC-NCIC Trial. Lancet Oncol (2009) 10:459–66. doi: 10.1016/s1470-2045(09)70025-7
5. Roos A, Ding Z, Loftus JC, Tran NL. Molecular and Microenvironmental Determinants of Glioma Stem-Like Cell Survival and Invasion. Front Oncol (2017) 7:120. doi: 10.3389/fonc.2017.00120
6. Stupp R, Mason WP, van den Bent MJ, Weller M, Fisher B, Taphoorn MJ, et al. Radiotherapy Plus Concomitant and Adjuvant Temozolomide for Glioblastoma. New Engl J Med (2005) 352:987–96. doi: 10.1056/NEJMoa043330
7. Batash R, Asna N, Schaffer P, Francis N, Schaffer M. Glioblastoma Multiforme, Diagnosis and Treatment; Recent Literature Review. Curr Med Chem (2017) 24:3002–9. doi: 10.2174/0929867324666170516123206
8. Verhaak RG, Hoadley KA, Purdom E, Wang V, Qi Y, Wilkerson MD, et al. Integrated Genomic Analysis Identifies Clinically Relevant Subtypes of Glioblastoma Characterized by Abnormalities in PDGFRA, IDH1, EGFR, and NF1. Cancer Cell (2010) 17:98–110. doi: 10.1016/j.ccr.2009.12.020
9. Barnes JM, Kaushik S, Bainer RO, Sa JK, Woods EC, Kai F, et al. A Tension-Mediated Glycocalyx-Integrin Feedback Loop Promotes Mesenchymal-Like Glioblastoma. Nat Cell Biol (2018) 20:1203–14. doi: 10.1038/s41556-018-0183-3
10. Liang Q, Guan G, Li X, Wei C, Wu J, Cheng P, et al. Profiling Pro-Neural to Mesenchymal Transition Identifies a lncRNA Signature in Glioma. J Trans Med (2020) 18:378. doi: 10.1186/s12967-020-02552-0
11. Xiao L, Wu J, Wang JY, Chung HK, Kalakonda S, Rao JN, et al. Long Noncoding RNA Uc.173 Promotes Renewal of the Intestinal Mucosa by Inducing Degradation of MicroRNA 195. Gastroenterology (2018) 154:599–611. doi: 10.1053/j.gastro.2017.10.009
12. Ulitsky I, Bartel DP. lincRNAs: Genomics, Evolution, and Mechanisms. Cell (2013) 154:26–46. doi: 10.1016/j.cell.2013.06.020
13. Chai Y, Wu HT, Liang CD, You CY, Xie MX, Xiao SW. Exosomal lncRNA ROR1-AS1 Derived From Tumor Cells Promotes Glioma Progression via Regulating miR-4686. Int J Nanomed (2020) 15:8863–72. doi: 10.2147/ijn.S271795
14. Wu DM, Wang S, Wen X, Han XR, Wang YJ, Fan SH, et al. Long Noncoding RNA Nuclear Enriched Abundant Transcript 1 Impacts Cell Proliferation, Invasion, and Migration of Glioma Through Regulating miR-139-5p/CDK6. J Cell Physiol (2019) 234:5972–87. doi: 10.1002/jcp.27093
15. Wu W, Yu T, Wu Y, Tian W, Zhang J, Wang Y. The Mir155hg/miR-185/ANXA2 Loop Contributes to Glioblastoma Growth and Progression. J Exp Clin Cancer Res: CR (2019) 38:133. doi: 10.1186/s13046-019-1132-0
16. Jiang X, Chen D. LncRNA FAM181A-AS1 Promotes Gliomagenesis by Sponging miR-129-5p and Upregulating ZRANB2. Aging (2020) 12:20069–84. doi: 10.18632/aging.103391
17. Zhang Q, Zhong H, Fan Y, Liu Q, Song J, Yao S, et al. Immune and Clinical Features of CD96 Expression in Glioma by in Silico Analysis [Published Correction Appears in Front Bioeng Biotechnol. Front Bioeng Biotechnol (2020) 8:592. doi: 10.3389/fbioe.2020.00592
18. Wang ZL, Wang Z, Li GZ, Wang QW, Bao ZS, Zhang CB, et al. Immune Cytolytic Activity Is Associated With Genetic and Clinical Properties of Glioma. Front Immunol (2019) 10:1756. doi: 10.3389/fimmu.2019.01756
19. Iwadate Y. Epithelial-Mesenchymal Transition in Glioblastoma Progression. Oncol Lett (2016) 11:1615–20. doi: 10.3892/ol.2016.4113
20. Huang da W, Sherman BT, Lempicki RA. Bioinformatics Enrichment Tools: Paths Toward the Comprehensive Functional Analysis of Large Gene Lists. Nucleic Acids Res (2009) 37:1–13. doi: 10.1093/nar/gkn923
21. Tian X, Zhu X, Yan T, Yu C, Shen C, Hong J, et al. Differentially Expressed lncRNAs in Gastric Cancer Patients: A Potential Biomarker for Gastric Cancer Prognosis. J Cancer (2017) 8:2575–86. doi: 10.7150/jca.19980
22. Liu S, Cao Q, An G, Yan B, Lei L. Identification of the 3-lncRNA Signature as a Prognostic Biomarker for Colorectal Cancer. Int J Mol Sci (2020) 21(24):9359. doi: 10.3390/ijms21249359
23. Sui J, Yang S, Liu T, Wu W, Xu S, Yin L, et al. Molecular Characterization of Lung Adenocarcinoma: A Potential Four-Long Noncoding RNA Prognostic Signature. J Cell Biochem (2019) 120:705–14. doi: 10.1002/jcb.27428
24. Luan F, Chen W, Chen M, Yan J, Chen H, Yu H, et al. An Autophagy-Related Long non-Coding RNA Signature for Glioma. FEBS Open Bio (2019) 9:653–67. doi: 10.1002/2211-5463.12601
25. Puchalski RB, Shah N, Miller J, Dalley R, Nomura SR, Yoon JG, et al. An Anatomic Transcriptional Atlas of Human Glioblastoma. Science (2018) 360(6389):660–3. doi: 10.1126/science.aaf2666
26. Shah N, Feng X, Lankerovich M, Puchalski R, Keogh B. Data From Ivy Gap. Cancer Imaging Arch (2016). doi: 10.7937/K9/TCIA.2016.XLwaN6n
27. Yoshihara K, Shahmoradgoli M, Martínez E, Vegesna R, Kim H, Torres-Garcia W, et al. Inferring Tumour Purity and Stromal and Immune Cell Admixture From Expression Data. Nat Commun (2013) 4:2612. doi: 10.1038/ncomms3612
28. Shannon P, Markiel A, Ozier O, Baliga NS, Wang JT, Ramage D, et al. Cytoscape: A Software Environment for Integrated Models of Biomolecular Interaction Networks. Genome Res (2003) 13(11):2498–504. doi: 10.1101/gr.1239303
29. Xia P, Li Q, Wu G, Huang Y. An Immune-Related lncRNA Signature to Predict Survival In Glioma Patients. Cell Mol Neurobiol (2020) 41(2):365–75. doi: 10.1007/s10571-020-00857-8
30. Balachandran VP, Gonen M, Smith JJ, DeMatteo RP. Nomograms in Oncology: More Than Meets the Eye. Lancet Oncol (2015) 16:e173–80. doi: 10.1016/s1470-2045(14)71116-7
31. Wirsching HG, Galanis E, Weller M. Glioblastoma. Handb Clin Neurol (2016) 134:381–97. doi: 10.1016/b978-0-12-802997-8.00023-2
32. Martens-Uzunova ES, Böttcher R, Croce CM, Jenster G, Visakorpi T, Calin GA. Long Noncoding RNA in Prostate, Bladder, and Kidney Cancer. Eur Urol (2014) 65:1140–51. doi: 10.1016/j.eururo.2013.12.003
33. Phillips HS, Kharbanda S, Chen R, Forrest WF, Soriano RH, Wu TD, et al. Molecular Subclasses of High-Grade Glioma Predict Prognosis, Delineate a Pattern of Disease Progression, and Resemble Stages in Neurogenesis. Cancer Cell (2006) 9:157–73. doi: 10.1016/j.ccr.2006.02.019
34. Kwon SM, Kang SH, Park CK, Jung S, Park ES, Lee JS, et al. Recurrent Glioblastomas Reveal Molecular Subtypes Associated With Mechanistic Implications of Drug-Resistance. PloS One (2015) 10:e0140528. doi: 10.1371/journal.pone.0140528
35. Wood MD, Reis GF, Reuss DE, Phillips JJ. Protein Analysis of Glioblastoma Primary and Posttreatment Pairs Suggests a Mesenchymal Shift at Recurrence. J Neuropathol Exp Neurol (2016) 75:925–35. doi: 10.1093/jnen/nlw068
36. Yoon SJ, Shim JK, Chang JH, Moon JH, Roh TH, Sung KS, et al. Tumor Mesenchymal Stem-Like Cell as a Prognostic Marker in Primary Glioblastoma. Stem Cells Int (2016) 2016:6756983. doi: 10.1155/2016/6756983
37. Bhat KPL, Balasubramaniyan V, Vaillant B, Ezhilarasan R, Hummelink K, Hollingsworth F, et al. Mesenchymal Differentiation Mediated by NF-κb Promotes Radiation Resistance in Glioblastoma. Cancer Cell (2013) 24:331–46. doi: 10.1016/j.ccr.2013.08.001
38. Zhu Y, Luo C, Korakkandan AA, Fatma YHA, Tao Y, Yi T, et al. Function and Regulation Annotation of Up-Regulated Long non-Coding RNA LINC01234 in Gastric Cancer. J Clin Lab Anal (2020) 34:e23210. doi: 10.1002/jcla.23210
39. Zhao L, Wang J, Li Y, Song T, Wu Y, Fang S, et al. NONCODEV6: An Updated Database Dedicated to Long non-Coding RNA Annotation in Both Animals and Plants. Nucleic Acids Res (2021) 49:D165–71. doi: 10.1093/nar/gkaa1046
40. Hong W, Ying H, Lin F, Ding R, Wang W, Zhang M. lncRNA LINC00460 Silencing Represses EMT in Colon Cancer Through Downregulation of ANXA2 via Upregulating miR-433-3p. Mol Ther Nucleic Acids (2020) 19:1209–18. doi: 10.1016/j.omtn.2019.12.006
41. Gong W, Zheng J, Liu X, Ma J, Liu Y, Xue Y. Knockdown of NEAT1 Restrained the Malignant Progression of Glioma Stem Cells by Activating microRNA Let-7e. Oncotarget (2016) 7:62208–23. doi: 10.18632/oncotarget.11403
42. Zheng J, Li XD, Wang P, Liu XB, Xue YX, Hu Y, et al. CRNDE Affects the Malignant Biological Characteristics of Human Glioma Stem Cells by Negatively Regulating miR-186. Oncotarget (2015) 6:25339–55. doi: 10.18632/oncotarget.4509
43. Jeanmougin M, Håvik AB, Cekaite L, Brandal P, Sveen A, Meling TR, et al. Improved Prognostication of Glioblastoma Beyond Molecular Subtyping by Transcriptional Profiling of the Tumor Microenvironment. Mol Oncol (2020) 14:1016–27. doi: 10.1002/1878-0261.12668
44. Sun Z, Jing C, Xiao C, Li T. An Autophagy-Related Long non-Coding RNA Prognostic Signature Accurately Predicts Survival Outcomes in Bladder Urothelial Carcinoma Patients. Aging (2020) 12:15624–37. doi: 10.18632/aging.103718
45. Yerukala Sathipati S, Sahu D, Huang HC, Lin Y, Ho SY. Identification and Characterization of the lncRNA Signature Associated With Overall Survival in Patients With Neuroblastoma. Sci Rep (2019) 9:5125. doi: 10.1038/s41598-019-41553-y
46. Lemetre C, Vieites B, Ng CK, Piscuoglio S, Schultheis AM, Marchiò C, et al. RNASeq Analysis Reveals Biological Processes Governing the Clinical Behaviour of Endometrioid and Serous Endometrial Cancers. Eur J Cancer (Oxford England: 1990) (2016) 64:149–58, 64. doi: 10.1016/j.ejca.2016.05.028
47. Zhou M, Zhang Z, Zhao H, Bao S, Cheng L, Sun J. An Immune-Related Six-lncRNA Signature to Improve Prognosis Prediction of Glioblastoma Multiforme. Mol Neurobiol (2018) 55:3684–97. doi: 10.1007/s12035-017-0572-9
48. Dunn GP, Bruce AT, Ikeda H, Old LJ, Schreiber RD. Cancer Immunoediting: From Immunosurveillance to Tumor Escape. Nat Immunol (2002) 3(11):991–8. doi: 10.1038/ni1102-991
49. Silver DJ, Sinyuk M, Vogelbaum MA, Ahluwalia MS, Lathia JD. The Intersection of Cancer, Cancer Stem Cells, and the Immune System: Therapeutic Opportunities. Neuro Oncol (2016) 18(2):153–9. doi: 10.1093/neuonc/nov157
50. Zhang C, Cheng W, Ren X, Wang Z, Liu X, Li G, et al. Tumor Purity as an Underlying Key Factor in Glioma. Clin Cancer Res (2017) 23(20):6279–91. doi: 10.1158/1078-0432.CCR-16-2598
51. Ooi YC, Tran P, Ung N, Thill K, Trang A, Fong BM, et al. The Role of Regulatory T-Cells in Glioma Immunology. Clin Neurol Neurosurg (2014) 119:125–32. doi: 10.1016/j.clineuro.2013.12.004
52. Huang L, Wang Z, Chang Y, Wang K, Kang X, Huang R, et al. EFEMP2 Indicates Assembly of M0 Macrophage and More Malignant Phenotypes of Glioma. Aging (Albany NY) (2020) 12(9):8397–412. doi: 10.18632/aging.103147
53. Zhang L, X u Y, Sun J, Chen W, Zhao L, Ma C, et al. M2-Like Tumor-Associated Macrophages Drive Vasculogenic Mimicry Through Amplification of IL-6 Expression in Glioma Cells. Oncotarget (2017) 8(1):819–32. doi: 10.18632/oncotarget.13661
54. Ugel S, Canè S, De Sanctis F, Bronte V. Monocytes in the Tumor Microenvironment. Annu Rev Pathol (2021) 16:93–122. doi: 10.1146/annurev-pathmechdis-012418-013058
55. Huang Z, Wu L, Hou Z, Zhang P, Li G, Xie J. Eosinophils and Other Peripheral Blood Biomarkers in Glioma Grading: A Preliminary Study. BMC Neurol (2019) 19(1):313. doi: 10.1186/s12883-019-1549-2
56. Kong L, Wu Q, Zhao L, Ye J, Li N, Yang H. Identification of Messenger and Long Noncoding RNAs Associated With Gallbladder Cancer via Gene Expression Profile Analysis. J Cell Biochem (2019) 120:19377–87. doi: 10.1002/jcb.28953
57. Aravindan S, Natarajan M, Herman TS, Aravindan N. Radiation-Induced Tnfα Cross Signaling-Dependent Nuclear Import of Nfκb Favors Metastasis in Neuroblastoma. Clin Exp Metastasis (2013) 30:807–17. doi: 10.1007/s10585-013-9580-y
58. Feng Y, Wang J, Tan D, Cheng P, Wu A. Relationship Between Circulating Inflammatory Factors and Glioma Risk and Prognosis: A Meta-Analysis. Cancer Med (2019) 8:7454–68. doi: 10.1002/cam4.2585
59. Feng C, Cao S. Activation of STAT5 Contributes to Proliferation in U87 Human Glioblastoma Multiforme Cells. Mol Med Rep (2014) 10:203–10. doi: 10.3892/mmr.2014.2223
60. Elstner A, Holtkamp N, von Deimling A. Involvement of Hif-1 in Desferrioxamine-Induced Invasion of Glioblastoma Cells. Clin Exp Metastasis (2007) 24:57–66. doi: 10.1007/s10585-007-9057-y
61. Lebelt A, Dziecioł J, Guzińska-Ustymowicz K, Lemancewicz D, Zimnoch L, Czykier E. Angiogenesis in Gliomas. Folia Histochem Cytobiol (2008) 46:69–72. doi: 10.2478/v10042-008-0009-4
62. Onishi M, Ichikawa T, Kurozumi K, Date I. Angiogenesis and Invasion in Glioma. Brain Tumor Pathol (2011) 28:13–24. doi: 10.1007/s10014-010-0007-z
63. Qi L, Wang ZY, Shao XR, Li M, Chen SN, Liu XQ, et al. ISL2 Modulates Angiogenesis Through Transcriptional Regulation of ANGPT2 to Promote Cell Proliferation and Malignant Transformation in Oligodendroglioma. Oncogene (2020) 39:5964–78. doi: 10.1038/s41388-020-01411-y
64. Xi Y, Wei Y, Sennino B, Ulsamer A, Kwan I, Brumwell AN, et al. Identification of Py654-β-Catenin as a Critical Co-Factor in Hypoxia-Inducible Factor-1α Signaling and Tumor Responses to Hypoxia. Oncogene (2013) 32:5048–57. doi: 10.1038/onc.2012.530
65. Behnan J, Stangeland B, Hosainey SA, Joel M, Olsen TK, Micci F, et al. Differential Propagation of Stroma and Cancer Stem Cells Dictates Tumorigenesis and Multipotency. Oncogene (2017) 36:570–84. doi: 10.1038/onc.2016.230
66. Dongre A, Weinberg RA. New Insights Into the Mechanisms of Epithelial-Mesenchymal Transition and Implications for Cancer. Nat Rev Mol Cell Biol (2019) 20:69–84. doi: 10.1038/s41580-018-0080-4
67. Chen F, Yin S, Zhu J, Liu P, Yang C, Feng Z, et al. lncRNA DGCR5 Acts as a Tumor Suppressor in Papillary Thyroid Carcinoma via Sequestering miR-2861. Exp Ther Med (2019) 17:895–900. doi: 10.3892/etm.2018.7012
68. He Z, Long J, Yang C, Gong B, Cheng M, Wang Q, et al. LncRNA DGCR5 Plays a Tumor-Suppressive Role in Glioma via the miR-21/Smad7 and miR-23a/PTEN Axes. Aging (2020) 12:20285–307. doi: 10.18632/aging.103800
69. Shi Z, Luo Y, Zhu M, Zhou Y, Zheng B, Wu D, et al. Expression Analysis of Long Non-Coding RNA HAR1A and HAR1B in HBV-Induced Hepatocullular Carcinoma in Chinese Patients. Lab Med (2019) 50:150–7. doi: 10.1093/labmed/lmy055
Keywords: mesenchymal, lncRNA, prognosis, glioma, TCGA, CGGA, immune
Citation: Huang K, Yue X, Zheng Y, Zhang Z, Cheng M, Li L, Chen Z, Yang Z, Bian E and Zhao B (2021) Development and Validation of an Mesenchymal-Related Long Non-Coding RNA Prognostic Model in Glioma. Front. Oncol. 11:726745. doi: 10.3389/fonc.2021.726745
Received: 17 June 2021; Accepted: 16 August 2021;
Published: 03 September 2021.
Edited by:
Haotian Zhao, New York Institute of Technology, United StatesReviewed by:
Zaixiang Tang, Soochow University Medical College, ChinaJiye Li, Capital Institute of Pediatrics, China
Copyright © 2021 Huang, Yue, Zheng, Zhang, Cheng, Li, Chen, Yang, Bian and Zhao. This is an open-access article distributed under the terms of the Creative Commons Attribution License (CC BY). The use, distribution or reproduction in other forums is permitted, provided the original author(s) and the copyright owner(s) are credited and that the original publication in this journal is cited, in accordance with accepted academic practice. No use, distribution or reproduction is permitted which does not comply with these terms.
*Correspondence: Erbao Bian, YXlkYmViQDEyNi5jb20=; Bing Zhao, YXlkemhiQDEyNi5jb20=
†These authors have contributed equally to this work and share first authorship