 Guiling Ding1,2
 Meng Guo3
 Yelin Yang2
 Chen Sun2Shengyong Wu4Xingchen Liu2Jin Wang2Hui Jiang2*
 Yanfang Liu2*Jianming Zheng2*
- 1Department of Pathology, Shanghai General Hospital Affiliated to Shanghai Jiaotong University, Shanghai, China
- 2Department of Pathology, Changhai Hospital Affiliated to Navy Medical University (Second Military Medical University), Shanghai, China
- 3National Key Laboratory of Medical Immunology & Institute of Immunology, Naval Medical University (Second Military Medical University), Shanghai, China
- 4Department of Health Statistics, Naval Medical University (Second Military Medical University), Shanghai, China
Pancreatic ductal adenocarcinoma (PDAC) is a highly malignant tumor and is insensitive to radiotherapy and chemotherapy, as it is highly correlated with its complex tumor microenvironment (TME). A comprehensive description of PDAC’s immune microenvironment at the pathological level has not been reported, thus limiting its treatment. Previous studies have shown that large-section histopathology (LSH) can reveal the complete structure and margin of the tumor on a single slice and effectively reflect intratumoral heterogeneity. LSH, as opposed to classic small-section histopathology (SSH), can also be used to explore the infiltration state of immune cells in different regions. In the current study, EnVision immunohistochemical staining was used to explore the panoramic distribution of CD4-, CD8-, CD15-, CD20-, and CD56 (surface markers of helper T cells, cytotoxic T cells, neutrophils, B cells, and NK cells, respectively)-positive cells in 102 pairs of paraffin wax-embedded PDAC samples (LSH vs SSH) for the first time. These indicators were then analyzed, and correlations of clinicopathological characteristics with clinical prognoses were analyzed. The findings of this study show that LSH can effectively indicate more immune cells than SSH. Upregulated CD4, CD8, CD20, and CD56 or downregulated CD15 was correlated with a good prognosis in PDAC patients. However, analysis of SSH showed that only upregulated CD4 and CD8 can be used as indicators of a good prognosis. Multivariate Cox regression analysis showed that 7 variables, namely, pTNM stage (P=0.002), PDL1 expression (P=0.001), CDX2 expression (P=0.008), DPC4 expression (P=0.004), CD4 expression in LSH (P<0.001), CD8 expression in LSH (P=0.010) and CD15 expression in LSH (P=0.031), were significantly correlated with the prognosis of PDAC patients. The findings of this study indicate that LSH is an effective tool for a panoramic assessment of the immune microenvironment in pancreatic cancer patients.
Introduction
Pancreatic ductal adenocarcinoma (PDAC) is associated with a high mortality rate and has a 5-year survival rate of less than 9% (1). Multidisciplinary surgical procedures (2), adjuvant and neoadjuvant therapies (3), and combined immunotherapy (4) are ineffective in the treatment of PDAC, partly because of its unique tumor microenvironment (TME). Pancreatic cancer contains several stromal cells with poor-quality angiogenesis and is accompanied by sustained hypoxia in the tumor, in contrast to other solid tumors. This special metabolic environment induces highly malignant tumor clones and causes nutrient depletion and metabolite accumulation in the microenvironment. The distribution and function of immune cells are affected by their interactions with other cellular components, resulting in an immunosuppressive microenvironment (5). Therefore, a panoramic view of immune cell composition in the TME is important for evaluating the prognosis of PDAC and for developing postoperative treatment strategies.
The composition of immune cells in the microenvironment of pancreatic cancer is complex and varies significantly among patients. Previous studies have shown that the infiltration of CD4+ T cells and CD8+ T cells in the microenvironment is associated with an excellent prognosis (6). In addition, Th1 cells among CD4+ T cells can activate CD8+ cytotoxic T lymphocytes (CTLs), thus stimulating the immune system to suppress tumor progression (5). Furthermore, NK cell infiltration indicates a good prognosis in PDAC patients (7). Tumors that escape T cell surveillance by downregulating MHC-I molecules after radiotherapy and chemotherapy can be killed by NK cells through the missing self recognition mechanism (8), which is an important process involved in tumor immunosurveillance. In addition, NK cells can kill tumor cells through an antibody-dependent cell-mediated cytotoxicity (ADCC) pathway by binding to tumor-related antibodies (8). Currently, the role of B cells in the microenvironment of pancreatic cancer is controversial. For example, a previous study reported that B cells can directly recognize tumor antigens and produce tumor-related antibodies that kill tumor cells by activating the complement system or by inducing ADCC effects (9). However, the sustained action of tumor-related antibodies can mediate the modulation of tumor antigens and facilitate tumor immune escape (10). The role of neutrophils in the microenvironment of pancreatic cancer is also controversial. Studies have shown that neutrophils inhibit tumor growth by releasing reactive oxygen species and reactive nitrogen species, promoting T cell activation, recruiting M1 macrophages, and activating ADCC effects (11). In addition, neutrophils can promote tumor growth by releasing matrix metalloproteinase 9, inhibiting NK cell activity, inducing CD8+ T cell apoptosis in the microenvironment, and recruiting Tregs (11). This current study focused on the role of CD4+ helper T cells, CD8+ cytotoxic T cells, CD15+ neutrophils, CD20+ B cells, and CD56+ NK cells in the TME.
Several techniques, such as the application of deconvolution algorithms to analyze RNA-seq data in tumor tissues (12), single-cell sequencing (13), spatial transcriptomics (14), and mass cytometry (15), have been used to explore immune cells in the TME. However, these techniques can be used on only local/target tumor samples, which may introduce biases owing to the different sampling sites of the pancreatic cancer. In the current study, large-section histopathology (LSH) refers to slices measuring 7.5 cm×5 cm×4 µm after processing large paraffin blocks utilizing a large format microtome, a large format cassette, and a large glass slide. The LSH technology prototype was initially used to study brain tumor pathology in the 1970s (16). However, the application of traditional LSH technology is limited by factors such as operation difficulties, a long production cycle, a complex process, high cost, and poor slice quality. New LSH techniques have been developed in recent years. These new techniques are effective in a variety of tumors, including breast cancer (17), prostate cancer (18), colorectal cancer (19), and oral squamous cell carcinoma (20). LSH can effectively present normal, diseased, and adjacent tissues, as well as multiple cutting edges on a slice. Therefore, LSH allows the better observation of lesions and a more objective and comprehensive evaluation than small-section histopathology (SSH). In addition, LSH findings can be compared with CT image findings, thus improving the overall understanding of this disease. In the present study, the use of the LSH technology system in pancreatic cancer was explored. CD4-, CD8-, CD15-, CD20-, and CD56-positive cell infiltration was detected in paired paraffin-embedded PDAC samples (LSH vs SSH) and was further correlated with clinical prognosis. Furthermore, a nomogram model was constructed to assess the survival rates of PDAC patients.
Materials and Methods
Preparation of Tissue Samples and Collection of Clinicopathological Data
A total of 102 specimens were obtained after radical resection of pancreatic cancer tissues at the General Surgery Department of Changhai Hospital Affiliated to the Second Military Medical University between August 2018 and January 2019. Patients included in this study did not receive any adjuvant treatment prior to surgery. All specimens were fixed with 10% neutral formalin, and biopsy samples were collected. Specimens were then divided into paired LSH (size 7.5 cm×5 cm×4 µm) and SSH (size 3.2 cm×2.4 cm×4 µm) samples. All patients, including 58 males and 44 females, aged between 28-82 years, with a median age of 63 years, were diagnosed with primary PDAC by senior pathologists. Data on 19 clinicopathological parameters, namely, gender, age, tumor location, tumor diameter, tumor differentiation degree, T, N and pTNM stage (TNM stage according to the 8th edition of the American Joint Committee on Cancer (AJCC) staging system) (21), with or without peripancreatic lymph node metastases, number of peripancreatic lymph node metastases, with or without total lymph node metastases, number of total lymph node metastases, with or without neural invasion, with or without vascular tumor thrombus, with or without postoperative recurrence and metastases, and with or without postoperative chemoradiotherapy, and the levels of PDL1, CDX2 and DPC4 expression were recorded. Follow-up information was obtained using an electronic medical recording system and short messages. Follow-up started on the day after the operation and ended on October 31, 2020. Overall survival (OS) was defined as the time interval between the first day after the operation to death due to any cause or termination of follow-up. All participants signed an informed consent form prior to inclusion. This study was approved by the Ethics Committee of Changhai Hospital Affiliated to the Second Military Medical University.
Immunohistochemistry (IHC) and Multiple Immunohistochemistry (mIHC) Analyses
All 102 specimens from PDAC patients were analyzed by IHC at the pathology department using the Envision method. PBS was used instead of the primary antibody as a negative control, and a known positive section was used as a positive control. Four-micrometer-thick whole-tissue wax sections were deparaffinized twice with xylene. Slices were then hydrated with 100, 95, and 85% ethanol and PBS (pH=7.3). Slices were incubated in preboiled EDTA (pH=8.0) at a high temperature and high pressure for antigen retrieval for 10 minutes. The heat source was immediately withdrawn followed by cooling to room temperature. Slices were placed in 3% H2O2 for 15 minutes to block endogenous peroxidase. The primary antibody was added to the sections in a wet box, followed by overnight incubation at 4°C. The secondary antibody was then added to the reaction, followed by 30 minutes of incubation at room temperature. Finally, tissues were counterstained with DAB, and nuclei were stained with hematoxylin. Sections were washed with PBS (pH=7.3) between all steps. The primary antibodies used in this study included those against CD4 (SP35), CD8 (SP16), CD15 (MMA), CD20 (L26), and CD56 (123C3.D5), all purchased from Fuzhou Maxin Biotechnologies Development Co., Ltd., and those against PDL1 (SP142), CDX2 (EP25), and DPC4 (B-8), all purchased from Beijing Zhongshan Jinqiao Biotechnology Co., Ltd. The DAB color kit (ZLI-9019) and secondary antibodies (goat anti-mouse/rabbit IgG polymer) were also purchased from Beijing Zhongshan Jinqiao Biotechnology Co., Ltd. (Table 1).
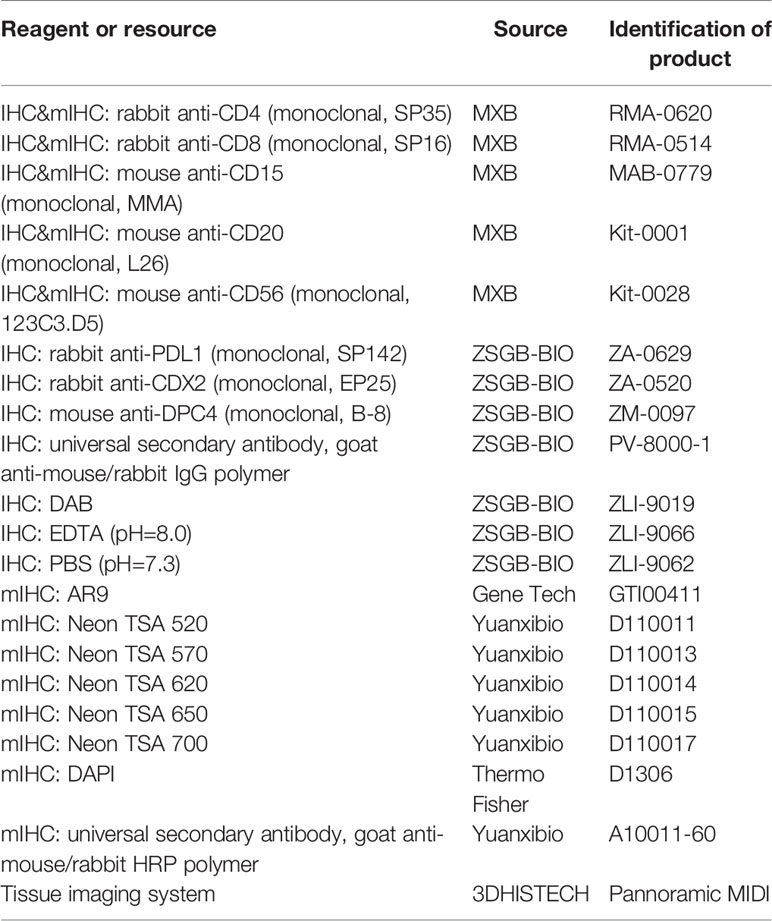
Table 1 Main reagents and instruments.
mIHC staining was performed on 6 PDAC whole-tissue wax sections as follows. Four-micrometer-thick sections were deparaffinized, and antigen retrieval was performed as described for immunohistochemical analysis. Sections were incubated with standard primary antibodies, followed by the secondary antibody, using a TSA 6-color kit for mIHC. Sections were then counterstained with DAPI. Stained sections were dried at room temperature before image analysis. Sections were treated with 3% hydrogen peroxide solution to cover the sample area after deparaffinization and antigen retrieval. Sections were then incubated for 30 minutes with a mouse anti-CD20 antibody (L26, MXB). Furthermore, sections were incubated for 10 minutes with a goat anti-mouse/rabbit horseradish peroxidase (HRP) secondary antibody (#A10011-60, Yuanxibio). After incubation with antibodies, sections were flooded with Neon-TSA520 fluorescent solution and then incubated for 10 minutes at room temperature following the manufacturer’s instructions. Finally, sections were washed using TBST buffer and immediately transferred to preheated EDTA (90°C). Sections were heated at 20% power in a microwave oven for 15 minutes and then cooled to room temperature. Sections were thoroughly washed with Tris buffer between all steps. The process was repeated using the following antibodies/fluorescent dyes, in order: rabbit anti-CD4 (SP35, MXB)/TSA570, rabbit anti-CD8 (SP16, MXB)/TSA620, mouse anti-CD15 (MMA, MXB)/TSA650, and mouse anti CD56 (123C3. D5, MXB)/TSA700. DAPI (D1306, Thermo Fisher) was used to counterstain the cell nucleus. Sections were sealed on cover glass using transparent nail polish, dried at room temperature, and then photographed with a Pannoramic MIDI tissue imaging system (3DHISTECH). The results were analyzed using INDICA HALO software (Table 1).
Interpretation of IHC and mIHC Results
Tumor regions (including neoplastic glands and neoplastic stroma) were used to evaluate LSH or SSH rather than normal tissue adjacent to the tumor. The evaluation criteria for each column of immune cells were as follows: upregulation of CD4, CD8, CD20, and CD56 in the cell membranes of infiltrating immune cells in the TME and upregulation of CD15 in the cytoplasm or cell membrane. To quantify the immune cell populations in LSH and SSH, a full scan of the immunohistochemically stained LSH and SSH samples was performed, and then a third-party senior pathologist who had no interest in this study first conducted a full-field double-blind observation of the infiltrated immune cells in LSH and SSH samples under a low-power microscope. During the process of reading the whole tissue section, the pathologist found different spatial distributions in five types of immune cells (tumor center, tumor margin, tumor stroma), and none were completely limited to one region (e.g., completely confined to the tumor margin). The pathologist also consulted and referenced relevant literature and then obtained images of 3-6 selected areas with abundant immune cell infiltrates under a high-power field (22). The images were then imported into ImageJ software for objective counting. The total and average numbers of the five types of immune cells were calculated separately under a high-power field (22). Cells were divided into high and low expression groups based on the median expression level. PDL1 is expressed in the membrane and cytoplasm of cancer cells. A value ≥5% was defined as positive (23). On the other hand, CDX2 is expressed in the nucleus of cancer cells. The expression of CDX2 was considered positive when the percentage of positive cells was >1% (24). DPC4 was rated as positive when more than 5% of the cells in the tumor tissue showed cytoplasmic/nuclear staining (25). HALO software was used to analyze the mIHC results and the number and percentage of positive cells in the whole section after scanning the whole slice on a 3DHISTECH scanner.
Statistical Analysis
Statistical analyses were performed using IBM SPSS 22.0 and GraphPad Prism 8.0.2 software. A t-test was used to analyze normally distributed and homogeneous variables; otherwise, a nonparametric test was used. Chi-square or adjusted chi-square tests or Fisher’s exact probability tests were used to analyze classified variables. Measurement data were grouped by the median, whereas classified variables were grouped by category. The Kaplan-Meier method and log-rank test were used to analyze “time to endpoints”, whereas the Cox proportional hazards model was adopted for univariate and multivariate analyses. Finally, the “survival”, “rms”, “Hmisc”, “ggplot2”, and “timeROC” packages in R language version 4.0.4 were used to construct and verify a nomogram model of PDAC prognosis. P values <0.05 were considered statistically significant.
Results
Distribution and Expression of CD4, CD8, CD15, CD20, CD56, PDL1, CDX2, and DPC4 in PDAC
To assess whether there were any differences in the detection of CD4, CD8, CD15, CD20, and CD56 by LSH and SSH, we analyzed and compared the expression levels of these markers across the respective panoramic images (Supplementary Figures 1 and 2) after IHC staining. Both LSH and SSH successfully revealed cells expressing CD4, CD8, CD15, CD20, and CD56 (Figure 1A). LSH (Supplementary Figure 3) better represented the panoramic information of the original tumor and completely present normal, diseased, and adjacent tissues, as well as multiple related cutting edges on a slice. Consequently, compared with SSH (Supplementary Figure 3), LSH not only conferred better visualization of lesions and a more objective and comprehensive evaluation but also provided more abundant spatial location information on immune cells. However, there was little difference in the distribution of immune cells between the two groups observed under the microscope. In LSH and SSH, CD4+ T cells often gathered around neoplastic glands or between neoplastic glands and stroma, CD8+ T cells were often densely clustered in the stroma far away from neoplastic glands or scattered around neoplastic glands to a small extent, CD15+ neutrophils were mostly scattered in the stroma or partially gathered around neoplastic glands, CD20+ B cells were often distributed in clusters around the neoplastic glands or scattered in the stroma, and CD56+ NK cells were often sparsely distributed in the stroma or near the neoplastic glands very few. A paired-sample Wilcoxon signed-rank test revealed significantly higher expression of the five immune cell markers in the LSH group than in the SSH group (P<0.001) (Figure 1B). Multiple immunohistochemical staining of PDAC whole tissue sections revealed coexpression of the 5 immune cell types in the TME, although their concentrations were differentially distributed across regions. In addition, these immune cells were not colocalized in the same area. Among them, CD4 (14.97%), CD8 (11.7%), and CD15 (17.2%) had higher proportions than CD20 (1.18%) and CD56 (0.8%) (Figure 1A). The rates of PDL1, CDX2, and DPC4 expression in whole tissue sections of the 102 PDAC specimens were 5.9, 11.8, and 6.9%, respectively (Figure 1C).
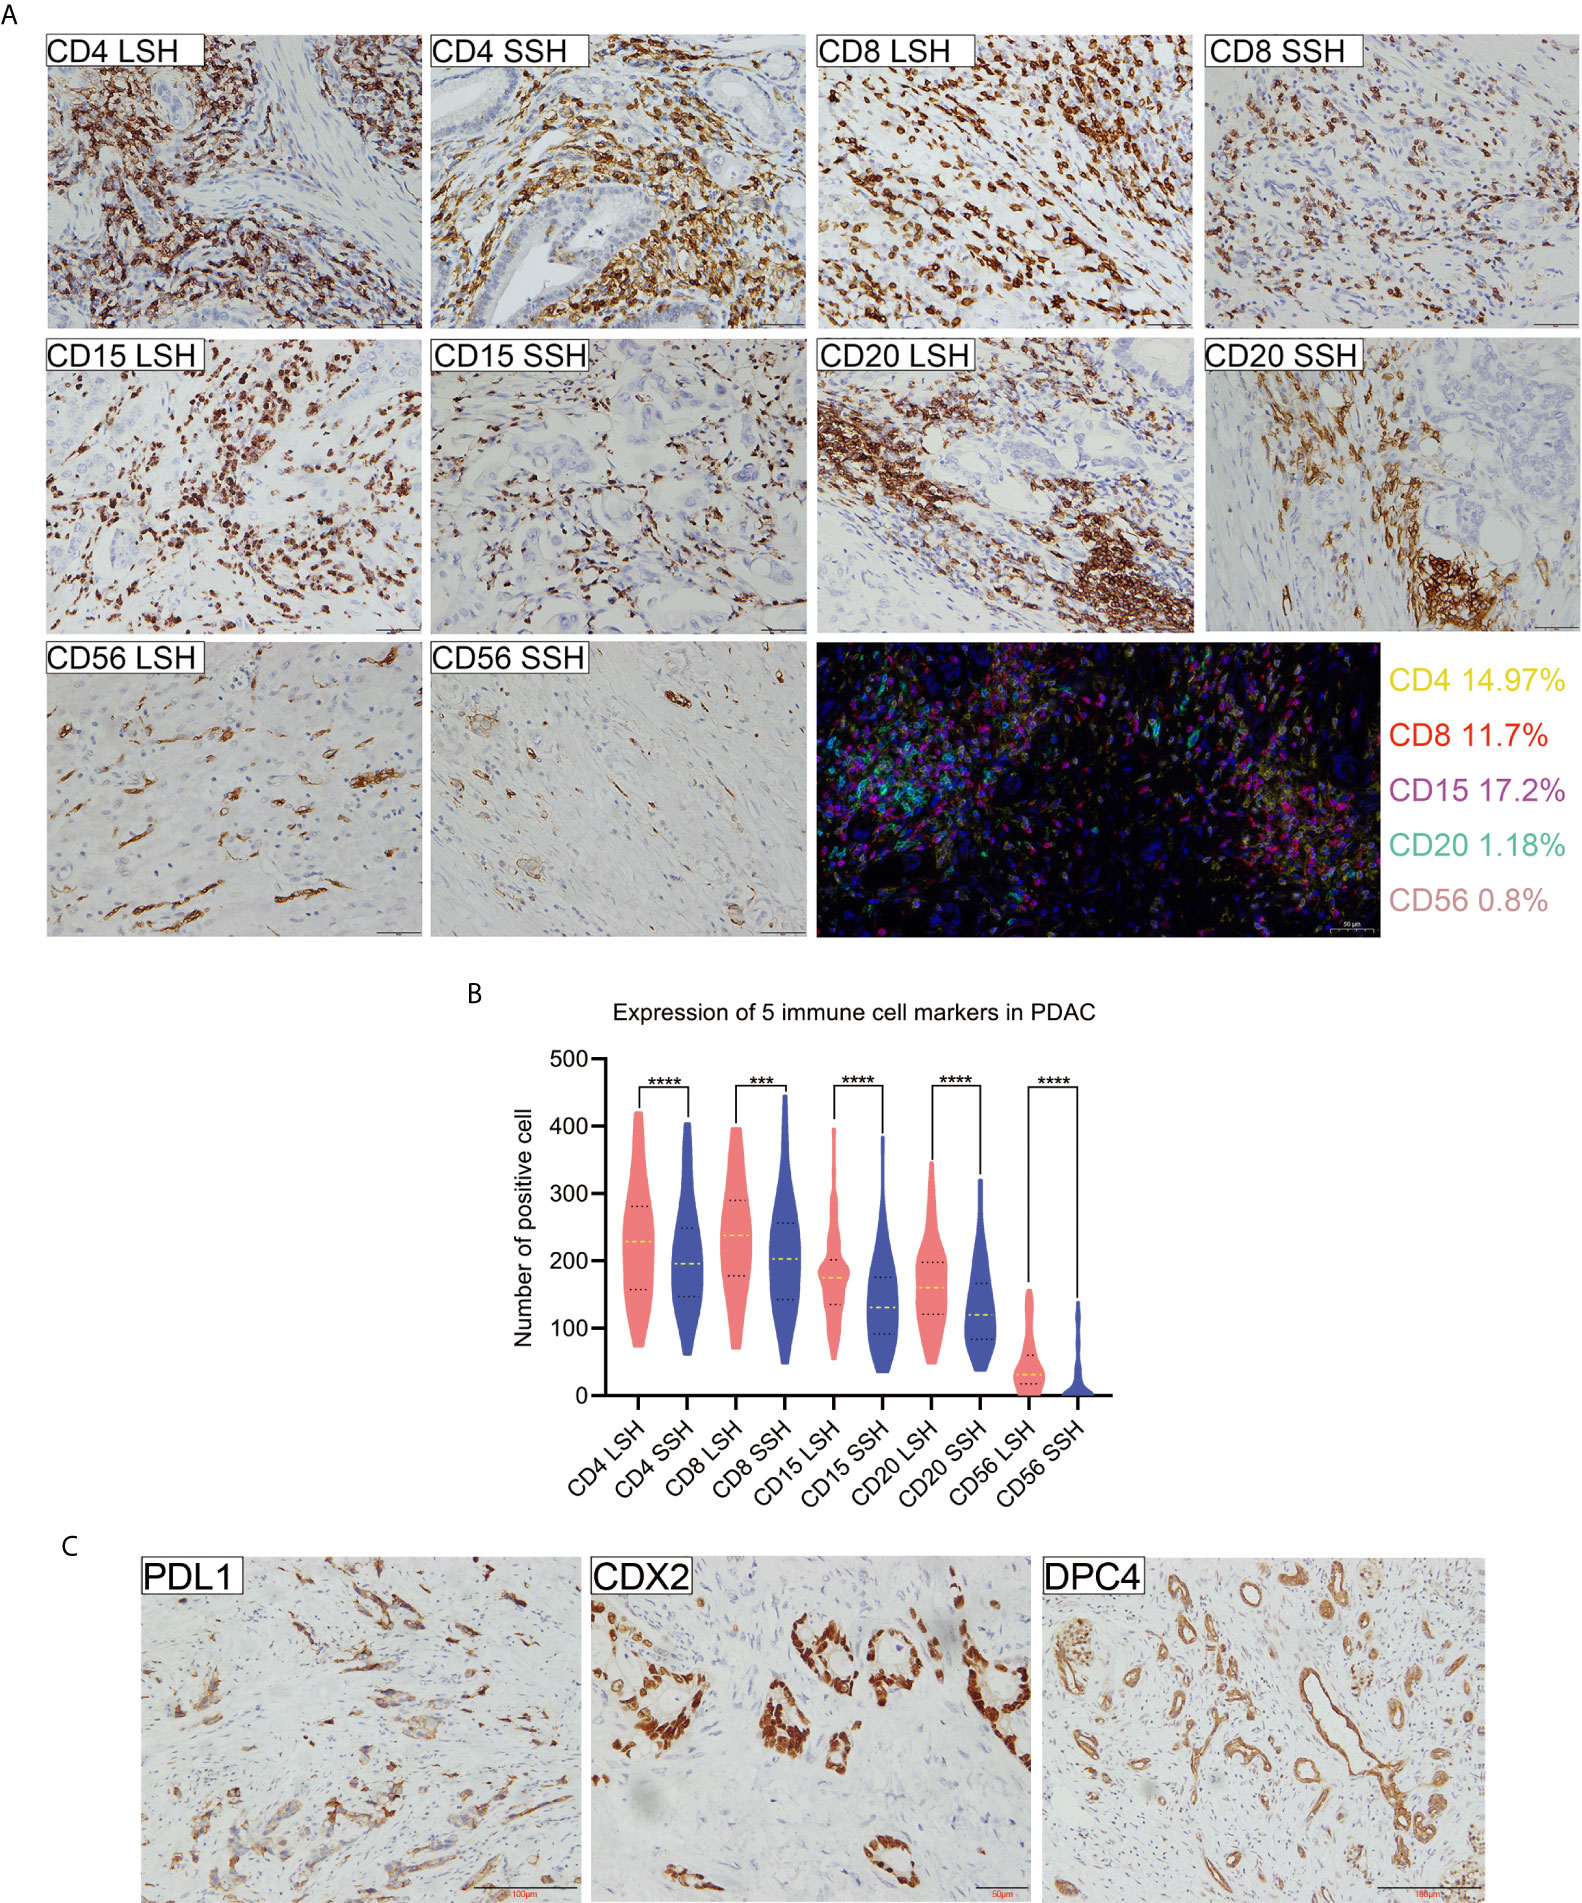
Figure 1 Expression profiles of 5 immune cell markers and PDL1, CDX2, and DPC4 in PDAC specimens. (A) Patterns of positive expression of CD4, CD8, CD15, CD20, and CD56 in LSH and SSH (scale bar=50 μm) and colocalization of 5 types of immune cells present in the TME of pancreatic head ductal adenocarcinoma in a 50-year-old man based on multiple immunohistochemical staining. Basic information of patients corresponding to CD4, CD8, CD15, CD20, and CD56 levels (LSH vs SSH): a 72-year-old man, a 61-year-old man, and a 66-year-old woman with a tumor located in the head of pancreas and a 54-year-old woman and a 67-year-old man with a tumor located in the tail of pancreas, respectively. (B) The expression levels of five immune cell markers were significantly higher in LSH than in SSH group (***P=0.0002, ****P<0.0001). (C) PDL1, CDX2, and DPC4 expression in PDAC. Basic information of patients corresponding to CDX2, DPC4, and PDL1 levels: a 50-year-old man with a tumor located in the head of the pancreas and a 66-year-old man and a 60-year-old man with a tumor located in the tail of the pancreas, respectively. CD4LSH and CD4SSH represent the levels of CD4 expression in LSH and SSH, respectively, and other abbreviations can be deduced by analogy. PDAC, pancreatic ductal adenocarcinoma.
Expression of Immune Markers Is Correlated With Clinicopathological Characteristics
We used a chi-square test to explore differences between the expression of the five immune cell markers and the clinicopathological features of PDAC in 102 patients based on LSH and SSH. Based on LSH, CD4 expression was significantly associated with tumor location (P=0.045), tumor differentiation (P=0.007), vascular tumor thrombus (P=0.008), postoperative chemoradiotherapy (P=0.017), and CDX2 expression (P=0.011) in PDAC patients. On the other hand, CD8 expression exhibited a significant correlation with postoperative chemoradiotherapy (P=0.013) and PDL1 expression (P=0.035), whereas CD15 expression was significantly associated with the pTNM stage of PDAC (P=0.029). Moreover, CD20 expression was significantly correlated with tumor location (P=0.007), tumor differentiation (P=0.005), and CDX2 expression (P=0.014) in PDAC patients. Conversely, we found no significant correlation between CD56 expression and any of the clinicopathological characteristics of PDAC (Table 2).
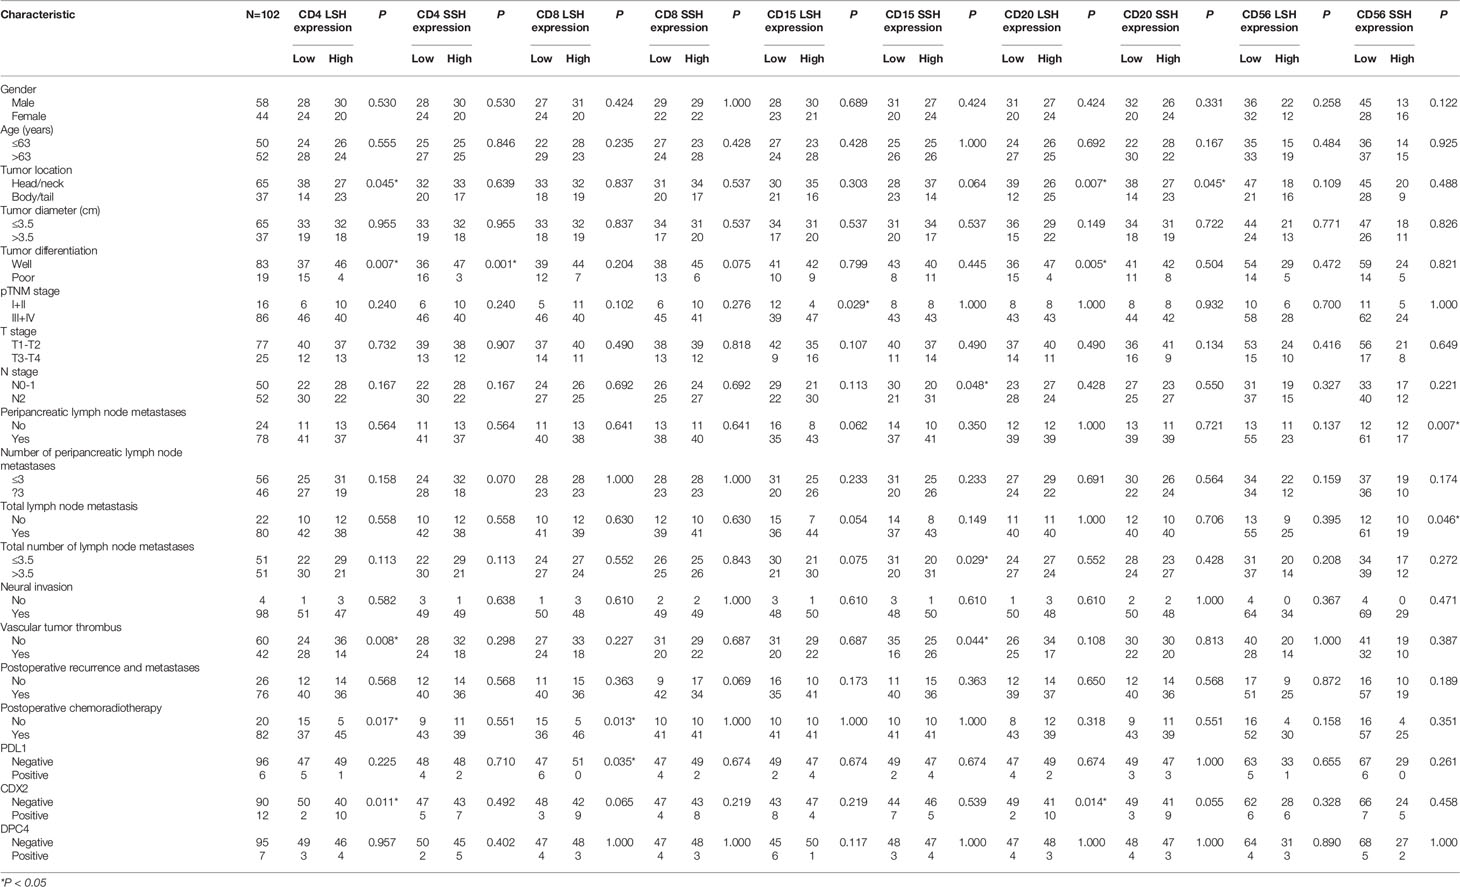
Table 2 Relationship between CD4, CD8, CD15, CD20, CD56, PDL1, CDX2, and DPC4 expression and clinicopathologic features of PDAC.
Based on SSH, CD4 expression was significantly correlated with tumor differentiation (P=0.001), whereas CD15 was significantly associated with N stage (P=0.048), the number of PDAC patients with total lymph node metastases (P=0.029) and vascular tumor thrombus (P=0.044). On the other hand, CD20 expression was significantly correlated with tumor location (P=0.045) in PDAC patients, and CD56 expression was significantly correlated with peripancreatic (P=0.007) and total (P=0.046) lymph node metastases. Conversely, CD8 expression was not significantly correlated with any of the clinicopathological characteristics of PDAC (Table 2). In summary, except for CD56 in LSH and CD8 in SSH, the other four immune cell markers were all significantly associated with the clinicopathological characteristics of PDAC, but their degrees of correlations differed. These results suggest that postoperative samples from the same patient may lead to different research results due to different tissue sampling methods used (LSH and SSH). LSH may contain more organizational information.
Immune Markers Are Correlated With Clinicopathological Characteristics and Prognosis
Univariate and multivariate Cox analyses were used to explore the relationship between 19 clinicopathological parameters and 10 immune cell parameters and the prognosis of PDAC patients. The following immune markers were examined to determine whether LSH or SSH is more representative of the original tumor and which better indicates patient prognosis: CD4 in LSH (CD4LSH), CD4 in SSH (CD4SSH), CD8 in LSH (CD8LSH), CD8 in SSH (CD8SSH), CD15 in LSH (CD15LSH), CD15 in SSH (CD15SSH), CD20 in LSH (CD20LSH), CD20 in SSH (CD20SSH), CD56 in LSH (CD56LSH), and CD56 in SSH (CD56SSH).
The enter screening method in the univariate Cox analysis showed a significant correlation between 21 factors and prognostic predictors: age (P=0.030), tumor differentiation (P<0.001), pTNM stage (P=0.001), N stage (P=0.001), with or without peripancreatic lymph node metastases (P=0.010), number of peripancreatic lymph node metastases (P=0.001), with or without total lymph node metastases (P=0.017), number of total lymph node metastases (P=0.001), vascular tumor thrombus (P=0.005), with or without postoperative recurrence and metastases (P=0.003), with or without postoperative chemoradiotherapy (P=0.003), PDL1 (P=0.022), CDX2 (P=0.002), DPC4 (P=0.017), CD4LSH (P<0.001), CD4SSH (P=0.039), CD8LSH (P<0.001), CD8SSH (P=0.013), CD15LSH (P<0.001), CD20LSH (P<0.001), and CD56LSH (P=0.043) (Table 3). The forward LR screening method in the multivariate Cox analysis was used to explore the 21 relevant parameters, and 7 independent factors associated with prognosis were identified (Table 3): pTNM stage (P=0.002), CD4LSH (P<0.001), CD8LSH (P=0.010), CD15LSH (P=0.031), PDL1 (P=0.001), CDX2 (P=0.008), and DPC4 (P=0.004). The 7 independent factors did not include any immune cell parameters in SSH. These findings imply that LSH effectively reflects the original tumor status and can effectively predict the prognosis of PDAC patients. Moreover, the Kaplan-Meier method and log-rank test were used to generate survival curves of OS-related parameters (Figure 2 and Supplementary Figure 4).
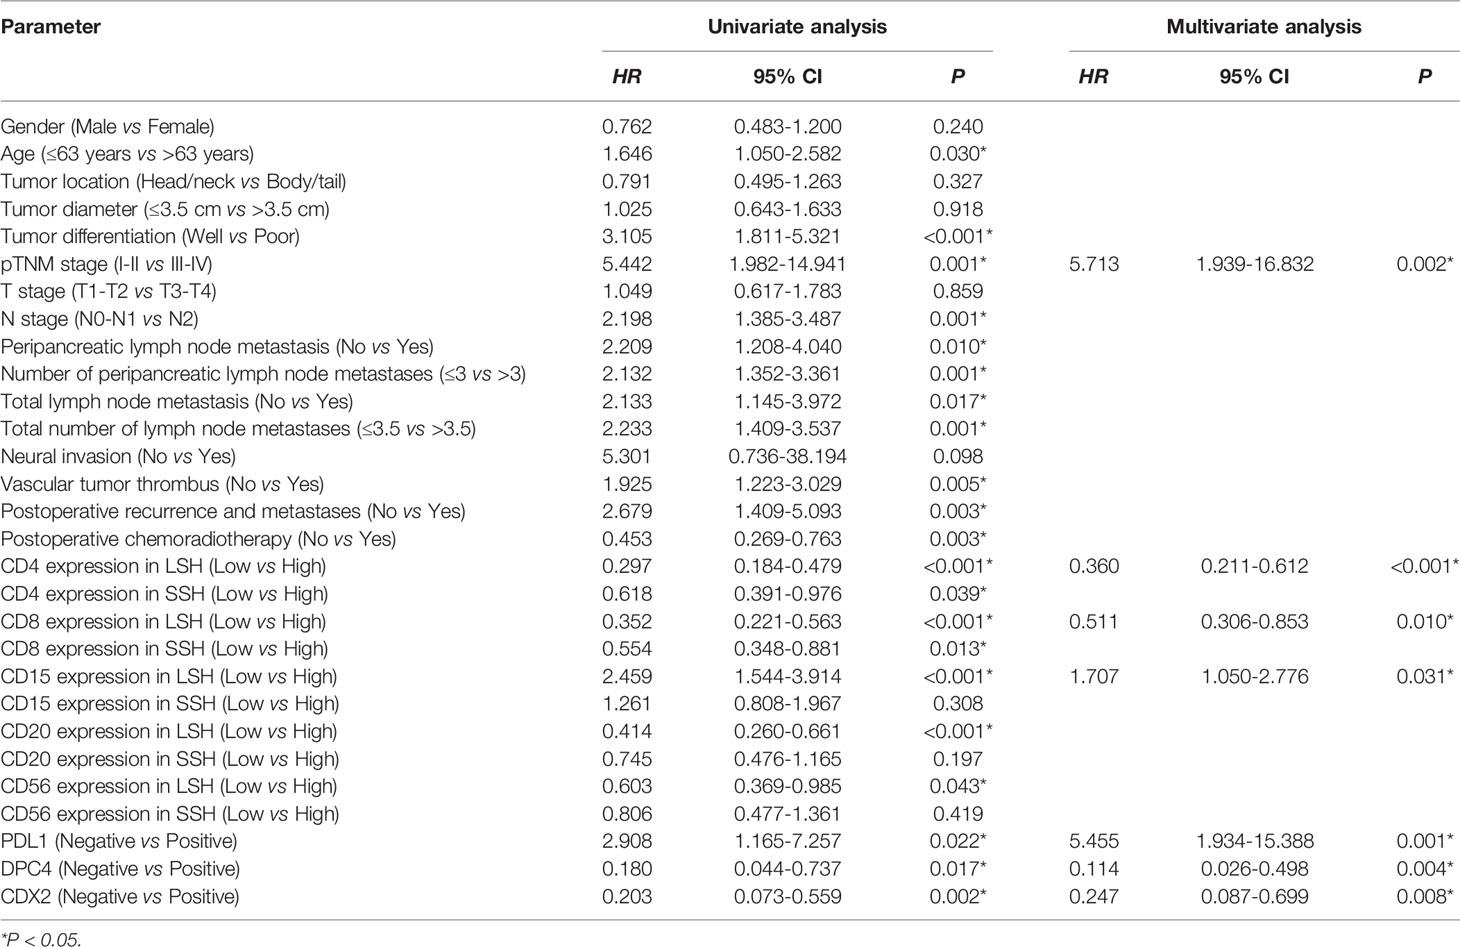
Table 3 Univariate and multivariate analyses of the clinicopathological parameters and prognosis of PDAC patients in this study cohort.
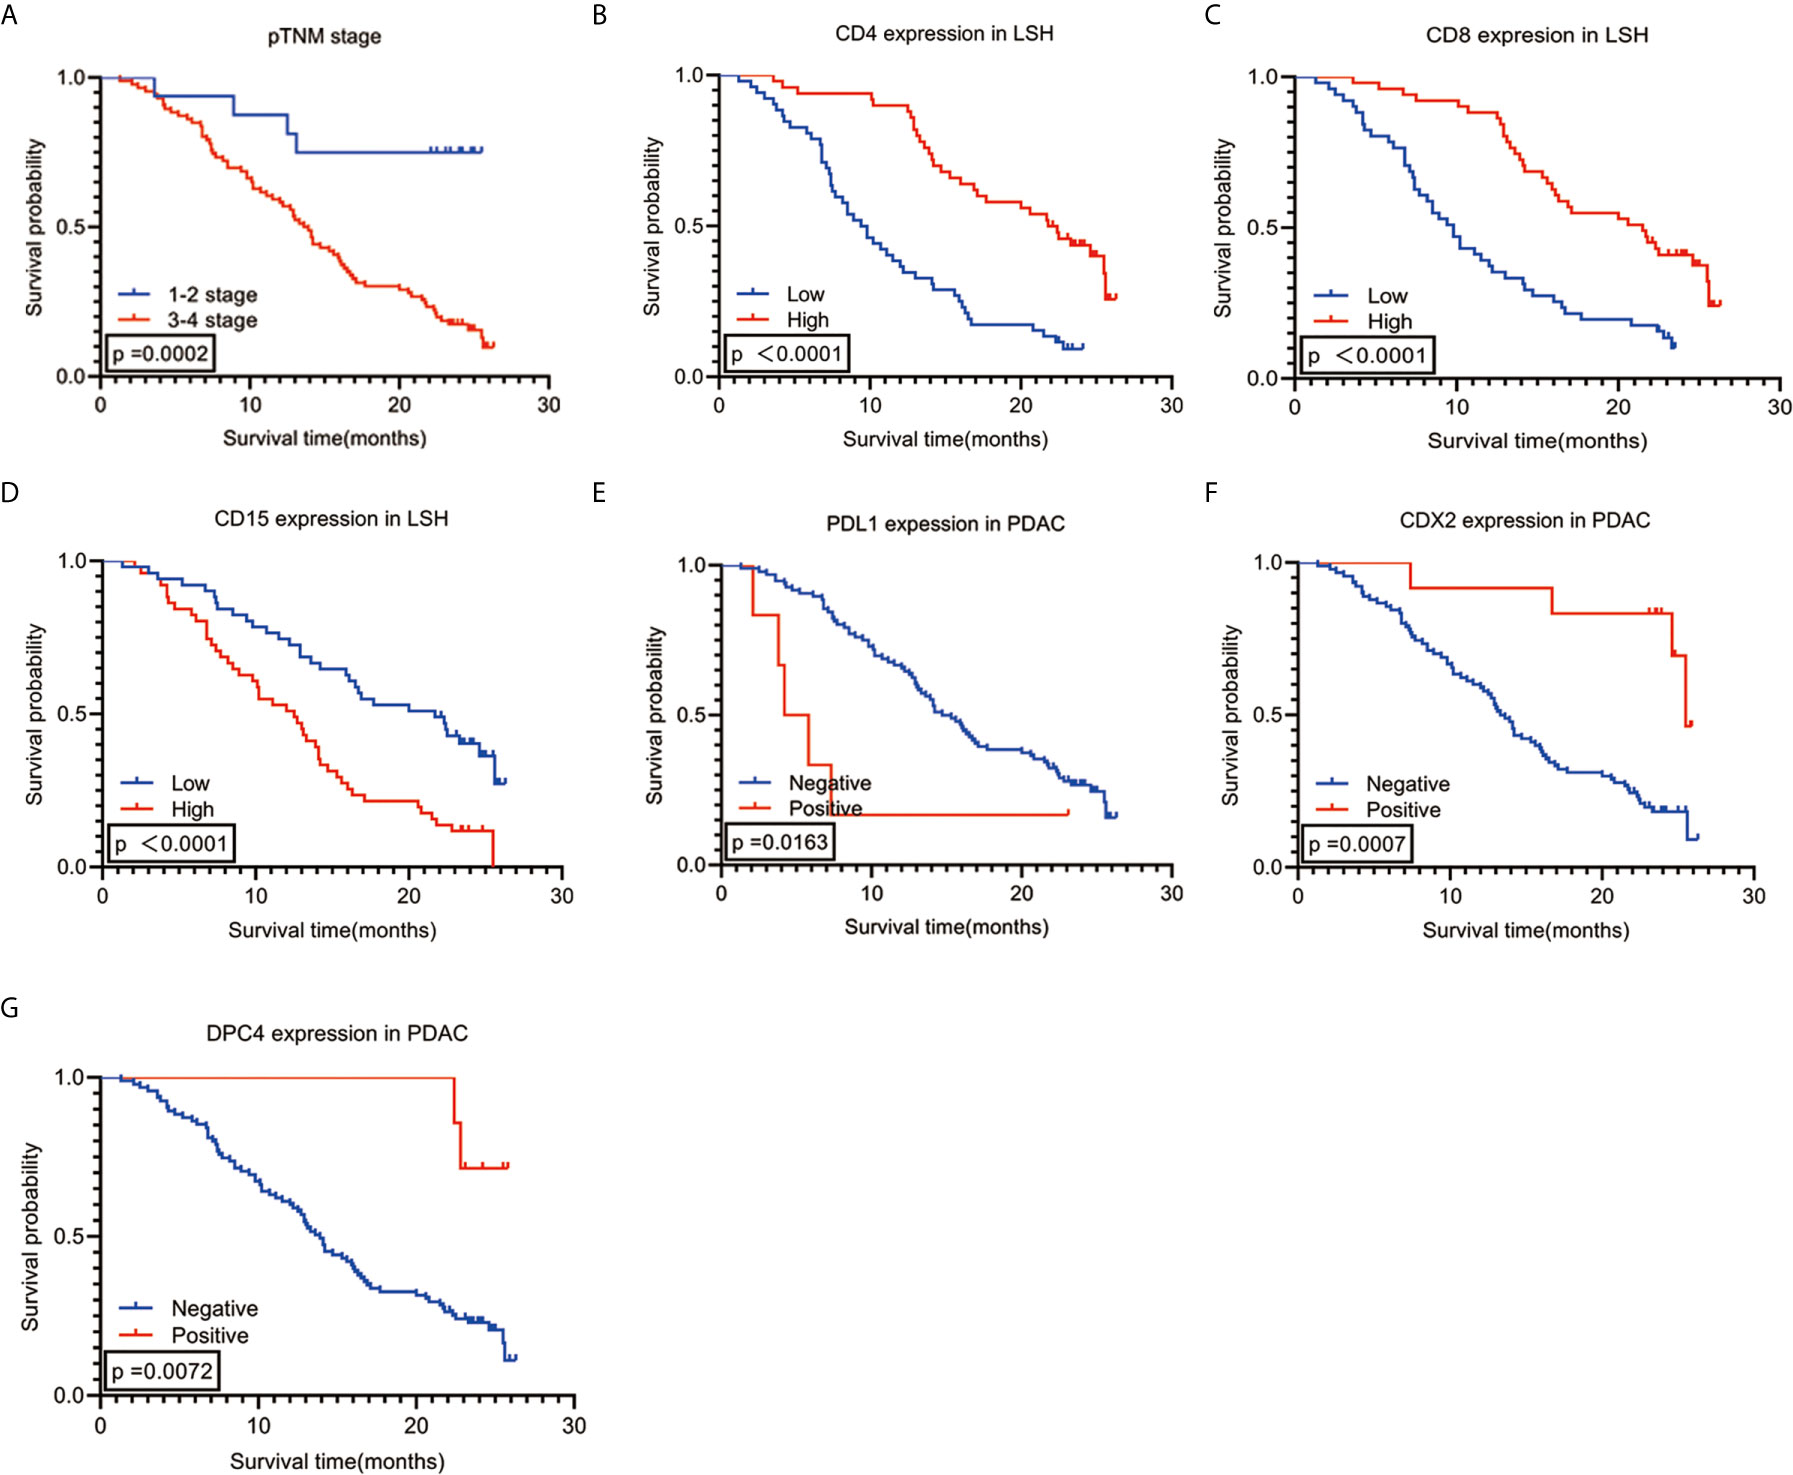
Figure 2 Kaplan-Meier survival analysis curves according to 7 (A–G) variables that were significantly associated with PDAC prognosis. PDAC, pancreatic ductal adenocarcinoma.
Independent Prognostic Parameters of PDAC Are Associated With OS
Spearman correlation was used to analyze the relationship between the seven independent prognostic predictors of PDAC and OS. The findings showed a significant positive correlation between OS and high expression levels of CD4 and CD8 (r=0.588, P<0.001) and CDX2 positivity (r=0.251, P=0.011). Notably, a high expression level of CD8 was negatively correlated with high CD15 expression (r=-0.255, P=0.010) and PDL1 expression (r=-0.250, P=0.011). Analysis of the clinical stage showed that an early pTNM stage was correlated with low CD15 expression (r=0.216, P=0.029), whereas an advanced pTNM stage was correlated with DPC4 negativity (r=-0.203, P=0.041) (Figure 3G). Survival analysis using the Kaplan-Meier method and log-rank test showed a significant correlation among several combinations of variables (Figures 3A–F). Notably, analysis of the combination of CD4 and CD8 showed that the group with the best prognosis had high expression of CD4 and CD8, with a median OS period of 22.500 months (95% CI: 18.767-26.233, P<0.001), whereas the group with the worst prognosis had low expression of CD4 and CD8, with a median OS period of 8.500 months (95% CI: 6.623-10.377, P<0.001). Analysis of the combination of CD4 and CDX2 showed that the group with the best prognosis had high CD4 expression and CDX2 positivity. However, there was no median OS because only 2 of 10 patients in this group had an endpoint event at the end of follow-up. The average OS period for the group with the CD4 and CDX2 combination was 25.572 months (95% CI: 25.182-25.963, P<0.001). On the other hand, the group with the worst prognosis had low CD4 expression and CDX2 negativity. This group had a median OS period of 9.400 months (95% CI: 7.420-11.380, P<0.001). When CD8 was combined with CD15, the group with the best prognosis was the one with high CD8 expression and low CD15 expression, with a median OS period of 24.600 months (95% CI: 21.617-27.583, P<0.001). Conversely, the group with the worst prognosis exhibited low CD8 expression and high CD15 expression, with a median OS period of 7.700 months (95% CI: 5.760-9.640, P<0.001). When CD8 was combined with PDL1, the group with the best prognosis had high CD8 expression and PDL1 negativity. This group had a median OS period of 21.500 months (95% CI: 16.137-26.863, P<0.001). On the other hand, low CD8 expression and PDL1 positivity were associated with the worst prognosis, with a median OS period of 4.200 months (95% CI: 1.800-6.600, P<0.001). When CD15 was combined with pTNM stage, the group with the best prognosis had low CD15 expression and pTNM stages I-II. This group had no median OS, as only 1 of 12 people in this group had an endpoint event at the end of follow-up. The average OS period for this group was 23.675 months (95% CI: 20.250-27.100, P<0.001). Conversely, the group with the worst prognosis associated with this combination had high CD15 expression and pTNM stages III-IV, with a median OS period of 12.000 months (95% CI: 8.753-15.247, P<0.001). When DPC4 was combined with pTNM stage, the group with the best prognosis had DPC4 positivity and pTNM stages I-II. Notably, the median and average OS periods were not calculated due to a lack of terminal events among the 3 patients in this group at the end of follow-up (P<0.001). On the other hand, the group with the worst prognosis had DPC4 negativity and pTNM stages III-IV. This group had a median OS period of 13.000 months (95% CI: 11.136-14.864, P<0.001).
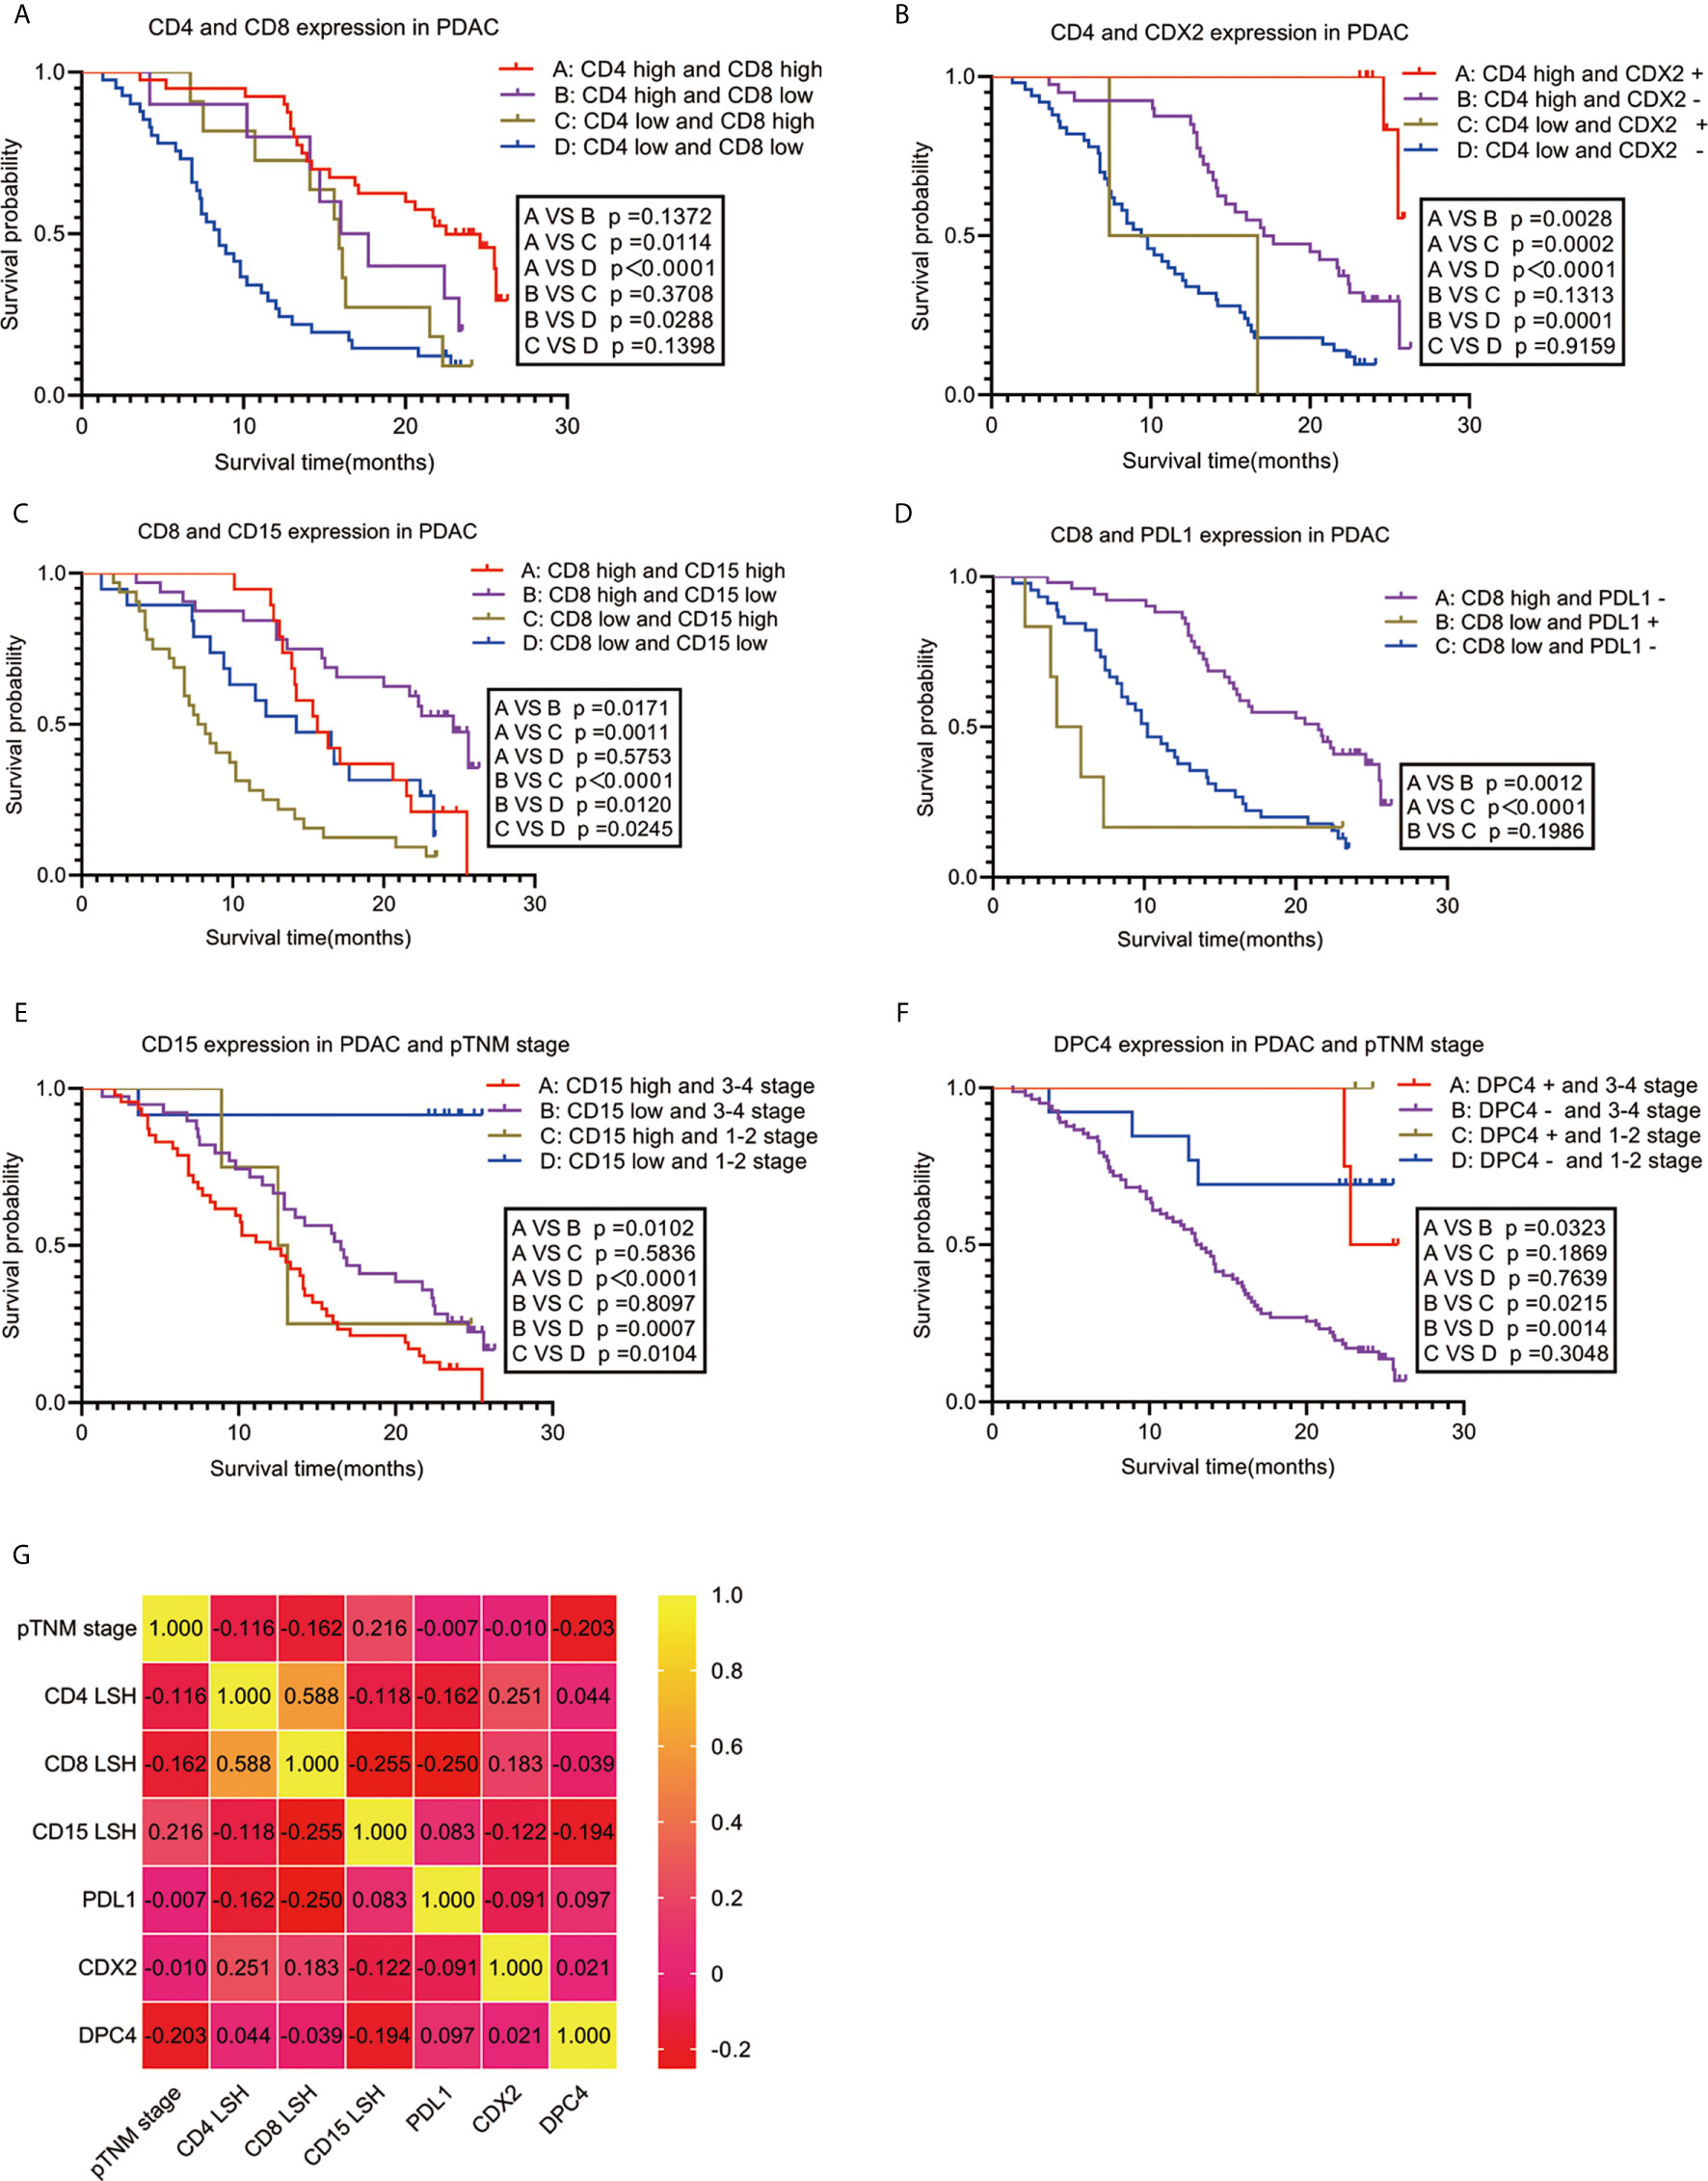
Figure 3 Correlation between PDAC-independent prognostic parameters and their combinations with OS. Survival analysis (A–F) and a heat map of the correlation coefficient matrix (G) of correlated combination variables for the prediction of PDAC prognosis. PDAC, pancreatic ductal adenocarcinoma.
Nomogram Model Construction and Verification
A nomogram model was constructed based on the 7 variables obtained from the multivariate Cox analysis (pTNM stage, CD4LSH, CD8LSH, CD15LSH, PDL1, CDX2, and DPC4). The nomogram accurately predicted the prognosis of PDAC patients (Figure 4A). The risk scoring system of the nomogram classified patients into three groups, namely, low- (≤275), medium- (275–320), and high-risk (>320). Survival analysis using Kaplan-Meier curves and the log-rank test showed significant differences among the three groups (P<0.001) (Figure 4B). Bootstrap self-sampling (1000 times) was used to internally verify the nomogram. The C-index value was 0.80 (95% CI: 0.73-0.85), indicating that the model has high prediction accuracy. The area under the curve (AUC) values of the model were 0.78, 0.87, and 0.82 in PDAC patients at 6 months, 1 year, and 2 years after surgery, respectively (Figure 5D). The predicted AUC values for TNM stage were 0.55, 0.58, and 0.69 at 6 months, 1 year and 2 years after surgery, respectively (Figure 5E). These findings indicate that the nomogram model has a good degree of discrimination. Moreover, the AUC values predicted by the nomogram were all higher than those obtained using the TNM staging system. Calibration curves and baseline scores were similar, indicating that the model-predicted observations were consistent with actual observations (Figures 5A–C). In addition, decision curve analysis showed that the nomogram has good clinical value within a reasonable threshold probability range (Figures 6A–C).
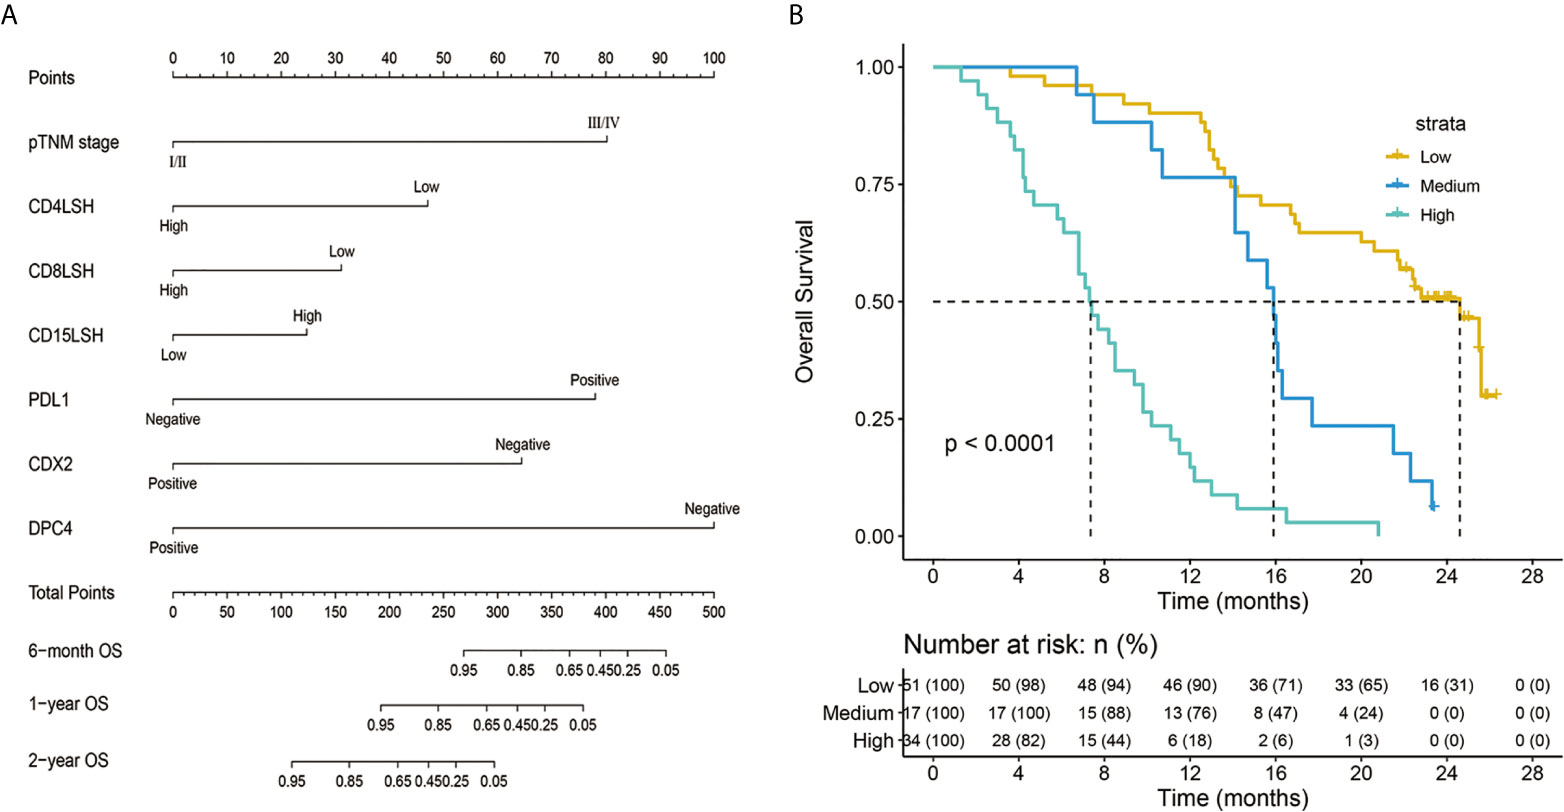
Figure 4 Nomogram predicting the survival rates of PDAC patients at 6 months, 1 year, and 2 years after surgery (A) and a survival curve of individual risk stratification based on the nomogram (B). pTNM-pathology tumor-node-metastasis; CD4LSH, CD4 expression in large-section histopathology; CD8LSH - CD8 expression in large-section histopathology; CD15LSH, CD15 expression in large-section histopathology; PDL1, programmed cell death-ligand 1; CDX2, caudal-type homeobox 2; DPC4, deleted in pancreatic carcinoma 4.
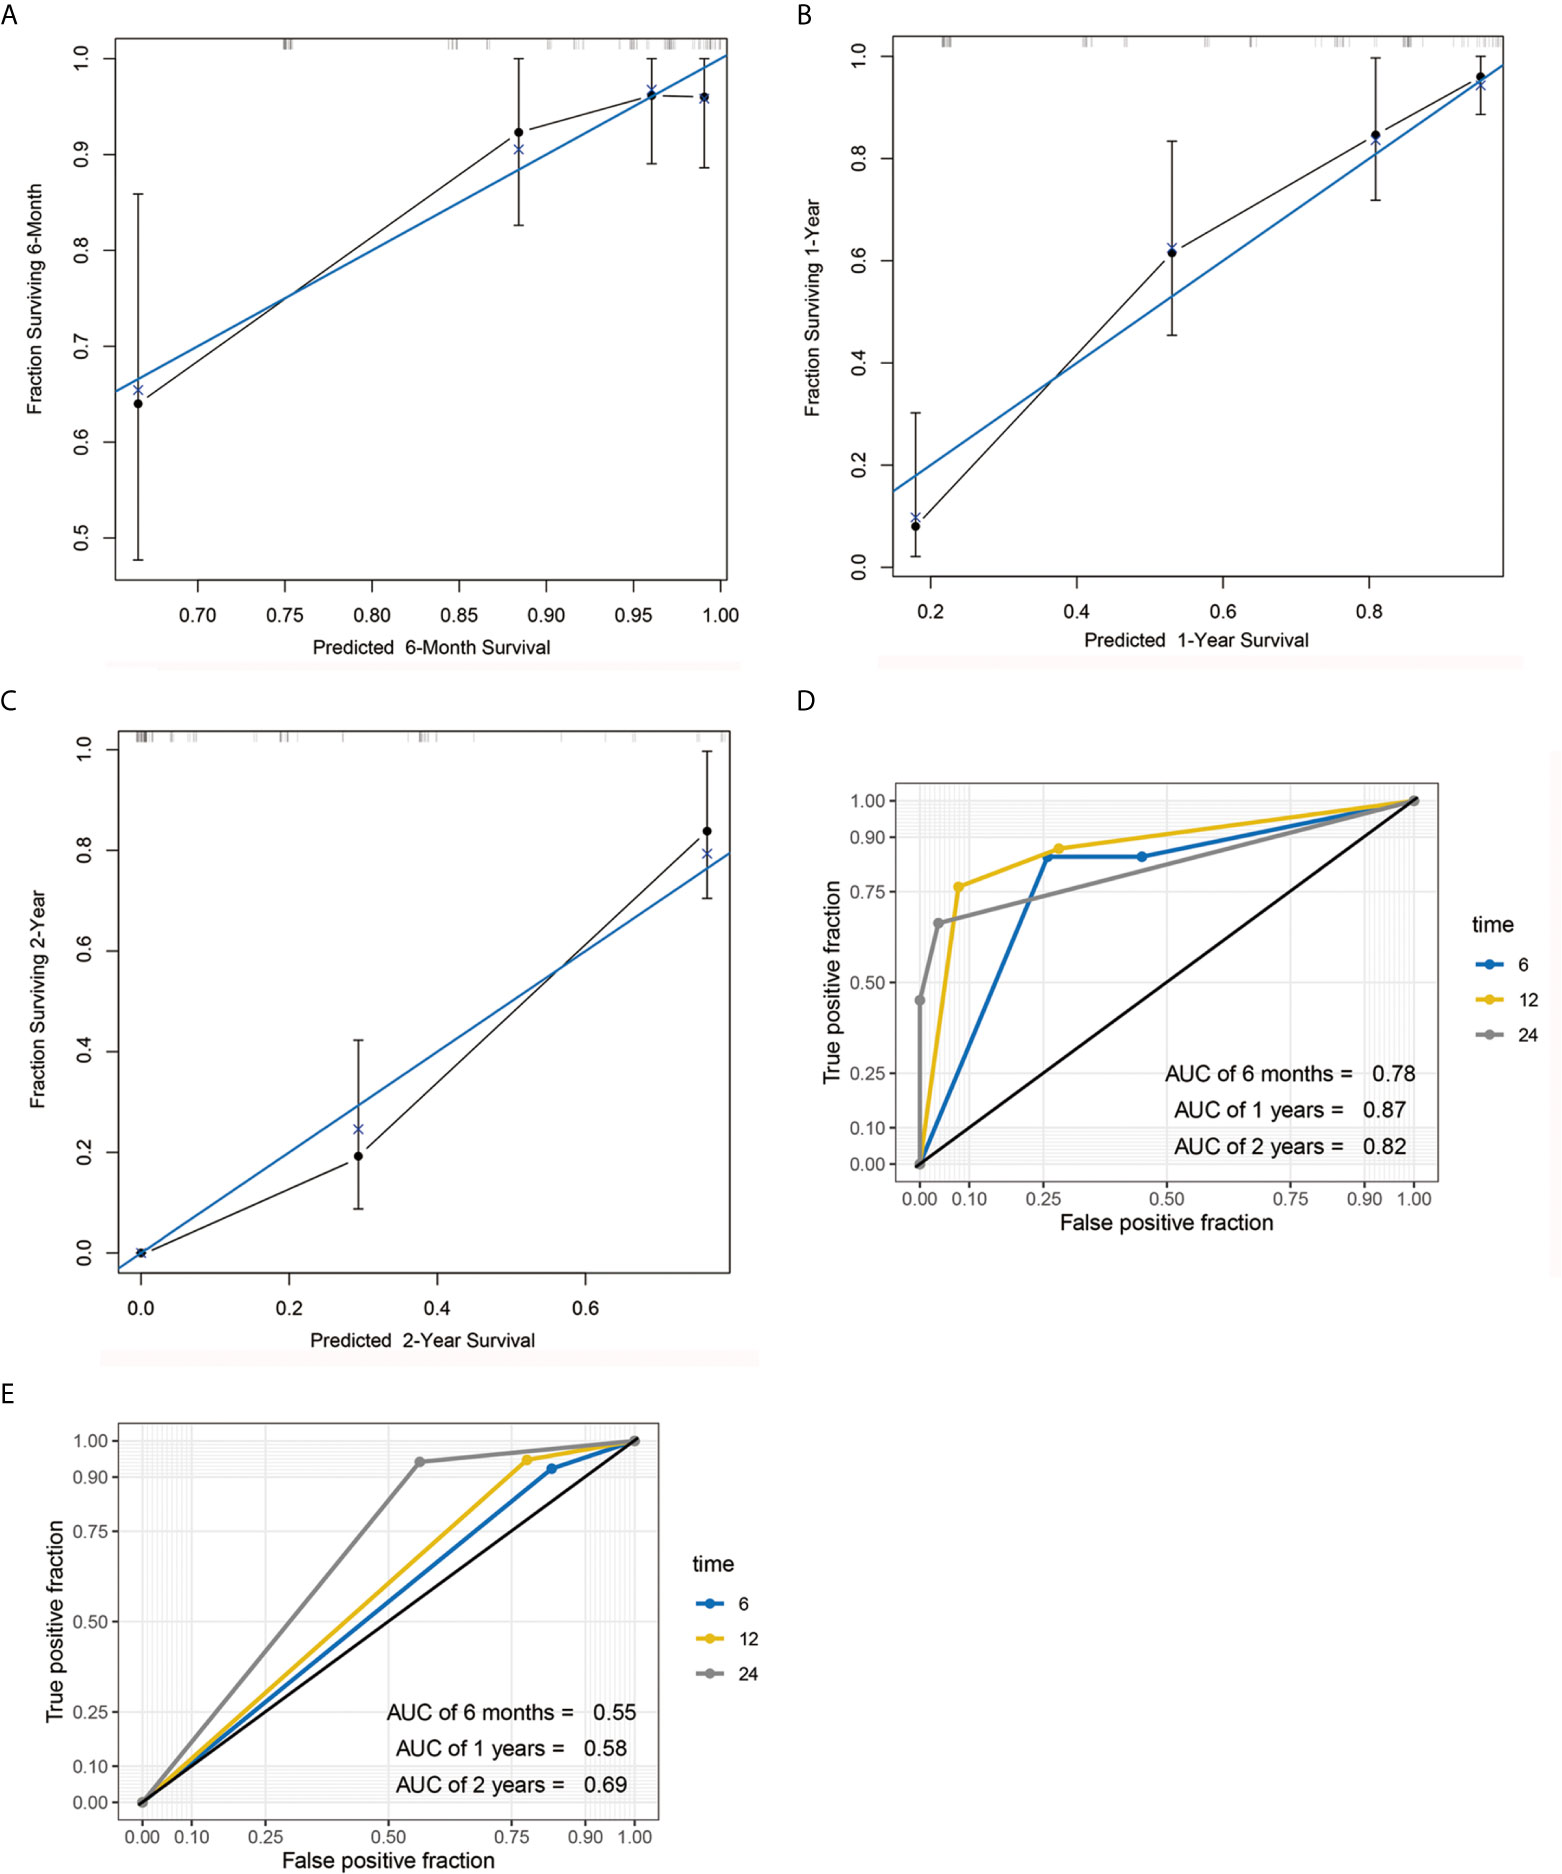
Figure 5 Calibration curve and AUC graph. Calibration curve for predicting the survival rates of PDAC patients at 6 months (A), 1 year (B) and 2 years (C) after surgery. Blue and black lines represent the ideal calibration curve model and the actual calibration curve, respectively. AUC graph of the nomogram (D) and TNM staging system (E) for the predicting postoperative 6-month, 1-year, and 2-year survival rates.
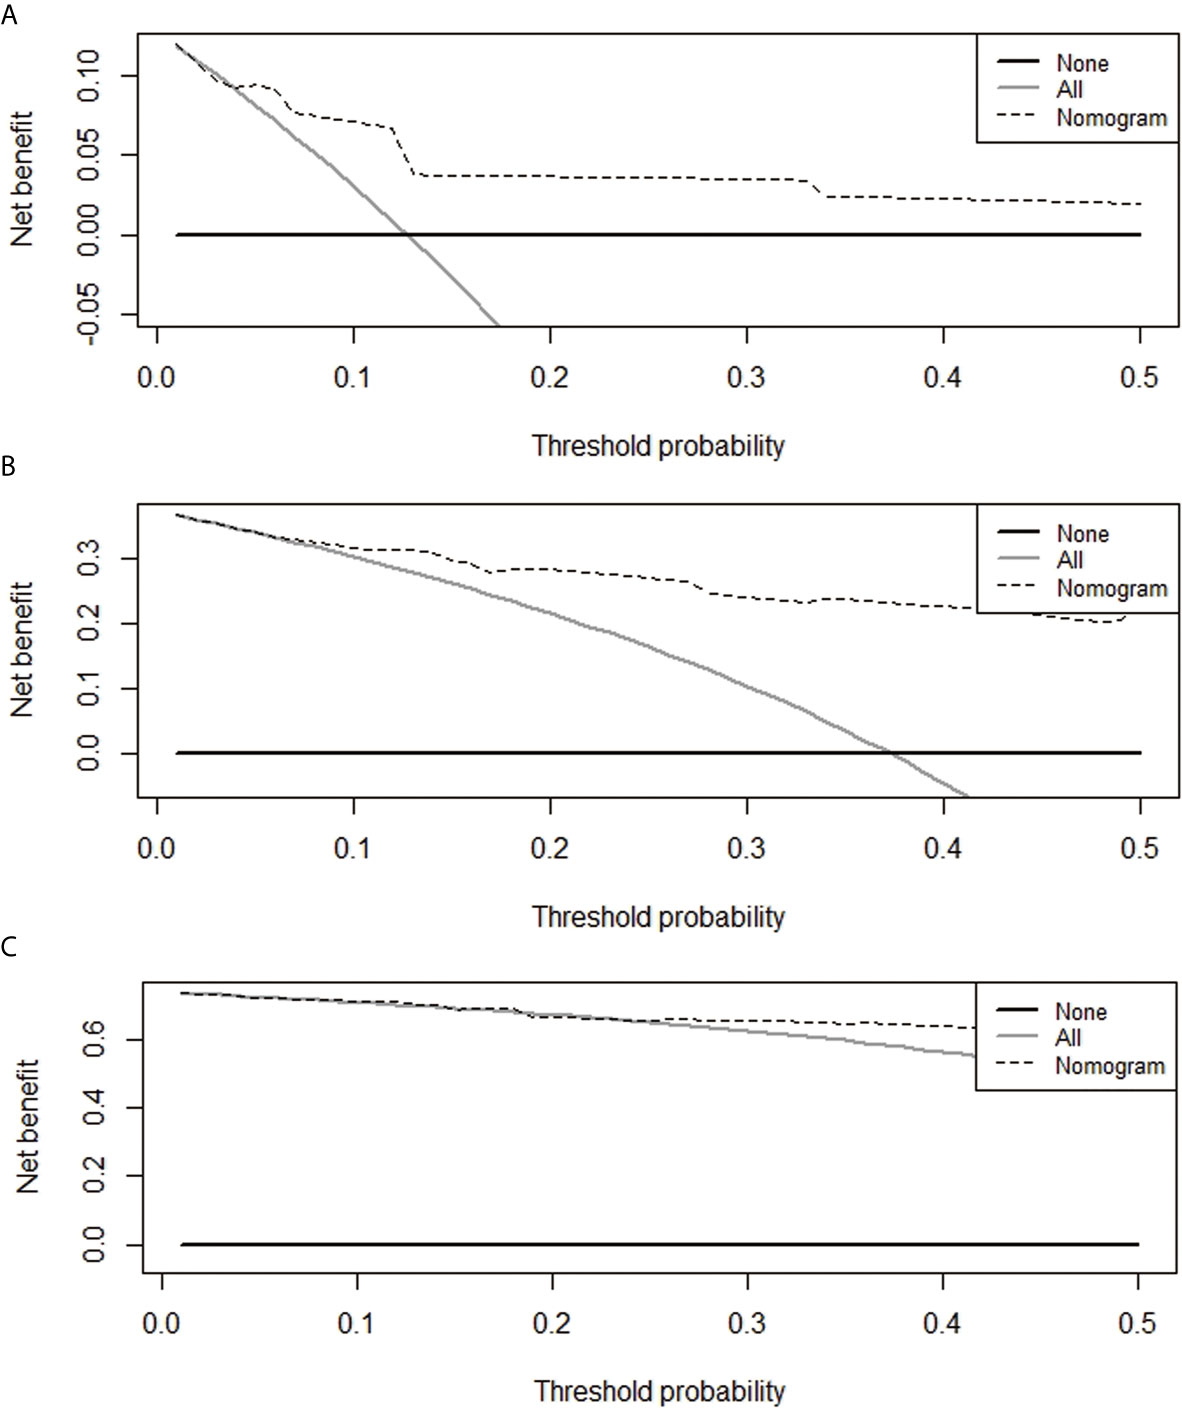
Figure 6 Decision curves for the prediction of postoperative survival rates of PDAC patients at 6 months (A), 1 year (B), and 2 years (C).
Discussion
Immune cells in the TME play a key role in the development and progression of pancreatic cancer (26). Pancreatic cancer, similar to other solid tumors, evades host immune surveillance by modulating immune cells to establish an immunosuppressive TME (27). T cells are the most representative type of immune cell in the TME and play an important role in the clinical outcome of pancreatic cancer (6, 28). Previous studies have shown that limited T cell infiltration occurs in primary PDAC mouse models, whereas insignificant levels of CD8+ T cells are present in tumor cell nests or the surrounding stroma (29). PDAC is an immunologically cold tumor characterized by sparse T cell infiltrates (30). PDAC patients with an abundance of T cells in the stroma and higher levels of CD4+ T and/or CD8+ T cells exhibit significantly longer survival times than those with lower levels of these immune cells (31). Previous studies have reported inconsistent findings, possibly due to bias from tumor tissue sampling or the analysis/technique used. Advances in detection technology have significantly improved research on the TME. For instance, the use of high-throughput sequencing technologies, such as deconvolution RNA-Seq and single-cell sequencing, has generated important omics resources. However, the long cycle times, high costs involved, and loss of spatial information during the analysis process negatively affect the effectiveness of these techniques. Spatial transcriptomics enables simultaneous labeling and high-resolution microscopic imaging of multiple antibodies on tissue slices, data analysis and mining experimental images after staining and is a recent technique used in studies on the TME. However, this technique is limited by its insufficient resolution; therefore, it does not meet the sequencing depth requirement and is associated with a high cost of single-cell sequencing. LSH offers the best solution to circumvent these limitations. The findings of the current study are consistent with findings from previous studies showing that T cells are one of the most representative types of immune cells in the pancreatic cancer TME. In addition, the findings of the current study showed that patients with higher levels of CD4+ T and/or CD8+ T cells have significantly longer survival times, consistent with previous findings (6, 31). A comparison between LSH and SSH in the detection of CD4+ T and CD8+ T cells in paired PDAC samples showed abundant CD4+ T and CD8+ T cell infiltration in LSH. Moreover, the findings using this technique showed independent factors that were significantly correlated with the prognosis of PDAC patients. This may be related to the Th1 cells among CD4+ T cells that activate CD8+ CTLs and promote the immune system to suppress tumor progression (5). A previous study explored the spatial distribution and functional status of T cells in different areas, including the tumor center, invasive front, normal parenchyma adjacent to the tumor, and tumor-positive and tumor-negative draining lymph nodes in PDAC (32). However, the current study explored only the infiltration of T cells in the PDAC tumor region and did not explore the functional status of T cells. Therefore, further studies should analyze the functional status of T cells. However, the present study showed that high levels of infiltrating T cells and low expression of PDL1 in PDAC were associated with a poor prognosis. These findings indicate that an abundance of T cell infiltrates in PDAC is an effective predictor of patient prognosis.
NK cells represent an important part of tumor immune monitoring. However, their occurrence in pancreatic cancer and their correlation with the prognosis of PDAC are still unclear. Previous studies explored few NK cells in partial pancreatic cancer samples and reported that pancreatic tumor cells have selective resistance to NK cell-mediated immune surveillance (7). Other studies reported high levels of NK cells in pancreatic cancer specimens based on tissue chip technology. The findings showed that a high concentration of CD56+ NK cells significantly correlated with a good prognosis in patients who had not received adjuvant chemotherapy (33). Notably, these findings are not consistent, possibly due to differences in tumor tissue sampling. The findings of the present study showed that PDAC patients exhibited few infiltrating NK cells. Although a high concentration of CD56+ NK cells is associated with a good prognosis in PDAC patients who have not received adjuvant therapy before surgery, it is not an independent prognostic factor. This can be attributed to the gradual impairment of NK cell function observed during the progression of pancreatic cancer and the inability of circulating NK cells to survive or proliferate after reaching the hypoxic tumor microenvironment (pO2 ≤ 1.5%) (7). The current study confirmed the significance of CD56+ NK cell infiltration in the prognosis of PDAC.
The role of neutrophils in the microenvironment of pancreatic cancer is also controversial. Wang et al. (34) used tissue chip technology to explore the presence of CD15+ neutrophils and CD20+ B cells in tumors and reported that they are predictors of shortened postoperative survival. Miksch et al. (35) used conventional SSH technology and reported that CD66b+ neutrophil infiltration in PDAC was not significantly associated with patient prognosis, whereas upregulation of CD20+ B cells was significantly correlated with an improved prognosis in PDAC patients. Moreover, Takakura et al. (36) used conventional SSH technology and reported that low-density CD66b+ neutrophils and high-density CD20+ B cells were predictors of a good prognosis in PDAC patients. The differences in these studies can be attributed to bias from tissue sampling using traditional SSH or tissue chip methods. Traditional SSH or tissue chip techniques seem effective and space-saving; however, these methods do not provide a complete picture of the tumor. In the present study, both neutrophils with low CD15+ expression and B cells with high CD20+ expression were significantly correlated with a good prognosis in PDAC patients. This may be because neutrophils recruit immune cells that promote tumor progression, whereas B cells directly recognize tumor antigens and produce tumor-related antibodies that kill tumor cells by activating the complement system or promoting ADCC effects (9, 11). These findings show that B cells and neutrophils are effective indicators of the prognosis of pancreatic cancer.
The findings of the current study showed that CDX2 is an excellent prognostic factor in PDAC. Previous studies have reported inconsistent results regarding the patterns of CDX2 expression in PDAC. Werling et al., Chu et al., and Kaimaktchiev et al. reported that CDX2 is heterogeneously expressed in PDAC, with rates of 32 (7/22), 22 (10/46), and 15% (3/20), respectively (37–39). However, these findings were contrary to those from other reports that showed no CDX2 expression in PDAC (40). The findings from the current study are consistent with the findings by Xiao et al. (24), i.e., CDX2 expression is a good predictor in PDAC patients. This is possibly because CDX2 regulates the tumor suppressor gene miR-615-5p and inhibits pancreatic cancer cell proliferation (41). In addition, the findings of this study showed that DPC4 negativity was an independent prognostic predictor for shortened OS in PDAC patients. These findings were consistent with the findings of Biankin et al. (25) and Blackford et al. (42) and can be attributed to the fact that DPC4 is a specific PDAC suppressor gene whose deletion induces upregulation of PGK1 in PDAC, thus enhancing glycolysis and tumor aggressiveness (43).
Nomograms have been used to explore the prognosis of patients across various clinical oncology settings (44). Nomograms integrate multiple prognostic determinants, including genes, molecules, and clinicopathological parameters, and can use relatively simple output forms to calculate and visualize the numerical probability of clinical events. Therefore, they are more effective in prognosis prediction than traditional TNM staging system (45). Although nomograms have been widely used to predict the prognosis of pancreatic cancer patients (46–49), several factors limit their efficiency. Currently, no nomogram has been constructed for PDAC patients based on immune cell parameters and clinicopathological parameters in LSH. Notably, the traditional TNM staging system does not fully consider the host’s immune response in the TME during PDAC progression and does not provide adequate biological information regarding the prognosis of PDAC patients. The nomogram constructed and verified in the present study was superior to the traditional TNM staging system in predicting the prognosis of PDAC patients. The nomogram incorporated information on CD4, CD8, CD15, PDL1, and DPC4, which are closely associated with PDAC immunotherapy and driver mutations, and the previously neglected CDX2. The nomogram model developed in the present study based on clinicopathological parameters and immune cell parameters in the TME can be used clinically to select appropriate treatment options for PDAC patients and to evaluate their specific survival rates at 6 months, 1 year and 2 years.
In summary, this is the first study to report a panoramic view of the immune cell composition in the pancreatic cancer TME based on LSH technology. This approach is superior in predicting the prognosis of PDAC patients compared with SSH. The findings of this study show that pTNM stage, CD4LSH, CD8LSH, CD15LSH, PDL1, CDX2, and DPC4 are independent factors for predicting the prognosis of PDAC patients. This study proposes a combination of six variables that guarantees excellent prognostic prediction for PDAC patients. Moreover, a highly accurate nomogram model was constructed and verified to be effective in clinical decision-making. However, the application of LSH in the prediction of PDAC prognosis should be explored further.
Data Availability Statement
The original contributions presented in the study are included in the article/Supplementary Material. Further inquiries can be directed to the corresponding authors.
Ethics Statement
The studies involving human participants were reviewed and approved by the Ethics Committee of Changhai Hospital Affiliated to the Second Military Medical University. The patients/participants provided their written informed consent to participate in this study.
Author Contributions
GD, HJ, YL, and JZ conceptualized and designed the study. GD performed experiments, followed the patient’s survival, and wrote and reviewed the first draft of the manuscript. GD, MG, YY, CS, SW, XL, and JW acquired, analyzed, and interpreted the data and performed statistical analyses. All authors contributed to the article and approved the submitted version.
Funding
This work was supported by funding from the National Natural Science Foundation of China (Nos. 81972282, 81972683).
Conflict of Interest
The authors declare that the research was conducted in the absence of any commercial or financial relationships that could be construed as potential conflict of interest.
Acknowledgments
The authors thank Xiaoyi Yin for guidance on nomogram construction.
Supplementary Material
The Supplementary Material for this article can be found online at: https://www.frontiersin.org/articles/10.3389/fonc.2021.694933/full#supplementary-material
Supplementary Figure 1 | Panoramic scanning images of CD4, CD8, CD15, CD20 and CD56 in LSH of PDAC after immunohistochemical staining. LSH, large-section histopathology; PDAC, pancreatic ductal adenocarcinoma.
Supplementary Figure 2 | Panoramic scanning images of CD4, CD8, CD15, CD20 and CD56 in SSH of PDAC after immunohistochemical staining. SSH, small-section histopathology; PDAC, pancreatic ductal adenocarcinoma.
Supplementary Figure 3 | H&E images for LSH and SSH and H&E panoramic scan of LSH in PDAC. LSH, large-section histopathology; SSH, small-section histopathology; PDAC, pancreatic ductal adenocarcinoma.
Supplementary Figure 4 | Kaplan-Meier survival analysis curves according to 14 (A–N) variables that were associated with PDAC prognosis. PDAC, pancreatic ductal adenocarcinoma.
References
1. Siegel RL, Miller KD, Jemal A. Cancer Statistics, 2020. CA Cancer J Clin (2020) 70:7–30. doi: 10.3322/caac.21590
2. Yang Y. Current Status and Future Prospect of Surgical Treatment for Pancreatic Cancer. Hepatobiliary Surg Nutr (2020) 9:89–91. doi: 10.21037/hbsn.2019.12.04
3. Kandimalla R, Tomihara H, Banwait JK, Yamamura K, Singh G, Baba H, et al. A 15-Gene Immune, Stromal, and Proliferation Gene Signature That Significantly Associates With Poor Survival in Patients With Pancreatic Ductal Adenocarcinoma. Clin Cancer Res (2020) 26:3641–8. doi: 10.1158/1078-0432
4. Schizas D, Charalampakis N, Kole C, Economopoulou P, Koustas E, Gkotsis E, et al. Immunotherapy for Pancreatic Cancer: A 2020 Update. Cancer Treat Rev (2020) 86:102016. doi: 10.1016/j.ctrv.2020.102016
5. Liu X, Xu J, Zhang B, Liu J, Liang C, Meng Q, et al. The Reciprocal Regulation Between Host Tissue and Immune Cells in Pancreatic Ductal Adenocarcinoma: New Insights and Therapeutic Implications. Mol Cancer (2019) 18:184. doi: 10.1186/s12943-019-1117-9
6. Carstens JL, Correa de Sampaio P, Yang D, Barua S, Wang H, Rao A, et al. Spatial Computation of Intratumoral T Cells Correlates With Survival of Patients With Pancreatic Cancer. Nat Commun (2017) 8:15095. doi: 10.1038/ncomms15095
7. Lim SA, Kim J, Jeon S, Shin MH, Kwon J, Kim TJ, et al. Defective Localization With Impaired Tumor Cytotoxicity Contributes to the Immune Escape of NK Cells in Pancreatic Cancer Patients. Front Immunol (2019) 10. doi: 10.3389/fimmu
8. Myers JA, Miller JS. Exploring the NK Cell Platform for Cancer Immunotherapy. Nat Rev Clin Oncol (2021) 18:85–100. doi: 10.1038/s41571-020-0426-7
9. Sharonov GV, Serebrovskaya EO, Yuzhakova DV, Britanova OV, Chudakov DM. B Cells, Plasma Cells and Antibody Repertoires in the Tumour Microenvironment. Nat Rev Immunol (2020) 20:294–307. doi: 10.1038/s41577-019-0257-x
10. Gu Y, Liu Y, Fu L, Zhai L, Zhu J, Han Y, et al. Tumor-Educated B Cells Selectively Promote Breast Cancer Lymph Node Metastasis by HSPA4-Targeting IgG. Nat Med (2019) 25:312–22. doi: 10.1038/s41591-018-0309-y
11. Giese MA, Hind LE, Huttenlocher A. Neutrophil Plasticity in the Tumor Microenvironment. Blood (2019) 133:2159–67. doi: 10.1182/blood-2018-11-844548
12. Schelker M, Feau S, Du J, Ranu N, Klipp E, MacBeath G, et al. Estimation of Immune Cell Content in Tumour Tissue Using Single-Cell RNA-seq Data. Nat Commun (2017) 8:2032. doi: 10.1038/s41467-017-02289-3
13. Peng J, Sun BF, Chen CY, Zhou JY, Chen YS, Chen H, et al. Single-Cell RNA-seq Highlights Intra-Tumoral Heterogeneity and Malignant Progression in Pancreatic Ductal Adenocarcinoma. Cell Res (2019) 29:725–38. doi: 10.1038/s41422-019-0195-y
14. Ji AL, Rubin AJ, Thrane K, Jiang S, Reynolds DL, Meyers RM, et al. Multimodal Analysis of Composition and Spatial Architecture in Human Squamous Cell Carcinoma. Cell (2020) 182:1661–2. doi: 10.1016/j.cell.2020.08.043
15. Spitzer MH, Nolan GP. Mass Cytometry: Single Cells, Many Features. Cell (2016) 165:780–91. doi: 10.1016/j.cell.2016.04.019
16. Papo I, Caruselli G, Luongo A, Scarpelli M, Pasquini U. Traumatic Cerebral Mass Lesions: Correlations Between Clinical, Intracranial Pressure, and Computed Tomographic Data. Neurosurgery (1980) 7:337–46. doi: 10.1227/00006123-198010000-00005
17. Tot T, Gere M, Hofmeyer S, Bauer A, Pellas U. The Subgross Morphology of Breast Carcinomas: A Single-Institution Series of 2033 Consecutive Cases Documented in Large-Format Histology Slides. Virchows Arch (2020) 476:373–81. doi: 10.1007/s00428-019-02641-6
18. Ahdoot M, Wilbur AR, Reese SE, Lebastchi AH, Mehralivand S, Gomella PT, et al. MRI-Targeted, Systematic, and Combined Biopsy for Prostate Cancer Diagnosis. N Engl J Med (2020) 382:917–28. doi: 10.1056/NEJMoa1910038
19. Chung JS, Kwak HD, Ju JK. Is Whole-Mount Section in Rectal Cancer Effective for Measuring Lateral Margin? Ann Coloproctol (2020) 36:131–2. doi: 10.3393/ac.2020.06.12
20. Heidkamp J, Weijs WLJ, van Engen-van Grunsven ACH, de Laak-de Vries I, Maas MC, Rovers MM, et al. Assessment of Surgical Tumor-Free Resection Margins in Fresh Squamous-Cell Carcinoma Resection Specimens of the Tongue Using a Clinical MRI System. Head Neck (2020) 42:2039–49. doi: 10.1002/hed.26125
21. Liu C, Cheng H, Jin K, Guo M, Lu Y, Wang Z, et al. Application of the Eighth Edition of the American Joint Committee on Cancer Staging for Pancreatic Adenocarcinoma. Pancreas (2018) 47:742–7. doi: 10.1097/MPA.0000000000001073
22. Zhang R, Liu Q, Peng J, Wang M, Li T, Liu J, et al. CXCL5 Overexpression Predicts a Poor Prognosis in Pancreatic Ductal Adenocarcinoma and Is Correlated With Immune Cell Infiltration. J Cancer (2020) 11:2371–81. doi: 10.7150/jca.40517
23. Imai D, Yoshizumi T, Okano S, Uchiyama H, Ikegami T, Harimoto N, et al. The Prognostic Impact of Programmed Cell Death Ligand 1 and Human Leukocyte Antigen Class I in Pancreatic Cancer. Cancer Med (2017) 6:1614–26. doi: 10.1002/cam4.1087
24. Xiao W, Hong H, Awadallah A, Zhou L, Xin W. Utilization of CDX2 Expression in Diagnosing Pancreatic Ductal Adenocarcinoma and Predicting Prognosis. PloS One (2014) 9:e86853. doi: 10.1371/journal.pone.0086853
25. Biankin AV, Morey AL, Lee CS, Kench JG, Biankin SA, Hook HC, et al. DPC4/Smad4 Expression and Outcome in Pancreatic Ductal Adenocarcinoma. J Clin Oncol (2002) 20:4531–42. doi: 10.1200/JCO.2002.12.063
26. Ho WJ, Jaffee EM, Zheng L. The Tumour Microenvironment in Pancreatic Cancer - Clinical Challenges and Opportunities. Nat Rev Clin Oncol (2020) 17:527–40. doi: 10.1038/s41571-020-0363-5
27. Banerjee K, Kumar S, Ross KA, Gautam S, Poelaert B, Nasser MW, et al. Emerging Trends in the Immunotherapy of Pancreatic Cancer. Cancer Lett (2018) 417:35–46. doi: 10.1016/j.canlet.2017.12.012
28. Mahajan UM, Langhoff E, Goni E, Costello E, Greenhalf W, Halloran C, et al. Immune Cell and Stromal Signature Associated With Progression-Free Survival of Patients With Resected Pancreatic Ductal Adenocarcinoma. Gastroenterology (2018) 155:1625–39.e2. doi: 10.1053/j.gastro.2018.08.009
29. Beatty GL, Winograd R, Evans RA, Long KB, Luque SL, Lee JW, et al. Exclusion of T Cells From Pancreatic Carcinomas in Mice Is Regulated by Ly6C(low) F4/80(+) Extratumoral Macrophages. Gastroenterology (2015) 149:201–10. doi: 10.1053/j.gastro.2015.04.010
30. Yao W, Maitra A, Ying H. Recent Insights Into the Biology of Pancreatic Cancer. EBioMedicine (2020) 53:102655. doi: 10.1016/j.ebiom.2020.102655
31. Karamitopoulou E. Tumour Microenvironment of Pancreatic Cancer: Immune Landscape Is Dictated by Molecular and Histopathological Features. Br J Cancer (2019) 121:5–14. doi: 10.1038/s41416-019-0479-5
32. Papalampros A, Vailas M, Ntostoglou K, Chiloeches ML, Sakellariou S, Chouliari NV, et al. Unique Spatial Immune Profiling in Pancreatic Ductal Adenocarcinoma With Enrichment of Exhausted and Senescent T Cells and Diffused CD47-SIRPα Expression. Cancers (Basel) (2020) 12:1825. doi: 10.3390/cancers12071825
33. Lundgren S, Warfvinge CF, Elebro J, Heby M, Nodin B, Krzyzanowska A, et al. The Prognostic Impact of NK/NKT Cell Density in Periampullary Adenocarcinoma Differs by Morphological Type and Adjuvant Treatment. PloS One (2016) 11:e0156497. doi: 10.1371/journal.pone.0156497
34. Wang WQ, Liu L, Xu HX, Wu CT, Xiang JF, Xu J, et al. Infiltrating Immune Cells and Gene Mutations in Pancreatic Ductal Adenocarcinoma. Br J Surg (2016) 103:1189–99. doi: 10.1002/bjs.10187
35. Miksch RC, Schoenberg MB, Weniger M, Bösch F, Ormanns S, Mayer B, et al. Prognostic Impact of Tumor-Infiltrating Lymphocytes and Neutrophils on Survival of Patients With Upfront Resection of Pancreatic Cancer. Cancers (Basel) (2019) 11:39. doi: 10.3390/cancers11010039
36. Takakura K, Ito Z, Suka M, Kanai T, Matsumoto Y, Odahara S, et al. Comprehensive Assessment of the Prognosis of Pancreatic Cancer: Peripheral Blood Neutrophil-Lymphocyte Ratio and Immunohistochemical Analyses of the Tumour Site. Scand J Gastroenterol (2016) 51:610–7. doi: 10.3109/00365521.2015.1121515
37. Werling RW, Yaziji H, Bacchi CE, Gown AM. CDX2, a Highly Sensitive and Specific Marker of Adenocarcinomas of Intestinal Origin: An Immunohistochemical Survey of 476 Primary and Metastatic Carcinomas. Am J Surg Pathol (2003) 27:303–10. doi: 10.1097/00000478-200303000-00003
38. Chu PG, Schwarz RE, Lau SK, Yen Y, Weiss LM. Immunohistochemical Staining in the Diagnosis of Pancreatobiliary and Ampulla of Vater Adenocarcinoma: Application of CDX2, Ck17, MUC1, and MUC2. Am J Surg Pathol (2005) 29:359–67. doi: 10.1097/01.pas.0000149708.12335.6a
39. Kaimaktchiev V, Terracciano L, Tornillo L, Spichtin H, Stoios D, Bundi M, et al. The Homeobox Intestinal Differentiation Factor CDX2 Is Selectively Expressed in Gastrointestinal Adenocarcinomas. Mod Pathol (2004) 17:1392–9. doi: 10.1038/modpathol.3800205
40. Liu H, Shi J, Anandan V, Wang HL, Diehl D, Blansfield J, et al. Reevaluation and Identification of the Best Immunohistochemical Panel (pVHL, Maspin, S100P, IMP-3) for Ductal Adenocarcinoma of the Pancreas. Arch Pathol Lab Med (2012) 136:601–9. doi: 10.5858/arpa.2011-0326-OA
41. Jiang Y, Zhang Y, Li F, Du X, Zhang J. CDX2 Inhibits Pancreatic Adenocarcinoma Cell Proliferation Via Promoting Tumor Suppressor miR-615-5p. Tumour Biol (2016) 37:1041–9. doi: 10.1007/s13277-015-3900-6
42. Blackford A, Serrano OK, Wolfgang CL, Parmigiani G, Jones S, Zhang X, et al. SMAD4 Gene Mutations are Associated With Poor Prognosis in Pancreatic Cancer. Clin Cancer Res (2009) 15:4674–9. doi: 10.1158/1078-0432.CCR-09-0227
43. Liang C, Shi S, Qin Y, Meng Q, Hua J, Hu Q, et al. Localisation of PGK1 Determines Metabolic Phenotype to Balance Metastasis and Proliferation in Patients With SMAD4-Negative Pancreatic Cancer. Gut (2020) 69:888–900. doi: 10.1136/gutjnl-2018-317163
44. Balachandran VP, Gonen M, Smith JJ, DeMatteo RP. Nomograms in Oncology: More Than Meets the Eye. Lancet Oncol (2015) 16:e173–80. doi: 10.1016/S1470-2045(14)71116-7
45. Wu M, Li X, Zhang T, Liu Z, Zhao Y. Identification of a Nine-Gene Signature and Establishment of a Prognostic Nomogram Predicting Overall Survival of Pancreatic Cancer. Front Oncol (2019) 9:996. doi: 10.3389/fonc.2019.00996
46. Hsu CC, Liu KH, Chang PH, Chen PT, Hung CY, Hsueh SW, et al. Development and Validation of a Prognostic Nomogram to Predict Survival in Patients With Advanced Pancreatic Cancer Receiving Second-Line Palliative Chemotherapy. J Gastroenterol Hepatol (2020) 35:1694–703. doi: 10.1111/jgh.14926
47. Chen S, Chen S, Lian G, Li Y, Ye X, Zou J, et al. Development and Validation of a Novel Nomogram for Pretreatment Prediction of Liver Metastasis in Pancreatic Cancer. Cancer Med (2020) 9:2971–80. doi: 10.1002/cam4.2930
48. Xie T, Wang X, Li M, Tong T, Yu X, Zhou Z. Pancreatic Ductal Adenocarcinoma: A Radiomics Nomogram Outperforms Clinical Model and TNM Staging for Survival Estimation After Curative Resection. Eur Radiol (2020) 30:2513–24. doi: 10.1007/s00330-019-06600-2
Keywords: pancreatic ductal adenocarcinoma, tumor microenvironment, large histological sections, immune cell, prognosis, nomogram
Citation: Ding G, Guo M, Yang Y, Sun C, Wu S, Liu X, Wang J, Jiang H, Liu Y and Zheng J (2021) Large-Section Histopathology Can Better Indicate the Immune Microenvironment and Predict the Prognosis of Pancreatic Ductal Adenocarcinoma Than Small-Section Histopathology. Front. Oncol. 11:694933. doi: 10.3389/fonc.2021.694933
Received: 14 April 2021; Accepted: 28 June 2021;
Published: 12 July 2021.
Edited by:
Erxi Wu, Baylor Scott and White Health, United StatesReviewed by:
Anju Kumari, National Cancer Institute, United StatesIlias Nikas, European University Cyprus, Cyprus
Copyright © 2021 Ding, Guo, Yang, Sun, Wu, Liu, Wang, Jiang, Liu and Zheng. This is an open-access article distributed under the terms of the Creative Commons Attribution License (CC BY). The use, distribution or reproduction in other forums is permitted, provided the original author(s) and the copyright owner(s) are credited and that the original publication in this journal is cited, in accordance with accepted academic practice. No use, distribution or reproduction is permitted which does not comply with these terms.
*Correspondence: Hui Jiang, amlhbmdodWk1MTMxQDE2My5jb20=; Yanfang Liu, bGl1eWFuZmFuZzAwMjE1QDE2My5jb20=; Jianming Zheng, am16aGVuZzE5NjJAMTYzLmNvbQ==