
94% of researchers rate our articles as excellent or good
Learn more about the work of our research integrity team to safeguard the quality of each article we publish.
Find out more
ORIGINAL RESEARCH article
Front. Oncol. , 31 May 2021
Sec. Molecular and Cellular Oncology
Volume 11 - 2021 | https://doi.org/10.3389/fonc.2021.654812
 Sumei Yao1†
 Ayse Ertay2†Yilu Zhou2,3†Liudi Yao2Charlotte Hill2Jinliang Chen1Yangbo Guan4
 Hui Sun5
 Rob M. Ewing2,3
 Yifei Liu5,6*Xuedong Lv1*
 Yihua Wang2,3*
G protein-coupled receptor kinase 6 (GRK6) is expressed in various tissues and is involved in the development of several diseases including lung cancer. We previously reported that GRK6 is down-regulated in lung adenocarcinoma patients, which induces cell invasion and metastasis. However, further understanding of the role of GRK6 in lung adenocarcinoma is required. Here we explored the functional consequence of GRK6 inhibition in lung epithelial cells. Analysis of TCGA data was coupled with RNA sequencing (RNA-seq) in alveolar epithelial type II (ATII) cells following depletion of GRK6 with RNA interference (RNAi). Findings were validated in ATII cells followed by tissue microarray analysis. Pathway analysis suggested that one of the Hallmark pathways enriched upon GRK6 inhibition is ‘Hallmark_Hypoxia’ (FDR = 0.014). We demonstrated that GRK6 depletion induces HIF1α (hypoxia-inducible factor 1 alpha) levels and activity in ATII cells. The findings were further confirmed in lung adenocarcinoma samples, in which GRK6 expression levels negatively and positively correlate with HIF1α expression (P = 0.015) and VHL expression (P < 0.0001), respectively. Mechanistically, we showed the impact of GRK6 on HIF activity could be achieved via regulation of VHL levels. Taken together, targeting the HIF pathway may provide new strategies for therapy in GRK6-depleted lung adenocarcinoma patients.
G protein-coupled receptor kinases (GRKs) are a family of kinases that play a critical role in G protein-coupled receptors (GPCRs) homologous desensitization. GRKs phosphorylate specific serine and threonine residues of activated GPCRs which promote high affinity binding of arrestins and then suppress further G protein activation by interrupting receptor-G protein coupling (1–3). Desensitization of GPCRs has a critical role in maintaining homeostasis. As such, abnormal GPCRs desensitization can cause a variety of human diseases, including autoimmune diseases (4), asthma (5), heart failure (6), Parkinson’s disease (7), inappropriate diuresis (8) and tumour progression and metastasis (9). Therefore, GRKs are important therapeutic targets for these diseases.
G protein-coupled receptor kinase 6 (GRK6) is a member of the GRK family, which is expressed in various tissues and involved in the development of several diseases (10–12). High expression of GRK6 has been reported in hepatocellular carcinoma (13), colorectal cancer (14); whilst lower expression was reported in hypopharyngeal squamous cell carcinoma (15) compared to normal tissues. Further, Grk6 knock out mice (Grk6-/-) showed a significant increase in the growth and metastasis of Lewis lung cancer (LLC) compared to the control mice (Grk6+/+) (2). Our previous study suggested that GRK6 expression was significantly down-regulated in lung adenocarcinoma patients, and its level was an independent prognostic factor for overall survival (16). Moreover, we also showed that the promoter region of the GRK6 gene was hyper-methylated in lung adenocarcinoma tissues compared to the normal tissue samples, leading to a down-regulation of GRK6 expression and in turn, inducing cell invasion and metastasis (17). However, further understanding of the role of GRK6 in lung adenocarcinoma is required.
In this study, we aimed to investigate the functional consequence of GRK6 depletion in lung epithelial cells. Analysis of TCGA data was coupled with RNA sequencing (RNA-seq) in alveolar epithelial type II (ATII) cells following the depletion of GRK6 with RNA interference (RNAi). Tissue microarrays were used to investigate the expression and function of GRK6 in lung adenocarcinoma. Our data suggests that GRK6 depletion induces HIF1α (hypoxia-inducible factor 1 alpha) activity. Targeting the HIF pathway may provide new strategies for therapy in GRK6-depleted lung adenocarcinoma patients.
ATII (alveolar epithelial type II, kindly provided by Prof Julian Downward, The Francis Crick Institute, UK) cells (18–21) were cultured in DCCM-1 (Biological Industries Ltd) supplemented with 10% new-born calf serum (NBCS) (Life Technologies), 1% penicillin, 1% streptomycin, and 1% L-glutamine (all from Life Technologies). All cells were kept at 37°C and 5% CO2. No mycoplasma contamination was detected in the cell lines used.
Short interfering RNA (siRNA) oligos against GRK6 or control siRNA were purchased from Biomics Biotechnologies Co., Ltd, China. Sequences are available from an earlier publication (17). Cells were transfected with the indicated siRNA oligos at a final concentration of 35 nM using Dharmafect 2 reagent (Dharmacon).
To identify global transcriptomic changes in ATII cells upon GRK6 depletion, RNA sequencing (RNA-seq) was performed. In brief, ATII cells were transfected with either control siRNA or siRNA against GRK6 for 3 days. Total RNA was isolated using an RNeasy mini kit (Qiagen) according to the manufacturer’s instructions and quantified using a Nanodrop Spectrophotometer 2000c (Thermo Fisher Scientific). A total amount of 3 µg RNA per sample was used as input material for library construction. Sequencing libraries were generated using NEBNext® UltraTM RNA Library Prep Kit for Illumina® (NEB, Ipswich, Massachusetts, USA) following the manufacturer’s instructions. Libraries were pooled in equimolar and sequenced using the paired-end strategy (2 × 150) on the Illumina NovaSeq 6000 platform following the standard protocols (Novogene, UK). RNA-seq data have been deposited in the Gene Expression Omnibus (GEO) database (accession code GSE164921).
Quality control of RNA-seq data was performed using FastQC (http://www.bioinformatics.babraham.ac.uk/projects/fastqc) and MultiQC (22). Trim Galore (https://github.com/FelixKrueger/TrimGalore) was used to trim adapters, reads with low quality (< 30), and short length (< 50 bp). RNA-seq reads were mapped to Human genome Ensembl GRCh38 using Hisat2 (23) (version 2.1.0) with default codes. Sam files were transformed into bam files using samtools (24) (version 1.9). The read counts of each gene were summarized using featureCounts (25) (version 1.6.5). Raw read counts were imported into RStudio (version 3.6.1) and analysed by using R package of DESeq2 (26) (version 1.26.0). Transcripts with low abundance (under 10 counts across all samples) were removed. Genes with a false discovery rate (FDR) P-value less than 0.05 adjusted by using Benjamini–Hochberg (BH) method (or q-value) were considered as differentially expressed genes (DEGs). Gene ontology (GO) enrichment analysis was generated through ToppGene (ToppGene Suite for gene list enrichment analysis and candidate gene prioritization) website (https://toppgene.cchmc.org/). Parameter was set with a FDR < 0.05. All downstream analysis was performed in RStudio (version 3.4.4).
The expression of mRNAs in the TCGA lung adenocarcinoma (LUAD) (IlluminaHiSeq) dataset was obtained from the UCSC Xena Browser (https://xenabrowser.net/). To separate the low and high GRK6 group in the TCGA dataset, hierarchical cluster was performed on the high correlated genes with GRK6 via Pearson analysis in RStudio (version 3.4.4). According to the correlation analysis, there were 17 samples in the high GRK6 group and 26 samples in the low GRK6 group. Then, an unpaired t-test was performed to identify significantly expressed mRNAs (FDR < 0.05) between the high and low GRK6 groups in RStudio (version 3.4.4). Codes are available upon request.
The statistically significant (FDR < 0.05) differentially expressed mRNAs in the TCGA (IlluminaHiseq) dataset that were highly expressed in the low GRK6 lung adenocarcinoma group were merged with statistically different genes in the RNA-sequencing dataset, which showed higher gene expression in siGRK6 samples compared to the control samples by using RStudio (version 3.4.4) to identify the top hit candidate gene(s) (Figure 2).
For pathway analysis, Metascape (https://metascape.org/gp/index.html#/main/step1) was used to detect functional enrichment of the identified top hit genes. The pathways were sorted from the lowest q-value and pathways with a q-value of less than 0.05 were chosen to create a histogram plot in GraphPad Prism 8.
Western blot analysis was performed with lysates from cells lysed with urea buffer (8M urea, 1M thiourea, 0.5% CHAPS, 50 mM DTT and 24 mM spermine). The bound proteins were separated on SDS polyacrylamide gels and subjected to immunoblotting with the indicated antibodies. Primary antibodies were from Proteintech (GRK6, Catalog No. 11439-1-AP, 1:1000) BD Transduction Laboratories™ (HIF1α, Catalog No. 610958, 1:1000) and Cell Signalling Technology (β-tubulin, Catalog No. 86298, 1:5000). Signals were detected using an Odyssey imaging system (LI-COR) or an ECL detection system (GE Healthcare, Chicago, IL, USA), and evaluated using ImageJ (version1.42q) software (National Institutes of Health) (Bethesda, MD, USA).
Real-time quantitative RT-PCR was performed using gene-specific primers (QuantiTect Primer Assays, Qiagen) for CA9 (QT00011697), NDRG1 (QT00059990) or ACTB (β-actin) (QT01680476) with QuantiNova SYBR Green RT-PCR kits (Qiagen). Relative transcript levels of target genes were normalised to ACTB (β-actin).
The study population comprised of 174 lung adenocarcinoma (LUAD) patients who were examined and treated at the Thoracic Surgery Department of the Affiliated Hospital of Nantong University and Thoracic Surgery Department of Second Affiliated Hospital of Nantong University between January 1, 2015, and December 31, 2016. The median age of patients at the time of diagnosis was 63 years (range 41–83 years). Study protocol was approved by the Ethics Committee of the Affiliated Hospital of Nantong University (No. 2018-L068), and all experiments were performed in accordance with approved guidelines of the Affiliated Hospital of Nantong University. Written informed consent was obtained from the patients for publication of this study and any accompanying images. Details of the clinical and demographic information were collected retrospectively. All patients underwent standard surgery aiming for maximal tumour resection. Patient clinical data were recorded in detail, and the diagnoses were confirmed by at least two pathologists. Tumour histological grades and clinical stages were evaluated according to the pathological results after surgery. All tumours were staged according to the pathological tumour/node/metastasis (pTNM) classification (7th edition) of the International Union against Cancer.
Tissue microarray system (Quick-Ray, UT06, UNITMA, Korea) in the Department of Clinical Pathology, Nantong University Hospital, Jiangsu, China, was used to generate TMA. Specifically, core tissue biopsies (2 mm in diameter) were taken from individual FFPE blocks and arranged in recipient paraffin blocks. TMA specimens were cut into 4 µm sections and placed on super frost-charged glass microscope slides. TMA analysis was used as a quality control for hematoxylin and eosin staining. Tissue sections were deparaffinized and rehydrated through graded ethanol. Antigen retrieval was performed with 0.01 M citrate buffer pH 6.0 and microwave heat induction. Endogenous peroxidase activity was blocked with 3% H2O2 for 30 min. Sections were then incubated with a rabbit polyclonal antibody specific to GRK6 (1:100; Proteintech, 11439-1-AP), HIF1α (1:100; Proteintech, 20960-1-AP) and VHL (1:100; Abcam, ab140989) at 4°C overnight, followed by incubation with a biotinylated anti-rabbit secondary antibody at 37°C for 30 min. Slides were then processed using horseradish peroxidase and 3,3-diaminobenzidine chromogen solution and counterstained with hematoxylin. The staining intensity of GRK6, HIF1α or VHL for each slide was evaluated and scored by two independent pathologists. Staining intensity was scored as follows: 0 (negative), 1+ (weak staining), 2+ (moderate staining), and 3+ (intense staining). For each of the four staining intensity scores, the percentage of cells stained at each intensity were determined. The intensity percentage score was the product of staining intensity and percentage of stained cells. The final staining scores were then evaluated from the sum of the four intensity percentage scores; thus, the staining score had a range from the minimum value of 0 (no staining) to a maximum of 300 (100% of cells with 3+ staining intensity), as described previously (27). The cut-off of 140 was selected to evaluate expression: score 0–140 was considered low expression, while 141–300 was considered high expression. For all subsequent analyses, GRK6, HIF1α and VHL protein expression levels were considered either as “low” or “high” according to these cut-off values.
Two-tailed, unpaired Student’s t-test for the TCGA data were performed in RStudio (version 3.4.4). For multiple t-test, P-values were adjusted by using Benjamini-Hochberg (BH) method. Codes are available upon request. Fisher’s exact test was used to evaluate the relationship of GRK6 and HIF1α expression in lung adenocarcinoma patient samples in IHC using GraphPad Prism 8 software. P < 0.05 was considered statistically significant.
We previously reported that GRK6 knockdown promotes cell migration and invasion in lung epithelial cells (17). To determine if, and how, lung epithelial cells responded to GRK6 inhibition, we characterised the global transcriptomic changes in alveolar epithelial type II (ATII) cells transfected with either siRNAs against GRK6 (siGRK6) or control siRNA (Control) by performing RNA sequencing (RNA-seq). Principal component analysis (PCA) showed good separation between Control compared to siGRK6 samples (n = 3 in each group) (Supplementary Figure 1).
Genes with a false discovery rate (FDR) adjusted P value (or q-value) of less than 0.05 were considered as differentially expressed genes (DEGs). In total, 7,116 DEGs were identified, including 3,430 up-regulated (Supplementary Table 1) and 3,686 down-regulated (Supplementary Table 2). We then performed gene ontology (GO) enrichment analysis of the identified DEGs using ToppGene (ToppGene Suite for gene list enrichment analysis and candidate gene prioritization) website (https://toppgene.cchmc.org/). The results were grouped into molecular function (MF), biological process (BP), and cellular component (CC). Interestingly, several disease-related pathological terms were identified, including mRNA metabolism, ribonucleoprotein complex biogenesis, and regulation of cellular response to stress (FDR < 0.05; Figures 1A, B; Supplementary Tables 3 and 4).
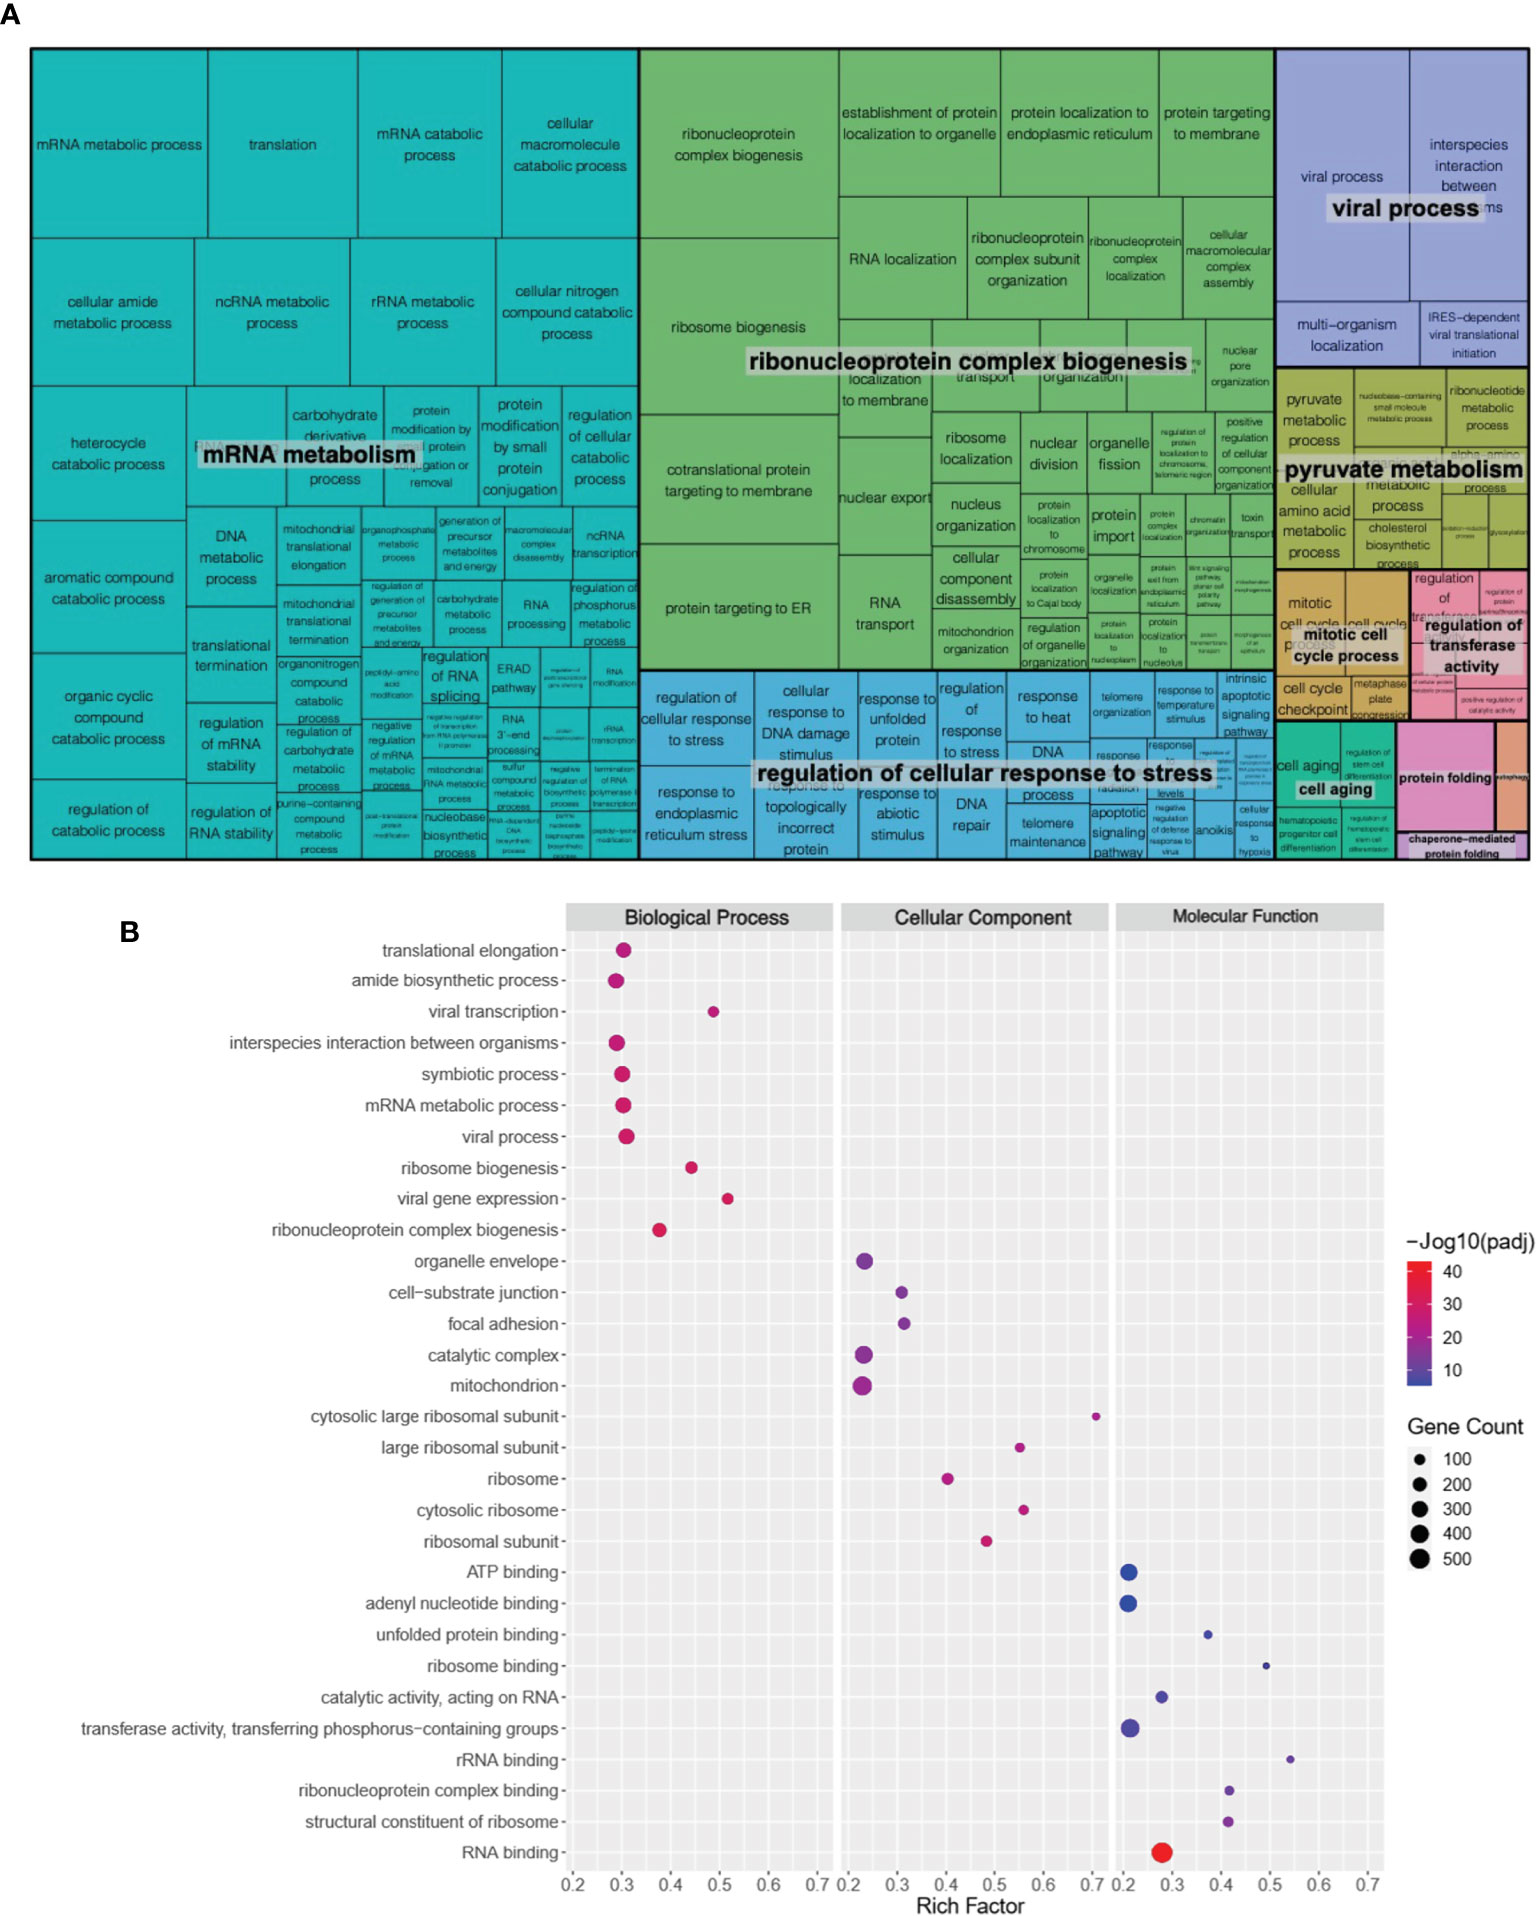
Figure 1 Global transcriptomic changes in ATII cells upon GRK6 depletion. (A) REVIGO TreeMap showing Gene Ontology (GO) analysis of upregulated differentially expressed genes (DEGs) in ATII cells transfected with siRNAs against GRK6 vs. control siRNA. Common colours represent groupings based on parent GO terms, and each rectangle is proportional to the relative enrichment of the GO term compared to the whole genome. Genes with false discovery rate (FDR) < 0.05 were considered as DEGs. (B) Scatter plot showing the top 10 enriched GO terms from 3 categories (biological process, cellular component, and molecular function) according to rich factors. Rich factor is the percentage of DEGs enriched gene count in the given annotated GO terms. The sizes of circles represent gene counts, and the colours of circles represent the -Log10 of the adjusted P−values (padj). Values less than 0.05 were considered as statistically significant.
To understand the role of GRK6 in lung adenocarcinoma, we performed TCGA analysis coupled with the RNA-seq data described above. As shown in Figure 2A, correlation analysis was performed in the TCGA lung adenocarcinoma (LUAD) (IlluminaHiseq) dataset; samples were separated into high vs. low GRK6 expression based on an unsupervised hierarchical clustering (Supplementary Figure 2). We identified 2,345 genes as differentially expressed in the high vs. low GRK6 samples in the TCGA dataset (Figure 2B). A total of 7,116 genes were differentially expressed in ATII cells transfected with control siRNA or siRNA against GRK6 (siGRK6) in RNA-seq, among which 3,430 up-regulated (Figure 2C). By cross-referencing the results from the TCGA analysis with the RNA-seq analysis, we identified 274 candidate genes, which were highly expressed in low GRK6 samples in the TCGA dataset (Figure 3A; Supplementary Table 5) and in siGRK6 samples in the RNA-seq analysis (Figure 3B; Supplementary Table 6).
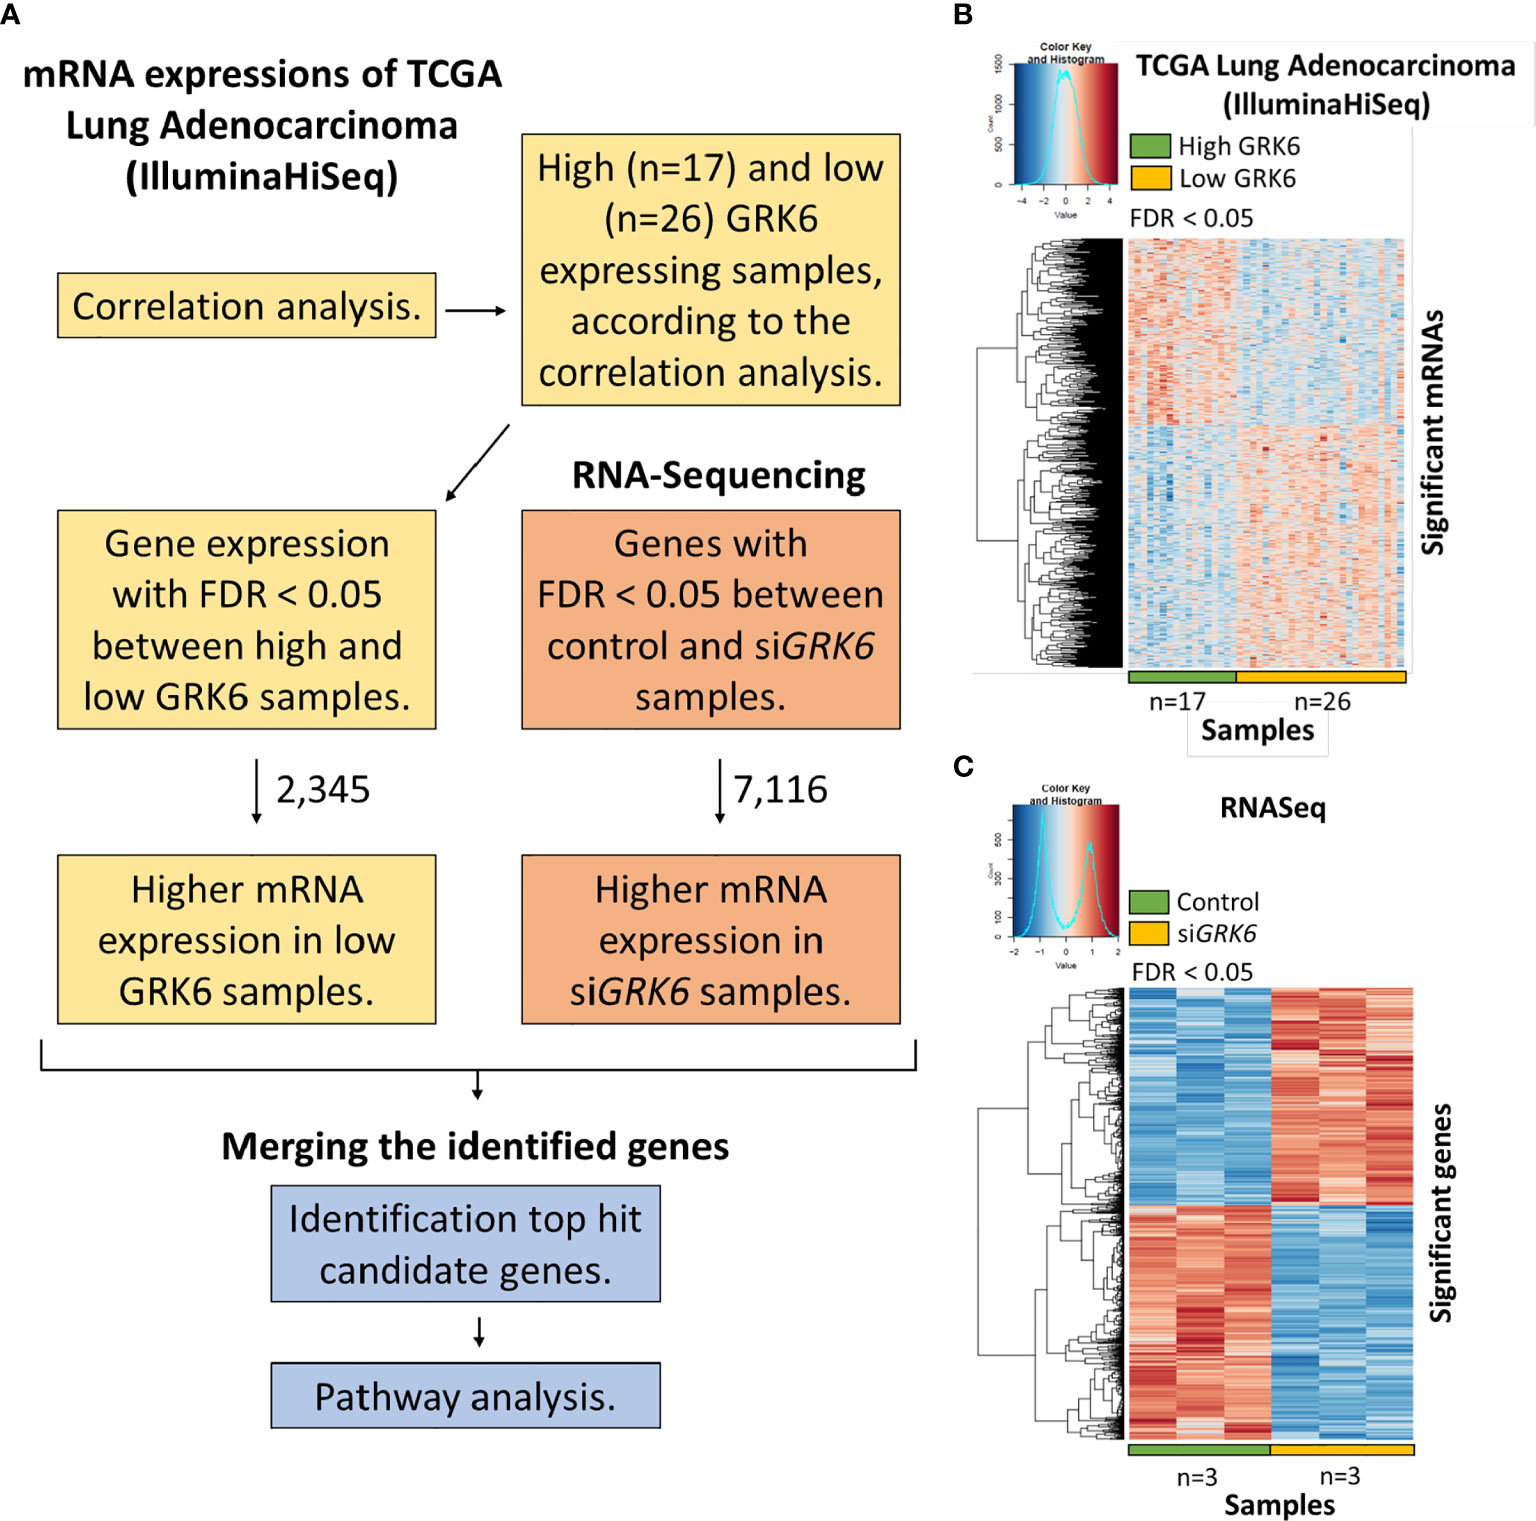
Figure 2 The analysis to identify candidate genes upon GRK6 inhibition. (A) In brief, TCGA analysis coupled to RNA sequencing in ATII cells upon GRK6 depletion (siGRK6) was used (details in Methods). FDR: false discovery rate. (B) Heat-map showing DEGs (differentially expressed genes) between low GRK6 (n = 26) and high GRK6 (n = 17) expressing lung adenocarcinoma samples from TCGA analysis. Red indicates up-regulation and blue indicates down-regulation. Genes with false discovery rate (FDR) adjusted P-values less than 0.05 were considered as DEGs. P-values were adjusted by using Benjamini-Hochberg (BH) method. (C) Heat-map showing DEGs in ATII cells transfected with siRNA against GRK6 (siGRK6) vs. control siRNA (Control). Red indicates up-regulation and blue down-regulation. n = 3 samples per group. DESeq2 Wald test was performed for statistical analysis. Genes with a false discovery rate (FDR) adjusted P-values of less than 0.05 were considered as DEGs. P-values were adjusted by using Benjamini-Hochberg (BH) method.
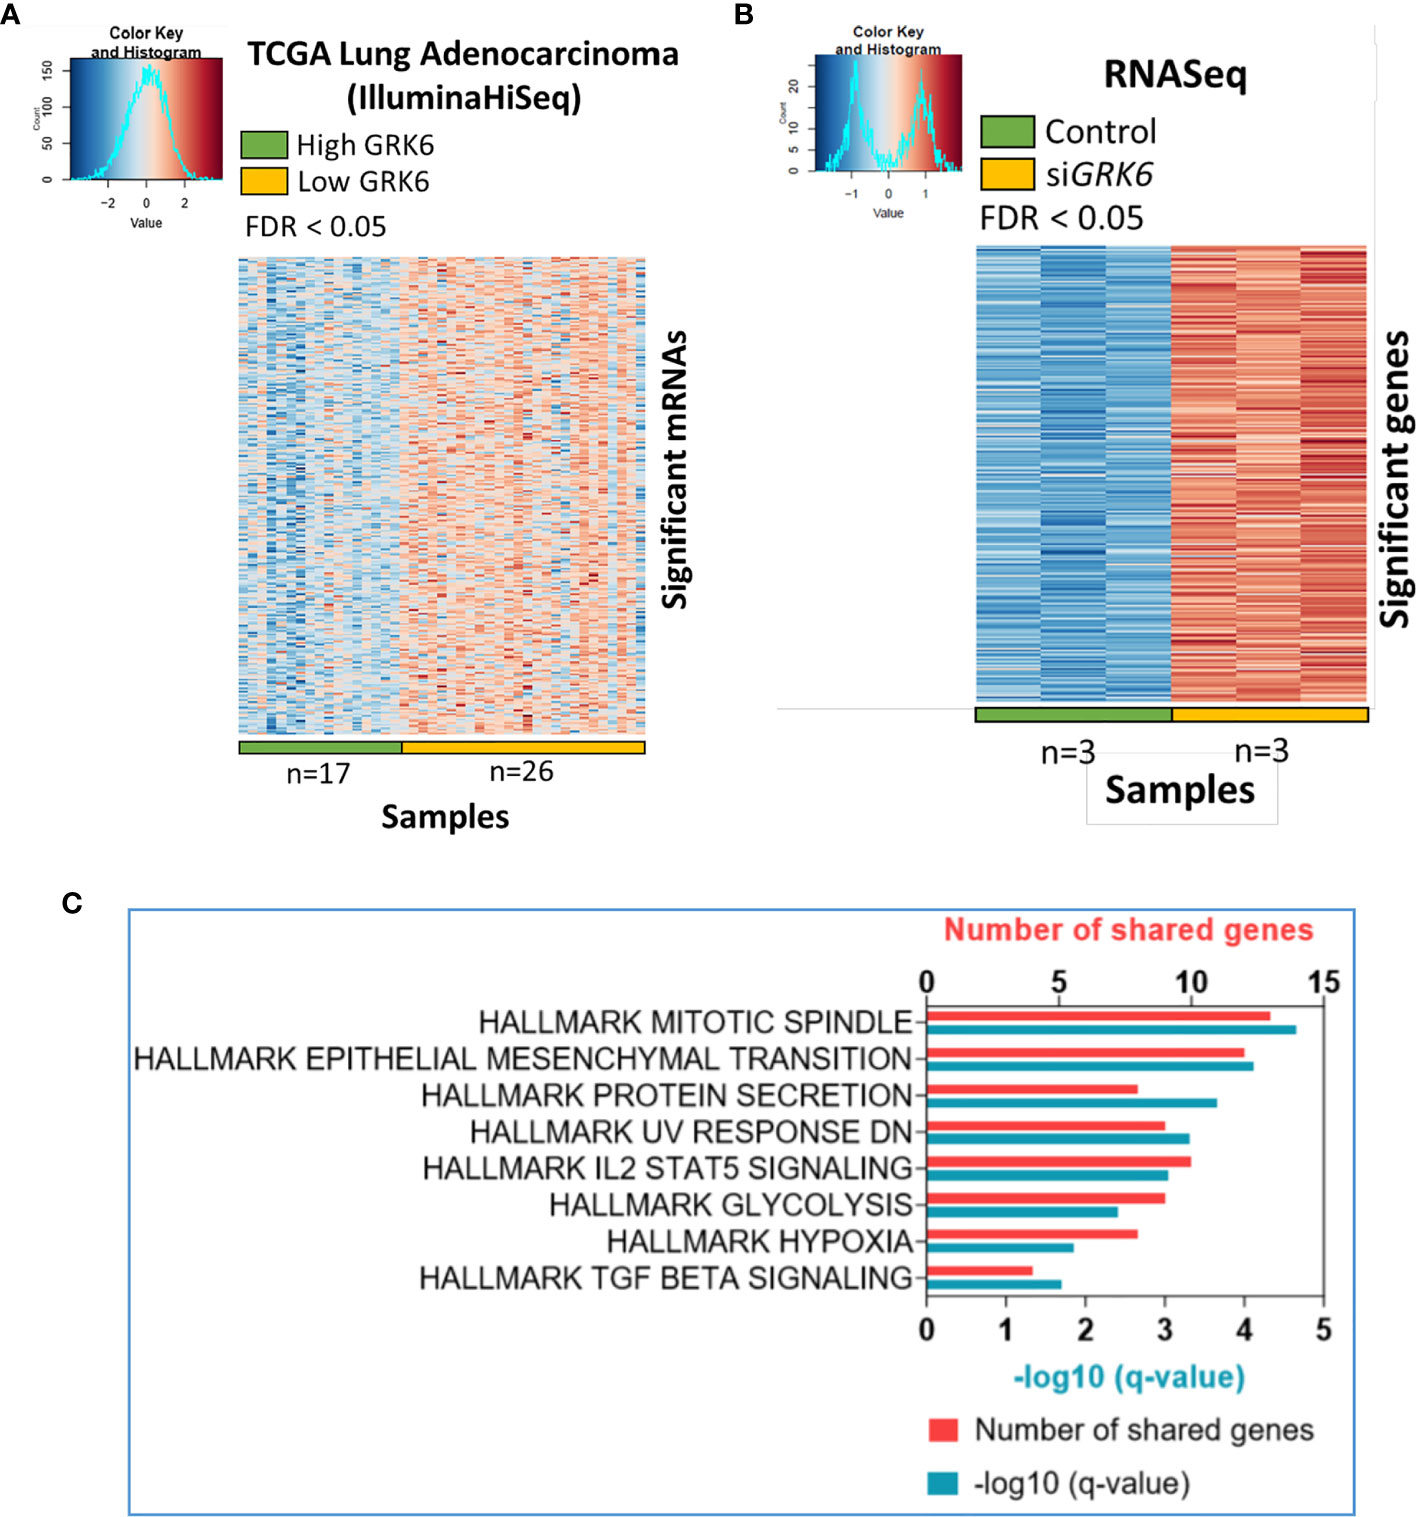
Figure 3 Candidate pathways enriched upon GRK6 inhibition are identified by TCGA analysis coupled to RNA sequencing. (A) Heat-map showing genes that are over-expressed in lung adenocarcinoma samples with low GRK6 (n = 26) compared to those with high GRK6 (n = 17) from TCGA analysis. Red indicates up-regulation and blue down-regulation. Genes with false discovery rate (FDR) adjusted P-values less than 0.05 were considered as DEGs. P-values were adjusted by using Benjamini-Hochberg (BH) method. (B) Heat-map showing DEGs (differentially expressed genes) that are over-expressed in ATII cells transfected with siRNA against GRK6 (siGRK6) vs. control siRNA. Red indicates up-regulation and blue down-regulation. n = 3 samples per group. DESeq2 Wald test was performed for statistical analysis. Genes with FDR adjusted P-values less than 0.05 were considered as DEGs. P-values were adjusted by using Benjamini-Hochberg (BH) method. (C) Pathways enriched upon GRK6 inhibition are visualised on a bar chart, showing number of shared genes and -Log10 (q value).
Metascape (https://metascape.org/gp/index.html#/main/step1) was used to investigate whether these genes were enriched in certain cellular pathways. We found that several Hallmark pathways, including mitotic spindle, epithelial mesenchymal transition (EMT), protein secretion, IL2 (interleukin 2) STAT5 (signal transducer and activator of transcription 5) signalling, glycolysis, hypoxia and TGFβ signalling, were enriched upon GRK6 inhibition in lung adenocarcinoma (Figure 3C; Table 1).

Table 1 List of pathways enriched upon GRK6 inhibition.
One of the Hallmark pathways enriched upon GRK6 inhibition is ‘Hallmark_Hypoxia’ (FDR = 0.014; Figure 3C; Table 1). In our RNA-seq analysis, knockdown of GRK6 in ATII cells (Figure 4A) led to significant increases in several hypoxia-induced genes, including CA9 (carbonic anhydrase 9), NDRG1 (N-Myc downstream-regulated 1), SLC2A1 (solute carrier family 2 member 1, also known as GLUT1, glucose transporter 1), P4HA1 (prolyl 4-hydroxylase subunit alpha 1) and ENO1 (enolase 1) (28) (Figure 4A). A significant increase in the mRNA levels of CA9 (P < 0.0001) and NDRG1 (P < 0.001) were confirmed with Q-RT-PCR (Figure 4B). In addition, the protein level of HIF1α, a key regulator of the cellular response to hypoxia (29), was significantly increased upon GRK6 depletion in the ATII cells as shown by western blot (Figures 4C, D; P < 0.01). To check how GRK6 may regulate HIF activity, the mRNA levels of HIF1α (HIF1A), HIF2α (EPAS1), HIF1β (ARNT) and VHL (Von Hippel-Lindau) were screened in the RNA-seq dataset. No changes in the expression levels of HIF1A, EPAS1 and ARNT were observed (Figure 4E; P > 0.05), while the VHL mRNA level was decreased upon GRK6 inhibition in ATII cells (Figure 4E; P < 0.001). These findings suggest that GRK6 inhibition induces HIF activity in the lungs potentially by regulating VHL, which functions as a master regulator of HIF activity by targeting the HIFα subunit for degradation (30–33).
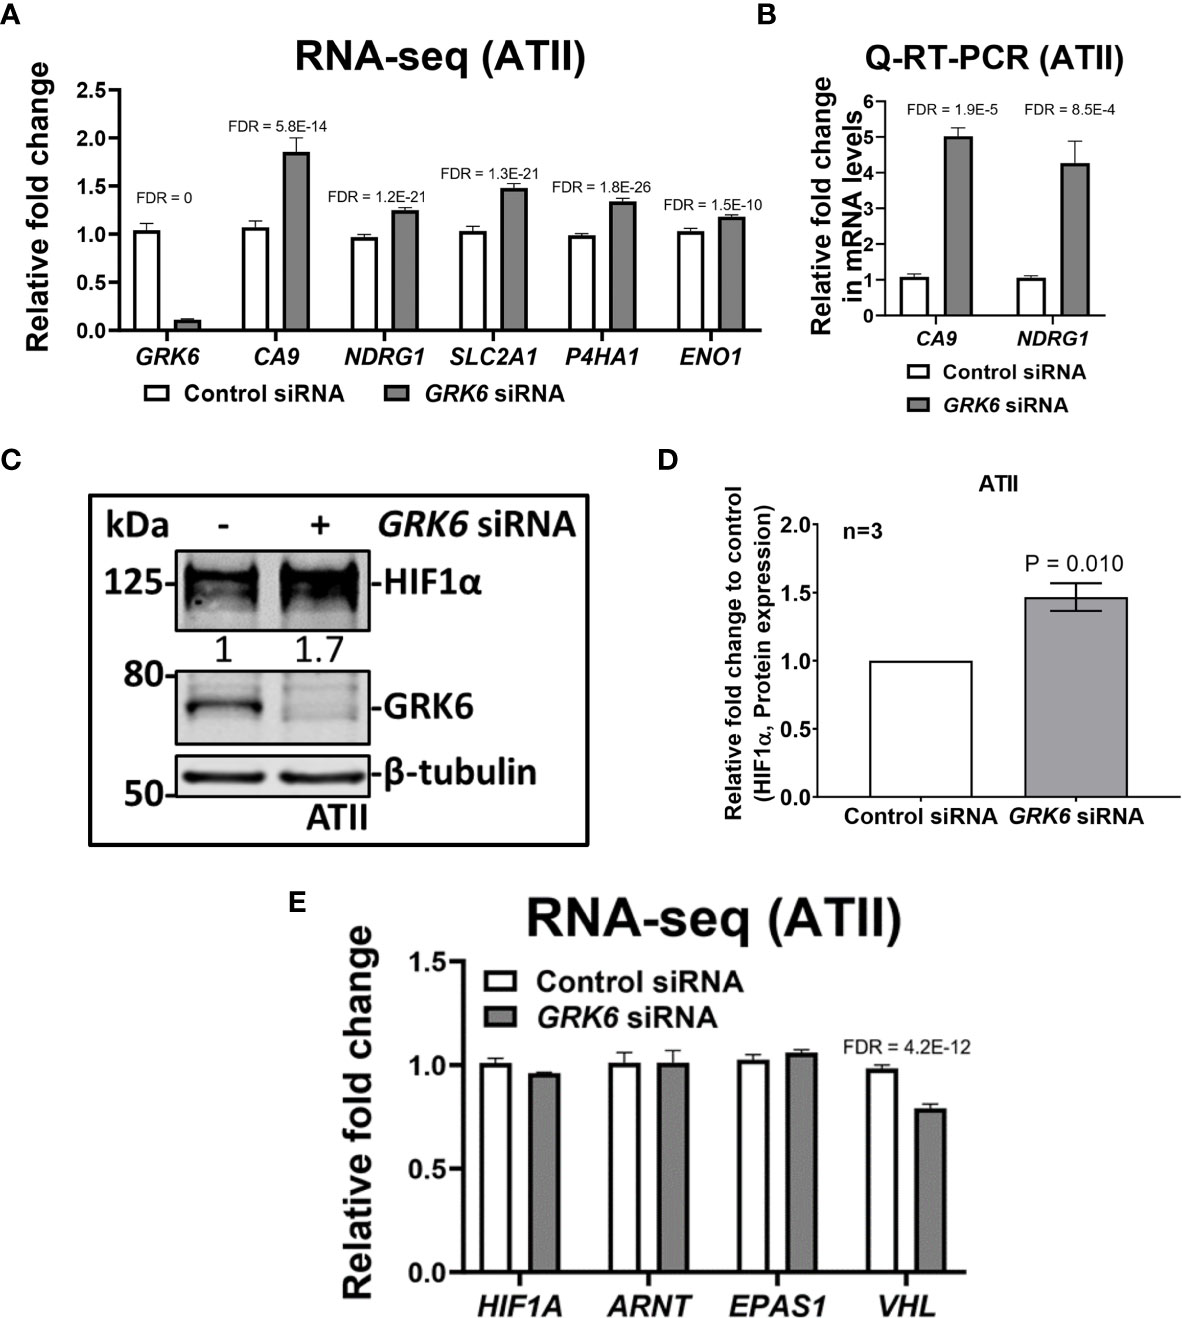
Figure 4 GRK6 depletion induces HIF (hypoxia-inducible factors) activity in ATII (alveolar epithelial type II) cells. (A) RNA-seq showing relative expressions of GRK6, CA9, NDRG1, SLC2A1, P4HA1 and ENO1 in ATII cells transfected with control or GRK6 siRNA. Data are mean ± s.d. n = 3 samples per group. Multiple t-test was performed for statistical analysis. Genes with false discovery rate (FDR) adjusted P-values less than 0.05 were considered as DEGs. P-values were adjusted by using Benjamini-Hochberg (BH) method. (B) Fold change in mRNA levels of CA9 and NDRG1 in ATII cells transfected with control or GRK6 siRNA. ACTB (β-actin)-normalised mRNA levels in control cells were used to set the baseline value at unity. Data are mean ± s.d. n = 3 samples per group. Multiple t-test was performed for statistical analysis. (C) Protein expression of HIF1α and GRK6 in ATII cells transfected with control or GRK6 siRNA. β-tubulin was used as a loading control. (D) Quantification of (C). Graph showing protein level of HIF1α in ATII cell line with indicated transfections. Data are mean ± s.d. n = 3 per group. Two tailed, unpaired Student’s t-test was performed for statistical analysis. P-value less than 0.05 was considered as statistically significant. (E) RNA-seq showing relative expression of HIF1A, ARNT, EPAS1 and VHL in ATII cells transfected with control or GRK6 siRNA. Data are mean ± s.d. n = 3 samples per group. Multiple t-test was performed for statistical analysis. Genes with FDR adjusted P-values less than 0.05 were considered as DEGs. P-values were adjusted by using Benjamini-Hochberg (BH) method.
To further validate the in vitro findings, the correlation between GRK6 expression and HIF1α levels or GRK6 expression and VHL levels were analysed in lung adenocarcinoma samples using tissue microarrays (Figure 5). Representative images of low and high expression of GRK6, HIF1α or VHL in lung adenocarcinoma samples are shown in Figures 5A–C, respectively. Importantly, the percentage of patients with high HIF1α expression (61%) in the low GRK6 group was significantly higher than in the high GRK6 group (41%) (Figure 5D; P < 0.05), while patients with low GRK6 tended to have a low level of VHL compared to those within high GRK6 group (Figure 5D; P < 0.0001).
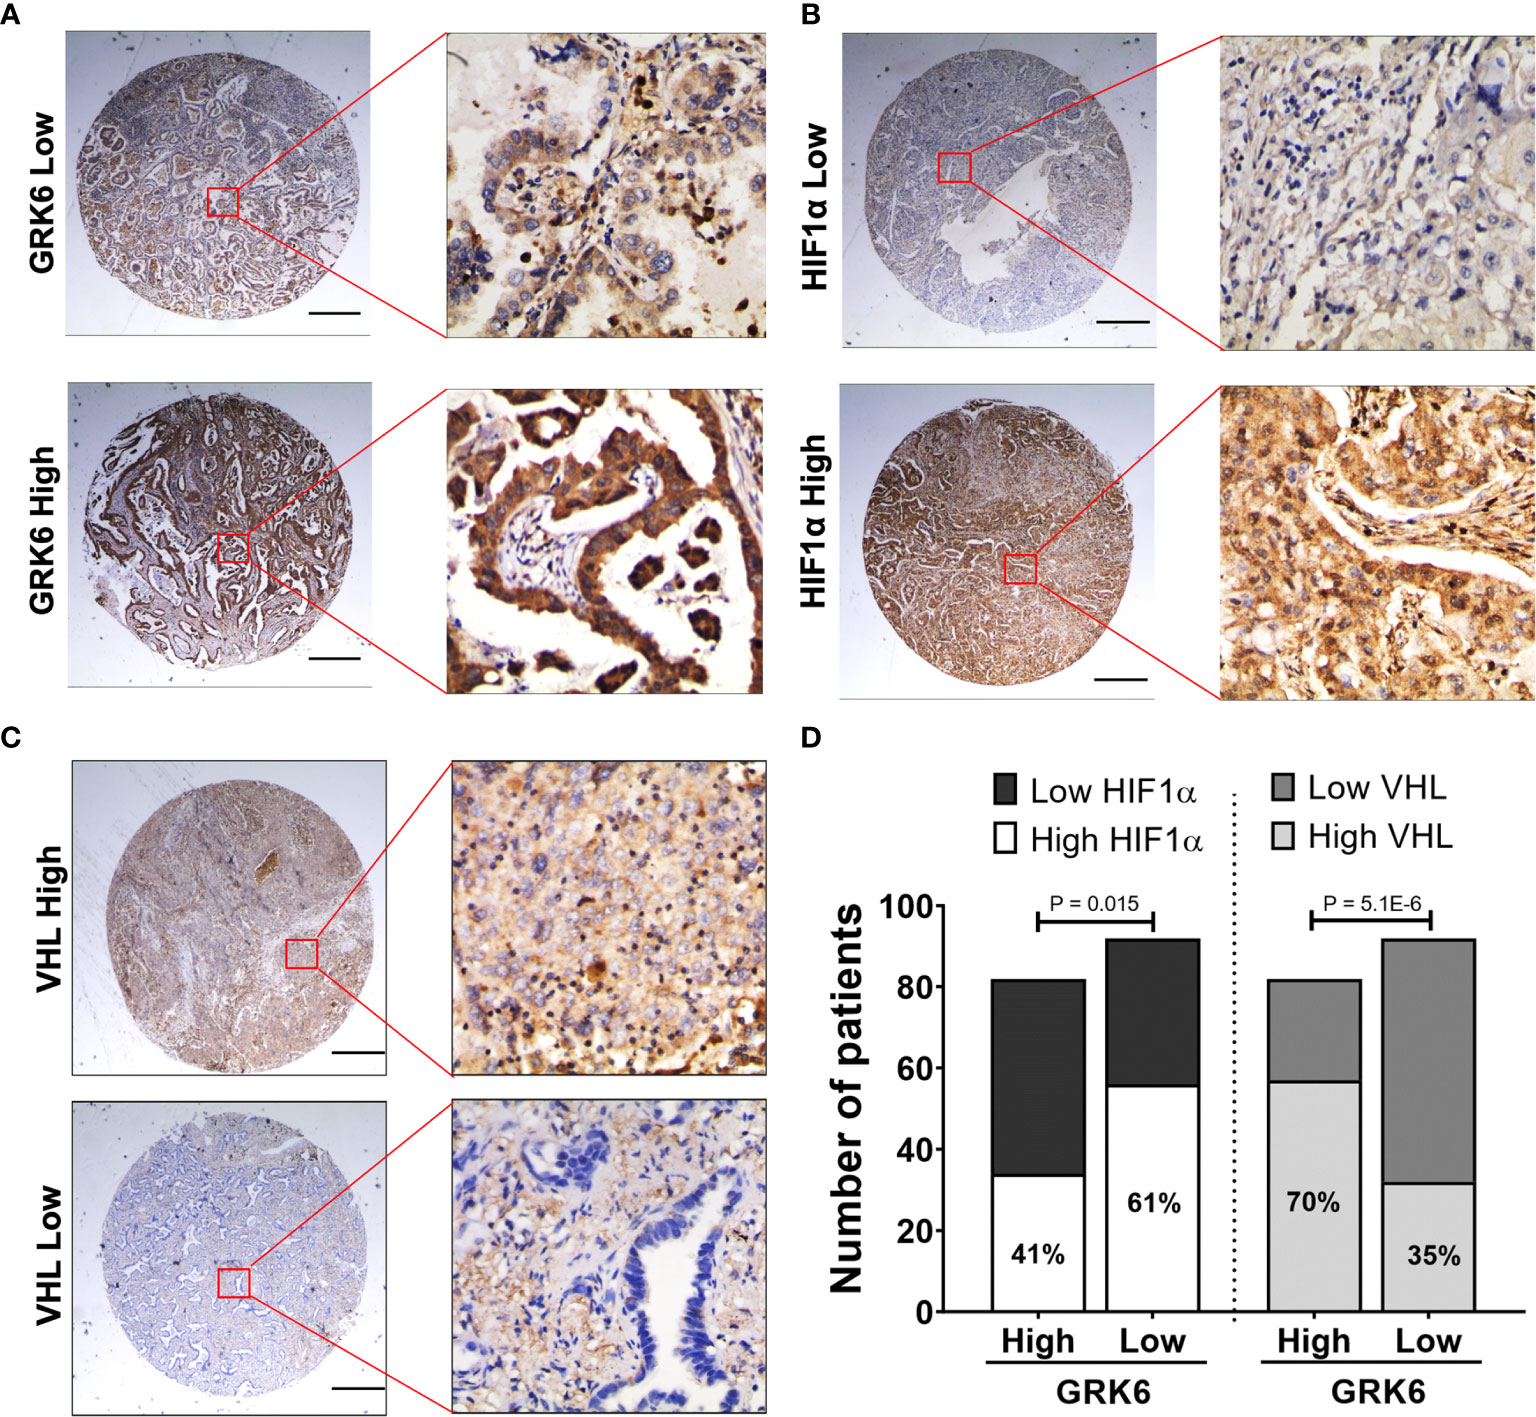
Figure 5 GRK6 expression levels negatively and positively correlate with HIF1α and VHL expressions in lung adenocarcinoma, respectively. (A) Representative GRK6 staining pattern (low or high GRK6) in lung adenocarcinoma tissue microarray cores. Scale bar: 500 μm. (B) Representative HIF1α staining pattern (low or high HIF1α) in lung adenocarcinoma tissue microarray cores. Scale bar: 500 μm. (C) Representative VHL staining pattern (low or high VHL) in lung adenocarcinoma tissue microarray cores. Scale bar: 500 μm. (D) Graph showing the number and percentage of lung adenocarcinoma patients with low/high HIF1α or low/high VHL in high vs. low GRK6 group. High GRK6 n = 82. Low GRK6 n = 92. Fisher’s exact test was performed for statistical analysis. P-values less than 0.05 were considered as statistically significant.
Lung cancer is the most prevalent and the leading cause of cancer death (34). Adenocarcinoma is the most common type of lung cancer, in both smokers and non-smokers, in females and males, and represents 40% of the lung cancer cases (35). Lung adenocarcinoma progresses from the small airway; one of the most abundant cell types present here are alveolar type II epithelial cells, which secrete mucus and other substances (36). Lung adenocarcinoma is one of the most aggressive cancers and the survival rate of patients is short after diagnosis with an overall survival rate of less than 5 years (35). The major challenge for lung adenocarcinoma is its resistance to conventional radiotherapies and chemotherapies (35).
Hypoxia is one of the typical features of the tumour microenvironment that increases the aggressiveness of different tumours such as lung cancer (37), colorectal cancer (38), hepatocellular carcinoma (39) and oesophageal squamous cell carcinoma (40). Hypoxic conditions lead to the activation of various transcription factors, such as HIF1; and the activation of downstream signalling pathways that regulate cell death, motility and proliferation (41). HIF1 is a heterodimeric transcription factor, capable of controlling the cellular adaptive response to hypoxia and has two subunits; HIF1α and HIF1β (42, 43). Cellular oxygen concentration regulates the protein expression of HIF1α so is a key factor for cellular adaptive response to hypoxia (43). HIF activities can also be up-regulated by other mechanisms (44, 45).
G protein-coupled receptor kinases (GRKs) are a family of kinases which can desensitize G protein-coupled receptors (GPCRs) homologous (1). GRK6 is of the members of the GRK family (10–12) and we previously showed that GRK6 is down-regulated in lung adenocarcinoma, which is associated with malignant tumour progression (16, 17), by an unknown mechanism.
To identify global transcriptomic changes in ATII cells upon GRK6 depletion, RNA-seq coupled with siRNA-mediated depletion of GRK6 was performed in ATII cells. We identified 3,430 up-regulated and 3,686 down-regulated DEGs. GO functional analysis with DEGs demonstrated that DEGs are mainly enriched in mRNA metabolism, ribonucleoprotein complex biogenesis, and regulation of cellular response to stress. To understand the role of GRK6 in lung adenocarcinoma, analysis of TCGA data was coupled with the RNA-seq data, described above. Pathway analysis suggested that one of the Hallmark pathways enriched upon GRK6 inhibition is ‘Hallmark_Hypoxia’. We demonstrated that GRK6 depletion induces HIF1α expression and activity in ATII cells. The findings were further confirmed in lung adenocarcinoma samples, in which GRK6 expressions negatively correlate with HIF1α protein levels. Mechanistically, the impact of GRK6 on HIF activity could be achieved via regulation of VHL levels, which is a master regulator of HIF activity by targeting the prolyl-hydroxylated HIF1α subunit for ubiquitylation and rapid proteasomal degradation (30–33). This study provides evidence that GRK6 inhibition causes a decrease in VHL expression, leading to HIFα stabilisation with increased activity in lung adenocarcinoma, although the underlying mechanism merits further investigation.
Earlier reports suggest that hypoxia regulates mRNA translation (46). RNA-binding proteins (heterogeneous nuclear ribonucleoproteins) have a role in post-transcriptional gene regulation under hypoxic conditions and are associated with hypoxia-induced transcripts that regulate encoded protein levels (47). Hypoxia can affect tumour cells; by acting as a stressor and inhibiting cell growth or inducing cell death. Alternatively, it can act by contributing to cancer progression and resistance to treatments, leading to hypoxia-induced genomic and proteomic changes in the cancer cells (48, 49).
We previously demonstrated that cell migration and invasion in lung epithelial cells is induced upon GRK6 knockdown (17). In addition to the hypoxia, this analysis showed EMT is also enriched upon GRK6 inhibition, which can explain our previous findings (17). The hypoxic tumour microenvironment can regulate EMT (50, 51). EMT is a biological process and the cell polarity and cell-cell adhesion of epithelial cells are lost and in turn become mesenchymal cells, which have migratory and invasive features (52). In a similar manner to our findings (17), previous studies in medulloblastoma (53) and Lewis lung carcinoma (2) show that when GRK6 was downregulated, migration and metastasis were increased. Consistently, it has been found that hypoxia-related genes CA9, NDRG1, SLC2A1, P4HA1 and ENO1 induced EMT in hepatocellular carcinoma (54), bladder cancer (55), laryngeal cancer (56) and gastric cancer (57, 58), respectively. Our study showed an increase of hypoxia-induced gene expression and HIF1α expression in GRK6 knockdown cells, this suggests that GRK6 knockdown may induce EMT in lung adenocarcinoma.
In summary, this study shows that GRK6 is involved in different disease-related pathological features; mRNA metabolism, ribonucleoprotein complex biogenesis, regulation of cellular response to stress, as well as EMT and hypoxia. Targeting the HIF pathway may provide new strategies for therapy in GRK6-depleted lung adenocarcinoma patients.
The datasets presented in this study can be found in online repositories. The names of the repository/repositories and accession number(s) can be found below: https://www.ncbi.nlm.nih.gov/geo/, GSE164921.
This study was approved by the Ethics Committee of the Affiliated Hospital of Nantong University (No. 2018-L068). The patients/participants provided their written informed consent to participate in this study.
Conceptualization and supervision: YW, YL, and XL. Investigation: SY, AE, YZ, LY, CH, JC, YG, and HS. Formal analysis: SY, AE, YZ, HS, and YW. Writing: AE, SY, YZ, LY, and CH with support from YW and RE. Funding acquisition: YW, YL, and SY. All authors contributed to the article and approved the submitted version.
This project was funded by grants from Medical Research Council (UK) [MR/S025480/1], Jiangsu Post-doctoral Foundation Research Project, China [No. 2019Z142], Key Talents of Medical Science in Jiangsu Province, China [No. QNRC2016682], and Science and Technology Project of Nantong [No. JCZ18130]. AE was supported by the Wessex Medical Trust. YZ was supported by an Institute for Life Sciences (University of Southampton) PhD Studentship. CH was supported by Gerald Kerkut Charitable Trust and University of Southampton Central VC Scholarship Scheme.
The authors declare that the research was conducted in the absence of any commercial or financial relationships that could be construed as a potential conflict of interest.
We thank Prof. Julian Downward (The Francis Crick Institute, UK) for providing ATII cells.
The Supplementary Material for this article can be found online at: https://www.frontiersin.org/articles/10.3389/fonc.2021.654812/full#supplementary-material
1. Vroon A, Heijnen CJ, Kavelaars A. GRKs and Arrestins: Regulators of Migration and Inflammation. J Leukocyte Biol (2006) 80(6):1214–21. doi: 10.1189/jlb.0606373
2. Raghuwanshi SK, Smith N, Rivers EJ, Thomas AJ, Sutton N, Hu Y, et al. GRK6 Deficiency Promotes Angiogenesis, Tumor Progression and Metastasis. J Immunol (2013) 190(10):5329–36. doi: 10.4049/jimmunol.1202058.GRK6
3. Bouvier M, Hausdorff WP, De Blasi A, O’Dowd BF, Kobilka BK, Caron MG, et al. Removal of Phosphorylation Sites From the β2-Adrenergic Receptor Delays Onset of Agonist-Promoted Desensitization. Nature (1988) 333(6170):370–3. doi: 10.1038/333370a0
4. Balabanian K, Lagane B, Pablos JL, Laurent L, Planchenault T, Verola O, et al. WHIM Syndromes With Different Genetic Anomalies are Accounted for by Impaired CXCR4 Desensitization to CXCL12. Blood (2005) 105(6):2449–57. doi: 10.1182/blood-2004-06-2289
5. Wang WCH, Mihlbachler KA, Brunnett AC, Liggett SB. Targeted Transgenesis Reveals Discrete Attenuator Functions of GRK and PKA in Airway β2-Adrenergic Receptor Physiologic Signaling. Proc Natl Acad Sci USA (2009) 106(35):15007–12. doi: 10.1073/pnas.0906034106
6. Rockman HA, Chien KR, Choi DJU, Iaccarino G, Hunter JJ, John Ross JR, et al. Expression of a β-Adrenergic Receptor Kinase 1 Inhibitor Prevents the Development of Myocardial Failure in Gene-Targeted Mice. Proc Natl Acad Sci USA (1998) 95(12):7000–5. doi: 10.1073/pnas.95.12.7000
7. Gainetdinov RR, Bohn LM, Sotnikova TD, Cyr M, Laakso A, Macrae AD, et al. Dopaminergic Supersensitivity in G Protein-Coupled Receptor Kinase 6-Deficient Mice. Neuron (2003) 38(2):291–303. doi: 10.1016/S0896-6273(03)00192-2
8. Barak LS, Oakley RH, Laporte SA, Caron MG. Constitutive Arrestin-Mediated Desensitization of a Human Vasopressin Receptor Mutant Associated With Nephrogenic Diabetes Insipidus. Proc Natl Acad Sci USA (2001) 98(1):93–8. doi: 10.1073/pnas.98.1.93
9. Yu S, Sun L, Jiao Y, Lee LTO. The Role of G Protein-Coupled Receptor Kinases in Cancer. Int J Biol Sci (2018) 14(2):189–203. doi: 10.7150/ijbs.22896
10. Ahmed MR, Berthet A, Bychkov E, Porras G, Li Q, Bioulac BH, et al. Lentiviral Overexpression of GRK6 Alleviates L-dopa-induced Dyskinesia in Experimental Parkinson’s Disease. Sci Trans Med (2010) 2(28):28ra28. doi: 10.1126/scitranslmed.3000664
11. Tiedemann RE, Zhu YX, Schmidt J, Yin H, Shi CX, Que Q, et al. Kinome-Wide RNAi Studies in Human Multiple Myeloma Identify Vulnerable Kinase Targets, Including a Lymphoid-Restricted Kinase, GRK6. Blood (2010) 115(8):1594–604. doi: 10.1182/blood-2009-09-243980
12. Willets JM, John Challiss RA, Nahorski SR. Endogenous G Protein-Coupled Receptor Kinase 6 Regulates M3 Muscarinic Acetylcholine Receptor Phosphorylation and Desensitization in Human SH-SY5Y Neuroblastoma Cells. J Biol Chem (2002) 277(18):15523–9. doi: 10.1074/jbc.M111217200
13. Li YP. GRK6 Expression in Patients With Hepatocellular Carcinoma. Asian Pacific J Trop Med (2013) 6(3):220–3. doi: 10.1016/S1995-7645(13)60027-9
14. Tao R, Li Q, Gao X, Ma L. Overexpression of GRK6 Associates With the Progression and Prognosis of Colorectal Carcinoma. Oncol Lett (2018) 15(4):5879–86. doi: 10.3892/ol.2018.8030
15. Qiu X, Chen J, Zhang Z, You Y, Wang Z. Aberrant GRK6 Promoter Methylation is Associated With Poor Prognosis in Hypopharyngeal Squamous Cell Carcinoma. Oncol Rep (2016) 35(2):1027–33. doi: 10.3892/or.2015.4469
16. Yao S, Zhong L, Liu J, Feng J, Bian T, Zhang Q, et al. Prognostic Value of Decreased GRK6 Expression in Lung Adenocarcinoma. J Cancer Res Clin Oncol (2016) 142(12):2541–9. doi: 10.1007/s00432-016-2244-y
17. Yao S, Wu D, Chen J, Wang P, Lv X, Huang J. Hypermethylation of the G Protein-Coupled Receptor Kinase 6 (GRK6) Promoter Inhibits Binding of C/EBPα, and GRK6 Knockdown Promotes Cell Migration and Invasion in Lung Adenocarcinoma Cells. FEBS Open Bio (2019) 9(4):605–17. doi: 10.1002/2211-5463.12606
18. Hill C, Li J, Liu D, Conforti F, Brereton CJ, Yao L, et al. Autophagy Inhibition-Mediated Epithelial–Mesenchymal Transition Augments Local Myofibroblast Differentiation in Pulmonary Fibrosis. Cell Death Dis (2019) 10(8):591. doi: 10.1038/s41419-019-1820-x
19. Molina-Arcas M, Hancock DC, Sheridan C, Kumar MS, Downward J. Coordinate Direct Input of Both KRAS and IGF1 Receptor to Activation of PI3 Kinase in KRAS -Mutant Lung Cancer. Cancer Discovery (2013) 3(5):548–63. doi: 10.1158/2159-8290.CD-12-0446
20. Coelho MA, de Carné Trécesson S, Rana S, Zecchin D, Moore C, Molina-Arcas M, et al. Oncogenic RAS Signaling Promotes Tumor Immunoresistance by Stabilizing PD-L1 mRNA. Immunity (2017) 47(6):1083–99.e6. doi: 10.1016/j.immuni.2017.11.016
21. Yao L, Conforti F, Hill C, Bell J, Drawater L, Li J, et al. Paracrine Signalling During ZEB1-Mediated Epithelial–Mesenchymal Transition Augments Local Myofibroblast Differentiation in Lung Fibrosis. Cell Death Differentiation (2019) 26(5):943–57. doi: 10.1038/s41418-018-0175-7
22. Ewels P, Magnusson M, Lundin S, Käller M. MultiQC: Summarize Analysis Results for Multiple Tools and Samples in a Single Report. Bioinformatics (2016) 32(19):3047–8. doi: 10.1093/bioinformatics/btw354
23. Kim D, Langmead B, Salzberg SL. Hisat: A Fast Spliced Aligner With Low Memory Requirements. Nat Methods (2015) 12(4):357–60. doi: 10.1038/nmeth.3317
24. Li H, Handsaker B, Wysoker A, Fennell T, Ruan J, Homer N, et al. The Sequence Alignment/Map Format and Samtools. Bioinformatics (2009) 25(16):2078–9. doi: 10.1093/bioinformatics/btp352
25. Liao Y, Smyth GK, Shi W. Featurecounts: An Efficient General Purpose Program for Assigning Sequence Reads to Genomic Features. Bioinformatics (2014) 30(7):923–30. doi: 10.1093/bioinformatics/btt656
26. Love MI, Huber W, Anders S. Moderated Estimation of Fold Change and Dispersion for RNA-seq Data With DESeq2. Genome Biol (2014) 15(12):550. doi: 10.1186/s13059-014-0550-8
27. Sun R, Wang X, Zhu H, Mei H, Wang W, Zhang S, et al. Prognostic Value of LAMP3 and TP53 Overexpression in Benign and Malignant Gastrointestinal Tissues. Oncotarget (2014) 5(23):12398–409. doi: 10.18632/oncotarget.2643
28. Buffa FM, Harris AL, West CM, Miller CJ. Large Meta-Analysis of Multiple Cancers Reveals a Common, Compact and Highly Prognostic Hypoxia Metagene. Br J Cancer (2010) 102(2):428–35. doi: 10.1038/sj.bjc.6605450
29. Kaelin WG, Ratcliffe PJ. Oxygen Sensing by Metazoans: The Central Role of the HIF Hydroxylase Pathway. Mol Cell (2008) 30(4):393–402. doi: 10.1016/j.molcel.2008.04.009
30. Cockman ME, Masson N, Mole DR, Jaakkola P, Chang GW, Clifford SC, et al. Hypoxia Inducible Factor-α Binding and Ubiquitylation by the Von Hippel-Lindau Tumor Suppressor Protein. J Biol Chem (2000) 275(33):25733–41. doi: 10.1074/jbc.M002740200
31. Ohh M, Park CW, Ivan M, Hoffman MA, Kim TY, Huang LE, et al. Ubiquitination of Hypoxia-Inducible Factor Requires Direct Binding to the β-Domain of the Von Hippel - Lindau Protein. Nat Cell Biol (2000) 2(7):423–7. doi: 10.1038/35017054
32. Schofield CJ, Ratcliffe PJ. Oxygen Sensing by HIF Hydroxylases. Nat Rev Mol Cell Biol (2004) 5(5):343–54. doi: 10.1038/nrm1366
33. Ratcliffe PJ. Oxygen Sensing and Hypoxia Signalling Pathways in Animals: The Implications of Physiology for Cancer. J Physiol (2013) 591(8):2027–42. doi: 10.1113/jphysiol.2013.251470
34. Bray F, Ferlay J, Soerjomataram I, Siegel RL, Torre LA, Jemal A. Global Cancer Statistics 2018: GLOBOCAN Estimates of Incidence and Mortality Worldwide for 36 Cancers in 185 Countries. CA: Cancer J Clin (2018) 68(6):394–424. doi: 10.3322/caac.21492
35. Denisenko TV, Budkevich IN, Zhivotovsky B. Cell Death-Based Treatment of Lung Adenocarcinoma. Cell Death Dis (2018) 9(2):117. doi: 10.1038/s41419-017-0063-y
36. Noguchi M, Morikawa A, Kawasaki M, Matsuno Y, Yamada T, Hirohashi S, et al. Small Adenocarcinoma of the Lung. Histologic Characteristics and Prognosis. Cancer (1995) 75(12):2844–52. doi: 10.1002/1097-0142(19950615)75:12<2844::aid-cncr2820751209>3.0.co;2-#
37. Le QT, Chen E, Salim A, Cao H, Kong CS, Whyte R, et al. An Evaluation of Tumor Oxygenation and Gene Expression in Patients With Early Stage non-Small Cell Lung Cancers. Clin Cancer Res (2006) 12(5):1507–14. doi: 10.1158/1078-0432.CCR-05-2049
38. Qureshi-Baig K, Kuhn D, Viry E, Pozdeev VI, Schmitz M, Rodriguez F, et al. Hypoxia-Induced Autophagy Drives Colorectal Cancer Initiation and Progression by Activating the PRKC/PKC-EZR (ezrin) Pathway. Autophagy (2020) 16(8):1436–52. doi: 10.1080/15548627.2019.1687213
39. Kung-Chun Chiu D, Pui-Wah Tse A, Law CT, Ming-Jing Xu I, Lee D, Chen M, et al. Hypoxia Regulates the Mitochondrial Activity of Hepatocellular Carcinoma Cells Through HIF/HEY1/PINK1 Pathway. Cell Death Dis (2019) 10(12):934. doi: 10.1038/s41419-019-2155-3
40. Zhang Q, Zhang J, Fu Z, Dong L, Tang Y, Xu C, et al. Hypoxia-Induced microRNA-10b-3p Promotes Esophageal Squamous Cell Carcinoma Growth and Metastasis by Targeting TSGA10. Aging (2019) 11(22):10374–84. doi: 10.18632/aging.102462
41. Semenza GL. Hypoxia-Inducible Factors: Mediators of Cancer Progression and Targets for Cancer Therapy. Trends Pharmacol Sci (2012) 33(4):207–14. doi: 10.1016/j.tips.2012.01.005
42. Semenza GL. Hypoxia, Clonal Selection, and the Role of HIF-1 in Tumor Progression. Crit Rev Biochem Mol Biol (2000) 35(2):71–103. doi: 10.1080/10409230091169186
43. Jiang BH, Semenza GL, Bauer C, Marti HH. Hypoxia-Inducible Factor 1 Levels Vary Exponentially Over a Physiologically Relevant Range of O2 Tension. Am J Physiol - Cell Physiol (1996) 271(4):C1172–80. doi: 10.1152/ajpcell.1996.271.4.c1172
44. Zhang WC, Wells JM, Chow K-H, Huang H, Yuan M, Saxena T, et al. miR-147b-Mediated TCA Cycle Dysfunction and Pseudohypoxia Initiate Drug Tolerance to EGFR Inhibitors in Lung Adenocarcinoma. Nat Metab (2019) 1(4):460–74. doi: 10.1038/s42255-019-0052-9
45. Zhao F, Malm SW, Hinchman AN, Li H, Beeks CG, Klimecki WT. Arsenite-Induced Pseudo-Hypoxia Results in Loss of Anchorage-Dependent Growth in BEAS-2B Pulmonary Epithelial Cells. PloS One (2014) 9(12):e114549. doi: 10.1371/journal.pone.0114549
46. Liu L, Cash TP, Jones RG, Keith B, Thompson CB, Simon MC. Hypoxia-Induced Energy Stress Regulates mRNA Translation and Cell Growth. Mol Cell (2006) 21(4):521–31. doi: 10.1016/j.molcel.2006.01.010
47. Yang R, Weber DJ, Carrier F. Post-Transcriptional Regulation of Thioredoxin by the Stress Inducible Heterogenous Ribonucleoprotein A18. Nucleic Acids Res (2006) 34(4):1224–36. doi: 10.1093/nar/gkj519
48. Höckel M, Vaupel P. Tumor Hypoxia: Definitions and Current Clinical, Biologic, and Molecular Aspects. J Natl Cancer Institute (2001) 93(4):266–76. doi: 10.1093/jnci/93.4.266
49. Vaupel P, Thews O, Hoeckel M. Treatment Resistance of Solid Tumors: Role of Hypoxia and Anemia. Med Oncol (2001) 18(4):243–59. doi: 10.1385/MO:18:4:243
50. Joseph JP, Harishankar MK, Pillai AA, Devi A. Hypoxia Induced EMT: A Review on the Mechanism of Tumor Progression and Metastasis in OSCC. Oral Oncol (2018) 80(1):23–32. doi: 10.1016/j.oraloncology.2018.03.004
51. Wei L, Sun JJ, Cui YC, Jiang SL, Wang XW, Lv LY, et al. Twist may be Associated With Invasion and Metastasis of Hypoxic NSCLC Cells. Tumor Biol (2016) 37(7):9979–87. doi: 10.1007/s13277-016-4896-2
52. Polyak K, Weinberg RA. Transitions Between Epithelial and Mesenchymal States: Acquisition of Malignant and Stem Cell Traits. Nat Rev Cancer (2009) 9(4):265–73. doi: 10.1038/nrc2620
53. Yuan L, Zhang H, Liu J, Rubin JB, Cho YJ, Shu HK, et al. Growth Factor Receptor-Src-mediated Suppression of GRK6 Dysregulates CXCR4 Signaling and Promotes Medulloblastoma Migration. Mol Cancer (2013) 12(1):18. doi: 10.1186/1476-4598-12-18
54. Hyuga S, Wada H, Eguchi H, Otsuru T, Iwgami Y, Yamada D, et al. Expression of Carbonic Anhydrase IX is Associated With Poor Prognosis Through Regulation of the Epithelial-Mesenchymal Transition in Hepatocellular Carcinoma. Int J Oncol (2017) 51(4):1179–90. doi: 10.3892/ijo.2017.4098
55. Li A, Zhu X, Wang C, Yang S, Qiao Y, Qiao R, et al. Upregulation of NDRG1 Predicts Poor Outcome and Facilitates Disease Progression by Influencing the EMT Process in Bladder Cancer. Sci Rep (2019) 9(1):5166. doi: 10.1038/s41598-019-41660-w
56. Starska K, Forma E, Jóźwiak P, Bryś M, Lewy-Trenda I, Brzezińska-Błaszczyk E, et al. Gene and Protein Expression of Glucose Transporter 1 and Glucose Transporter 3 in Human Laryngeal Cancer—the Relationship With Regulatory Hypoxia-Inducible Factor-1α Expression, Tumor Invasiveness, and Patient Prognosis. Tumor Biol (2015) 36(4):2309–21. doi: 10.1007/s13277-014-2838-4
57. Zhang J, Guo S, Wu Y, Zheng ZC, Wang Y, Zhao Y. P4HB, a Novel Hypoxia Target Gene Related to Gastric Cancer Invasion and Metastasis. BioMed Res Int (2019) 2019(1):9749751. doi: 10.1155/2019/9749751
Keywords: GRK6, HIF, lung adenocarcinoma, hypoxia, EMT
Citation: Yao S, Ertay A, Zhou Y, Yao L, Hill C, Chen J, Guan Y, Sun H, Ewing RM, Liu Y, Lv X and Wang Y (2021) GRK6 Depletion Induces HIF Activity in Lung Adenocarcinoma. Front. Oncol. 11:654812. doi: 10.3389/fonc.2021.654812
Received: 17 January 2021; Accepted: 26 April 2021;
Published: 31 May 2021.
Edited by:
Benjamin Kidder, Wayne State University, United StatesReviewed by:
Gratien Prefontaine, Simon Fraser University, CanadaCopyright © 2021 Yao, Ertay, Zhou, Yao, Hill, Chen, Guan, Sun, Ewing, Liu, Lv and Wang. This is an open-access article distributed under the terms of the Creative Commons Attribution License (CC BY). The use, distribution or reproduction in other forums is permitted, provided the original author(s) and the copyright owner(s) are credited and that the original publication in this journal is cited, in accordance with accepted academic practice. No use, distribution or reproduction is permitted which does not comply with these terms.
*Correspondence: Yihua Wang, eWlodWEud2FuZ0Bzb3Rvbi5hYy51aw==; Xuedong Lv, bHZ4dWVkb25nMTk2OEAxNjMuY29t; Yifei Liu, bnRkeGxpdXlpZmVpQHNpbmEuY29t
†These authors have contributed equally to this work
Disclaimer: All claims expressed in this article are solely those of the authors and do not necessarily represent those of their affiliated organizations, or those of the publisher, the editors and the reviewers. Any product that may be evaluated in this article or claim that may be made by its manufacturer is not guaranteed or endorsed by the publisher.
Research integrity at Frontiers
Learn more about the work of our research integrity team to safeguard the quality of each article we publish.