
94% of researchers rate our articles as excellent or good
Learn more about the work of our research integrity team to safeguard the quality of each article we publish.
Find out more
ORIGINAL RESEARCH article
Front. Oncol., 11 June 2021
Sec. Cancer Imaging and Image-directed Interventions
Volume 11 - 2021 | https://doi.org/10.3389/fonc.2021.654685
This article is part of the Research TopicThe Use Of Deep Learning In Mapping And Diagnosis Of CancersView all 21 articles
 Gumuyang Zhang1†
 Zhe Wu2†
 Lili Xu1Xiaoxiao Zhang1Daming Zhang1
 Li Mao3
 Xiuli Li3Yu Xiao4Jun Guo2
 Zhigang Ji5
 Hao Sun1*‡
 Zhengyu Jin1‡
Background: Clinical treatment decision making of bladder cancer (BCa) relies on the absence or presence of muscle invasion and tumor staging. Deep learning (DL) is a novel technique in image analysis, but its potential for evaluating the muscular invasiveness of bladder cancer remains unclear. The purpose of this study was to develop and validate a DL model based on computed tomography (CT) images for prediction of muscle-invasive status of BCa.
Methods: A total of 441 BCa patients were retrospectively enrolled from two centers and were divided into development (n=183), tuning (n=110), internal validation (n=73) and external validation (n=75) cohorts. The model was built based on nephrographic phase images of preoperative CT urography. Receiver operating characteristic (ROC) curves were performed and the area under the ROC curve (AUC) for discrimination between muscle-invasive BCa and non-muscle-invasive BCa was calculated. The performance of the model was evaluated and compared with that of the subjective assessment by two radiologists.
Results: The DL model exhibited relatively good performance in all cohorts [AUC: 0.861 in the internal validation cohort, 0.791 in the external validation cohort] and outperformed the two radiologists. The model yielded a sensitivity of 0.733, a specificity of 0.810 in the internal validation cohort and a sensitivity of 0.710 and a specificity of 0.773 in the external validation cohort.
Conclusion: The proposed DL model based on CT images exhibited relatively good prediction ability of muscle-invasive status of BCa preoperatively, which may improve individual treatment of BCa.
Bladder cancer (BCa) is one of the most common and lethal malignancies worldwide (1, 2). Clinical treatment decision making primarily relies on the absence or presence of muscle invasion and tumor staging (3). Nonmuscle-invasive BCa (NMIBC) and muscle-invasive BCa (MIBC) exhibit significant differences in prognosis, management and therapeutic aims (3, 4). Accurate preoperative assessment of the muscular invasiveness of BCa is crucial for selecting the optimal therapy for individual patients.
Cystoscopy examination together with histological evaluation of the resected tissues is the mainstay of diagnosis and clinical staging of BCa. As biopsy is operator dependent and unlikely to sample every part of the tumor, incorrect staging occurs, and up to 25% of MIBC cases are initially misdiagnosed as NIMBC (5, 6). Repeated examinations could improve the diagnostic accuracy, but the invasive nature has made this process undesirable. Developing a noninvasive method for preoperative evaluation would greatly benefit BCa patients. Computed tomography (CT) imaging has been widely used to preoperatively evaluate BCa patients and assist in tumor staging, especially for T3 and T4 tumors (7). Given its inability to differentiate among layers of the bladder wall, the role of traditional CT in the classification of NIMBC and MIBC is limited. Thus, developing a technique that could provide additional information about the status of muscular invasion of BCa would enable traditional CT to play a larger role in BCa evaluation and assist in patient management.
Deep learning (DL) is a novel and promising technique that has demonstrated great potential in disease diagnosis (8–10). DL can extract and combine features from images to construct a model that reveals the relationship between images and diseases. It has been reported that the DL model could facilitate imaging diagnosis in various diseases with high accuracy, including liver fibrosis, pancreatic cancer and pulmonary nodules (9, 11, 12). For BCa, the DL model based on CT images has demonstrated the potential to assist in therapy evaluation (13). However, the use of the DL based on CT images to discriminate between MIBC and NIBC has not yet been reported.
Therefore, the aim of this study was to develop and validate a DL model based on CT images for individualized prediction of the muscle-invasive status of BCa preoperatively.
This retrospective study was approved by the Institutional Review Board of the two medical centers, and the requirement of informed consent was waived. The inclusion criteria were as follows: (i) patients who underwent transurethral resection of bladder tumor (TURBT) or radical cystectomy in the two centers with pathologically confirmed urothelial carcinoma and (ii) availability of preoperative CT urography (CTU) within 20 days before surgery. Patients were excluded if (i) they had preoperative therapy, including chemotherapy or radiotherapy; (ii) they had other tumors simultaneously; (iii) their TURBT specimens had no muscle after resection; or (iv) no visible tumor was detected on preoperative enhanced pelvic CT images. Two radiologists (H.S. in Center 1 and Z.W. in Center 2) identified patients according to the above criteria, and 366 patients were recruited from May 2014 to July 2018 from Center 1 (91 patients with MIBC, 275 patients with NIMBC) and 75 patients from April 2018 to May 2020 in Center 2 (31 patients with MIBC, 44 patients with NIMBC). We divided the patients into three cohorts: 293 patients treated between May 2014 and September 2017 in Center 1 were allocated to the training cohort, 73 patients treated between October 2017 and July 2018 in Center 1 were allocated to the internal validation cohort, and all 75 patients treated in Center 2 constituted the external cohort. The training cohort was further randomly assigned into a development set (n=183) for model training and a tuning set (n=110) for model selection. The study flow and recruitment pathway are presented in Figure 1.
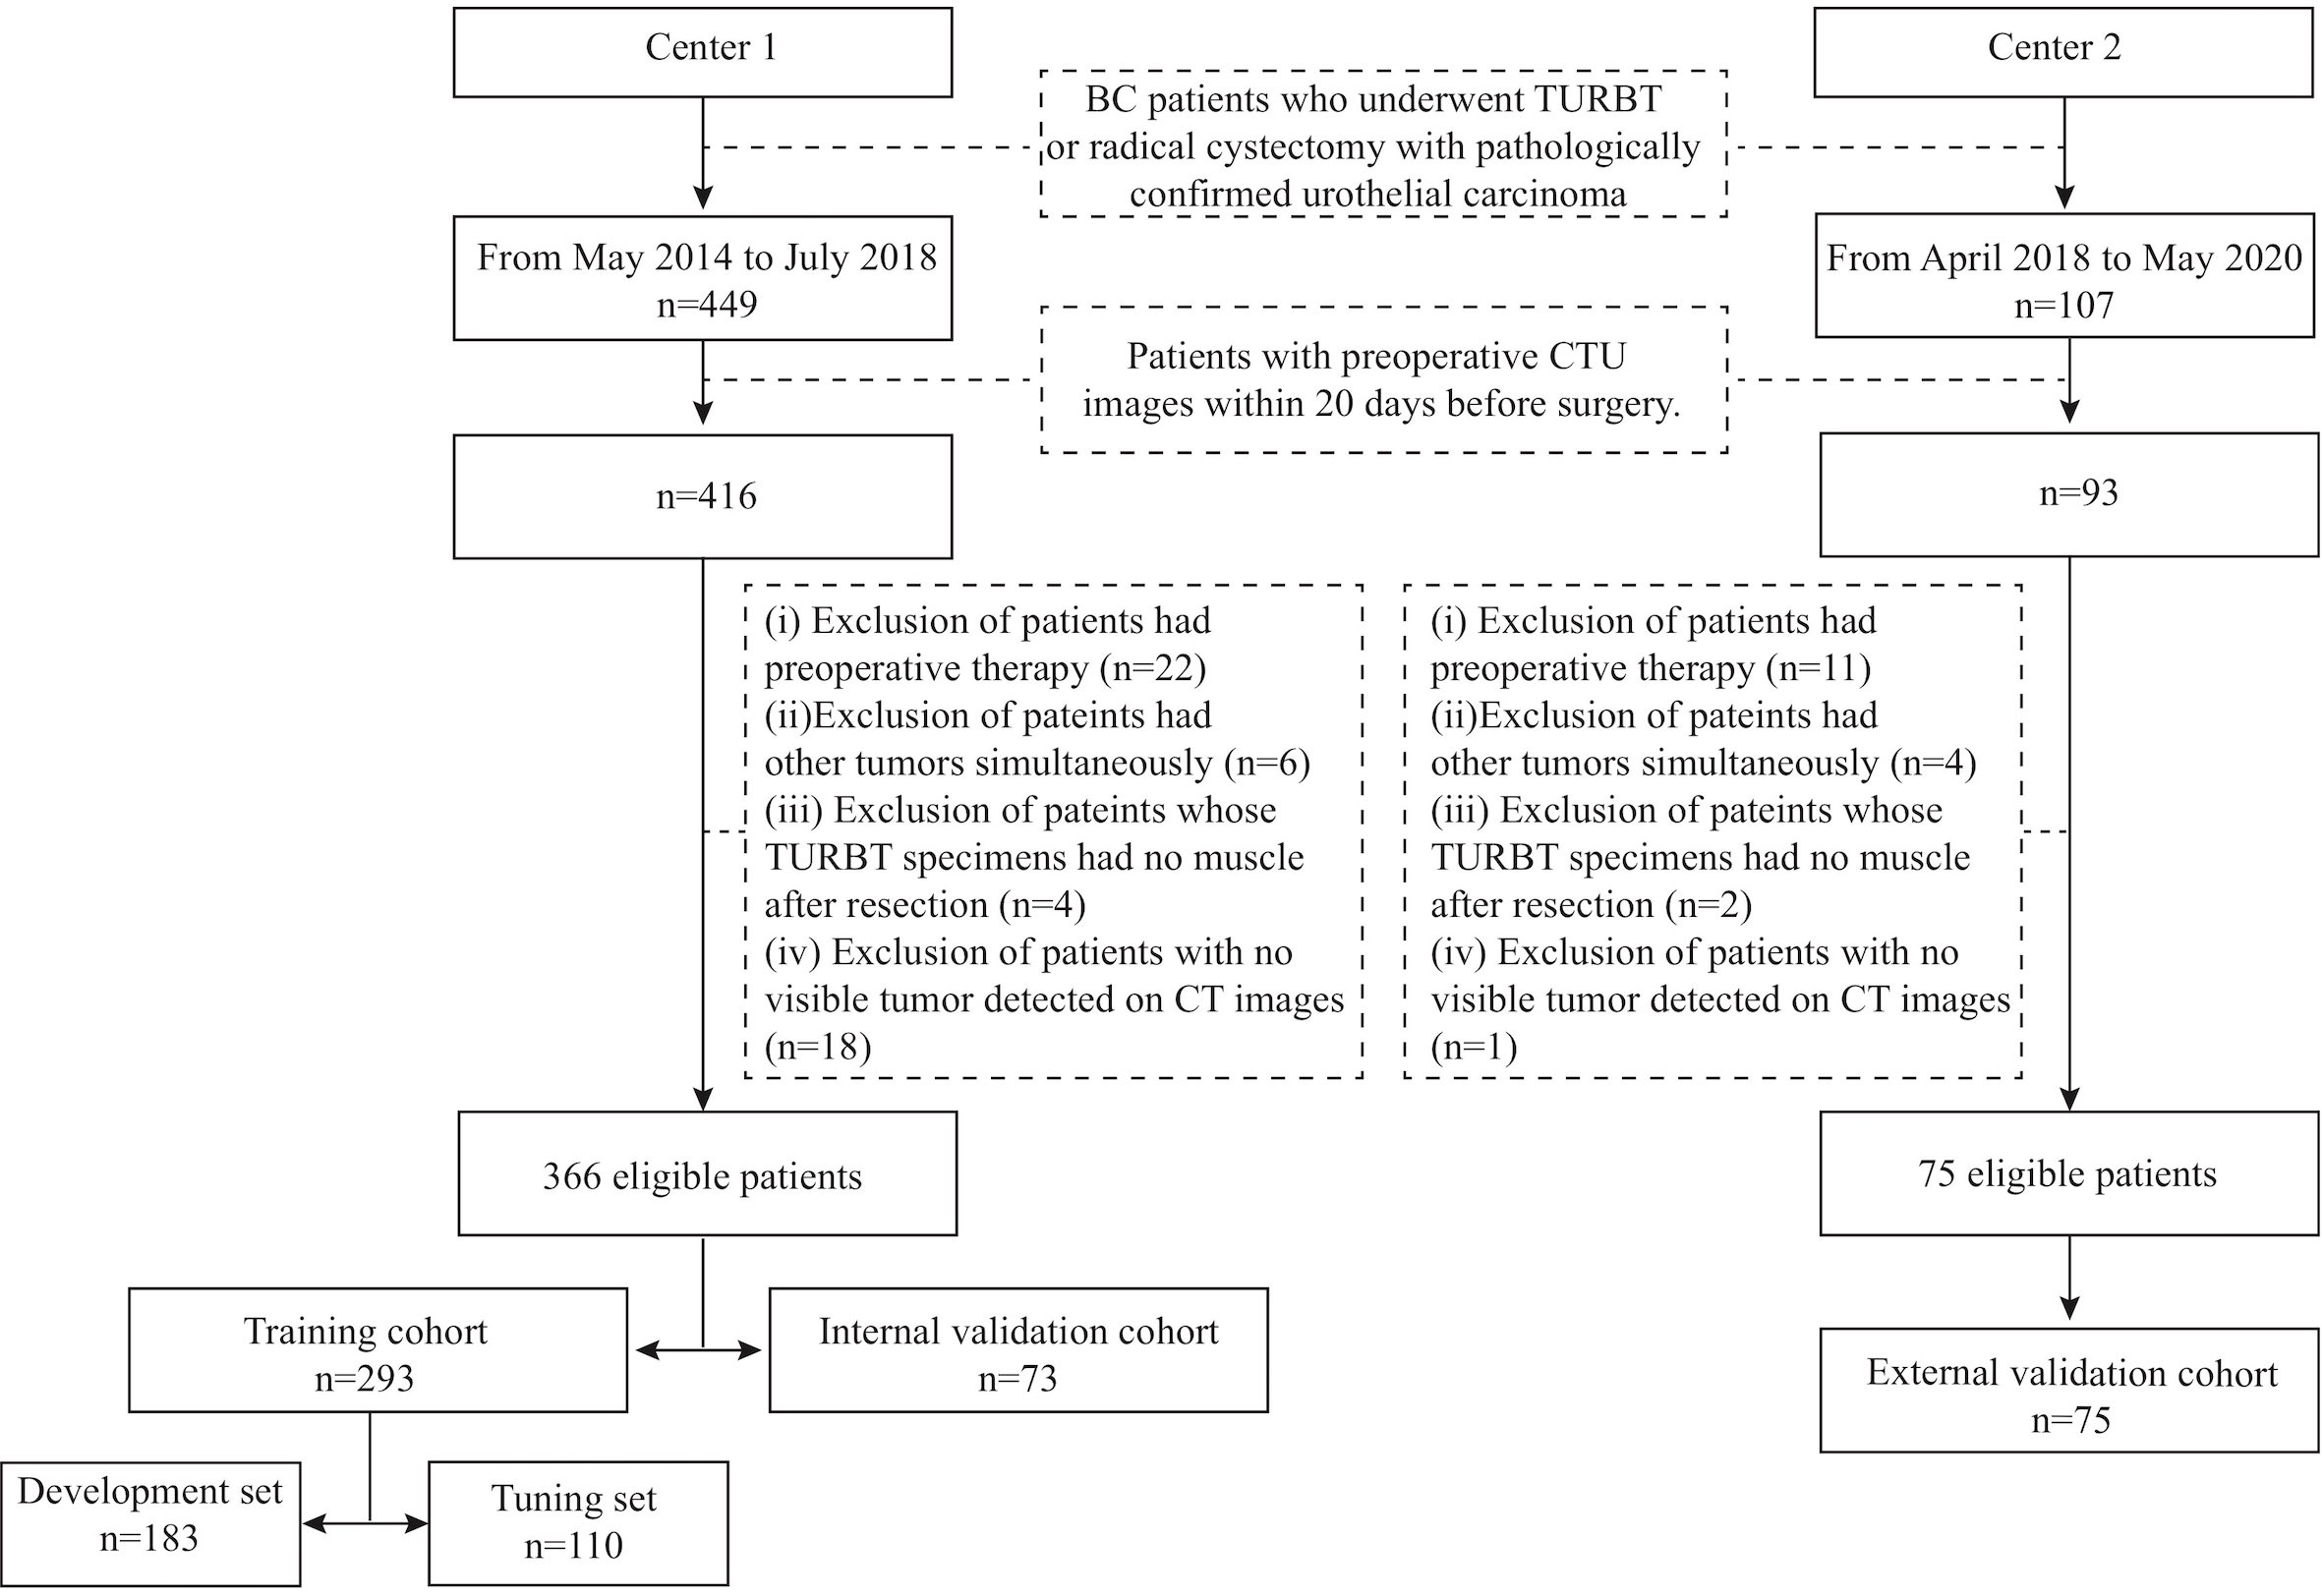
Figure 1 The study flow and the recruitment pathway. BC, bladder cancer; TURBT, transurethral resection of bladder tumor; CTU, computed tomography urography.
Clinical-pathologic information, including age, sex and pathologic T stage, was obtained from medical records. Two experienced radiologists (6 and 14 years of experience in in urogenital imaging) reviewed all the CT images together and recorded data, including the number of tumors, the size and the CT attenuation of the largest tumor. Any disagreement was resolved by consensus.
All the enrolled patients in both centers underwent preoperative CTU with a similar protocol setup with different systems. The CT image acquisition settings are provided in Supplementary Table S1. Patients fasted for 4-6 hours, and then were asked to drink about 1000 ml water about 45 minutes before the scan and not to urinate until the scan was finished. Patients were scanned from the hemidiaphragm to the pelvic floor. For the contrast scans, patients were injected with 100 ml of nonionic contrast material (Ultravist 370, Bayer Schering Pharma AG, Germany) followed by a 100-ml saline chaser intravenously at a rate of 4–4.5 mL/s after the unenhanced scan. Renal corticomedullary-phase, nephrographic-phase and excretory-phase images were acquired at 25 s, 75 s and 300 s after the bolus-triggering threshold of 120 HU was achieved in the thoracoabdominal aorta junction. To show BCa lesions better, coronal and sagittal reformations were reconstructed besides axial images. But only the axial nephrographic-phase images were used for subsequent analysis.
Regions of interest (ROIs) were delineated semiautomatically on thin-slice CT images of the nephrographic phase by an experienced radiologist (G.Z., 6 years of experience in urogenital imaging and 5 years of experience in tumor segmentation) who was blinded to the pathological status of muscular invasion of lesions. For patients with multiple lesions, only the largest lesion was chosen for segmentation. A three-dimensional ROI of the whole tumor was delineated semiautomatically using the Deepwise Research Platform (Deepwise Inc., Beijing, China, http://label.deepwise.com). On the platform, a level-set-based segmentation algorithm was initially used to outline the tumor margin automatically, and then the radiologist manually corrected the tumor margin where it was not accurate. After 8 weeks, 93 patients in the development set were selected randomly, and their tumors were segmented again by the same radiologist and another radiologist (X.Z., 1 year of experience in urogenital imaging and tumor segmentation) to evaluate intra- and interobserver reproducibility by calculating intra- and interclass dice coefficients.
The pipeline of DL modeling is presented in Figure 2. Before the training of the model, the images were preprocessed. The voxel size was normalized to 1.0 x 1.0 x 1.0 mm3, and the pixel values were rescaled to (0,1). To further utilize the segmentation and focus the model’s attention on the tumor area, the masked tumor region and the original tumor region were stacked vertically, then cropped it according to the tumor center to form an input volume of 2 x 64 x 64 x 64 for channel, depth, height and width, respectively. Our model was constructed on the basis of Filter-guided Pyramid Network (FGP-Net), a novel 3D convolutional network structure that was designed to capture the global feature and the local features simultaneously in our previous study (14). To avoid overfitting, the growth rate of the dense block was reduced to 8, and a dropout layer with a drop rate of 0.5 was added. In addition, the input patches were augmented by random cropping and rotation during the training process. The output of our model was the probability of the MIBC. Focal loss with a gamma of 1.5 and a class weight of 3 were used to manage the unbalanced amount of MIBC and NMIBC tumors. The Adam optimizer was used to minimize the focal loss with an initial learning rate of 0.001 (15). The output of our model was the probability of the MIBC, the model that achieved the highest area under the receiver operating characteristic curve (AUC) on the tuning set during the training procedure was selected, and the cut-off value was selected at the points that maximized the Youden index value on the tuning set. The AUC, accuracy, sensitivity, and specificity of all sets were calculated. The calibration curve with LOESS smoother was generated to assess the calibration of the DL model (16).
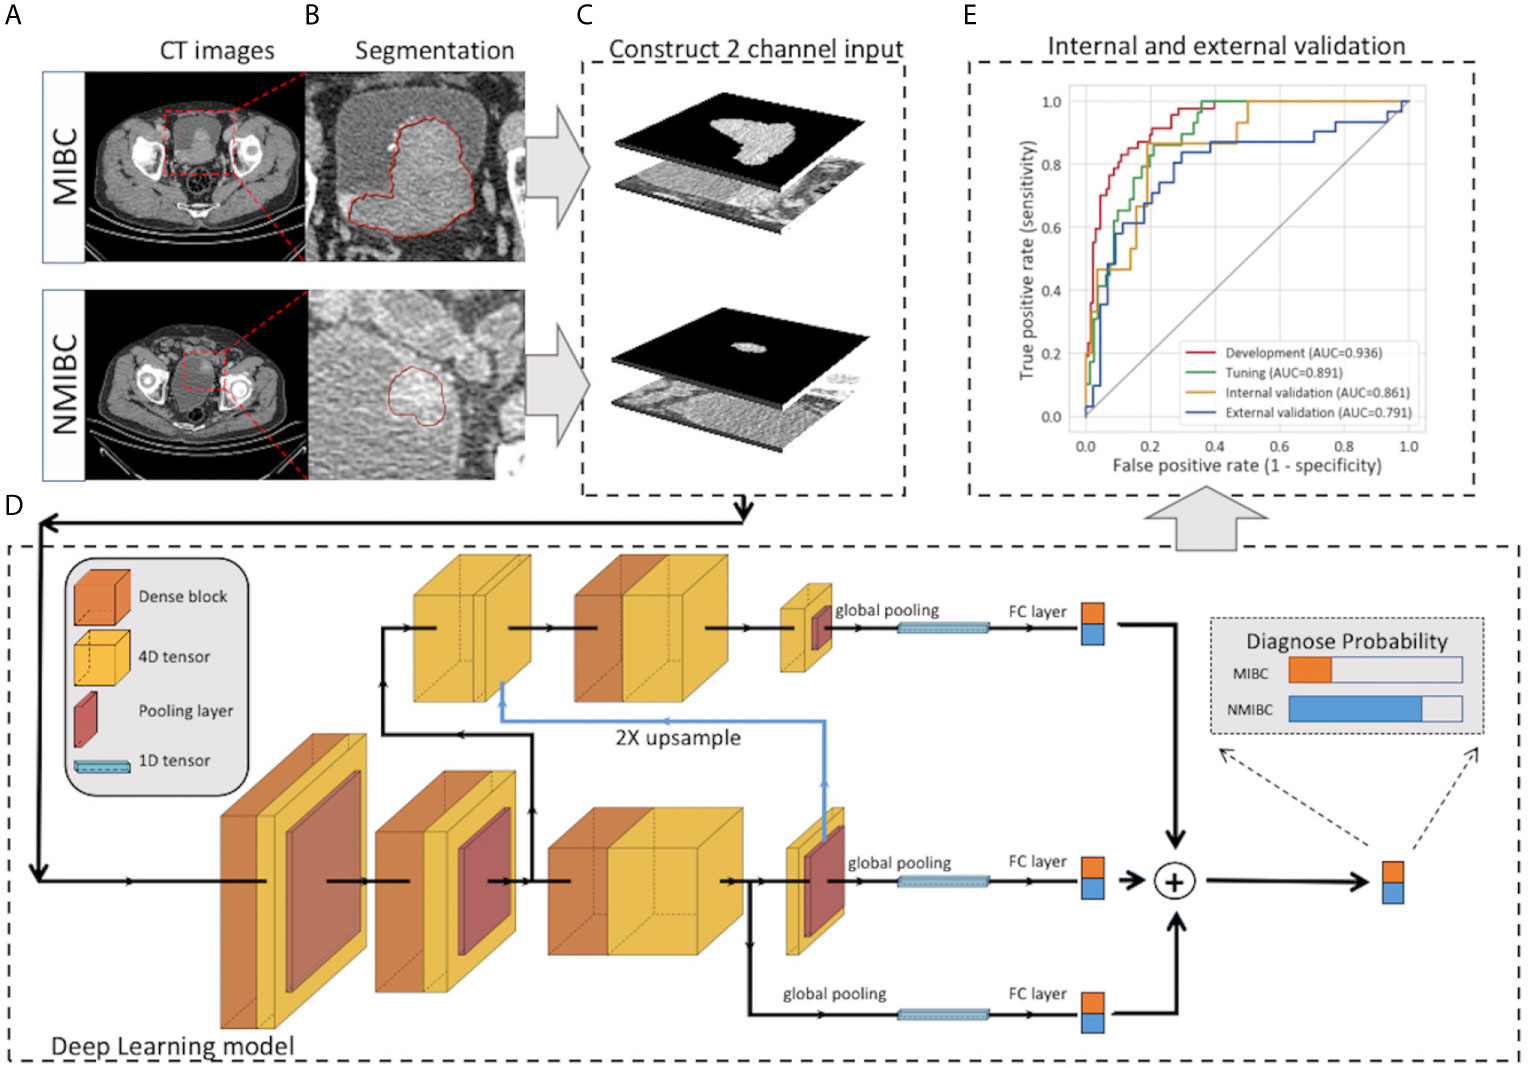
Figure 2 Workflow of the deep learning model for the prediction of muscle invasiveness status in bladder cancer patients. (A) Collection of the CT images of MIBC and NMIBC. (B) Semiautomatic segmentation of the tumor region. (C) The masked tumor region and the original tumor region were stacked vertically to form the input volume, and the cropped 2-channel input was constructed. (D) The structure of our deep-learning model. The model was constructed on the basis of Filter-guided Pyramid Network (FGP-Net), a novel 3D convolutional network structure that is designed to capture the global feature and the local features simultaneously. (E) Internal and external validation of our model. CT, computed tomography; FC, fully connected layer.
Two methods that visualizing the feature extraction process by the convolutional neural network were used to demonstrate whether the DL model learned valuable features from meaningful CT areas. First, the feature maps before discriminative filter learning modules in our model were extracted to show the target area of the model. The value of the area on the feature map indicated its contribution to the final result. The higher the value, the larger the contribution of the area. Using gamma correction (γ=2.0), the feature maps were transformed, mapped to a colored scheme and overlaid on the original images. Second, t-distributed stochastic neighborhood embedding (t-SNE), which is an unsupervised dimension-reduction algorithm to visualize high-dimensional data, was used to test the effectiveness of the learned features. In this study, t-SNE was used to reduce the dimension of features (the output of the layer before the final fully connected layer) from 150 to 2 with a learning rate of 450 and a perplexity of 30.
For subjective assessment of muscular invasion of BC based on CT images, a tumor was defined as MIBC if it invaded perivesical fat with the tumor bulging out or based on the presence of abnormal enhancement of bladder wall; otherwise, it was considered NIMBC. Examples of these imaging features were demonstrated to two radiologists (Reader 1, L.X., Reader 2, D.Z., with 3 and 9 years of experience in CTU, respectively) before they started the review process. The two radiologists reviewed all the images in validation cohorts (n=148) and determined whether the tumor was MIBC or NMIBC independently, without knowledge of pathological information (including the status of muscular invasiveness of tumors). For patients with multiple tumors, only the largest tumor was evaluated. The performance of the two radiologists for diagnosing MIBC was evaluated by calculating accuracy, sensitivity and specificity.
A two-sided P<0.05 indicated statistically significant differences. Analysis of variance or Kruskal-Wallis H test was used to compare clinical characteristics among development, tuning, internal and external validation cohorts. These statistical analyses were performed by using SPSS version 25.0 (IBM, SPSS; Chicago, IL, USA). The comparison of the AUC was calculated by the DeLong test (17) which was performed by using R (version 3.6.0). The ROC curves, decision curve analysis (DCA) and calibration curves were calculated using scikit-learn (version 0.22.1) and matplotlib (version 3.1.3).
Patient characteristics in all the cohorts are shown in Table 1. No significant differences in gender or CT-reported largest lesion diameter (P > 0.05) were noted among the training, internal validation and external validation cohorts. Patient age, CT-reported number of lesions, CT attenuation of the largest lesion and pT stage were significantly different. The proportion of MIBC was significantly increased in the external validation cohort (P = 0.010).
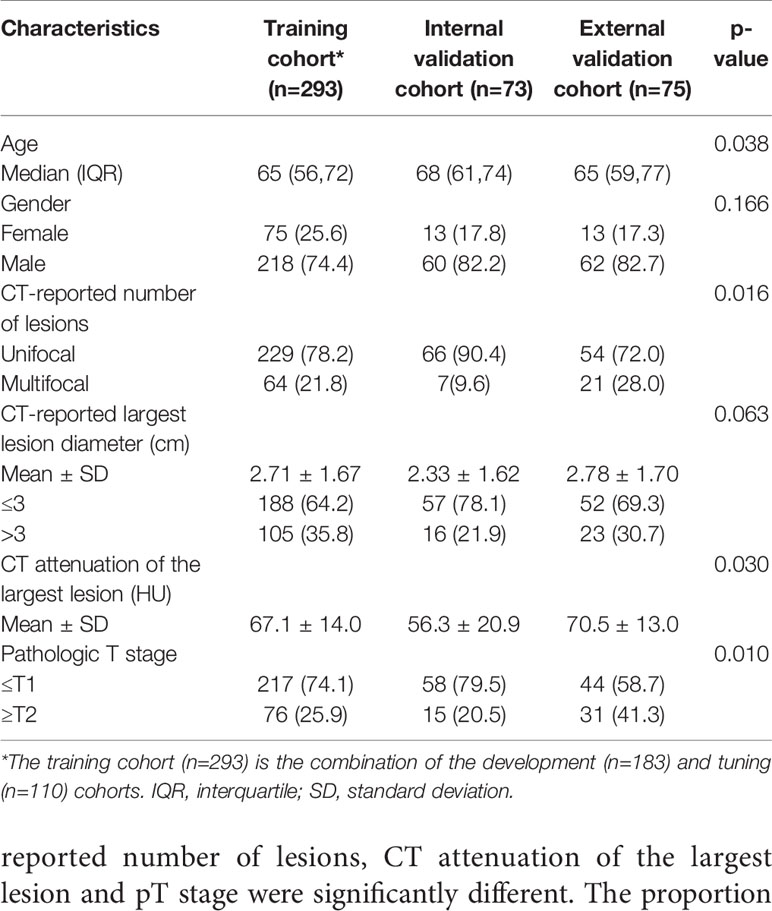
Table 1 Clinical characteristics of patients with bladder cancer.
For the semiautomatic segmented ROI, the intraclass dice coefficient (0.800 ± 0.201) indicating favorable reproducibility, while the interclass dice was relatively low (0.706 ± 0.253). The ROC curves of the DL model are presented in Figure 3A. The model produced satisfactory performance in the development (AUC 0.936) and tuning (AUC 0.891) cohorts. The AUC in the internal validation cohort and the external validation cohort reached 0.861 (95% CI: 0.765, 0.957) and 0.791 (95% CI: 0.678, 0.904), respectively, demonstrating good differentiating ability between MIBC and NMIBC and good model robustness. The cut-off value that maximized the Youden index was 0.337. The performance of our model for differentiating between MIBC and NMIBC on development and tuning sets is also summarized in Table 2.
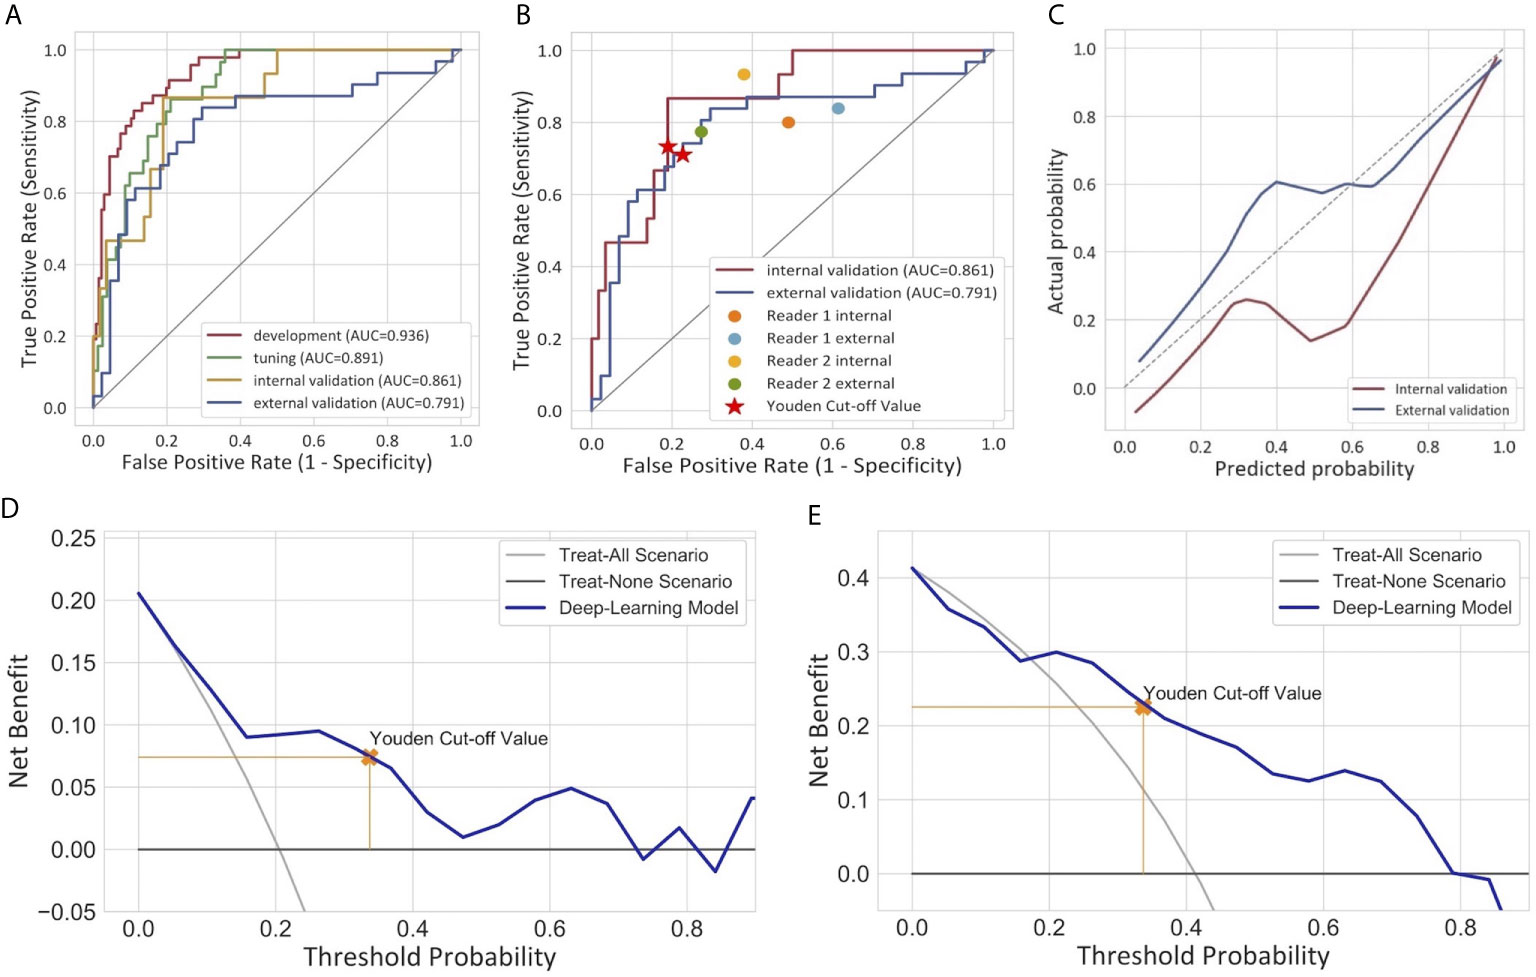
Figure 3 Performance of the deep learning model for the differentiation of MIBC and NMIBC. (A) Receiver operator characteristic curves of the model in four different cohorts. (B) Comparison of the performance between the model and two radiologists. (C) Calibration curves of the model in internal and external validation cohorts. The calibration curve showed that the predicted probabilities generally agreed with the observed probabilities. The predictive performance of the model in the external validation cohort exhibited a closer fit to the perfect calibration. (D, E) showed decision curve analyses (DCA) in the internal and external validation cohorts respectively. DCA compared the net benefit of the deep learning model versus treat all or treat none are shown. The net benefit was plotted versus the threshold probability. The net benefits of the deep learning model (blue line) were superior to the benefits of treating all or treating none.
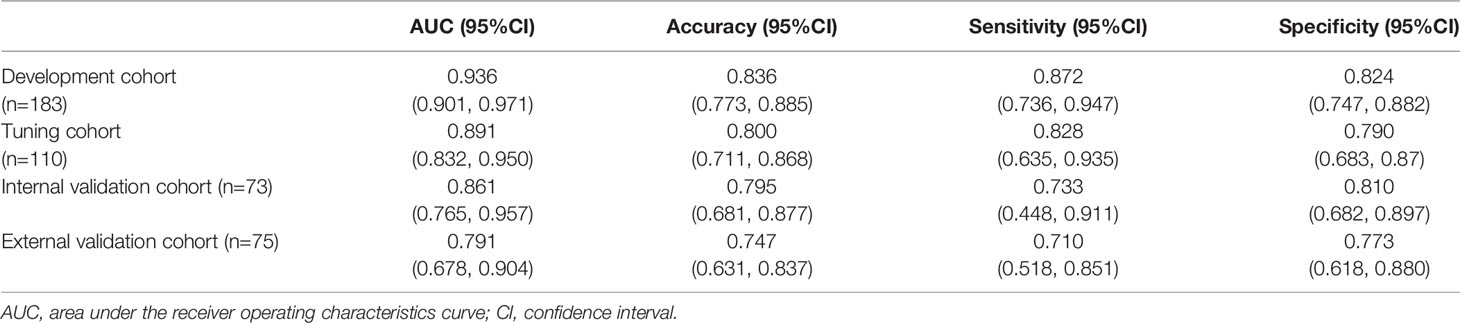
Table 2 Performance of the model in development, tuning and validation cohorts.
The calibration curves of the model exhibited good agreement between the model predicted outcome and the real status of muscular invasiveness (Figure 3C). The DCA indicated that the DL model could add more benefit to patients than the “treat all” or “treat none” strategies when the threshold probability was ranged from 0 to 0.74 in the internal validation cohort and 0.21 to 0.79 in the external validation cohort (Figures 3D, E).
In the subjective assessment of muscular invasion of BCa, the two radiologists generally performed slightly worse compared with the DL model (Table 3 and Figure 3B). In the internal validation cohort, the accuracy and specificity of Reader 1 (0.685 and 0.621) and Reader 2 (0.585 and 0.517) were lower than those of the model (0.795 and 0.810), while the sensitivity of them (0.933 and 0.800) exceeded that of the model (0.733). In the external validation cohort, Reader 1 demonstrated comparable performance compared to the model with the same accuracy (0.747) and similar specificity (0.727 vs 0.773) and sensitivity (0.774 vs 0.710). However, the performance of Reader 2 was inferior to the model in general with a lower accuracy (0.573 vs 0.747) and specificity (0.386 vs 0.773) but higher sensitivity (0.839 vs 0.710).
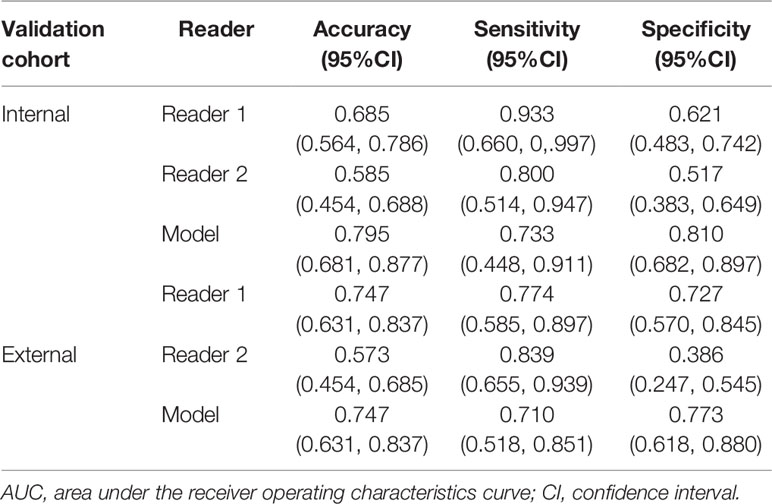
Table 3 Performance of two radiologists and the deep learning model on validation cohorts.
Violin plots of the predicted score for muscle invasion in the development, tuning, internal and external cohorts are shown in Figure 4A. NMIBC patients had significantly lower predicted scores than those with MIBC in the development (median 0.214 [interquartile range 0.136-0.291] vs 0.813 [0.607, 0.938], P< 0.001), tuning (0.225 [0.161, 0.304] vs 0.539 [0.385, 0.846], P < 0.001), internal validation (0.216 [0.172, 0.288] vs 0.422 [0.327, 0.843], P < 0.001) and external validation (0.184, [0.124, 0.305] vs 0.759 [0.307, 0.889], P < 0.001) cohorts. The waterfall plots in Figures 4B, C illustrate the distribution of the predicted score and the status of muscular invasion of individual patients in the internal and external validation cohorts, respectively.
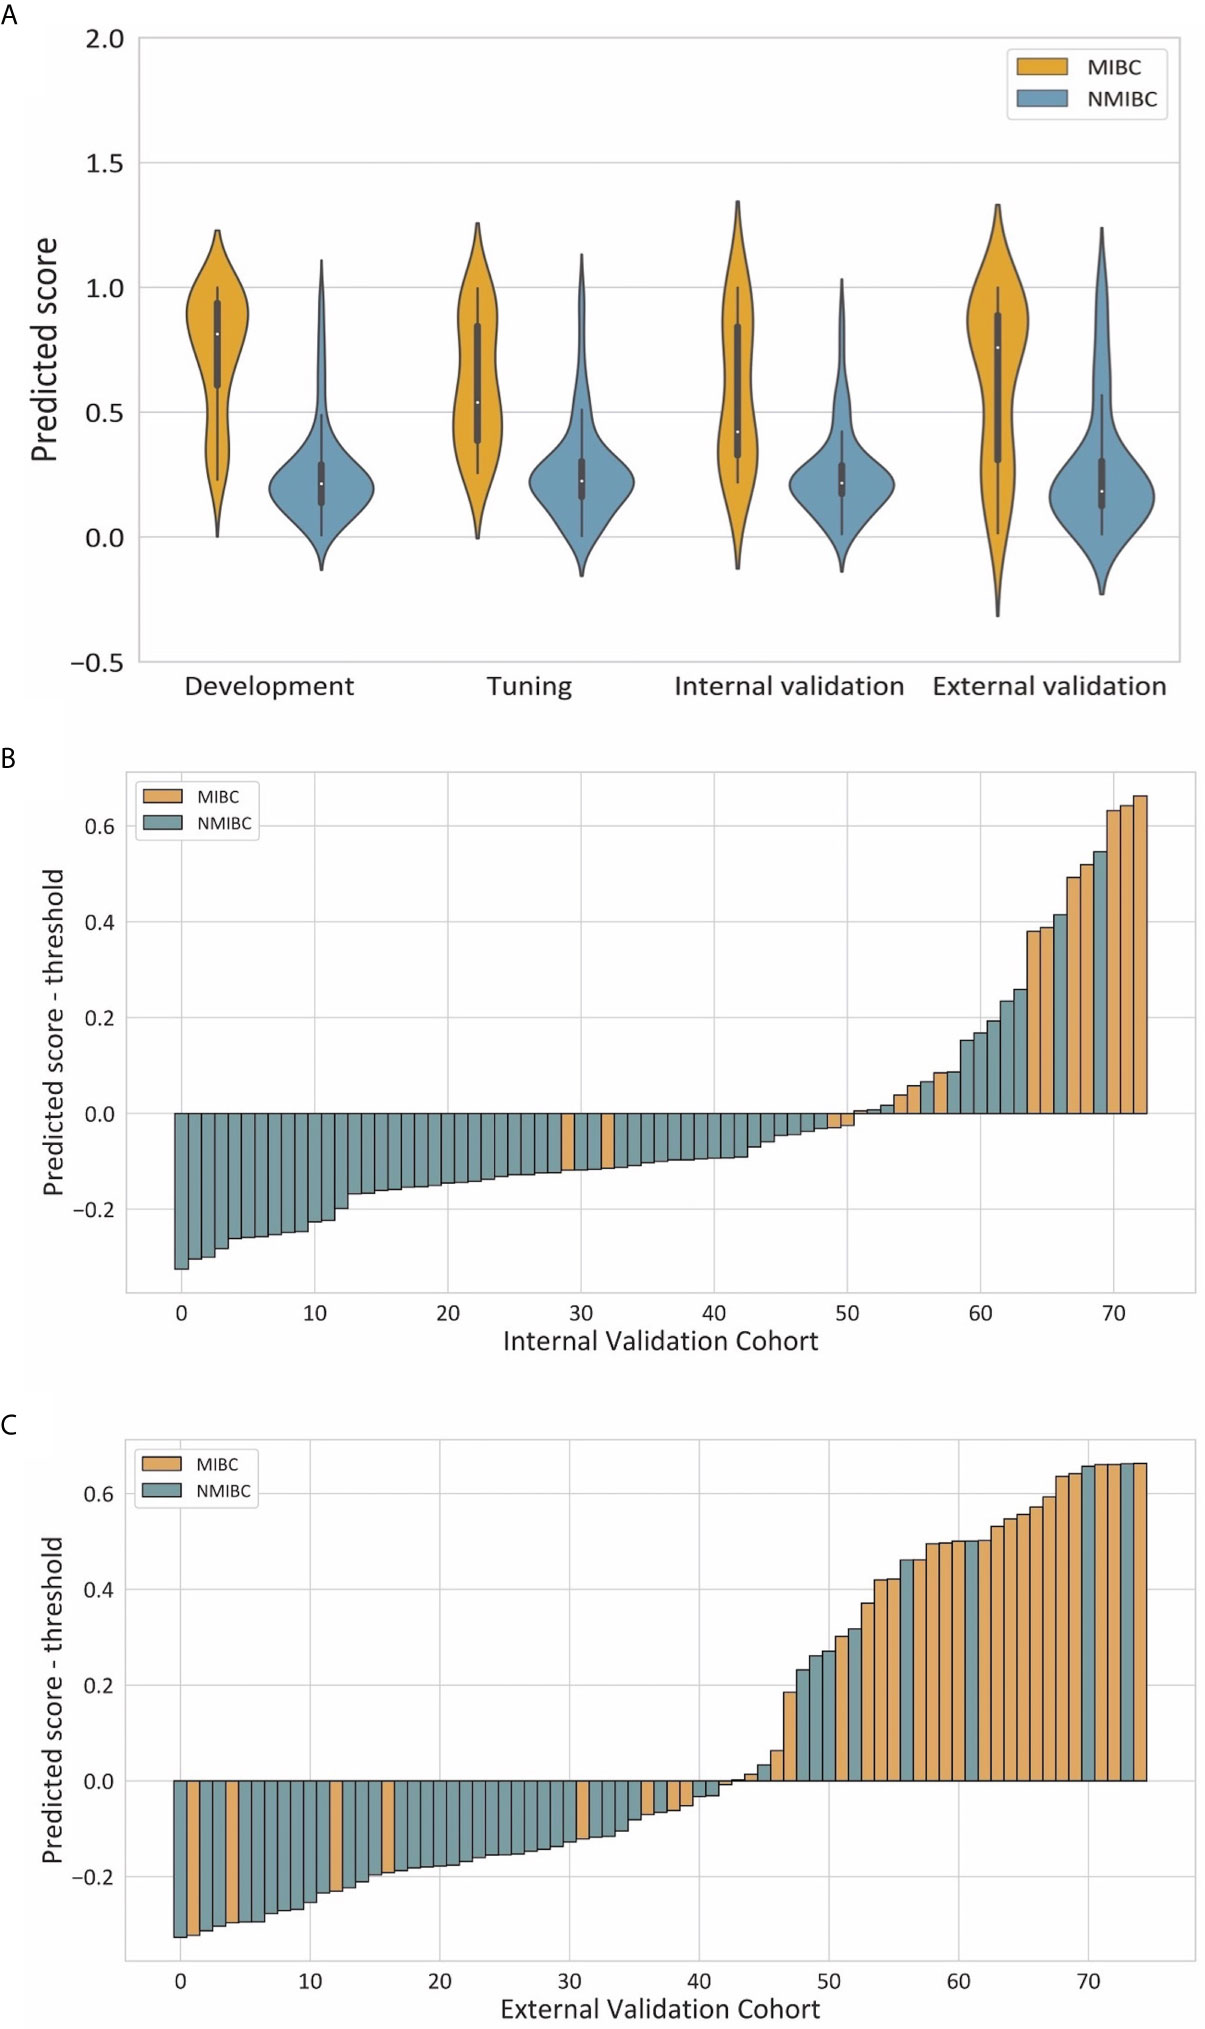
Figure 4 Illustrations of the performance of the deep learning model. (A) Violin plots of predictive scores in the development, tuning, internal validation and external validation cohorts. (B, C) showed waterfall plots of the distribution of predictive scores and muscle invasive status of each patient in the internal and external validation cohorts respectively.
We used feature maps and t-SNE to visualize the learned features. Figure 5A demonstrates feature maps of four examples (two for MIBC and two for NMIBC) from the external validation cohort. The focus area of the model or the active area is illustrated by bright colors. These regions represent different characteristics of lesions and were in accord with human observations, and the models would aid in the classification of lesions. T-SNE visualization demonstrated that the learned features of the DL model can distinguish MIBC and NMIBC. The locations of BC lesions depended on the similarity of their features. They were close to each other if they had similar features; otherwise, they were far apart. As shown in Figure 5B, MIBC and NMIBC clusters were basically separated except for several outliners, demonstrating that the developed model has captured effective features for differentiation.
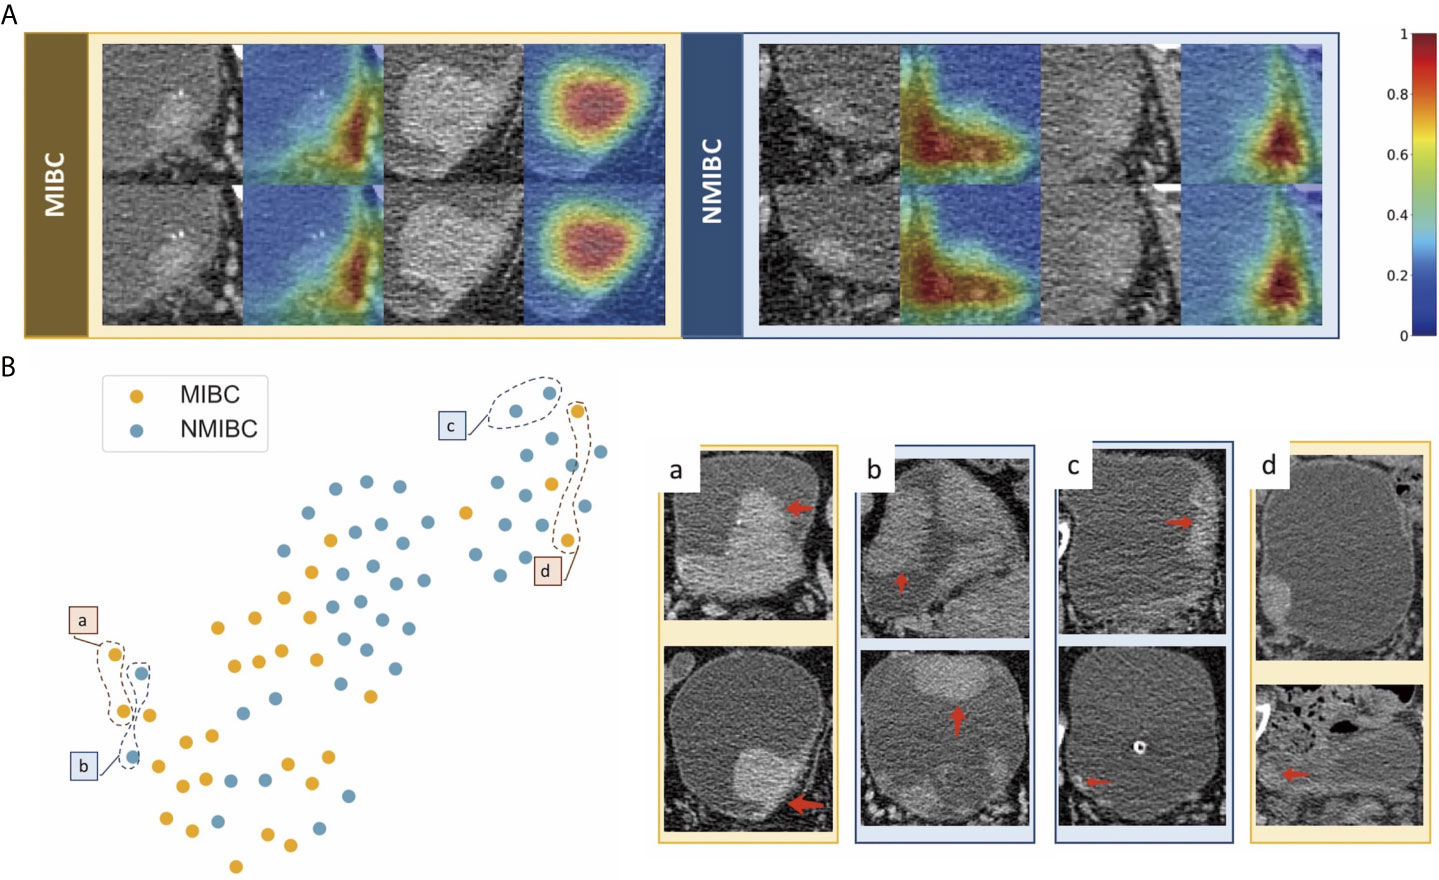
Figure 5 Examples of feature maps from validation cohorts and visualization of the effectiveness of the learned features. (A) Two cases from MIBC and two cases from NMIBC are shown. The active regions were mainly overlaid on the areas with visual characteristics that were helpful for discriminating between MIBC and NMIBC, including the internal region of the tumor, corresponding bladder wall, and the surrounding outside pelvic fat. (B) Colored points represent the NIMBC (blue) and MIBC (orange). Effective features were learned by the model, and the two categories of nodules were well clustered. The eight examples show images corresponding to circled points. Nodules in sets a and c were highly discriminated by the model, whereas nodules in sets b and d were less discriminated because they shared similar features with the opposite tumor.
The aim of this double-center study was to predict the muscular invasiveness of bladder cancer based on enhanced CT images. Our DL model exhibited relatively good performance to discriminate NMIBC from MIBC. The AUC was 0.861 in the internal validation cohort and 0.791 in the external validation cohort.
Preoperative evaluation of muscle invasion in bladder cancer is important for patient management. Currently, transurethral resection of bladder tumor is the standard for preoperative T staging evaluation (3, 7, 18–21). As the procedure highly depends on surgeon experience and biopsy quality, its diagnostic accuracy for MIBCs varies. MRI is also recommended, and the Vesical Imaging-Reporting and Data System based on multiparametric MRI has been proposed for the diagnosis of MIBCs (22). But it is still a subjective evaluation process based on the experience of radiologists. In recent years, researchers have investigated alternative techniques to assist muscle invasiveness evaluation. Garapati et al. (23) explored machine learning methods to discriminate between MIBC and NMIBC in 84 BC lesions from 76 CTU cases retrospectively. They found that morphological and texture features achieved comparable performance with AUCs of about 0.90. Some other studies developed MRI-based radiomic models for preoperative prediction of the muscle-invasive status of BCa with AUCs ranging from 0.87 to 0.98 (24–27). These studies revealed encouraging results for avoiding subjectivity in the preoperative assessment of BCa, but external validation in larger cohorts is required to verify the clinical validity of these new techniques. In contrast to the above studies, we investigated the feasibility of using DL on CT images to differentiate between MIBC and NMIBC. We used a well-designed deep learning structure, which utilizes the dense block and the pyramid structure to extract the features effectively and integrate the global features and the local features (14). Considering the relatively small sample size, several methods were utilized to alleviate the problem of overfitting, including reducing the growth rate of the dense block and data augmentation. The focal loss, which is designed to handle the imbalance of the data amount and the difficulty, was employed (15). Regarding diagnostic performance, the AUCs in this study were slightly lower than those in other studies. When we analyzed what went wrong and why, we found that most true NMIBC cases that were mistakenly identified as MIBC were large (typically >4 cm), and almost all the MIBC cases falsely recognized as NIMBC were small (typically < 1 cm). These findings suggest that the DL model considers the tumor size as one of the key features to determine the muscle-invasive status of BCa.
In general, the DL model outperformed the two radiologists in terms of accuracy, and the DL model also demonstrated increased specificity. But the DL model exhibited reduced sensitivity. This finding may be explained by the fact that radiologists are more prone to suspect a tumor to be muscularly invasive due to their fear of the negative consequences of missing MIBC. Moreover, surprisingly, Reader 1, who had less experience in urogenital imaging, demonstrated better performance than Reader 2. Thus, a radiologist’s experience may not necessarily have a positive correlation with prediction accuracy. On the other hand, our results also indicated that the DL model could produce a more stable, objective and balanced outcome for discrimination between MIBC and NMIB compared to subjective assessment by radiologists.
ROI segmentation is an essential part of the research process. Currently, 3D segmentation of the whole tumor is widely adopted by researchers because it is thought to provide a more comprehensive evaluation compared to one ROI from the largest cross-sectional area of the tumor. Researchers typically need to manually draw the outline of the tumor on each image slice, which is time consuming, especially when the study population is large. Automated segmentation has been proposed, but the accuracy for BCa remains unclear. In this study, we applied a semiautomatic approach to segment each tumor. This method is a combination of automated segmentation by the platform and small modification by the radiologist. According to our experience, this semiautomatic method not only greatly accelerates the study process but also ensures the accuracy of ROI delineation. The interclass dice coefficient of 0.706 for ROI segmentation was slightly low. We analyzed those significantly different segmentations between the two radiologists and found that the radiologist with less experience mistakenly identified BCa lesions in patients with an irregular bladder shape or with prostate hyperplasia. This radiologist also failed to correctly segment some BCa lesions that presented as abnormal enhancement of the focal bladder wall. This result reminded us of the importance of the experience and the training of radiologists for ROI segmentation to reach a solid and reliable result.
Although the results were not very satisfactory, our study still has several strengths. First, this study explored the capacity of a DL model based on CT images to determine the status of muscle invasiveness of BCa, which provided a basis for subsequent studies to apply this technique to tackle relevant clinical problems. Second, unlike some other studies that used cross validation or single-center validation, this study used an external validation cohort enrolled from a different hospital, which allowed us to investigate the generalizability of the DL model. In addition, the study population of this study was larger than many other studies focusing on the application of machine learning in BCa. Third, CT-related studies of discriminating MIBC from NMIBC are limited. There is no doubt that CT has its limitations due to its low resolution of soft tissue. However, our study indicated that with the help of novel techniques, such as DL, we can also obtain valuable information from routine CT images to guide patient therapy. Thus, it is still worth performing CT-based studies to solve clinical problems in BCa management.
Our study has some limitations. First, this is a two-center study, but the number of patients in Center 2 is relatively small. Multicenter studies with larger population or prospective clinical trials should be conducted to validate the results in the future. Second, the proposed DL model exhibited its potential but the performance was less than satisfactory and has yet to be improved. Constant efforts should be made to optimize the model before it could be applied in real clinical practice. Third, the model was based on visible tumors on enhanced CT given that we excluded tumors detected by cystoscopy but invisible on CT images. Although these tumors constitute a small proportion of BCa, they may still limit the scope of the model’s application to some extent. Fourth, in this study, we did not incorporate other clinical information which may be helpful for determining the invasiveness of BCa, such as urine DNA or RNA. We aimed to investigate the potential of deep learning to facilitate CT evaluation of BCa, thus we focused on CT images only. It’s possible that integrating those useful clinical information into the model might further improve the prediction accuracy. Fifth, we only chose the largest one among multiple lesions for segmentation and there is a chance that the largest one didn’t have the highest T stage. But usually larger lesions are supposed to have higher T stage, and it’s very difficult to make one-to-one correspondence between the lesion on CT images and the lesion pathologist evaluated, we think choosing the largest one for analysis is acceptable.
In conclusion, we developed a DL model based on enhanced CT images to predict muscle invasiveness of BCa. This model should favorable performance. It could provide more useful information for individual preoperative evaluation, may facilitate clinical decision making and improve patient care.
The original contributions presented in the study are included in the article/Supplementary Material. Further inquiries can be directed to the corresponding author.
The studies involving human participants were reviewed and approved by the Institutional Review Board of Peking Union Medical College Hospital and Fushun Central Hospital of Liaoning Province. Written informed consent for participation was not required for this study in accordance with the national legislation and the institutional requirements.
GZ: conception and design, acquisition of data, analysis and interpretation of data, manuscript drafting and revision, and statistical analysis. ZW: acquisition of data, manuscript drafting and revision, and administrative and material support. LX: acquisition of data. XZ: analysis and interpretation of data. DZ: analysis and interpretation of data. YX: acquisition of data. LM: analysis and interpretation of data, and statistical analysis. XL: conception and design, manuscript drafting and revision, and administrative and material support. JG: acquisition of data. ZhiJ: administrative and material support. HS: conception and design, manuscript drafting and revision, administrative and material support, and supervision. ZheJ: administrative and material support, and supervision. All authors contributed to the article and approved the submitted version.
This work was supported by the National Natural Science Foundation of China [81901742, 91859119], the Natural Science Foundation of Beijing Municipality [7192176], the Clinical and Translational Research Project of Chinese Academy of Medical Sciences [XK320028], and the National Public Welfare Basic Scientific Research Project of Chinese Academy of Medical Sciences [2018PT32003, 2019PT320008].
LM and XL are employees of Deepwise AI Lab, Deepwise Inc., which contributed to the development of radiomics models described in the study.
The remaining authors declare that the research was conducted in the absence of any commercial or financial relationships that could be construed as a potential conflict of interest.
The Supplementary Material for this article can be found online at: https://www.frontiersin.org/articles/10.3389/fonc.2021.654685/full#supplementary-material
1. Siegel RL, Miller KD, Jemal A. Cancer Statistics, 2020. CA Cancer J Clin (2020) 70:7–30. doi: 10.3322/caac.21590
2. Svatek RS, Hollenbeck BK, Holmang S, Lee R, Kim SP, Stenzl A, et al. The Economics of Bladder Cancer: Costs and Considerations of Caring for This Disease. Eur Urol (2014) 66:253–62. doi: 10.1016/j.eururo.2014.01.006
3. Spiess PE, Agarwal N, Bangs R, Boorjian SA, Buyyounouski MK, Clark PE, et al. Bladder Cancer, Version 5.2017, NCCN Clinical Practice Guidelines in Oncology. J Natl Compr Cancer Network (2017) 15:1240–67. doi: 10.6004/jnccn.2017.0156
4. Kamat AM, Hahn NM, Efstathiou JA, Lerner SP, Malmstrom PU, Choi W, et al. Bladder Cancer. Lancet (2016) 388:2796–810. doi: 10.1016/S0140-6736(16)30512-8
5. Shariat SF, Palapattu GS, Karakiewicz PI, Rogers CG, Vazina A, Bastian PJ, et al. Discrepancy Between Clinical and Pathologic Stage: Impact on Prognosis After Radical Cystectomy. Eur Urol (2007) 51:137–49. doi: 10.1016/j.eururo.2006.05.021
6. Mariappan P, Zachou A, Grigor KM, Edinburgh Uro-Oncology G. Detrusor Muscle in the First, Apparently Complete Transurethral Resection of Bladder Tumour Specimen Is a Surrogate Marker of Resection Quality, Predicts Risk of Early Recurrence, and Is Dependent on Operator Experience. Eur Urol (2010) 57:843–9. doi: 10.1016/j.eururo.2009.05.047
7. Bellmunt J, Orsola A, Leow JJ, Weigel T, Santis MD, Horwich A, et al. Bladder Cancer: ESMO Practice Guidelines for Diagnosis, Treatment and Follow-Up. Ann Oncol (2014) 25(Suppl 3):iii40–8. doi: 10.1093/annonc/mdu223
8. Zhang XY, Wang L, Zhu HT, Li ZW, Ye M, Li XT, et al. Predicting Rectal Cancer Response to Neoadjuvant Chemoradiotherapy Using Deep Learning of Diffusion Kurtosis Mri. Radiology (2020) 296:56–64. doi: 10.1148/radiol.2020190936
9. Liu KL, Wu T, Chen PT, Tsai YM, Wang W. Deep Learning to Distinguish Pancreatic Cancer Tissue From Non-Cancerous Pancreatic Tissue: A Retrospective Study With Cross-Racial External Validation. Lancet Digital Health (2020) 2:e303–13. doi: 10.1016/S2589-7500(20)30078-9
10. Dong D, Fang MJ, Tang L, Shan XH, Gao JB, Giganti F, et al. Deep Learning Radiomic Nomogram Can Predict the Number of Lymph Node Metastasis in Locally Advanced Gastric Cancer: An International Multicenter Study. Ann Oncol (2020) 31:912–20. doi: 10.1016/j.annonc.2020.04.003
11. Wang K, Lu X, Zhou H, Gao Y, Zheng J, Tong M, et al. Deep Learning Radiomics of Shear Wave Elastography Significantly Improved Diagnostic Performance for Assessing Liver Fibrosis in Chronic Hepatitis B: A Prospective Multicentre Study. Gut (2019) 68:729–41. doi: 10.1136/gutjnl-2018-316204
12. Ardila D, Kiraly AP, Bharadwaj S, Choi B, Reicher JJ, Peng L, et al. End-to-End Lung Cancer Screening With Three-Dimensional Deep Learning on Low-Dose Chest Computed Tomography. Nat Med (2019) 25:954–61. doi: 10.1038/s41591-019-0447-x
13. Cha KH, Hadjiiski L, Chan H-P, Weizer AZ, Alva A, Cohan RH, et al. Bladder Cancer Treatment Response Assessment in CT Using Radiomics With Deep-Learning. Sci Rep (2017) 7:8738. doi: 10.1038/s41598-017-09315-w
14. Huang C, Lv W, Zhou C, Mao L, Xu Q, Li X, et al. Discrimination Between Transient and Persistent Subsolid Pulmonary Nodules on Baseline CT Using Deep Transfer Learning. Eur Radiol (2020) 30:6913–23. doi: 10.1007/s00330-020-07071-6
15. Lin TY, Goyal P, Girshick R, He K, Dollar P. Focal Loss for Dense Object Detection. IEEE Trans Pattern Anal Mach Intell (2020) 42:318–27. doi: 10.1109/TPAMI.2018.2858826
16. Detmer FJ, Chung BJ, Mut F, Slawski M, Hamzei-Sichani F, Putman C, et al. Development and Internal Validation of an Aneurysm Rupture Probability Model Based on Patient Characteristics and Aneurysm Location, Morphology, and Hemodynamics. Int J Comput Assist Radiol Surg (2018) 13:1767–79. doi: 10.1007/s11548-018-1837-0
17. DeLong ER DD, Clarke-Pearson DL. Comparing the Areas Under Two or More Correlated Receiver Operating Characteristic Curves: A Nonparametric Approach. Biometrics (1988) 44:837–45. doi: 10.2307/2531595
18. Power NE, Izawa J. Comparison of Guidelines on Non-Muscle Invasive Bladder Cancer (Eau, CUA, Aua, NCCN, Nice). Bladder Cancer (2016) 2:27–36. doi: 10.3233/BLC-150034
19. Woldu SL, Bagrodia A, Lotan Y. Guideline of Guidelines: Non-Muscle-Invasive Bladder Cancer. BJU Int (2017) 119:371–80. doi: 10.1111/bju.13760
20. Gurram S, Muthigi A, Egan J, Stamatakis L. Imaging in Localized Bladder Cancer: Can Current Diagnostic Modalities Provide Accurate Local Tumor Staging? Curr Urol Rep (2019) 20:82. doi: 10.1007/s11934-019-0948-7
21. Mirmomen SM, Shinagare AB, Williams KE, Silverman SG, Malayeri AA. Preoperative Imaging for Locoregional Staging of Bladder Cancer. Abdom Radiol (NY) (2019) 44:3843–57. doi: 10.1007/s00261-019-02168-z
22. Ueno Y, Takeuchi M, Tamada T, Sofue K, Takahashi S, Kamishima Y, et al. Diagnostic Accuracy and Interobserver Agreement for the Vesical Imaging-Reporting and Data System for Muscle-Invasive Bladder Cancer: A Multireader Validation Study. Eur Urol (2019) 76:54–6. doi: 10.1016/j.eururo.2019.03.012
23. Garapati SS, Hadjiiski L, Cha KH, Chan HP, Caolili EM, Cohan RH, et al. Urinary Bladder Cancer Staging in CT Urography Using Machine Learning. Med Phys (2017) 44:5814–23. doi: 10.1002/mp.12510
24. Zheng J, Kong J, Wu S, Li Y, Cai J, Yu H, et al. Development of a Noninvasive Tool to Preoperatively Evaluate the Muscular Invasiveness of Bladder Cancer Using a Radiomics Approach. Cancer (2019) 125:4388–98. doi: 10.1002/cncr.32490
25. Wang H, Xu X, Zhang X, Liu Y, Ouyang L, Du P, et al. Elaboration of a Multisequence MRI-Based Radiomics Signature for the Preoperative Prediction of the Muscle-Invasive Status of Bladder Cancer: A Double-Center Study. Eur Radiol (2020) 30:4816–27. doi: 10.1007/s00330-020-06796-8
26. Xu S, Yao Q, Liu G, Jin D, Chen H, Xu J, et al. Combining DWI Radiomics Features With Transurethral Resection Promotes the Differentiation Between Muscle-Invasive Bladder Cancer and Non-Muscle-Invasive Bladder Cancer. Eur Radiol (2020) 30:1804–12. doi: 10.1007/s00330-019-06484-2
Keywords: bladder cancer, deep learning, computed tomography, diagnosis, computed-assisted, artificial intelligence
Citation: Zhang G, Wu Z, Xu L, Zhang X, Zhang D, Mao L, Li X, Xiao Y, Guo J, Ji Z, Sun H and Jin Z (2021) Deep Learning on Enhanced CT Images Can Predict the Muscular Invasiveness of Bladder Cancer. Front. Oncol. 11:654685. doi: 10.3389/fonc.2021.654685
Received: 17 January 2021; Accepted: 27 May 2021;
Published: 11 June 2021.
Edited by:
Sebastian Cerdan, Autonomous University of Madrid, SpainReviewed by:
Ying-Shi Sun, Peking University Cancer Hospital, ChinaCopyright © 2021 Zhang, Wu, Xu, Zhang, Zhang, Mao, Li, Xiao, Guo, Ji, Sun and Jin. This is an open-access article distributed under the terms of the Creative Commons Attribution License (CC BY). The use, distribution or reproduction in other forums is permitted, provided the original author(s) and the copyright owner(s) are credited and that the original publication in this journal is cited, in accordance with accepted academic practice. No use, distribution or reproduction is permitted which does not comply with these terms.
*Correspondence: Hao Sun, c3VuaGFvX3JvYmVydEAxMjYuY29t
†These authors have contributed equally to this work and share first authorship
‡These authors have contributed equally to this work and share last authorship
Disclaimer: All claims expressed in this article are solely those of the authors and do not necessarily represent those of their affiliated organizations, or those of the publisher, the editors and the reviewers. Any product that may be evaluated in this article or claim that may be made by its manufacturer is not guaranteed or endorsed by the publisher.
Research integrity at Frontiers
Learn more about the work of our research integrity team to safeguard the quality of each article we publish.