 Xihai Wang
 Zaiming Lu*
- Department of Radiology, Shengjing Hospital, China Medical University, Shenyang, China
Objective: To investigate radiomics features extracted from PET and CT components of 18F-FDG PET/CT images integrating clinical factors and metabolic parameters of PET to predict progression-free survival (PFS) in advanced high-grade serous ovarian cancer (HGSOC).
Methods: A total of 261 patients were finally enrolled in this study and randomly divided into training (n=182) and validation cohorts (n=79). The data of clinical features and metabolic parameters of PET were reviewed from hospital information system(HIS). All volumes of interest (VOIs) of PET/CT images were semi-automatically segmented with a threshold of 42% of maximal standard uptake value (SUVmax) in PET images. A total of 1700 (850×2) radiomics features were separately extracted from PET and CT components of PET/CT images. Then two radiomics signatures (RSs) were constructed by the least absolute shrinkage and selection operator (LASSO) method. The RSs of PET (PET_RS) and CT components(CT_RS) were separately divided into low and high RS groups according to the optimum cutoff value. The potential associations between RSs with PFS were assessed in training and validation cohorts based on the Log-rank test. Clinical features and metabolic parameters of PET images (PET_MP) with P-value <0.05 in univariate and multivariate Cox regression were combined with PET_RS and CT_RS to develop prediction nomograms (Clinical, Clinical+ PET_MP, Clinical+ PET_RS, Clinical+ CT_RS, Clinical+ PET_MP + PET_RS, Clinical+ PET_MP + CT_RS) by using multivariate Cox regression. The concordance index (C-index), calibration curve, and net reclassification improvement (NRI) was applied to evaluate the predictive performance of nomograms in training and validation cohorts.
Results: In univariate Cox regression analysis, six clinical features were significantly associated with PFS. Ten PET radiomics features were selected by LASSO to construct PET_RS, and 1 CT radiomics features to construct CT_RS. PET_RS and CT_RS was significantly associated with PFS both in training (P <0.00 for both RSs) and validation cohorts (P=0.01 for both RSs). Because there was no PET_MP significantly associated with PFS in training cohorts. Only three models were constructed by 4 clinical features with P-value <0.05 in multivariate Cox regression and RSs (Clinical, Clinical+ PET_RS, Clinical+ CT_RS). Clinical+ PET_RS model showed higher prognostic performance than other models in training cohort (C-index=0.70, 95% CI 0.68-0.72) and validation cohort (C-index=0.70, 95% CI 0.66-0.74). Calibration curves of each model for prediction of 1-, 3-year PFS indicated Clinical +PET_RS model showed excellent agreements between estimated and the observed 1-, 3-outcomes. Compared to the basic clinical model, Clinical+ PET_MS model resulted in greater improvement in predictive performance in the validation cohort.
Conclusion: PET_RS can improve diagnostic accuracy and provide complementary prognostic information compared with the use of clinical factors alone or combined with CT_RS. The newly developed radiomics nomogram is an effective tool to predict PFS for patients with advanced HGSOC.
Introduction
Ovarian carcinoma is the leading cause of gynecologic cancer deaths because the majority of patients are diagnosed with advanced-stage disease (Stages III and IV) according to the International Federation of Gynecology and Obstetrics (FIGO) staging classification (1). HGSOC accounts for up to 70% of epithelial ovarian carcinoma (2, 3). Although most of those women achieve complete remission with cytoreductive surgery and cisplatin based chemotherapy. The median PFS time is only 18 months (4). A significant proportion of patients with advanced HGSOC experience tumor recurrence and progression within 3 years (5). Identification of tumor recurrence and progression in patients with advanced HGSOC after cytoreductive surgery is important since it guides the decisions about personalized treatment and surveillance plans.
18F-FDG PET/CT examination can provide more accurate information on preoperative staging and surveillance for detecting recurrent HGSOC (6–9). Compared with CT, 18F-FDG PET/CT can identify recurrence earlier because recurrence is characterized by hypermetabolism (9). Previous studies demonstrated conventional PET imaging metrics such as maximum standardized uptake value (SUVmax), metabolic tumor volume (MTV), total lesion glycolysis (TLG) had been reported to be significant prognostic factors for patients with HGSOC (10). However, due to inconsistent result of previous studies, there are some problems with metabolic parameters to predict survival for patients with HGSOC (11–14). Therefore the predictive value of these metabolic metrics to accurately stratify different risk groups seems to be limited (15). More effective indicators are needed to long-term monitor and predict the risk of recurrence and tumor progression.
Radiomics based on high-dimensional quantitative features extracted from different medical imaging modalities can noninvasively quantify tumor heterogeneity and show underlying malignant features (16). On the basis of predictive models based on those radiomics features, clinicians can deliver more personalized medical care about tumor diagnosis, histopathological classification, therapeutic assessment, and prognosis (16, 17). Several studies investigated the role of applying radiomics features extracted from CT images for non-invasive predicting tumor recurrence of HGSOC patients (18–21). The nomogram built by radiomics signatures and clinical factors demonstrated the feasibility of predicting the recurrence of HGSOC (18, 21). However, to our knowledge, study on the establishment and validation of PET/CT radiomics signature and nomogram for predicting PFS in HGSOC patients has not yet been reported. Therefore, in this study we established PET_RS and CT_RS, and hybrid radiomics nomograms integrating RS and clinical factors. In addition, the performances of these hybrid nomograms were compared.
Materials and Methods
Patients
This retrospective study was approved by the Medical Ethics Committee of Shengjing Hospital of China Medical University. From January 2013 to December 2017, A total of 363 patients were enrolled in this retrospective study. Inclusion criteria were as follows: (1) patients received cytoreductive surgery and 6-8 cycles of platinum-based chemotherapy; (2) postoperative pathological examination confirmed stage III and IV HGSOC; (3) 18F-FDG PET/CT examination was performed before surgery and neoadjuvant chemotherapy (NACT); (4) clinical, pathological, and follow-up information was available. The exclusion criteria included the following: (1) patients received any antitumor therapy before 18F-FDG PET/CT scan; (2) patients with other malignancies or other diseases that might affect the radiomics and survival analysis;(3) incomplete clinical-pathological reports;(4) poor image quality or SUVmax<2.5. Finally, 261 patients were enrolled in this study and randomly divided into training (n=182) and validation(n=79) cohorts in a ratio of 7:3. Clinical characteristics including age, FIGO stage, CA125, lymph node metastasis (LNM), volume of ascites, location of primary tumor, residual tumor(>2cm), NACT, and follow-up information were retrieved from the hospital information system. The diameter of primary tumor was acquired by PET/CT images.
Follow-Up and Clinical Endpoints
The patient was followed up 2-4 months for two years, then 3-6 months for 3 years, then annually after 5 years. Physical exam, CT scan, and serum CA-125 level was used to evaluate recurrence or progression of tumors. The endpoint of this study was tumor recurrence or progression, which was diagnosed by combining clinical symptoms, rising CA-125 levels, and radiological findings. PFS is defined as the time from the end of chemotherapy until tumor progression or the time of last follow-up.
PET/CT Image Acquisition
All patients underwent a whole-body 18F-FDG PET/CT scan on a dedicated PET/CT system (Discovery 690, GE Healthcare, Milwaukee, USA) according to the European Association of Nuclear Medicine (EANM) guidelines within 1 month before any treatment. Patients fasted 6 hours were injected with 161–361 MBq (4.35–9.76 mCi, 150 μCi/kg) 18F-FDG. Then the scan was performed after 60 min (59 ± 3 min, range 53–62 min). The 3D ordered subset expectation maximization algorithm (2 iterations and 20 subsets) was used for PET image reconstruction, resulting in voxel sizes of 3.65×3.65×3.27 mm3. The field of view (FOV) was 700 mm. The CT scans (80 mA, 120 kV) with matrix sizes of 512×512 were acquired for the attenuation correction method, prior to the PET scan. The PET and CT scans were transferred to workstation to display frame-on-frame fusion images. The PET images (voxel size 3.65 mm, slice thickness 3.27 mm) were then interpolated to the same resolution as CT images (voxel size 0.98 mm, slice thickness 3.27 mm).
Image Segmentation and Preprocessing
For each patient, all the lesions including primary tumors and distant metastases were identified by two radiologists (with more than 5 years of experience in abdominal imaging) in PET images. Metabolic parameters including SUVmax, SUVpeak, SUVmean, SUVmedian, TLG, MTV were extracted from all lesions. After that, all VOIs of PET images were semiautomatically segmented with a threshold of 42% of SUVmax by 3D slicer (Version 4.81, www.slicer.org). All tumors with SUV > 42% SUVmax were delineated except small lesions with size <1 cm. The VOIs of CT images were delineated according to the VOIs of PET images (Figure 1).
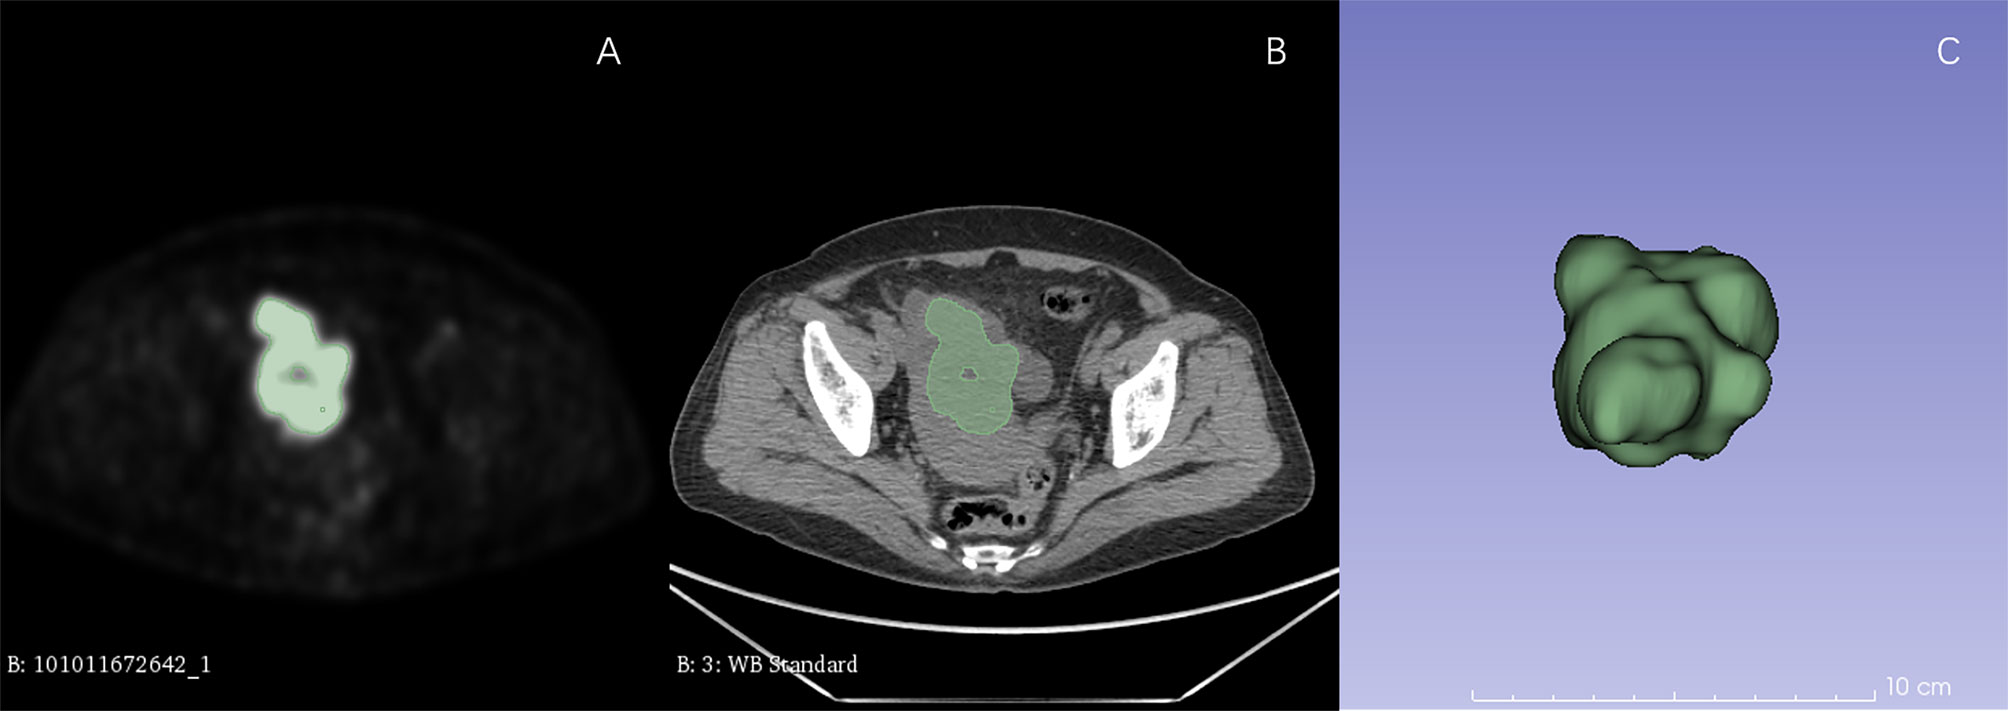
Figure 1 ROI delineation in PET and CT images. Plots (A, B) showed ROI delineation in PET and CT images. Plots (C) showed the 3D view.
Radiomics Features Extraction and Selection
Extractions of radiomics features from VOIs were performed by using a radiomics extension of 3D Slicer software called SlicerRadomics (V2.10, https://github.com/Radiomics/SlicerRadiomics) (22). We used a fixed bin width to make a histogram and discretized image gray level because PET show a better reproducibility of features when implementing a fixed bin width (23). Finally, 850 radiomics features were extracted from original and 8 derived images obtained by applying Wavelet filters, including 18 first-order features, 13 shape features, 23 gray level cooccurence matrix features, 16 gray level run length matrix features, 16 gray level size zone matrix features, 5 neighboring gray tone difference matrix features, 14 gray level dependence matrix features. All of the radiomics features were separately extracted from VOIs of PET and CT images for each patient.
The univariate analysis based on Cox regression was used to assess the correlation between radiomics features and PFS in training cohort. The features with P-value <0.05 were separately included in the LASSO regression analysis with 5-fold cross-validation for further features selection and RSs calculating. PET_RS and CT_RS of each patient were separately calculated from selected features weighted by their regression coefficients. In the training cohort the optimum cut-off value of each patient for PET_RS and CT_RS was determined by using the time-dependent ROC curve analysis with the highest Youden index, then the patients were divided into high-RS and low-RS groups according to the cutoff values. The potential associations of RSs with PFS were assessed in the training and validation cohorts based on Log-rank test.
Predictive Model Establishment and Evaluation
The radiomics features of CT and PET with variance close to 0 were deleted. Clinical features and PET metabolic parameters were assessed by univariate analysis based on Cox regression analysis. The features with P-value <0.05 in univariate Cox regression analysis were included in multivariate Cox regression analysis. Only the significant risk features with P-value <0.05 in multivariate Cox regression analysis were used to construct predictive models. Then, multivariate Cox regression models involved different combinations of clinical features, PET metabolic parameters, PET_RS, and CT_RS were build: (1) clinical features alone (denoted as Clinical), (2) combining clinical features and PET metabolic parameters (denoted as Clinical + PET_MP), (3) combining clinical features and PET_RS (denoted as Clinical + PET_RS), (4) combining clinical features and CT_RS (denoted as Clinical + CT_RS), (5) combining clinical features, PET metabolic parameters, and PET_RS (denoted as Clinical + PET_MP + PET_RS), (6) combining clinical features, PET metabolic parameters, and CT_RS (denoted as Clinical + PET_MP + CT_RS). The C-index was used to evaluate the discrimination of models. Then the time-dependent C-index curve analysis was used to evaluate the predictive performance of different models at different time points during follow-up both in training and validation cohorts. Calibration curves were performed to compare the predicted time with actual PFS. In order to evaluate the improvement in prediction performance by adding RSs and PET_MP to the Clinical model, the categorical NRI was calculated in the validation cohort for the first and third year. The patients were classified into three groups based on the probability of tumor progression with cutoffs at 0.30 and 0.60 defining low-, medium-, and high-risk groups. Finally, to provide patients and clinicians with an individualized and easy-to-use postoperative predictive tool for PFS, a radiomics nomogram was constructed on the basis of an optimal model.
Statistical Analysis
Student t-tests and Mann–Whitney U tests were used for continuous clinical risk factors, Chi-squared tests were applied for categorical variables, and log-rank tests were conducted for PFS to assess the difference between the training and validation cohorts. Univariate and multivariate Cox regression, LASSO-Cox regression analysis, calibration curves plot, C-index, and NRI was performed using R software (version 4.0, http://www.r-project.org). A two-sided p <0.05 indicated a statistically significant difference.
Results
Clinical Characteristics
The demographic and clinical characteristics of training and validation cohorts were shown in Table 1. There was no significant difference between two cohorts. The PFS of the training cohort was 694 days, 616 days in the validation cohort (P=0.955). Although slightly longer compared with validation cohort, the PFS was not significantly different between two cohorts.
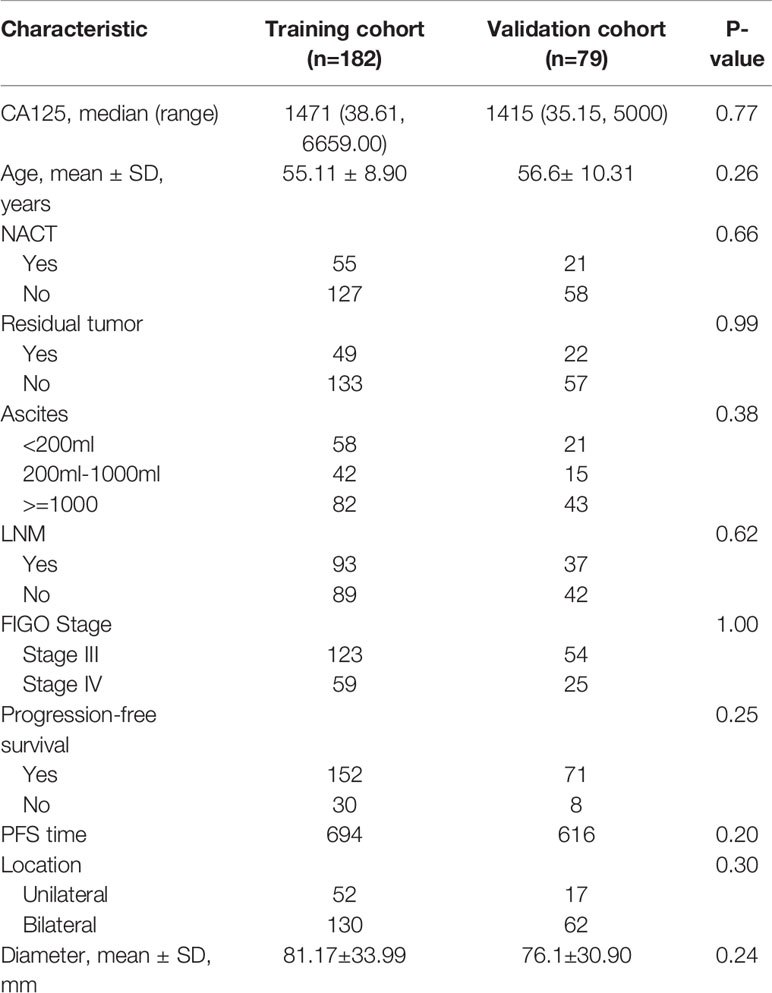
Table 1 The demographic and clinical characteristics of HGSOC patients in the training and validation cohorts.
Univariate Cox regression analysis revealed that NACT, residual tumor, ascites, LNM, location, FIGO stage were significantly associated with PFS in the training cohort. But only NACT, location, ascites, and residual tumor was significantly factor associated with PFS in multivariate Cox regression analysis. However, there were no PET_MPs significantly associated with PFS in the training cohort (Table 2).
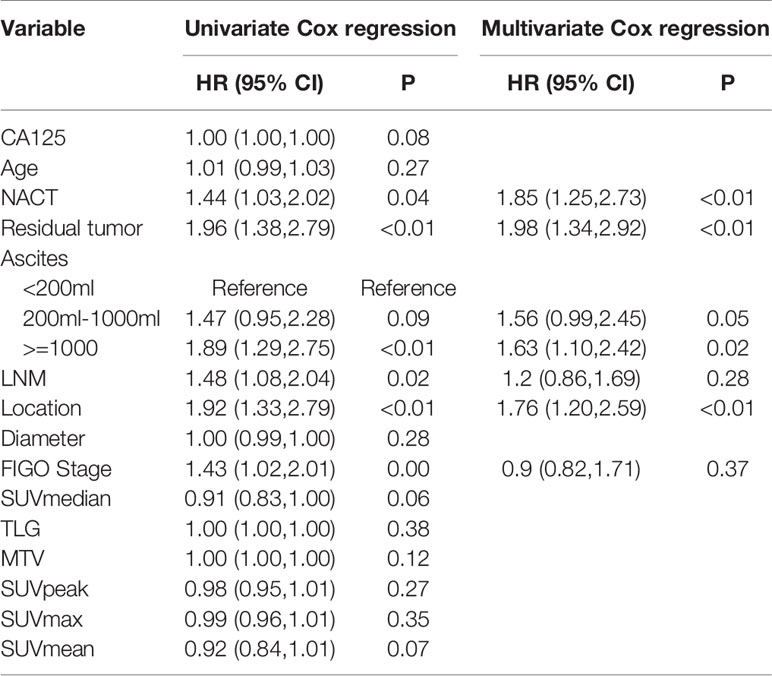
Table 2 Univariate and multivariate Cox analysis for PFS in the training and validation cohorts for patients with advanced HGSOC.
Radiomics Signatures Development and Validation
Ten features were selected from the radiomics feature of PET to construct PET_RS, and 1 features from the radiomics feature of CT to construct CT_RS in the training cohort. RSs were constructed based on the selected features and their corresponding weighting coefficients. The optimal cut-off values for CT_RS and PET_RS were 13.97 and -0.14. There was a significant difference between high and low RS groups both in training and validation cohorts for PET_RS and CT_RS. In the training cohort, p-values of the Log-rank test were both P < 0.01 for PET_RS and CT_RS, and both P=0.01 in the validation cohort. The Kaplan-Meier survival curves were conducted respectively for PET_RS and CT_RS in training and validation cohorts (Figure 2).
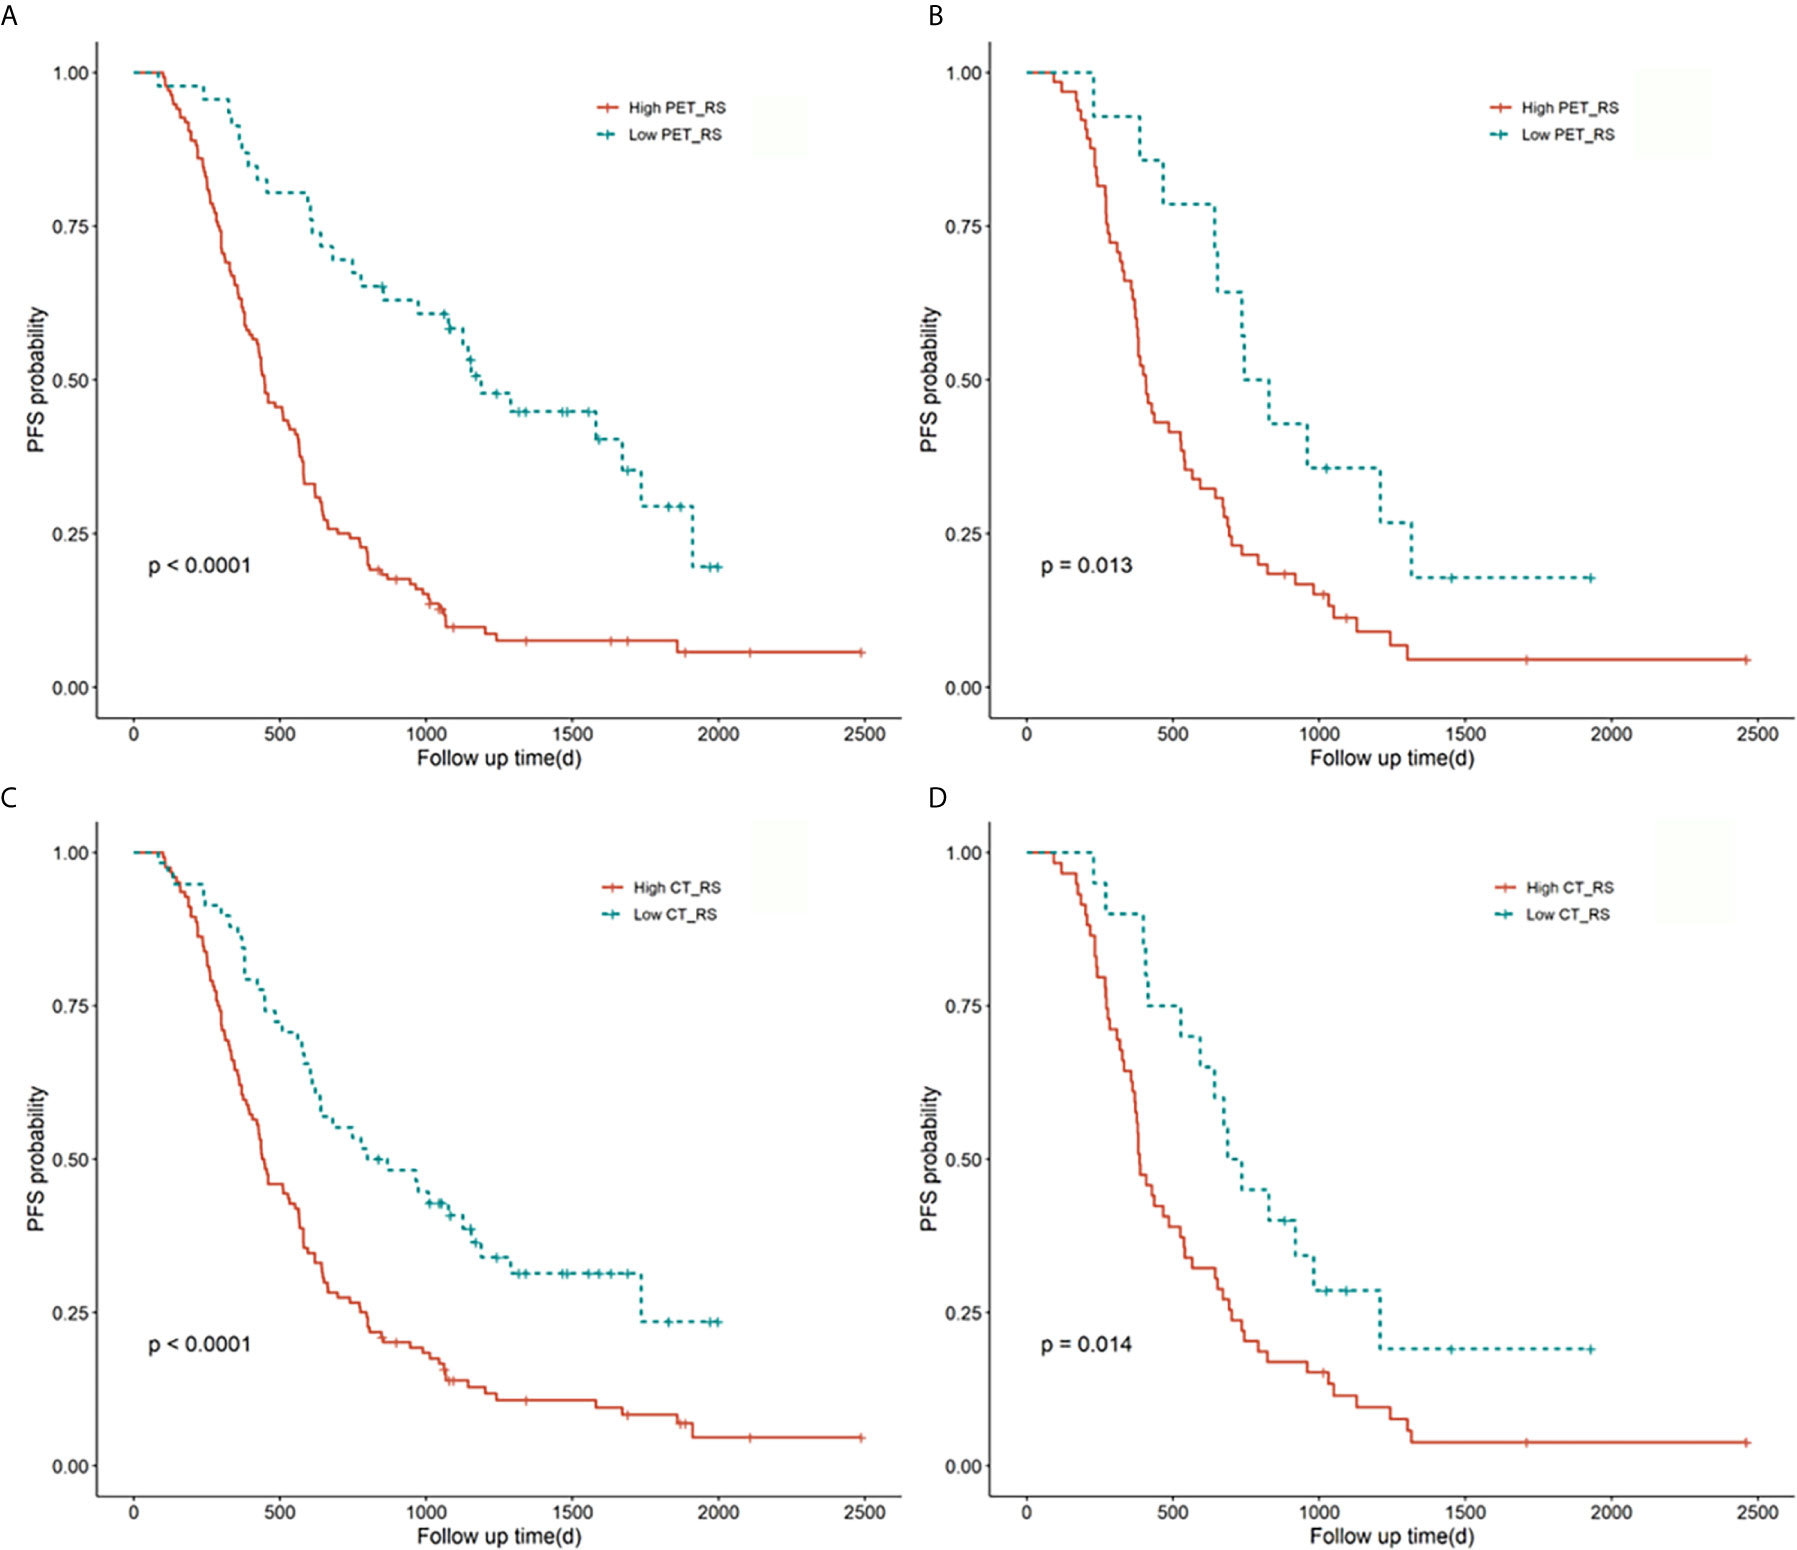
Figure 2 Kaplan-Meier survival curves for PET_RS and CT_RS in the training and validation cohorts. Plots (A, B) showed the KM survival curves of PET_RS in the training and validation cohorts. Plots (C, D) showed the KM survival curves of CT_RS in the training and validation cohorts.
Construction of Multiple Prognostic Model and Performance of Different Models
Because there were no PET_MPs significantly associated with PFS in the training cohort, only three models were constructed by 4 clinical features with P-value <0.05 in multivariate Cox regression and RSs (Clinical, Clinical+ PET_RS, Clinical+ CT_RS). The C-index of each model was shown on Table 3. Clinical+ PET_RS model showed higher prognostic performance than other models in training cohort (C-index=0.70, 95% CI 0.68-0.72) and validation cohort (C-index=0.70, 95%CI 0.66-0.74). The time-dependent C-index curve analysis of each model in training and validation cohorts also indicated similar results (Figure 3). Calibration curves of each model for prediction of 1-, 3-year PFS indicated Clinical +PET_RS model showed excellent agreements between estimated and the observed 1-, 3-outcomes (Figure 4). Compared to the Clinical model, the Clinical+PET_RS model achieved higher predictive performance improvement than Clinical+CT_RS models in the validation cohort, NRI was 19.33% (95%CI -3.37%,44.23%) for PFS estimation at the first year, and 11.97% (95%CI -6.56%, 29.70%) at the third years (Table 4).
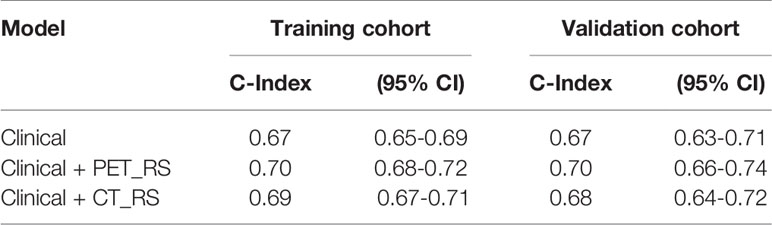
Table 3 The C-index of each model in the training and validation cohorts.
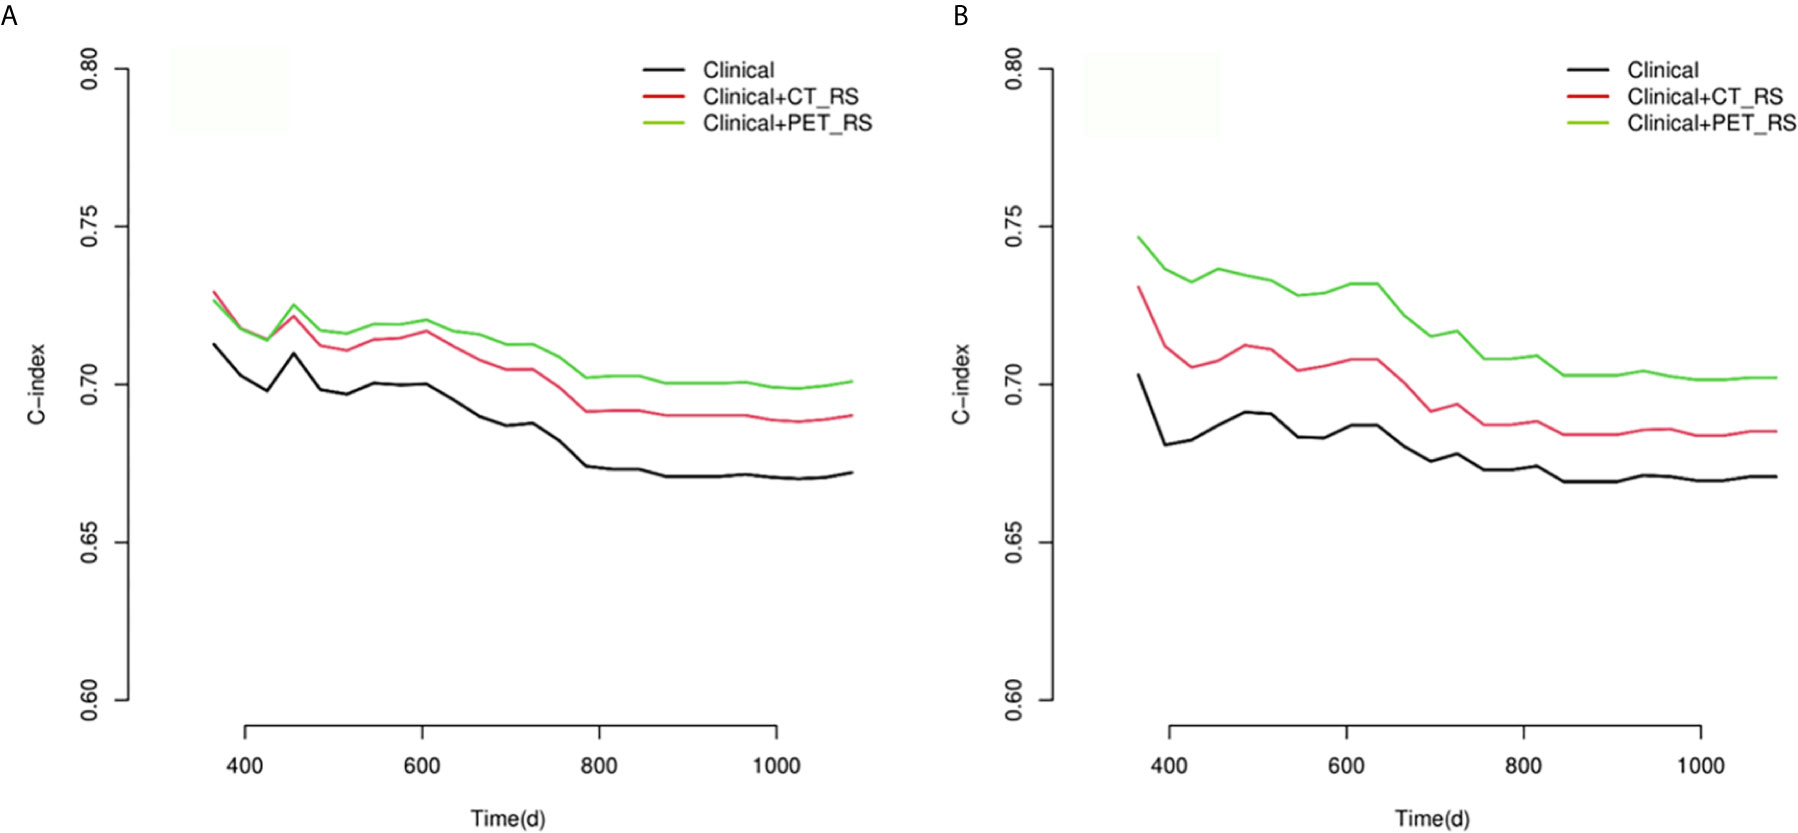
Figure 3 Compare of time-dependent C-index curves of each model for predicting PFS with advanced HGSOC in training (A) and validation (B) cohorts.
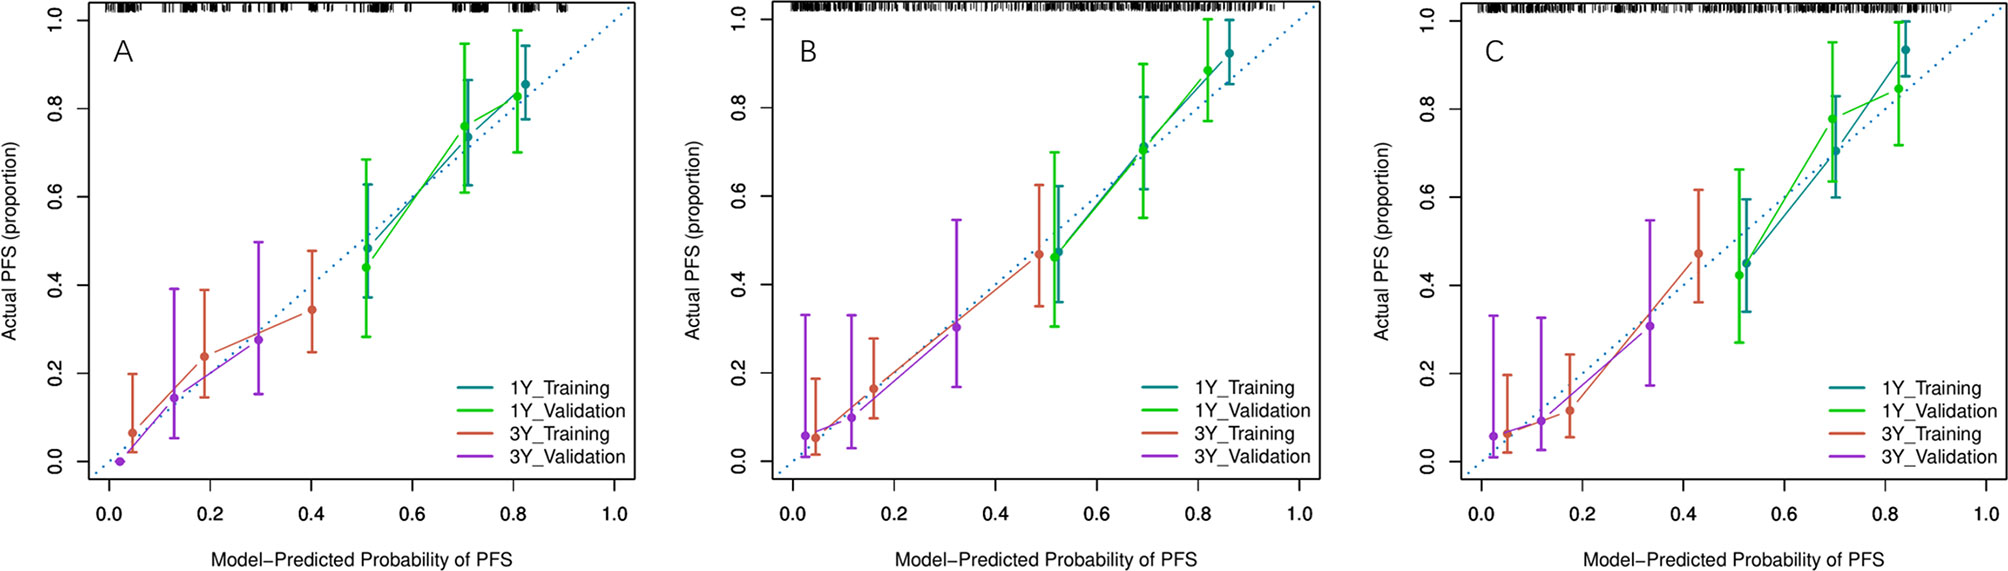
Figure 4 Calibration curves of each model for prediction of 1-, 3-year PFS in the training and validation cohorts. Model-estimated PFS was plotted on the x-axis; the observed PFS was plotted on the y-axis. The diagonal dotted line was a perfect estimation by an ideal model. (A) Clinical model, (B) Clinical + PET_RS model, (C) Clinical + CT_RS model.
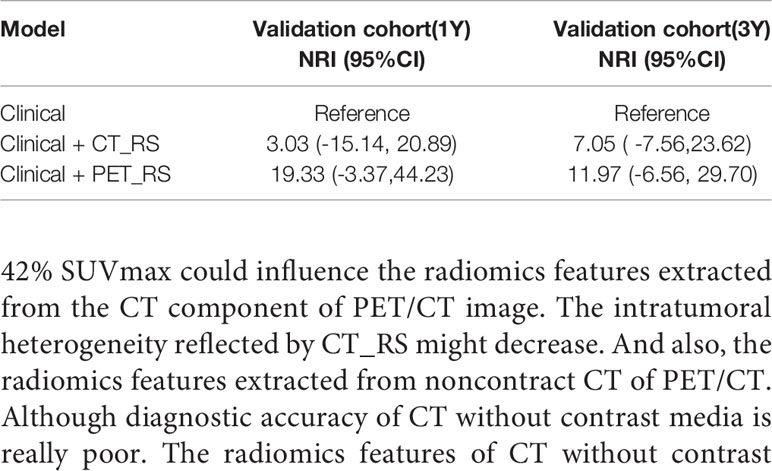
Table 4 NRI in validation cohort for the first year and third year.
Individualized Nomogram Construction and Clinical Use
Considering that the Clinical + PET_RS model had better discrimination, and calibration in predicting PFS for patients with advanced HGSOC in training and validation cohort, we created a nomogram based on this model, which can visualize proportion of risk factors and prediction result for each patient (Figure 5).
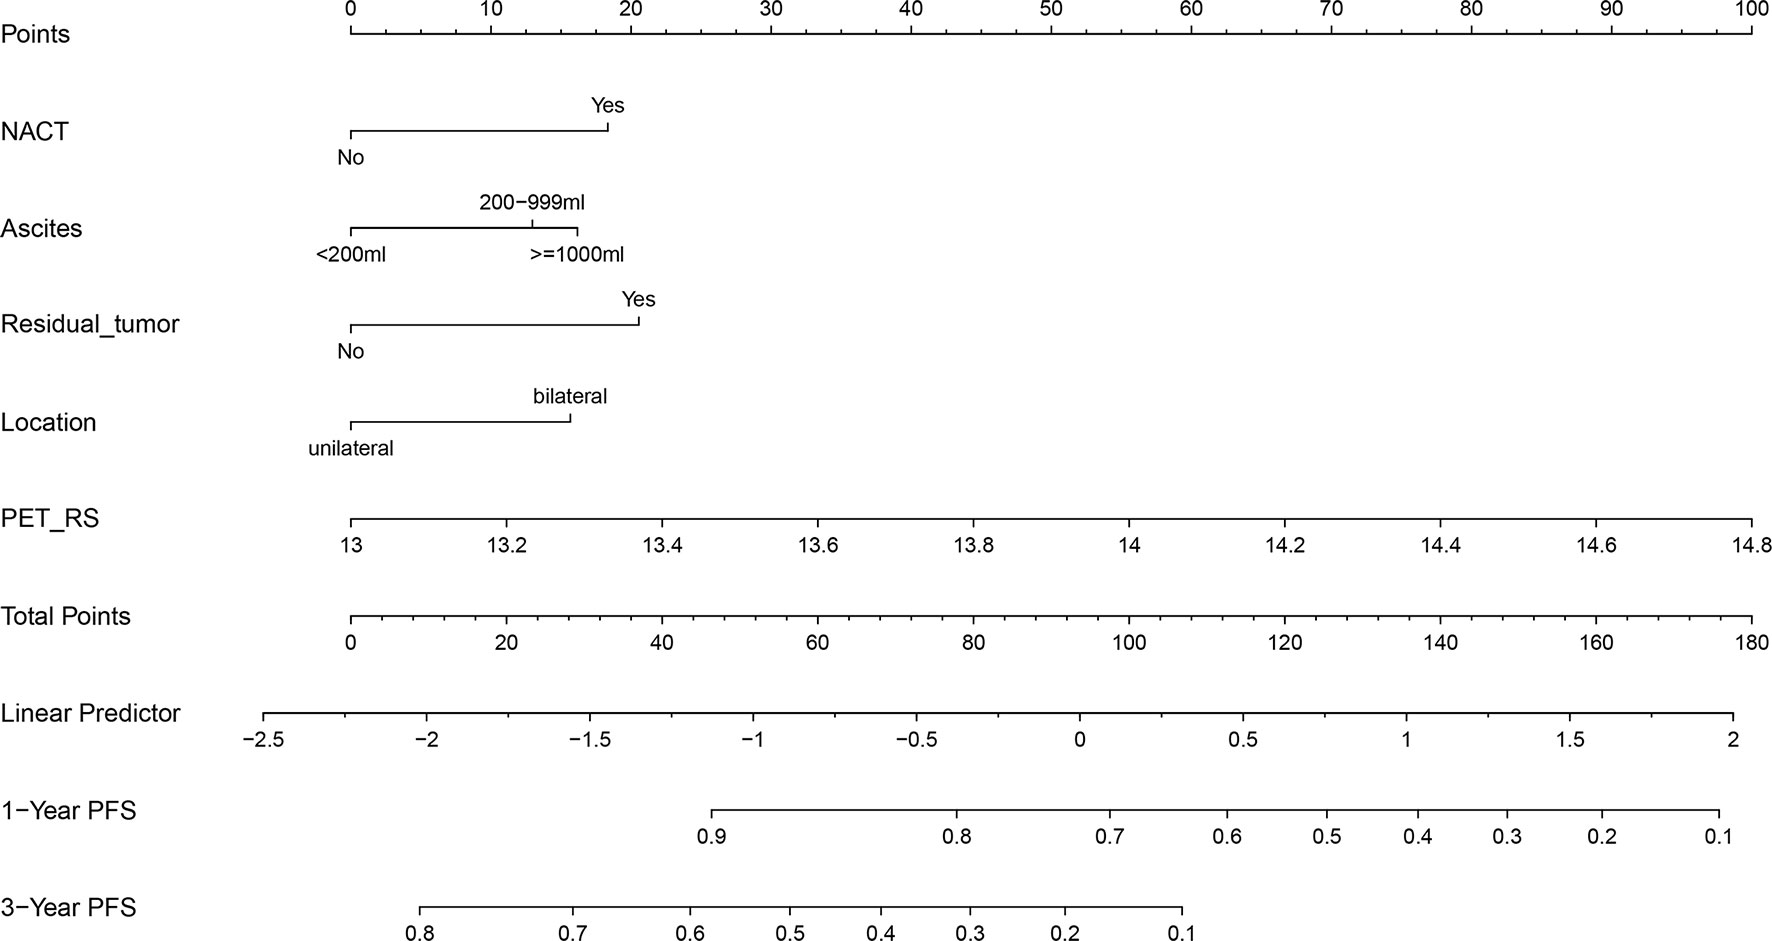
Figure 5 Nomogram based on Clinical + PET_RS model.
Discussion
Identifying new quantitative imaging markers of PET/CT to improve the accuracy of predicting tumor recurrence and progression is essential for the selection of appropriate treatment and follow up. In this study, we investigated the performance of RSs extracted separately from PET and CT components of PET/CT images integrated with clinical features to predict PFS for patients with advanced HGSOC. Compared with simple use of clinical features, the predictive performance of the model integrated clinical features and RS of PET images were significantly improved both in the training and validation cohorts.
In our study, we only included the patients with advanced HGSOC (FIGO stage III and IV), because there was significant difference between early stage and advanced stage HGSOC in PFS. Besides in our study, some advanced HGSOC patients with high tumor burden received NACT before cytoreductive surgery. We included age, NACT, residual tumor, volume of ascites, LNM, CA125, FIGO stage, location of primary tumor, and diameter of primary tumor as clinical features. Previous study indicated the volume of ascites was an independent predictor of PFS and OS in patients with epithelial ovarian carcinoma (24, 25). Although in previous study the threshold of volume was set to 1500 ml or 2000 ml respectively to classify patients into small- and large-volume ascites groups. We think the patients could be accurately stratified according to small(<200ml), medium (200-999ml), and lager(>1000ml) volume of ascites. AS showed in univariate and multivariate Cox regression analysis, the volume of ascites was the features significantly associated with PFS and included into final model. Previous study built a clinical model involving age, FIGO stage, preoperative CA-125, tumor location,and tumor diameter as features for PFS prediction (18). But in our study, the clinical model only involved clinical features with p-value <0.05 in univariate and multivariate COX regression analysis. Only NACT, residual tumor, ascites, location was included in the final clinical model. Residual tumor, NACT and location of primary tumor was considered to be independent risk factor of PFS for patients with advanced HGSOC in previous study (26–28).
Metabolic parameters of PET images were most frequently used in clinical practice and studies (29, 30). Although as shown in previous meta-analysis, MTV and TLG was potentially useful prognostic markers of PFS and OS in patients with ovarian cancer (13, 14). The prognostic value of metabolic parameters such as SUVmax, SUVmean, SUVmedian, MATV, and TLG for patients with HGSOC remains controversial (8, 11, 12, 15). In our study, Although the P value of SUVmedain and SUVmean was close to 0.05, there was no PET_MP significantly associated with PFS (P<0.05). So we did not include any PET_MP into our model. This might be due to the different cohorts. Previous studies included all subtypes of ovarian cancer regardless of heterogeneity and hindered the subtype-specific significance of PET/CT metabolic parameters. Another possible reason was that the difference of those metabolic parameters of 18F-FDG PET/CT in advanced HGSOC was small. Compared with the conventional PET_MP, the radiomics features of PET can reflect more extensive properties of image. PET_RS calculated by lasso regression could directly associate with PFS.
Intratumoral heterogeneity of PET/CT has been proved to be a prognostic predictor for some malignancies these years (10, 31, 32). The radiomics features extracted from PET/CT images allowed us to assess intratumoral and metabolic heterogeneity quantitatively. The relationship between texture-based quantitative features of CT images with residual tumors and survival was revealed in previous studies (33, 34). Textural analysis of CT images can provide added value in evaluating prognosis for patients with HGSOC. The predictive model built in previous study integrating deep learning features extracted from CT achieved good performance (18). The C-index was about 0.7, which is almost equal to our result. Combination of the radiomics feature of F2-Shape/Max3DDiameter with clinical features could significantly improve the AUC for predicting the risk of disease progression within 12 months in ovarian cancer patients (20). Hoverer this result was not validated in other patents. In previous study the AUC of RS constructed by 7 features from CT images to predict 3-year clinical recurrence-free survival was 0.8567 in the training cohort, and 0.8533 in the validation cohort (19). In our study we could forecast the time of tumor progression because the endpoint of our study was tumor progression instead of a fixed interval. However, in our study, the C-index of the CT_RS model was not as high as in the training cohort. A possible explanation for the low predictive power of CT_RS model in the validation cohort was that the VOI outlined in the PET image with a threshold of 42% SUVmax could influence the radiomics features extracted from the CT component of PET/CT image. The intratumoral heterogeneity reflected by CT_RS might decrease. And also, the radiomics features extracted from noncontract CT of PET/CT. Although diagnostic accuracy of CT without contrast media is really poor. The radiomics features of CT without contrast media could also show certain tumor heterogeneity (35–37).The difference between radiomics features of noncontract CT and contrast enhanced CT need to be explored.
To our knowledge, the association between radiomics features of PET images and PFS of HGSOC patients has not been evaluated. In our study, numerous prediction models, incorporating clinical features, CT_RS, and PET_RS in different combinations were built to predict PFS for patients with advanced HGSOC. The Clinical+PET_RS model performed better than other models in the training and validation cohorts. PET_RS included 10 radiomics features extract from original and derived images. The CT_RS was calculated by wavelet. HHH_glszm_GrayLevelNonUniformityNormalized features. This radiomics features measured the variability of gray-level intensity values in CT image array and be related to the PFS. Some studies have shown that the metabolic modifications of PET were more predictive than morphological modifications of CT (35–37). The results of previous and our study indicated the fact that the combination of radiomics features of PET and clinical variables has a more complementary and synergistic effects in predicting PFS.
This study has several limitations. Firstly, this was a single-center study. Although all the PET/CT scans were performed by one PET/CT scanner with standard imaging processes to reduce variance and bias of radiomics features. Further confirmation of the robustness of radiomics features and our predictive model will be needed. Secondly, the VOI s of the tumors was delineated on PET images with 42% SUVmax instead of CT images. The information on anatomical structure and structural heterogeneity may be ignored. Some studies draw ROI manually on fused images (38, 39). There are some problems in manual segmentation in the repeatability and stability of radiomics features. A further study exploring the difference between ROI extract methods will be needed. Thirdly, the average value of radiomics features was computed for all the VOIs including primary and metastatic tumors, which might not be the optimal method. The primary or other metastatic tumors must be investigated to generate optimal case-based image features.
Conclusions
In conclusion, RSs extracted from the PET and CT components of PET/CT images, quantitatively characterizing intratumoral heterogeneity, were associated with PFS of patients with advanced HGSOC. PET_RS can improve diagnostic accuracy and provide complementary prognostic information compared with the use of clinical parameters alone or combined with CT_RS. The newly developed radiomics nomogram is an effective tool to predict PFS for patients with advanced HGSOC.
Data Availability Statement
The raw data supporting the conclusions of this article will be made available by the authors, without undue reservation.
Ethics Statement
This study was approved by the Ethics Review Committee of Shengjing Hospital of China Medical University. Requirements for written informed consent were waived by the committee due to the retrospective nature of the study.
Author Contributions
ZL contributed conception and design. XW and ZL reviewed information of patients and extracted radiomics features. XW performed the statistical analysis and wrote the first draft of the manuscript. ZL reviewed and revised the manuscript. All authors contributed to the article and approved the submitted version.
Conflict of Interest
The authors declare that the research was conducted in the absence of any commercial or financial relationships that could be construed as a potential conflict of interest.
Supplementary Material
The Supplementary Material for this article can be found online at: https://www.frontiersin.org/articles/10.3389/fonc.2021.638124/full#supplementary-material
References
1. Torre LA, Trabert B, DeSantis CE, Miller KD, Samimi G, Runowicz CD, et al. Ovarian cancer statistics, 2018. CA Cancer J Clin (2018) 68(4):284–96. doi: 10.3322/caac.21456
2. Ledermann JA, Raja FA, Fotopoulou C, Gonzalez-Martin A, Colombo N, Sessa C. Newly diagnosed and relapsed epithelial ovarian carcinoma: ESMO Clinical Practice Guidelines for diagnosis, treatment and follow-up. Ann Oncol (2018) 29(Suppl 4):iv259. doi: 10.1093/annonc/mdy157
3. Prat J. Staging classification for cancer of the ovary, fallopian tube, and peritoneum. Int J Gynaecol Obstet (2014) 124(1):1–5. doi: 10.1016/j.ijgo.2013.10.001
4. Miller DS, Blessing JA, Krasner CN, Mannel RS, Hanjani P, Pearl ML, et al. Phase II evaluation of pemetrexed in the treatment of recurrent or persistent platinum-resistant ovarian or primary peritoneal carcinoma: a study of the Gynecologic Oncology Group. J Clin Oncol (2009) 27(16):2686–91. doi: 10.1200/JCO.2008.19.2963
5. Oza AM, Cibula D, Benzaquen AO, Poole C, Mathijssen RH, Sonke GS, et al. Olaparib combined with chemotherapy for recurrent platinum-sensitive ovarian cancer: a randomised phase 2 trial. Lancet Oncol (2015) 16(1):87–97. doi: 10.1016/S1470-2045(14)71135-0
6. Chung YS, Kim HS, Lee JY, Kang WJ, Nam EJ, Kim S, et al. Early Assessment of Response to Neoadjuvant Chemotherapy with 18F-FDG-PET/CT in Patients with Advanced-Stage Ovarian Cancer. Cancer Res Treat (2020) 52(4):1211–8. doi: 10.4143/crt.2019.506
7. Palomar MA, Cordero GJM, Rubio MDPT, Vicente AMG, Pardo FJP, Londoño GAJ, et al. Value of [18F]FDG-PET/CT and CA125, serum levels and kinetic parameters, in early detection of ovarian cancer recurrence: Influence of histological subtypes and tumor stages. Med (Baltimore) (2018) 97(17):e0098. doi: 10.1097/MD.0000000000010098
8. Kemppainen J, Hynninen J, Virtanen J, Seppänen M. PET/CT for Evaluation of Ovarian Cancer. Semin Nucl Med (2019) 49:484–92. doi: 10.1053/j.semnuclmed.2019.06.010
9. Rubini G, Altini C, Notaristefano A, Merenda N, Rubini D, Ianora AA, et al. Role of 18F-FDG PET/CT in diagnosing peritoneal carcinomatosis in the restaging of patient with ovarian cancer as compared to contrast enhanced CT and tumor marker Ca-125. Rev Esp Med Nucl Imagen Mol (2014) 33(1):22–7. doi: 10.1016/j.remn.2013.06.008
10. Polverari G, Ceci F, Bertaglia V, Reale ML, Rampado O, Gallio E, et al. 18F-FDG Pet Parameters and Radiomics Features Analysis in Advanced Nsclc Treated with Immunotherapy as Predictors of Therapy Response and Survival. Cancers (Basel) (2020), 12(5). doi: 10.3390/cancers12051163
11. Gallicchio R, Nardelli A, Venetucci A, Capacchione D, Pelagalli A, Sirignano C, et al. F-18 FDG PET/CT metabolic tumor volume predicts overall survival in patients with disseminated epithelial ovarian cancer. Eur J Radiol (2017) 93:107–13. doi: 10.1016/j.ejrad.2017.05.036
12. Mayoral M, Fernandez-Martinez A, Vidal L, Fuster D, Aya F, Pavia J, et al. Prognostic value of (18)F-FDG PET/CT volumetric parameters in recurrent epithelial ovarian cancer. Rev Esp Med Nucl Imagen Mol (2016) 35(2):88–95. doi: 10.1016/j.remnie.2016.01.009
13. Han S, Kim H, Kim YJ, Suh CH, Woo S. Prognostic value of volume-based metabolic parameters of 18F-FDG PET/CT in ovarian cancer: a systematic review and meta-analysis. Ann Nucl Med (2018) 32(10):669–77. doi: 10.1007/s12149-018-1289-1
14. Chung HH, Lee M, Kim HS, Kim JW, Park NH, Song YS, et al. Prognostic implication of the metastatic lesion-to-ovarian cancer standardised uptake value ratio in advanced serous epithelial ovarian cancer. Eur Radiol (2017) 27(11):4510–5. doi: 10.1007/s00330-017-4883-z
15. Bats AS, Hugonnet F, Huchon C, Bensaid C, Pierquet-Ghazzar N, Faraggi M, et al. Prognostic significance of mediastinal 18F-FDG uptake in PET/CT in advanced ovarian cancer. Eur J Nucl Med Mol Imaging (2012) 39(3):474–80. doi: 10.1007/s00259-011-1984-9
16. Wang X, Sun W, Liang H, Mao X, Lu Z. Radiomics Signatures of Computed Tomography Imaging for Predicting Risk Categorization and Clinical Stage of Thymomas. BioMed Res Int (2019) 2019:3616852. doi: 10.1155/2019/3616852
17. Jiang Y, Li W, Huang C, Tian C, Chen Q, Zeng X, et al. A Computed Tomography-Based Radiomics Nomogram to Preoperatively Predict Tumor Necrosis in Patients With Clear Cell Renal Cell Carcinoma. Front Oncol (2020) 10:592. doi: 10.3389/fonc.2020.00592
18. Wang S, Liu Z, Rong Y, Zhou B, Bai Y, Wei W, et al. Deep learning provides a new computed tomography-based prognostic biomarker for recurrence prediction in high-grade serous ovarian cancer. Radiother Oncol (2019) 132:171–7. doi: 10.1016/j.radonc.2018.10.019
19. Wei W, Rong Y, Liu Z, Zhou B, Tang Z, Wang S, et al. Radiomics: a Novel CT-Based Method of Predicting Postoperative Recurrence in Ovarian Cancer. Annu Int Conf IEEE Eng Med Biol Soc (2018) 2018:4130–3. doi: 10.1109/EMBC.2018.8513351
20. Rizzo S, Botta F, Raimondi S, Origgi D, Buscarino V, Colarieti A, et al. Radiomics of high-grade serous ovarian cancer: association between quantitative CT features, residual tumour and disease progression within 12 months. Eur Radiol (2018) 28(11):4849–59. doi: 10.1007/s00330-018-5389-z
21. Wei W, Liu Z, Rong Y, Zhou B, Bai Y, Wei W, et al. A Computed Tomography-Based Radiomic Prognostic Marker of Advanced High-Grade Serous Ovarian Cancer Recurrence: A Multicenter Study. Front Oncol (2019) 9:255. doi: 10.3389/fonc.2019.00255
22. van Griethuysen JJM, Fedorov A, Parmar C, Hosny A, Aucoin N, Narayan V, et al. Computational Radiomics System to Decode the Radiographic Phenotype. Cancer Res (2017) 77(21):e104–7. doi: 10.1158/0008-5472.CAN-17-0339
23. Leijenaar RT, Nalbantov G, Carvalho S, van Elmpt WJ, Troost EG, Boellaard R, et al. The effect of SUV discretization in quantitative FDG-PET Radiomics: the need for standardized methodology in tumor texture analysis. Sci Rep (2015) 5:11075. doi: 10.1038/srep11075
24. Quan Q, Zhou S, Liu Y, Yin W, Liao Q, Ren S, et al. Relationship between ascites volume and clinical outcomes in epithelial ovarian cancer. J Obstet Gynaecol Res (2021). doi: 10.1111/jog.14682
25. Szender JB, Emmons T, Belliotti S, Dickson D, Khan A, Morrell K, et al. Impact of ascites volume on clinical outcomes in ovarian cancer: A cohort study. Gynecol Oncol (2017) 146(3):491–7. doi: 10.1016/j.ygyno.2017.06.008
26. Chiofalo B, Bruni S, Certelli C, Sperduti I, Baiocco E, Vizza E. Primary debulking surgery vs. interval debulking surgery for advanced ovarian cancer: review of the literature and meta-analysis. Minerva Med (2019) 110(4):330–40. doi: 10.23736/S0026-4806.19.06078-6
27. Hoppenot C, Eckert MA, Tienda SM, Lengyel E. Who are the long-term survivors of high grade serous ovarian cancer. Gynecol Oncol (2018) 148(1):204–12. doi: 10.1016/j.ygyno.2017.10.032
28. Vito AC, Uccella S, Sozzi G, Ceccaroni M, Mautone D, Armano G, et al. Primary site disease and recurrence location in ovarian cancer patients undergoing primary debulking surgery vs. interval debulking surgery. Eur J Surg Oncol (2020). doi: 10.1016/j.ejso.2020.09.014
29. Fathinul FAS, Dharmendran R, Vikneswaran P, Nordin AJ. 18F-FDG PET/CT as a potential predictor of survival in patient with oesophageal cancer: a preliminary result. Abdom Imaging (2015) 40(6):1457–64. doi: 10.1007/s00261-014-0343-2
30. Nakaigawa N, Kondo K, Tateishi U, Minamimoto R, Kaneta T, Namura K, et al. FDG PET/CT as a prognostic biomarker in the era of molecular-targeting therapies: max SUVmax predicts survival of patients with advanced renal cell carcinoma. BMC Cancer (2016) 16:67. doi: 10.1186/s12885-016-2097-4
31. Yang B, Zhong J, Zhong J, Ma L, Li A, Ji H, et al. Development and Validation of a Radiomics Nomogram Based on 18F-Fluorodeoxyglucose Positron Emission Tomography/Computed Tomography and Clinicopathological Factors to Predict the Survival Outcomes of Patients With Non-Small Cell Lung Cancer. Front Oncol (2020) 10:1042. doi: 10.3389/fonc.2020.01042
32. Haider SP, Zeevi T, Baumeister P, Reichel C, Sharaf K, Forghani R, et al. Potential Added Value of PET/CT Radiomics for Survival Prognostication beyond AJCC 8th Edition Staging in Oropharyngeal Squamous Cell Carcinoma. Cancers (Basel) (2020) 12(7). doi: 10.3390/cancers12071778
33. Vargas HA, Veeraraghavan H, Micco M, Nougaret S, Lakhman Y, Meier AA, et al. A novel representation of inter-site tumour heterogeneity from pre-treatment computed tomography textures classifies ovarian cancers by clinical outcome. Eur Radiol (2017) 27(9):3991–4001. doi: 10.1007/s00330-017-4779-y
34. Meier A, Veeraraghavan H, Nougaret S, Lakhman Y, Sosa R, Soslow RA, et al. Association between CT-texture-derived tumor heterogeneity, outcomes, and BRCA mutation status in patients with high-grade serous ovarian cancer. Abdom Radiol (NY) (2019) 44(6):2040–7. doi: 10.1007/s00261-018-1840-5
35. Zhang J, Zhao X, Zhao Y, Zhang J, Zhang Z, Wang J, et al. Value of pre-therapy 18F-FDG PET/CT radiomics in predicting EGFR mutation status in patients with non-small cell lung cancer. Eur J Nucl Med Mol Imaging (2020) 47(5):1137–46. doi: 10.1007/s00259-019-04592-1
36. Kaira K, Higuchi T, Naruse I, Arisaka Y, Tokue A, Altan B, et al. Metabolic activity by 18F-FDG-PET/CT is predictive of early response after nivolumab in previously treated NSCLC. Eur J Nucl Med Mol Imaging (2018) 45(1):56–66. doi: 10.1007/s00259-017-3806-1
37. Mu W, Tunali I, Gray JE, Qi J, Schabath MB, Gillies RJ. Radiomics of 18F-FDG PET/CT images predicts clinical benefit of advanced NSCLC patients to checkpoint blockade immunotherapy. Eur J Nucl Med Mol Imaging (2020) 47(5):1168–82. doi: 10.1007/s00259-019-04625-9
38. Lv W, Yuan Q, Wang Q, Ma J, Feng Q, Chen W, et al. Radiomics Analysis of PET and CT Components of PET/CT Imaging Integrated with Clinical Parameters: Application to Prognosis for Nasopharyngeal Carcinoma. Mol Imaging Biol (2019) 21(5):954–64. doi: 10.1007/s11307-018-01304-3
Keywords: high-grade serous ovarian cancer, progression-free survival, radiomics, PET/CT, nomogram
Citation: Wang X and Lu Z (2021) Radiomics Analysis of PET and CT Components of 18F-FDG PET/CT Imaging for Prediction of Progression-Free Survival in Advanced High-Grade Serous Ovarian Cancer. Front. Oncol. 11:638124. doi: 10.3389/fonc.2021.638124
Received: 05 December 2020; Accepted: 16 March 2021;
Published: 13 April 2021.
Edited by:
Hong Huang, Chongqing University, ChinaReviewed by:
Orazio Schillaci, University of Rome Tor Vergata, ItalyLongfei Liu, Xiangya Hospital, Central South University, China
Copyright © 2021 Wang and Lu. This is an open-access article distributed under the terms of the Creative Commons Attribution License (CC BY). The use, distribution or reproduction in other forums is permitted, provided the original author(s) and the copyright owner(s) are credited and that the original publication in this journal is cited, in accordance with accepted academic practice. No use, distribution or reproduction is permitted which does not comply with these terms.
*Correspondence: Zaiming Lu, bHV6YWltaW5nQHNpbmEuY29t