 Xin Xu
 En Zhou
 Jun Zheng1†
 Chihao Zhang
 Jiayun Lin
 Jiwei Yu
94% of researchers rate our articles as excellent or good
Learn more about the work of our research integrity team to safeguard the quality of each article we publish.
Find out more
ORIGINAL RESEARCH article
Front. Oncol. , 26 February 2021
Sec. Gastrointestinal Cancers
Volume 11 - 2021 | https://doi.org/10.3389/fonc.2021.631803
Background: N6-methyladenosine (m6A) RNA modification plays a critical role in gastric cancer (GC). However, the relationship between the m6A “eraser”, FTO, and ALKBH5, and the prognosis of GC still remains unclear. This study aimed to evaluate the effect of FTO and ALKBH5 on the prognosis of patients and their potential roles in GC.
Materials and Methods: A total of 738 GC samples with clinical information obtained from two independent datasets were included and divided into training set and testing set. Differential expression analysis of the m6A “eraser” related genes was performed. The LASSO Cox regression model was constructed to analyze the m6A “eraser” related risk genes. The univariate and multivariate Cox regression model were employed to identify the independent prognostic factors. Kaplan-Meier method was used for survival analysis. A nomogram model was then carried out to predict the prognosis of GC patients. Additionally, GO and KEGG analyses were conducted to identify the potential role of the m6A “eraser” related genes in GC. The relative proportion of 22 different genotypes in immune infiltrating cells was calculated by CIBERSORT algorithm.
Results: In total, nine m6A “eraser” related risk genes and risk scores were obtained and calculated. Patients in high-risk group demonstrated significantly worse prognosis than those in low-risk group. Age, stage, and risk score were considered as independent prognostic factors. The nomogram model constructed accurately predicted the 3-year and 5-year overall survival (OS) of patients. Furthermore, m6A “eraser” might play a functional role in GC. The expression of m6A “eraser” leads to changes in tumor immune microenvironment.
Conclusions: FTO and ALKBH5 showed association with the prognosis of GC. The m6A “eraser” related genes, which is considered as a reliable prognostic and predictive tool, assists in predicting the OS in GC patients.
Gastric cancer (GC) is one of the most common malignancies (1), and is the second most common cause for cancer-related deaths worldwide. What is more, it is the most prevalent type of cancer in Eastern Asia (2), causing a huge burden to patients (3). Therefore, it is necessary to identify the potential therapeutic targets for GC and improve the prognosis of patients.
N6-methyladenosine (m6A) RNA modification plays an important role in RNA splicing, export, stability, and translation, and is considered as the most abundant epigenetic methylation modification of mRNAs and non-coding RNAs (ncRNAs) (4, 5). According to the previous studies, the process of m6A modification regulated by m6A regulators is invertible and dynamic, which includes “writers” (methyltransferases), “eraser” (demethylases), and “readers” (m6A binding proteins) (6, 7). So far, only the fat mass and obesity-associated (FTO) and ALKBH5 (α-ketoglutarate-dependent dioxygenase alkB homologue 5) have been found to act as “erasers” for m6A demethylation. ALKBH5 is a homologue of FTO, and their existence ensures the balance of m6A modification in the transcriptome (8).
The m6A “erasers” act as demethylase by using ferrum as a co-factor and α-ketoglutaric acid as co-matrix to remove m6A (9), which appear to have limited functions under normal physiological conditions (6), but might induce the tumorigenesis of GC. Previous studies have shown that ALKBH5 was able to promote the proliferation of glioblastoma stem-like cells by regulating the expression of FOXM1 (10). Moreover, FTO could promote tumor progression by regulating multiple signaling pathways in a variety of tumors (11, 12). Also, a recent bioinformatic research revealed FTO as an independent prognostic biomarker and a predictor of clinicopathological characteristics of GC (13). However, the specific mechanism of m6A “erasers”, FTO and ALKBH5, in the progression of GC still remains unclear.
In this study, 305 GC samples obtained from the Cancer Genome Atlas (TCGA) datasets and 433 GC samples obtained from the Gene Expression Omnibus (GEO) datasets were analyzed. Nine m6A “eraser” related risk genes were screened using a least absolute shrinkage and selection operator (LASSO) Cox regression model and a nomogram model was constructed to predict the overall survival (OS) of patients with GC. The prognostic and predictive accuracies of the classifier in the training set (TCGA datasets) were assessed and validated in the testing group (GSE84437 datasets). The prognostic and predictive efficacy of clinicopathological risk factors were also compared in this study. In addition, the potential role of m6A “eraser” in GC and its possible signaling pathways were explored, and the expression of m6A “eraser” showed certain effects on tumor immune cell infiltration.
A total of 738 GC samples with clinical information obtained from TCGA (https://portal.gdc.cancer.gov), and GEO (https://www.ncbi.nlm.nih.gov/geo/) datasets were explored. The clinical information from TCGA was downloaded from the UCSC Xena database (http://xena.ucsc.edu), and the samples without clinical information were filtered out. The dataset from GEO (GSE84437) was processed using the chip platform (Illumina HumanHT-12 V3.0 expression beadchip, San Diego, CA, USA), which is the most commonly used in transcriptome analysis.
For microarray data (GSE84437), the raw probe level data in each CEL file was processed by robust multi-array average (RMA) algorithm of the Affy package (14). For genes that match multiple probes, average probe values were used as the expression value (15). The TCGA dataset was normalized by log-transformation of the Fragment Per Kilobase Per Million Reads (FPKM) +1. The missing data in these two gene expression matrices were supplemented by the k-Nearest Neighbor (KNN) approach (k = 10) (16). The gene expression data were transformed by Z-score to avoid systematic errors in different experiments.
The “edgeR” package was used to explore differential genes between high and low expression groups of m6A “eraser” FTO/ALKBH5, and the common differential expression genes were obtained using the “venn” package. The relationship between m6A “eraser”-related genes and the patient OS was evaluated with univariate Cox regression analysis by R software. Thereafter, the “glmnet” package was used to conduct LASSO Cox regression model (with the penalty parameter estimated by 10-fold cross-validation) (17). A risk score formula based on the expression levels of 9 m6A “eraser”-related genes for OS prediction was created, where the risk score was (3.74863 * expression level of NRP2) + (2.223197 * expression level of PARVA) + (0.626251 * expression level of LAMA4) + (0.463306 * expression level of EHD2) + (0.455573 * expression level of ANTXR2) + (0.074203 * expression level of DPYSL3) – (2.37796 * expression level of SDC3) – (2.47335 * MTMR12) – (2.71575 * expression level of SH3PXD2A). The risk scores were determined for all patients included in this study, and the median value was chosen as the cut-off value to divide patients into high- and low-risk groups.
To explore the potential function and signaling pathway related to m6A “eraser” in GC patients, Gene Ontology (GO) and the Kyoto Encyclopedia of Genes and Genomes (KEGG) pathways enrichment analyses were performed in m6A “eraser”-related differentially expressed genes using the “clusterProfiler” package. Meanwhile, by using the GC gene expression data, the relative proportion of 22 different genotypes in immune infiltrating cells was calculated by CIBERSORT algorithm.
SPSS version 23.0 (SPSS Inc., Chicago, IL, USA) and R software for windows version and R-4.0.2 (The R Foundation for Statistical Computing, Vienna, Austria) were used for data analysis. Continuous variables were compared using the t-test and categorical variables were compared using the χ2 test in both the groups. Univariate and multivariate Cox regression models were chosen to identify independent prognostic factors for OS. Hazard ratios (HRs) and 95% confidence intervals (95% CIs) were also determined. Kaplan-Meier method was used to analyze the association between variables and OS, and log-rank test was used for comparing the survival curves. A nomogram model as generated by a Cox regression model which was used in univariate and multivariate analyses. The “rms” package was used to generate nomogram and calibration plots. Decision curve analysis (DCA) was applied to identify the clinical feasibility of the nomogram (18). A P-value of <0.05 was considered to be statistically significant.
A total of 305 GC samples from the TCGA dataset were assigned to the training set, and 433 GC samples from the GSE84437 were assigned to the testing set. According to the expression levels of m6A “eraser,” FTO and ALKBH5, both training and testing sets were divided into FTO high and low expression groups and ALKBH5 high and low groups. The baseline demographic characteristics were shown in Table 1. A differential gene expression analysis was performed in FTO/ALKBH5 high and low groups from the training and testing sets (Supplementary Figures 1A–D). Two hundred ninety-seven common differentially expressed genes were identified in these four groups (Figure 1A), and 18 genes with p-values less than 0.05 were identified after univariate Cox regression analysis. After that, a Lasso Cox model was built to screen the risk genes to analyze the OS of GC patients, which generated nine m6A “eraser” related risk genes as well as the coefficients of each gene (Figures 1B, C, and Supplementary Table 1).
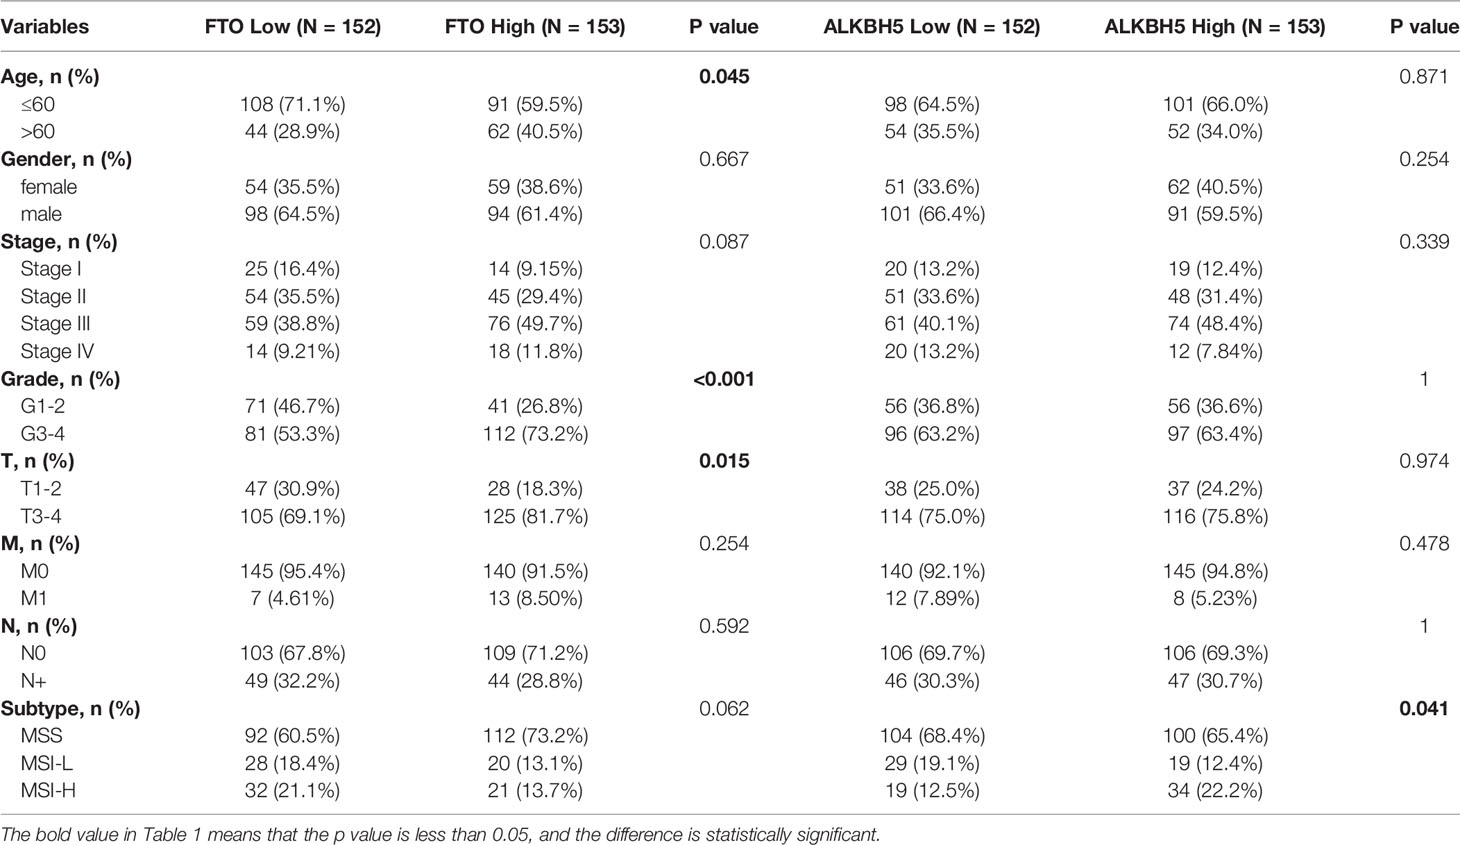
Table 1 Baseline clinicopathological characteristics.
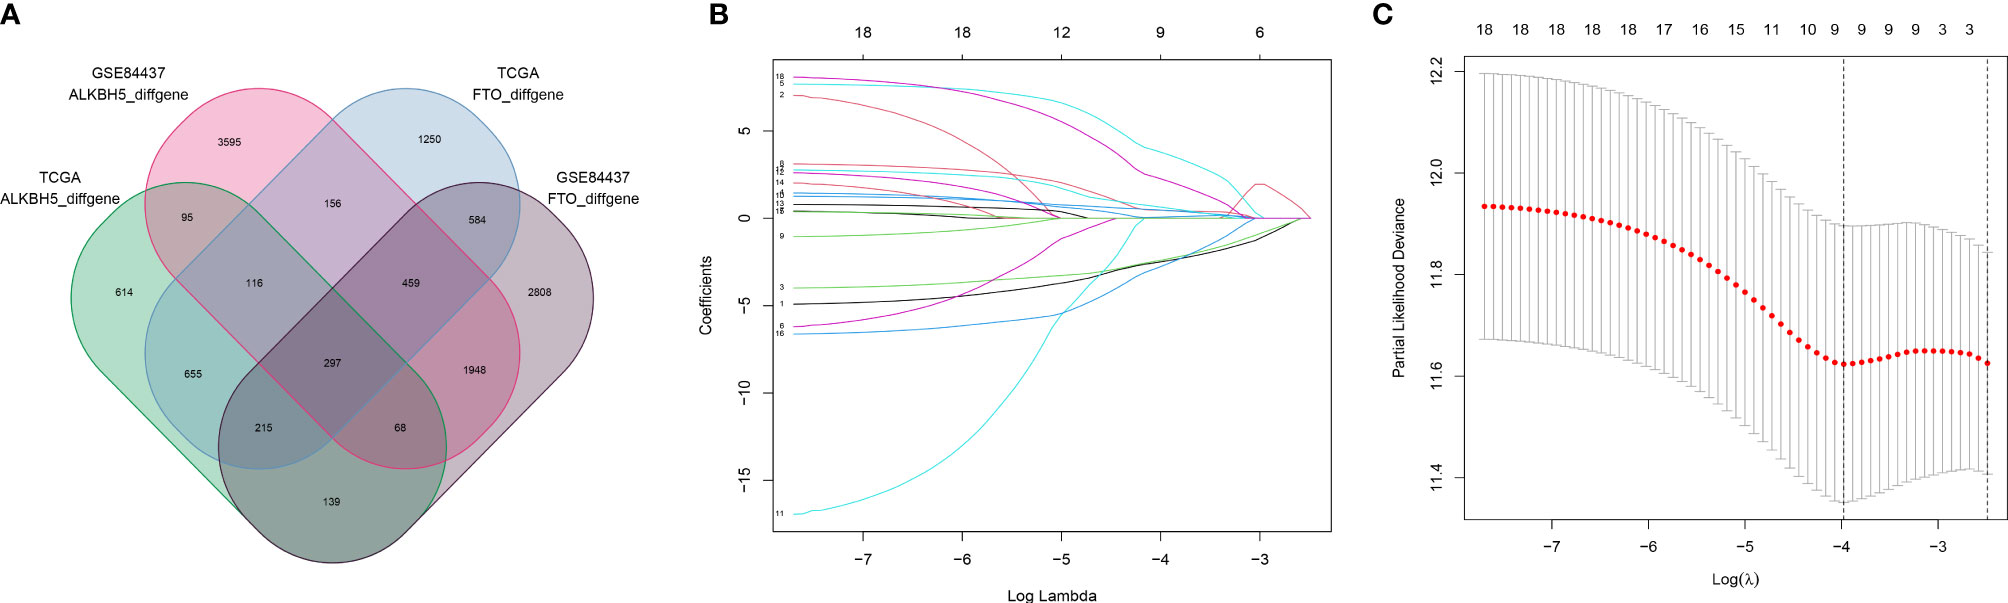
Figure 1 Screening of 9 m6A “eraser” related risk genes. (A) Venn diagram showing 297 commonly and differentially expressed genes in four groups with different data. (B, C) LASSO regression was employed to calculate the minimum criteria (B) and coefficients (C).
According to Lasso Cox model, patients in the training set were divided into low- and high-risk subgroups based on the median values of risk scores. Kaplan-Meier survival analysis revealed that patients in the high-risk subgroup had significantly worse prognosis than those in the low-risk subgroup (Figures 2A, B). The distributions of risk scores, survival time, and status were assessed, which indicated that patients with lower risk scores had better survival time (Figures 2C, D). The time-dependent ROC curves demonstrated that the nine m6A “eraser”-related risk genes had a promising ability to predict the OS of GC patients (Figures 2E, F). After multivariable adjustment by clinicopathological factors, the risk scores of nine m6A “eraser” related genes remained to be a powerful and independent factor (Figures 3B, D). All the above analyses showed similar results in both training and testing sets.
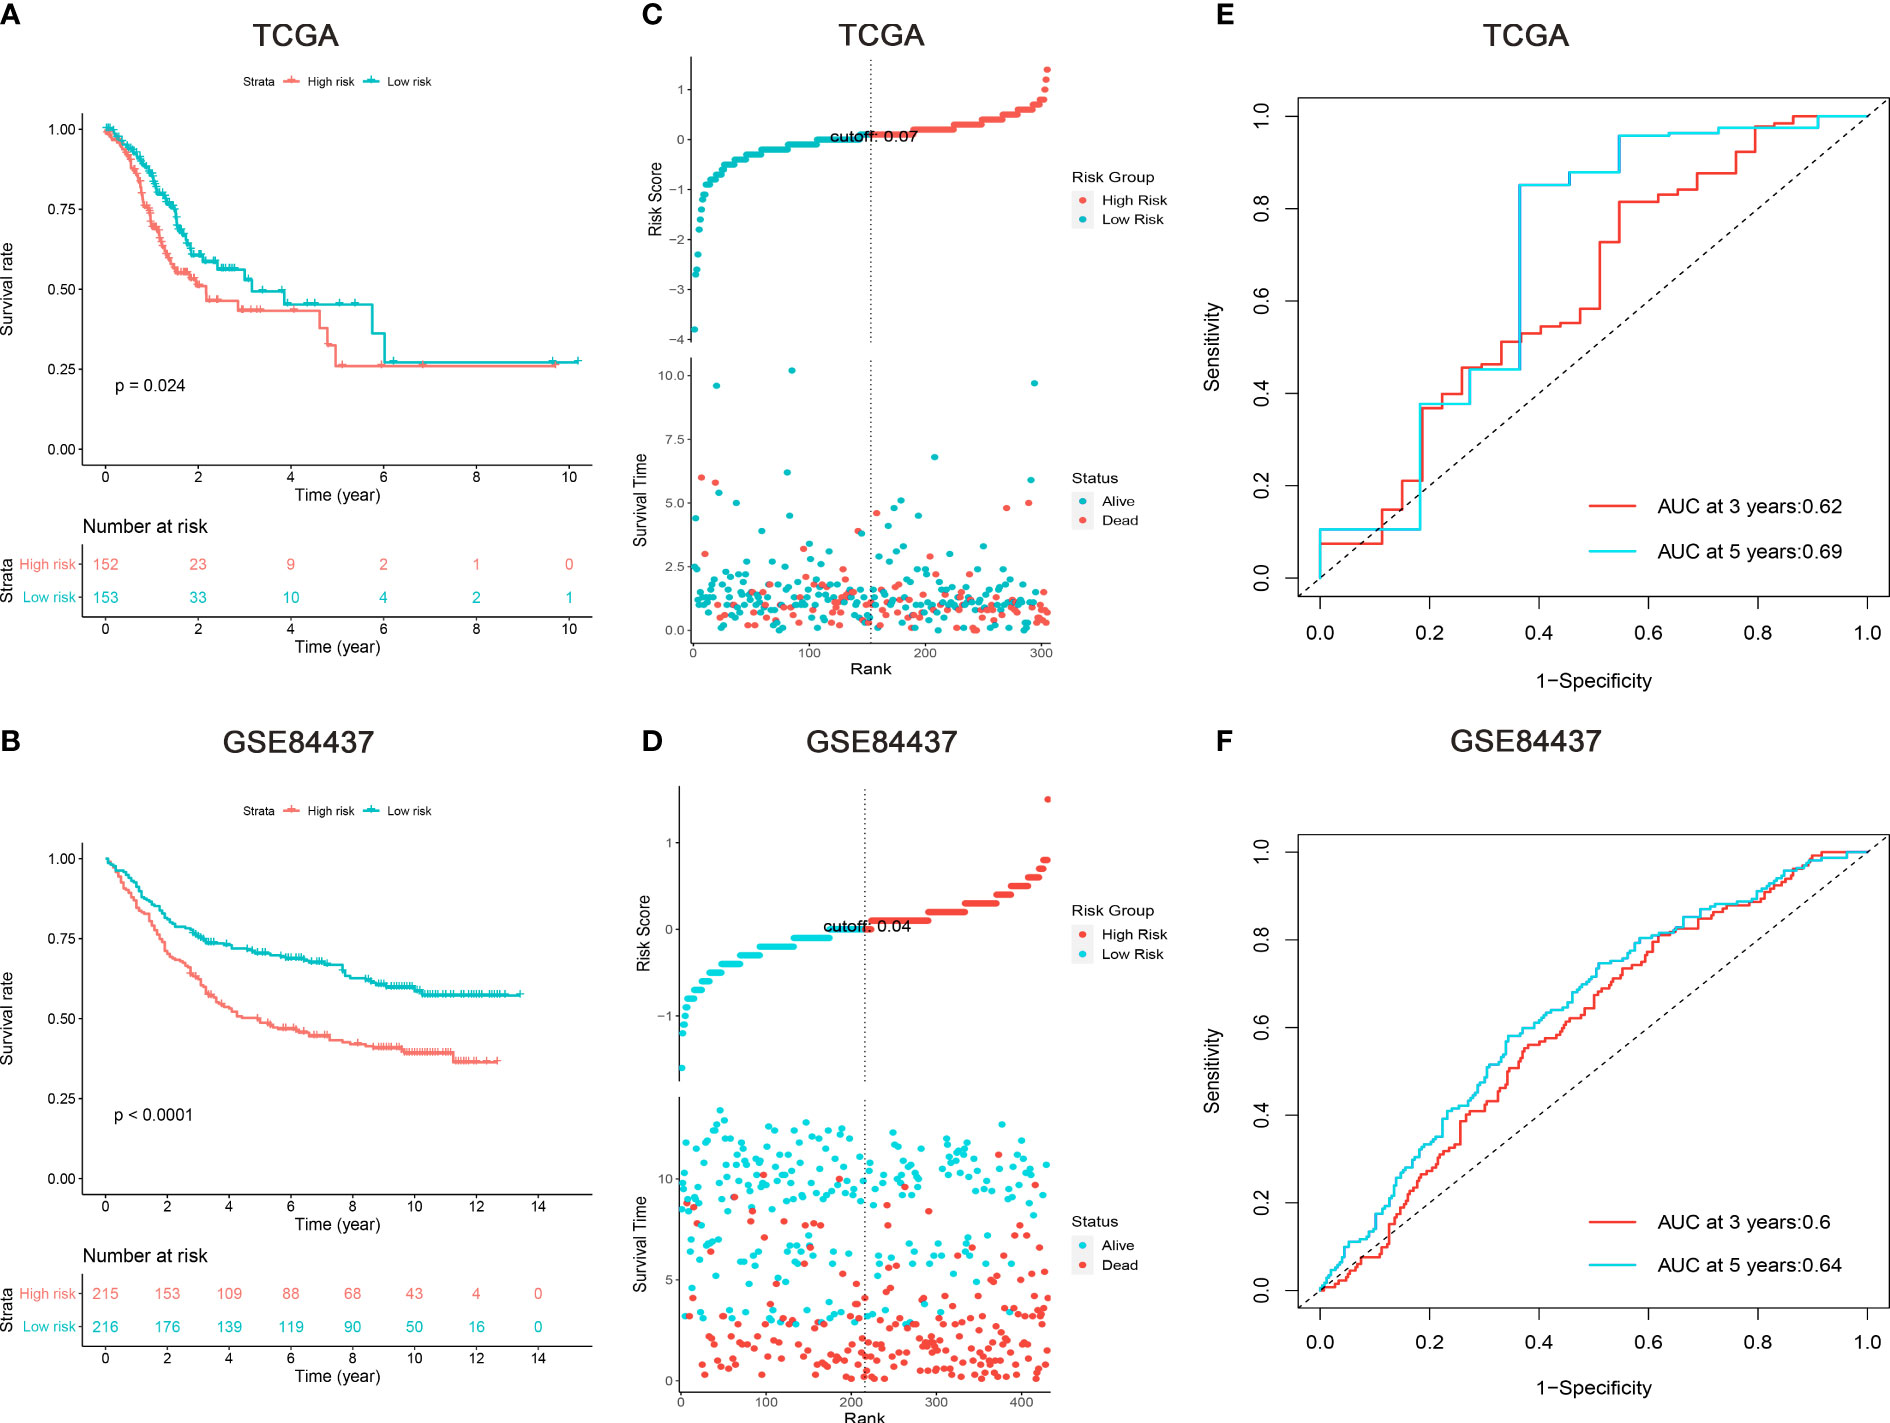
Figure 2 Survival analysis of gastric cancer patients in the TCGA and GSE84437 cohorts. (A, B) Kaplan-Meier survival analysis, (C, D) risk score by the nine m6A “eraser” relater risk genes, patients’ survival status and time, (E, F) time-dependent ROC curves. The AUCs of 3 and 5 years were used to assess prognostic accuracy and log-rank test was used to calculated the p-value.
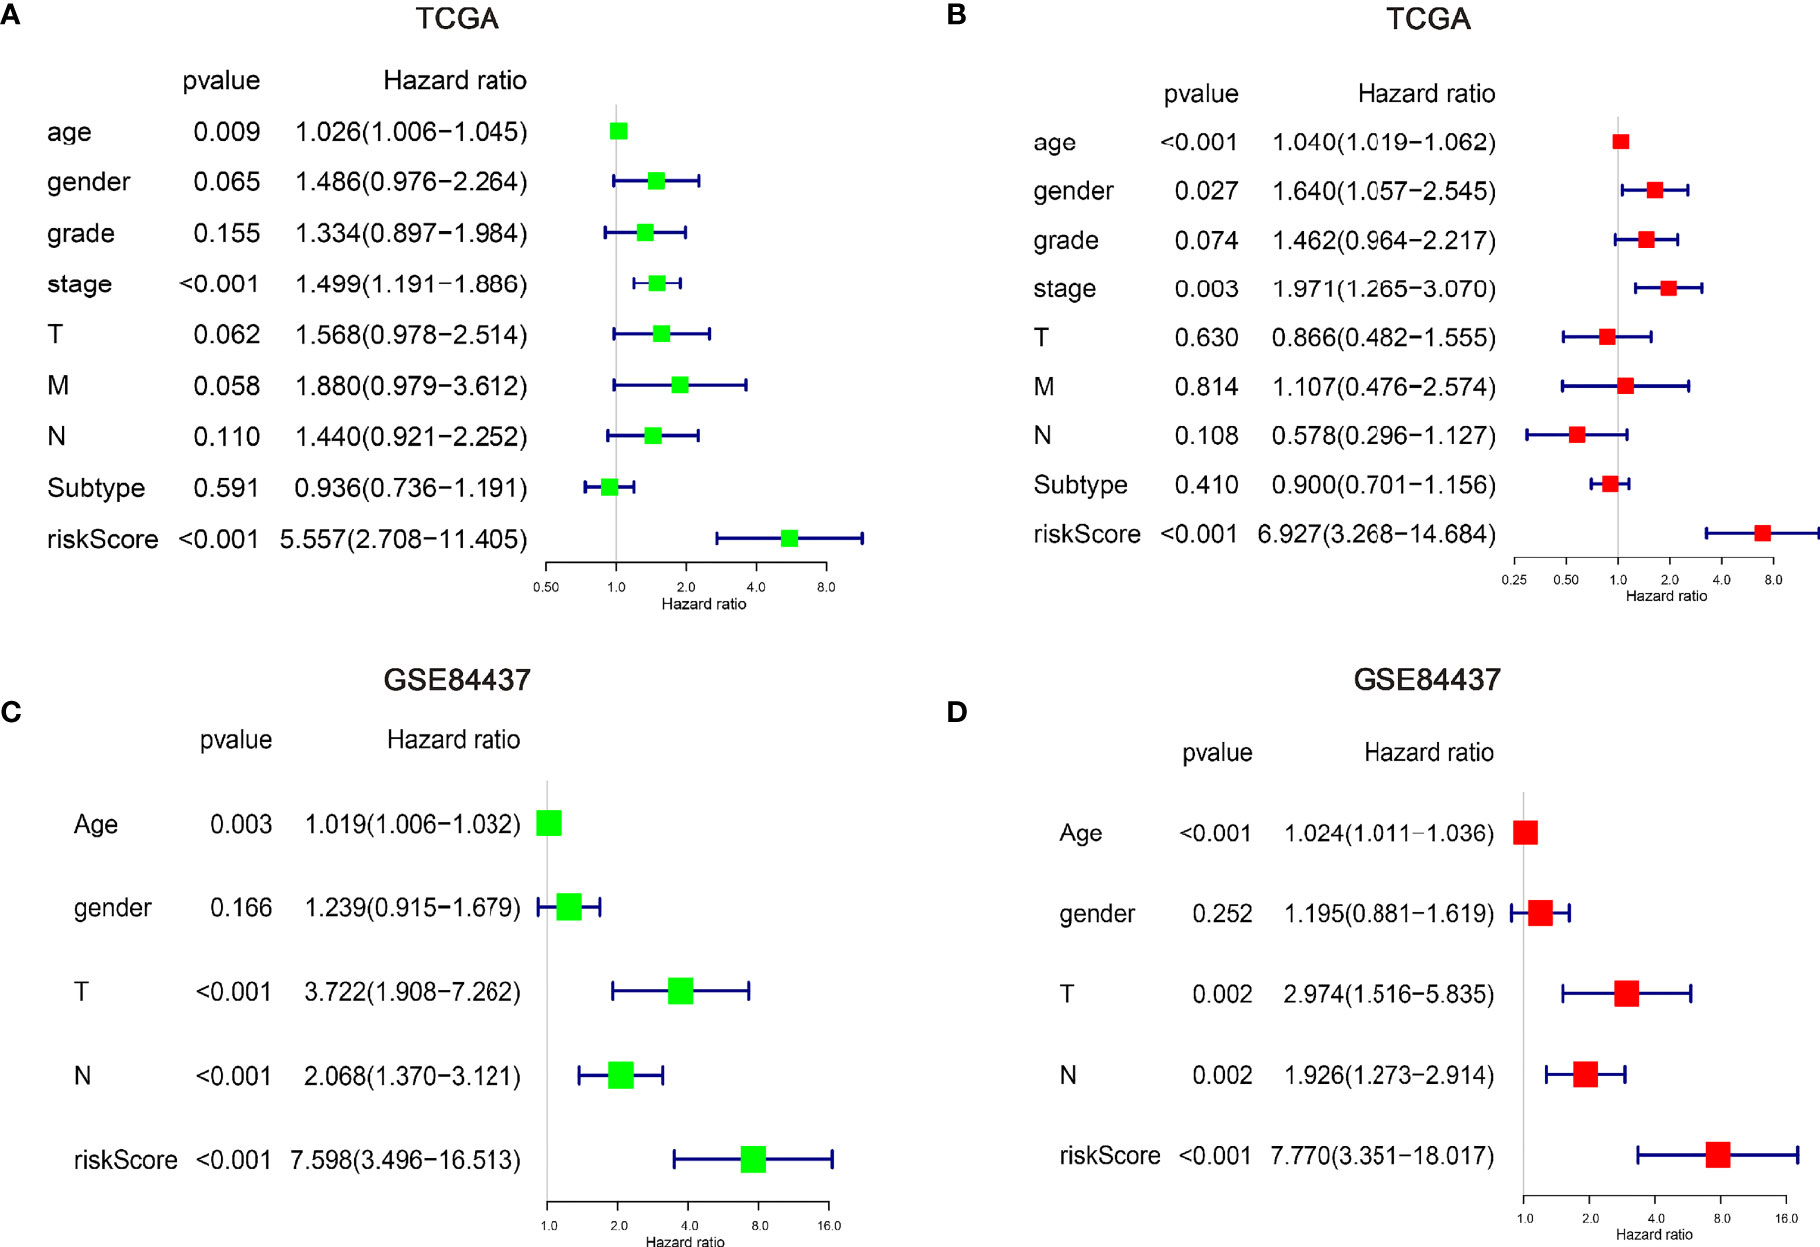
Figure 3 Explore the independent prognostic risk factors in gastric cancer patients. Univariate and multivariate Cox regression analysis of clinicopathological characteristics were performed in the TCGA (A, B) and GSE84437 (C, D) cohorts. And the hazard ratios (HR) and 95% confidence intervals (CI) were calculated, respectively.
The relationship between the nine m6A “eraser”-related risk genes and clinicopathological factors was explored. The results revealed that DPYSL3, EHD2, PARVA, NRP2, ANTXR2, and LAMA4 as risky genes, and the high expression level of these genes predicted worse prognosis. In contrast, MTMR12, SDC3, and SH3PXD2A were found to be as protective genes, and the high expression level of these three genes predicted better prognosis (Supplementary Figure 2A).
Next, univariate and multivariate Cox regression analyses of clinicopathological factors were performed. The results showed age, stage, and risk score as independent risk factors in the training set. Meanwhile, age, T stage, N stage, and risk score were shown to be as independent risk factors in the testing set (Figures 3A–D). Although some differences existed between the training and testing sets, these differences indicated similar results as tumor staging was defined by T, N, and M stage. In addition, we further performed Cox regression analyses for each clinicopathological subgroup of GC patients (Supplementary Figures 2B, C), however, we did not find significant intra group differences.
Furthermore, survival analyses were performed for each independent risk factor of clinicopathological subgroup in GC patients. The results showed that high risk scores demonstrated worse OS in patients aged ≤60, >60, and stage III-IV subgroups in the TCGA cohort, and had significantly decreased OS in patients aged ≤60, >60, T3-4, and positive lymph node metastasis subgroups in GSE84437 cohort (Figures 4A–J). These data indicated that the nine m6A “eraser”-related genes could act as a potential predictor in GC patients.
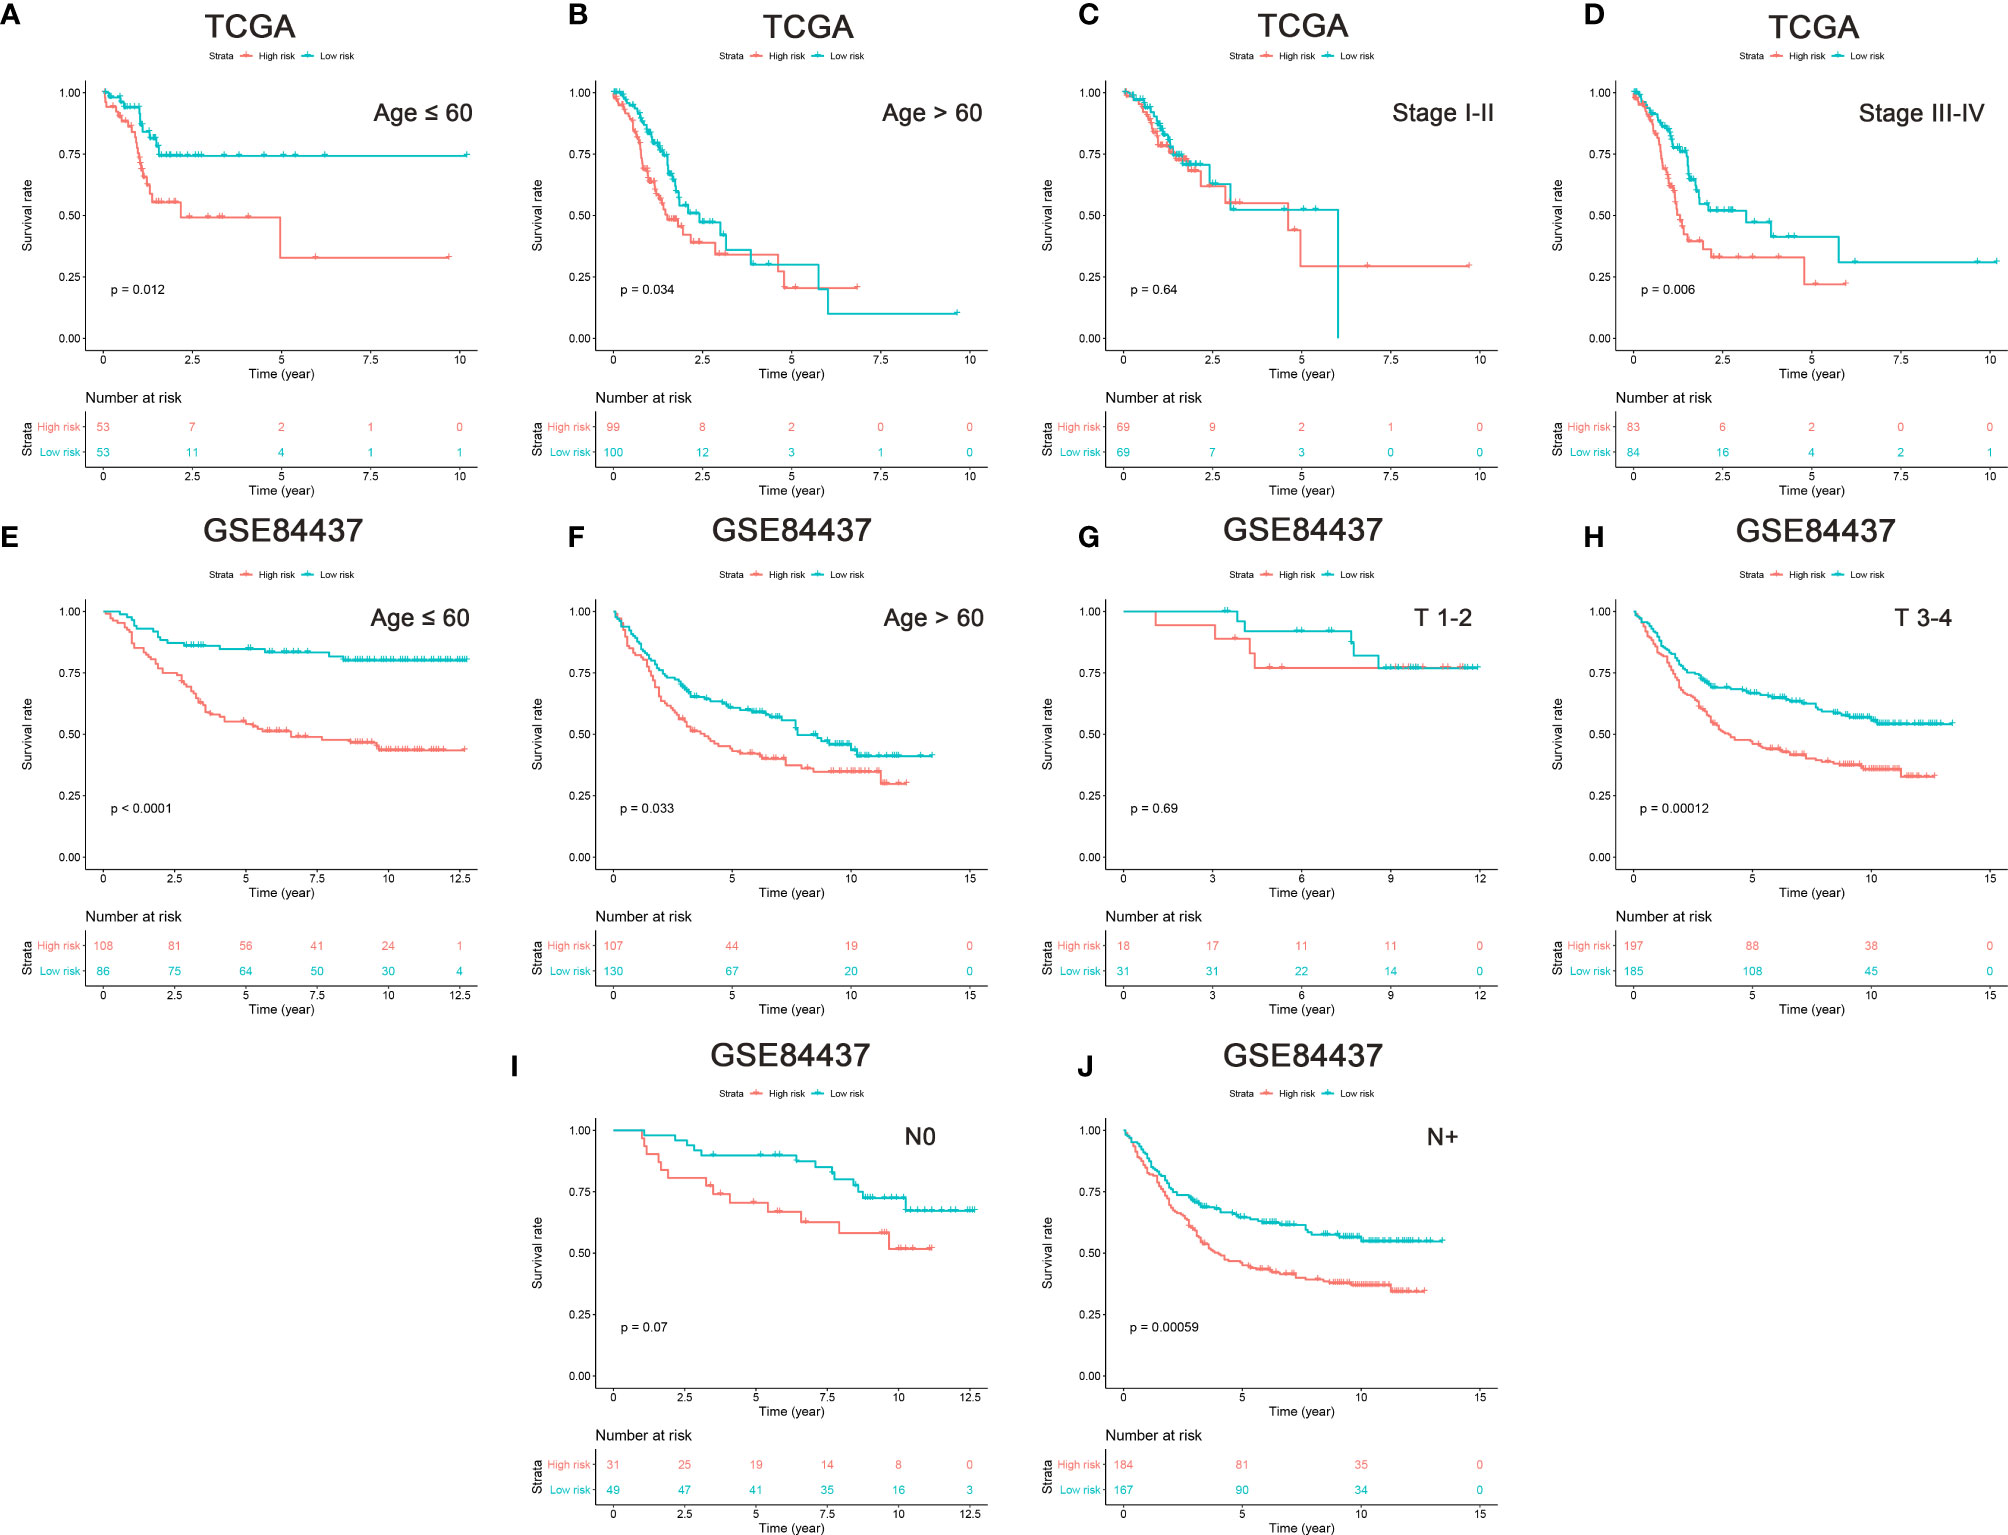
Figure 4 Prognostic analysis in the subtypes with each independent risk factor group. The age and stage subtypes were analyzed in TCGA cohort (A–D), and the age, T and N were analyzed in GSE84437 cohort (E–J). P-value was calculated by log-rank test.
To create a clinically quantitative tool for predicting the OS in GC patients, a nomogram model using age, stage, and risk scores (based on the nine m6A “eraser”-related genes) was established in the TCGA dataset, and tested in the GSE84437 dataset (Figure 5). The calibration curves showed perfect observed and predicted ratios of 3-year and 5-year OS in the TCGA cohort (Supplementary Figures 3A, B). The nomogram DCA curves showed that if the threshold probability of 3-year and 5-year OS was more than 0.11 and 0.22 respectively, the use of nomogram could offer a higher net benefit than treating all patients or treating no patients (Supplementary Figures 3C, D). These data suggest that the nomogram model had a strong ability and accuracy in predicting the OS in GC patients.
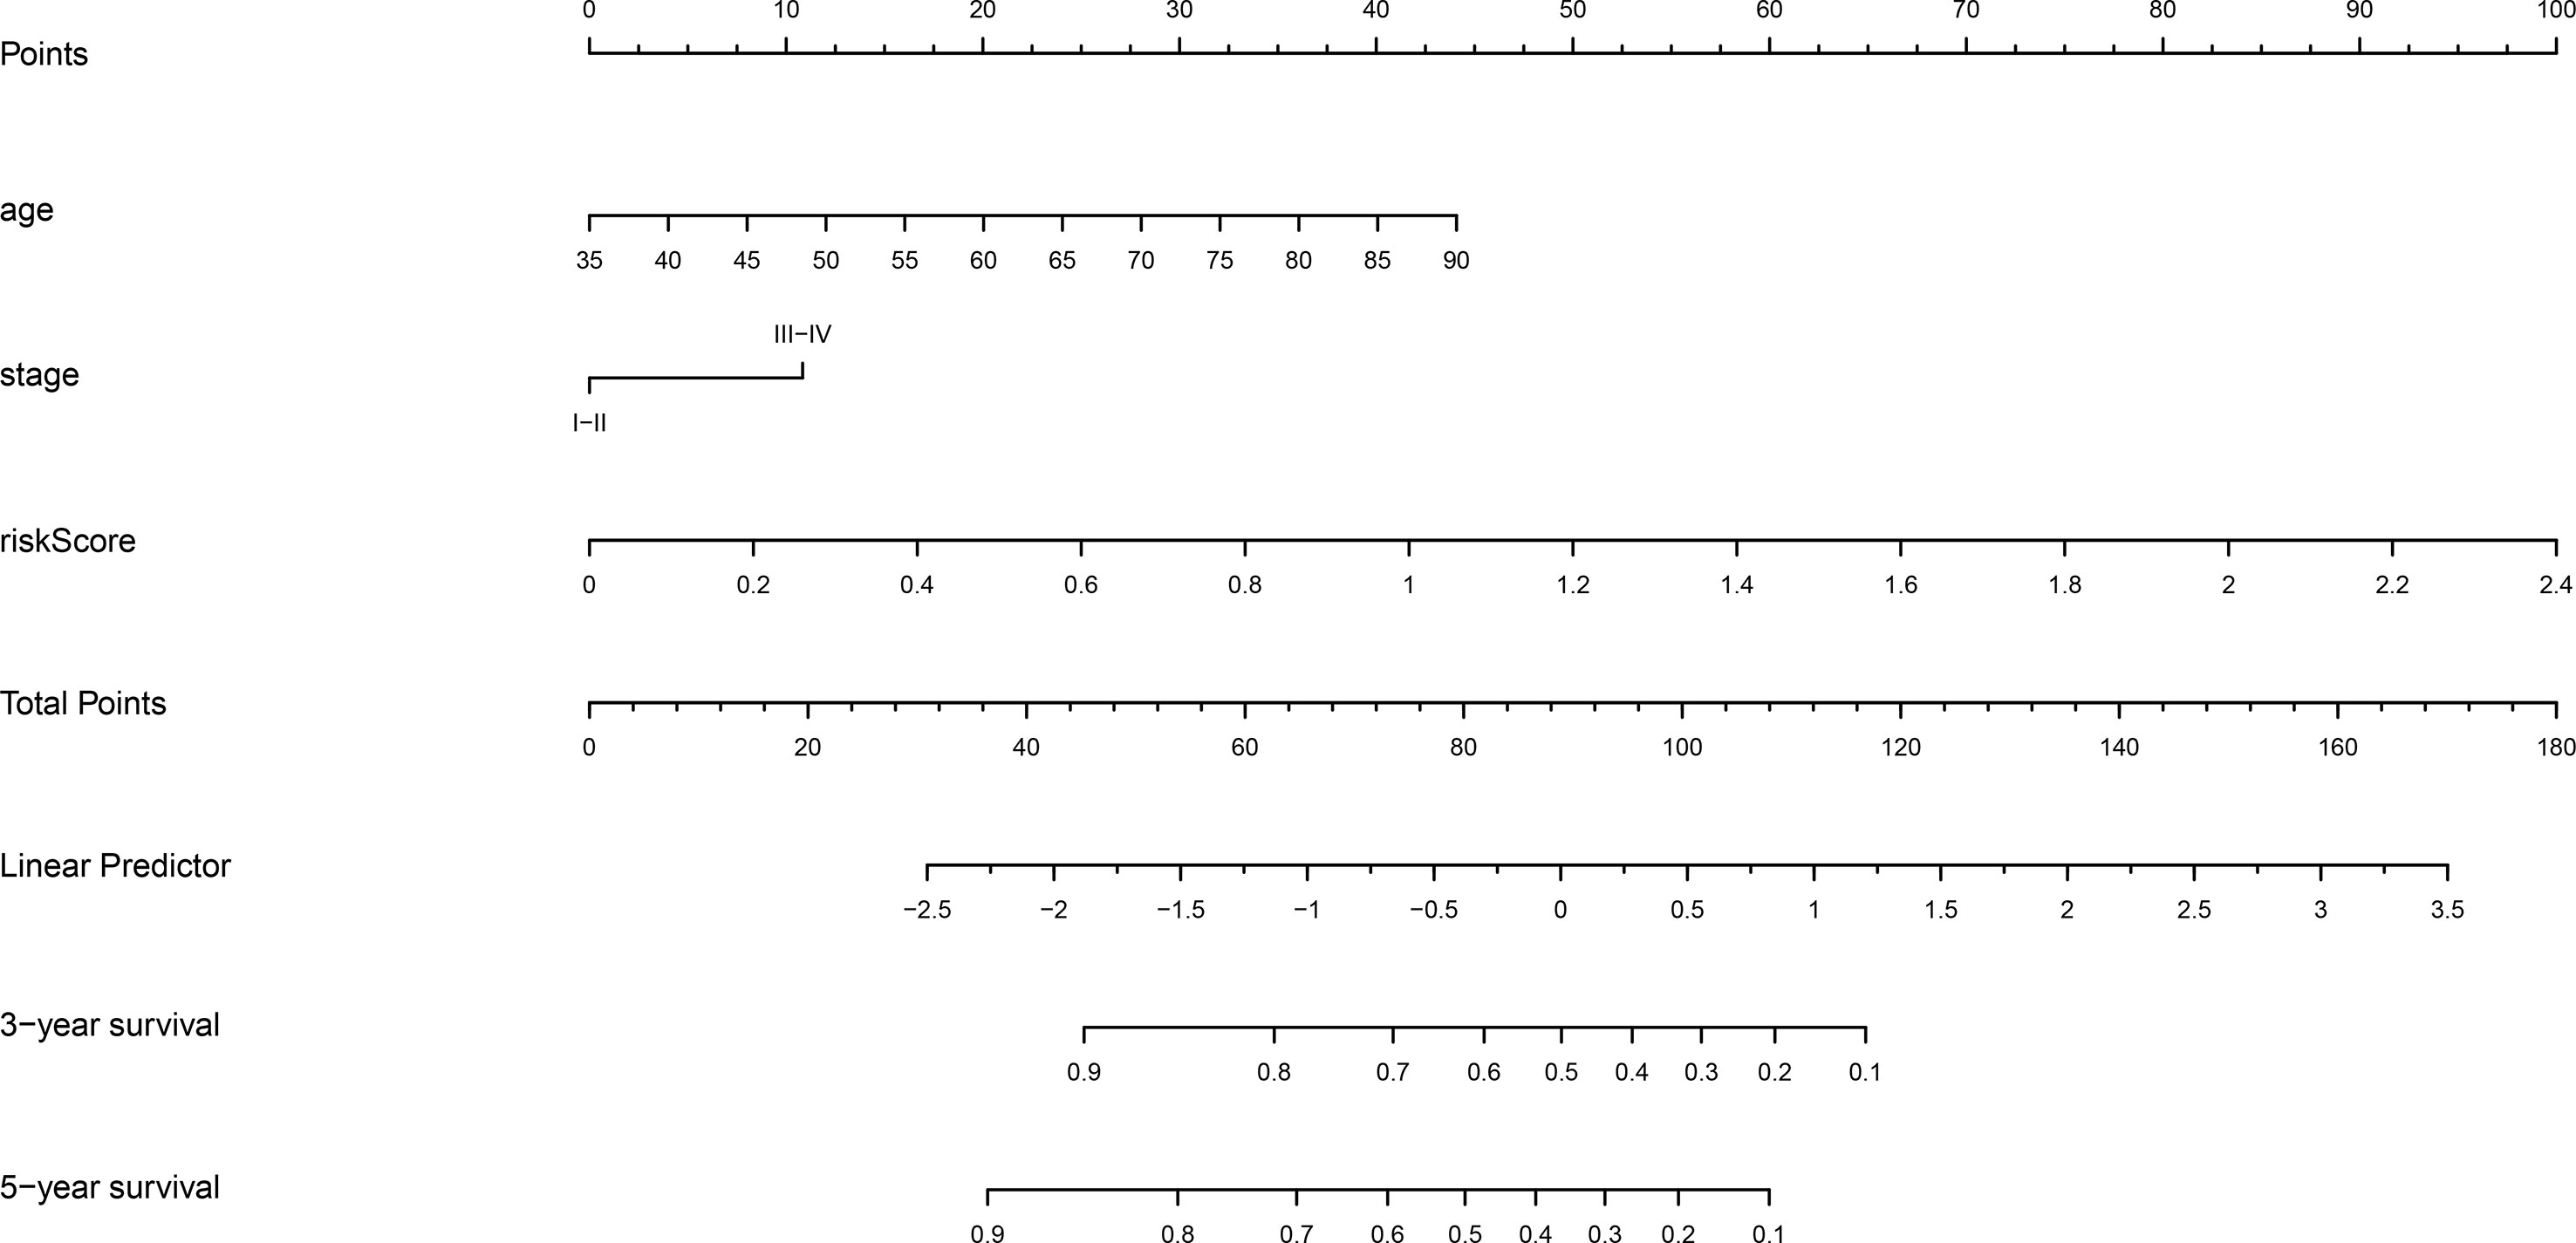
Figure 5 Nomogram prediction of 3-year and 5-year OS probability in gastric cancer. The nomogram model was constructed in the TCGA dataset, with age, stage, and risk score of nine m6A “eraser” related risk genes.
To explore the potential roles of m6A “eraser” in GC, the GO and KEGG analyses were performed based on 297 common differentially expressed genes. The GO analyses showed that the functions of m6A “eraser” mainly focused on regulating tumor malignant biological behavior, including regulation of mRNA metabolic process, autophagy, cell growth, cell cycle arrest, platelet aggregation, and so on (Figure 6A), and the enriched items listed have played an important role in the progression of cancer. The KEGG analyses were primarily enriched in several cancer-associated pathways, such as Wnt signaling pathway, TGF-β signaling pathway, ECM-receptor interaction, and cGMP-PKG signaling pathway (Figure 6B).
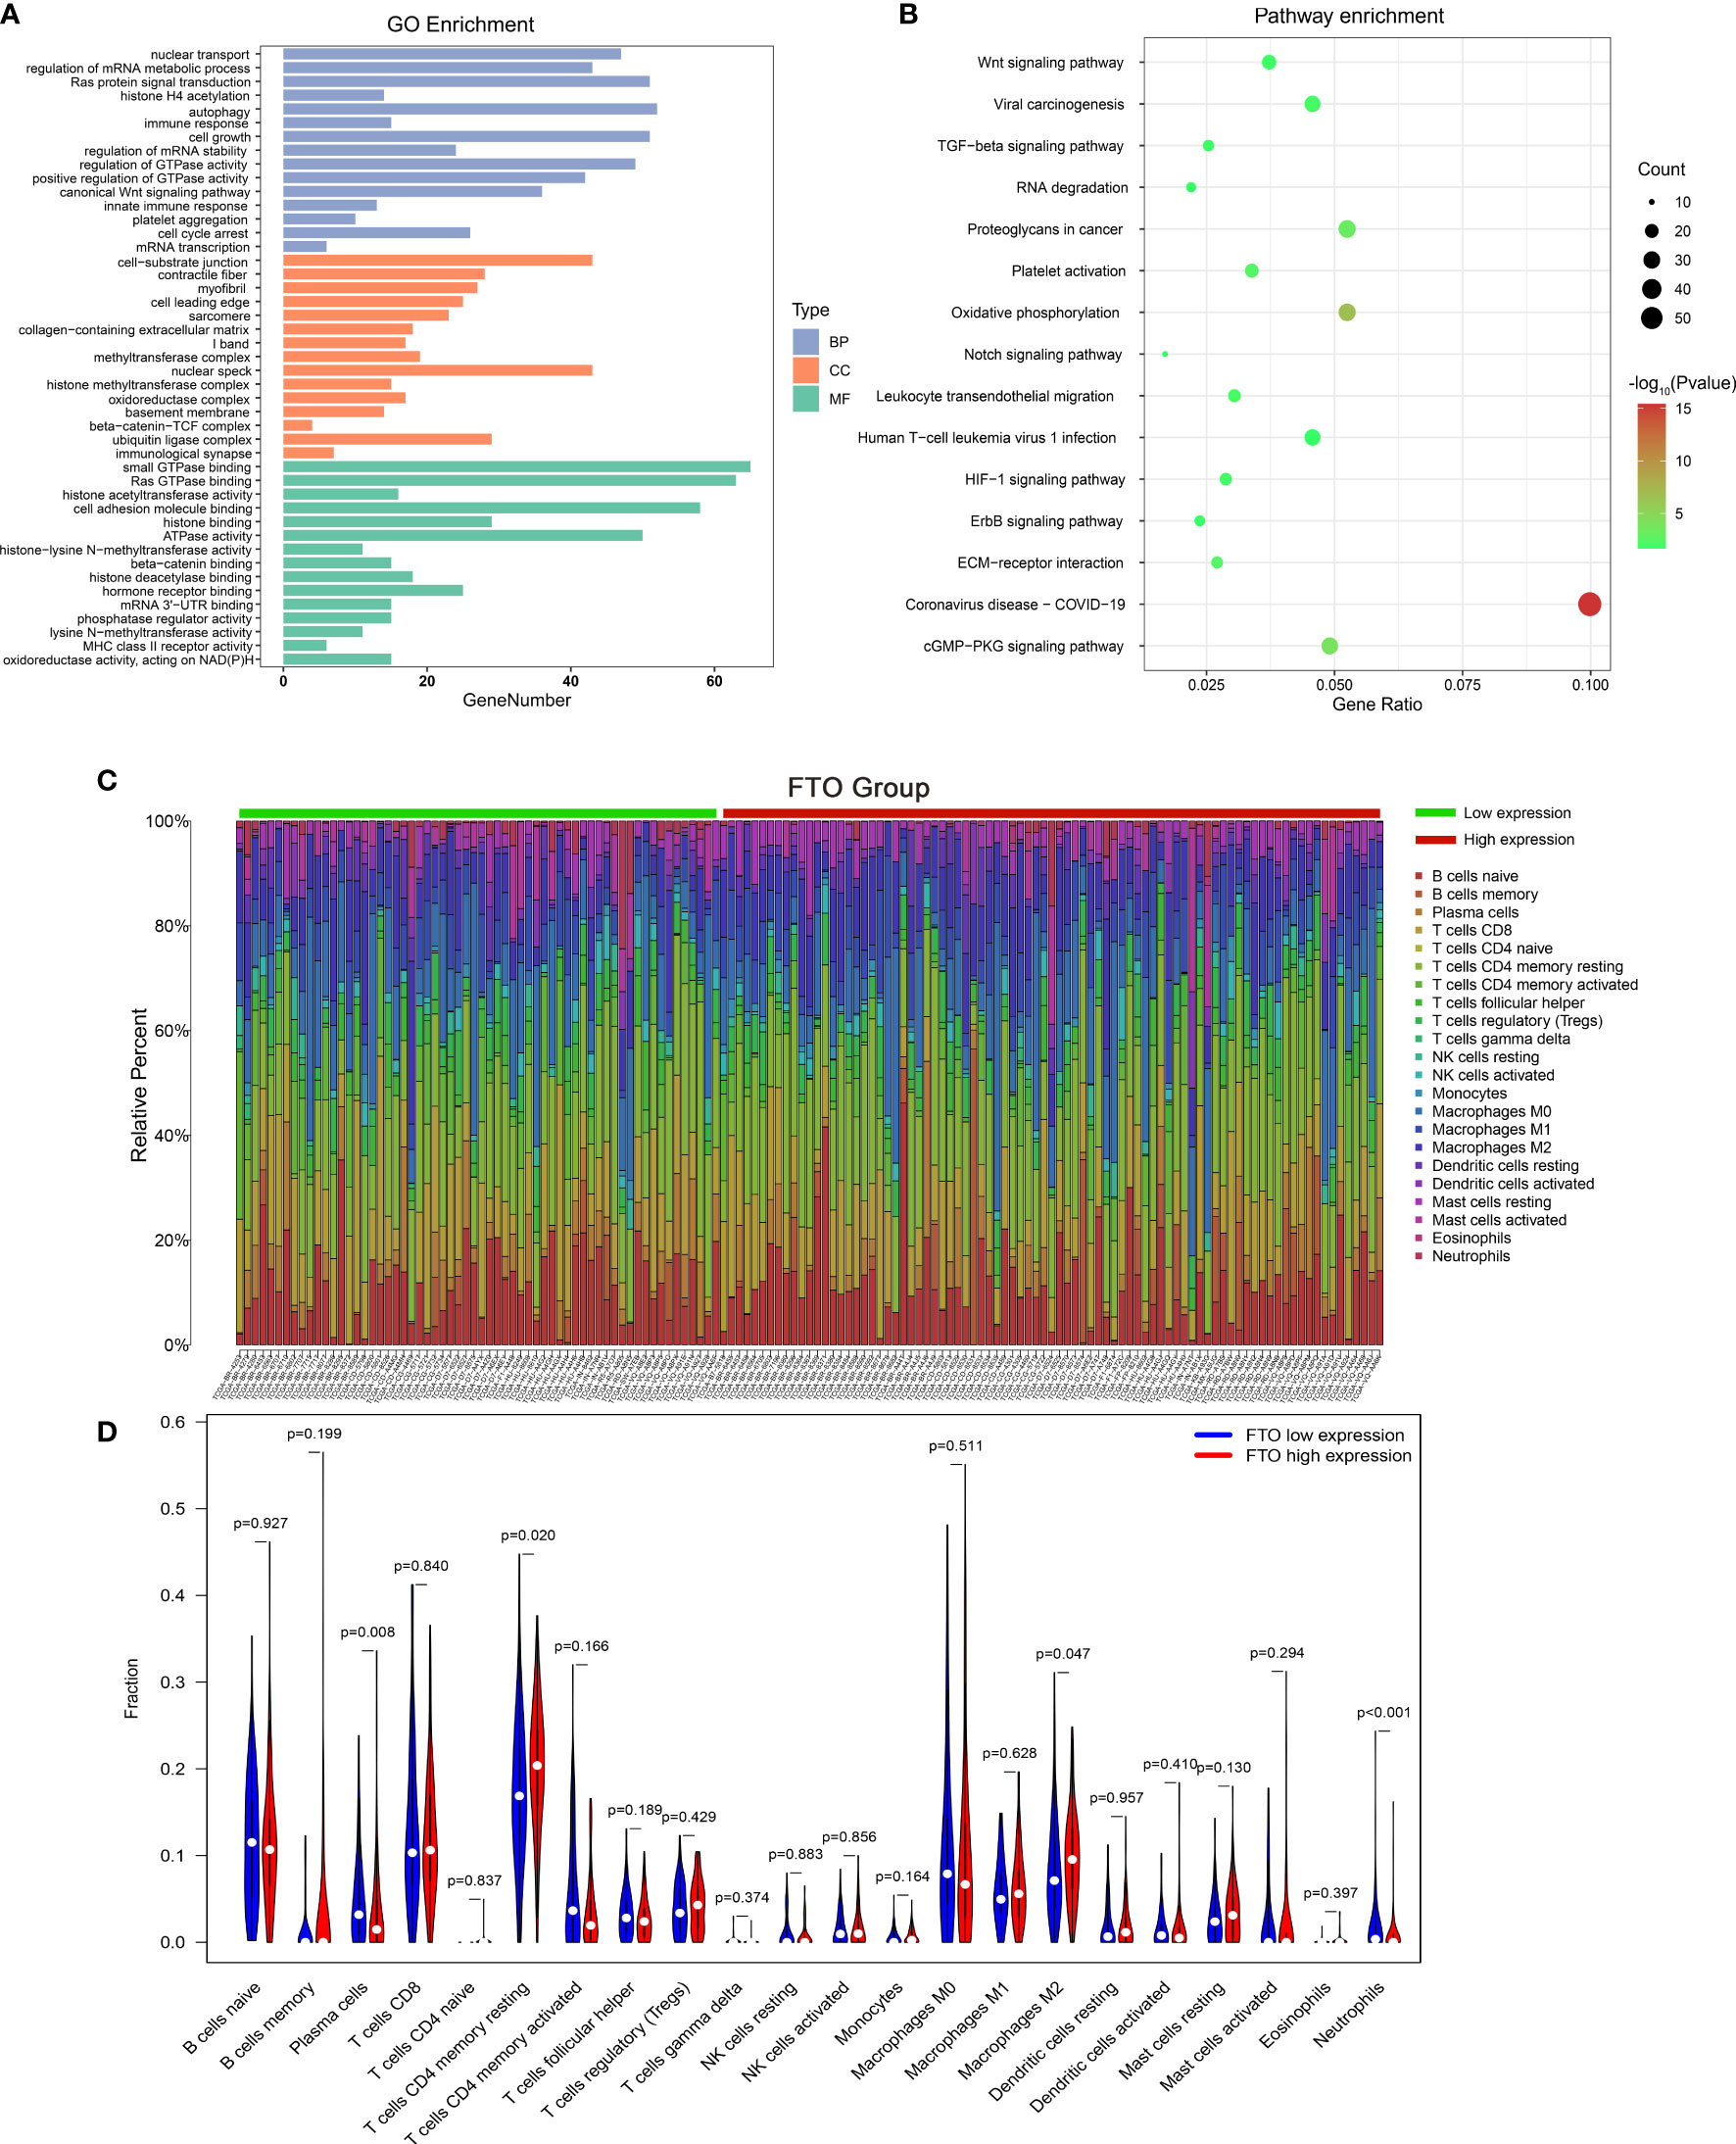
Figure 6 The potential role and function of m6A “eraser,” and the effect of FTO expression level on gastric cancer immune cells. The functional annotation of differential expression of m6A “eraser” related genes using GO (A) and KEGG pathway (B) analysis. (C) The proportion of immune cell subsets in the FTO high expression group and low expression group were analyzed in TCGA dataset. (D) The violin map showed statistical differences between the immune cells of different FTO expression groups.
Interestingly, in go enrichment analysis, we found that the function of m6A eraser is not only related to tumor progression, but also related to some human immune functions, such as, immune response, innate immune response, MHC class II receptor activity (Figure 6A). Therefore, we were curious to know whether the expression of the m6A “eraser” in GC was associated with immune cell infiltration, relevant studies based on TCGA datasets were conducted. Finally, among the 22 immune cell genotypes found, the high expression of FTO showed a positive correlation with the expression of T cells CD4 memory resting and macrophages M2, and showed a negative correlation with the expression of neutrophils (Figures 6C, D). The high expression of ALKBH5 was positively correlated with the expression of T cells CD4 memory resting and negatively correlated with that of dendritic cells resting and neutrophils (Supplementary Figures 4A, B). These results indicated that the immune microenvironment of tumor cells changes with changing expressions of FTO and ALKBH5 in GC patients.
In this study, a new prognostic tool based on the expression profile of 9 m6A “eraser” related risk genes has been established to predict the OS in GC patients. We discovered that the patients in high-risk group had a significantly decreased OS when compared to those in low-risk group. Multivariate Cox regression analysis revealed that the nine m6A “eraser” related risk genes were seemed to be independent risk factors for predicting OS in GC patients. Then, a nomogram model for GC based on m6A “eraser” related risk genes and other independent risk clinical characteristics was built to accurately predict 3- and 5-year OS. Functional enrichment analysis suggested that two m6A “eraser” genes were involved in the occurrence and progression of GC and could play a role by activating the classical tumor signaling pathways. In addition, FTO and ALKBH5 could also alter the immune microenvironment of GC tumor cells.
As GC is the second most common cause of cancer-related deaths around the world, the treatment of GC in every single patient results in different outcome. Thus, it is critical to find a prognostic factor for GC. Previous studies have reported that low-m6A signatures might predict adverse clinicopathological characteristics of GC (19). The m6A “eraser” provided a survival benefit in patients who were classified into the low-risk group. The use of m6A “eraser” based risk gene combinations assists in better identifying patient outcomes, which might in turn provide more powerful support for the development of treatment plans.
In addition, nine m6A “eraser” related risk genes screened from high-dimensional gene expression data by LASSO-Cox provides high prediction accuracy for prognosis and low correlation between the data, which can prevent overfitting, while some prediction tools select genes without the dimension of reduction, which might lead to overfitting (20, 21).
In previous studies, the m6A modification has been proved to play a critical role in GC (7, 13, 22, 23). However, most studies focused on the effect of m6A methylated modification rather than m6A demethylase (eraser) modification on GC. Yunshu Su et al. have found that m6A RNA methylation regulators (FTO, ALKBH5) act as independent prognostic markers and predictors of GC (13). Although it has been reported that the expression levels of FTO and ALKBH5 might affect the prognosis of GC patients, how to obtain potential prognosis of GC patients through the expression of m6A “eraser” and its potential role in GC still remains unknown.
In our study, the survival rates of several clinicopathological characteristics were analyzed. The results showed that the high-risk group had a significantly worse prognosis at any age, and the survival rate of patients with stages III and IV and positive lymph node metastasis was lower than that of the low-risk group. These results indicated that the expression of m6A “eraser” related genes assisted in predicting the outcome of GC more accurately.
Furthermore, the potential role of m6A “eraser” in GC via GO and KEGG pathways enrichment analyses was explored. These two analyses obviously revealed that m6A “eraser” is robustly associated with Wnt signaling pathway. Previous study has reported that the Wnt/β-catenin signaling pathway induced epithelial-mesenchymal transition to maintain the integrity of epithelial cells and tight/adherent junctions (24). Meanwhile, overactivation of canonical Wnt pathway has been determined in 30–50% of GC tissues and cell lines (25, 26). Combined with our findings, these results suggested that the m6A “eraser” related genes might affect the GC by regulating the function of cell adhesion via Wnt signaling pathway.
The immune system has been involved in the process of GC. Several studies have determined the characterization of immune microenvironment in GC. Some immune cells, like M2 macrophages, mast cells, monocytes, release spectrum of proinflammatory, angiogenic, lymphangiogenic, and immunomodulatory mediators were shown to play a pro-tumorigenic role (27). At the same time, other immune cells, including M1 macrophages, cytotoxic CD8+ T cells, and NK cells also play an anti-tumorigenic role in GC (27). Our study further explored the relationship between m6A “eraser” and immune cells. The results showed that both high expression FTO and ALKBH5 showed a positive correlation with the number of T cells CD4 memory resting and a negative correlation with the number of neutrophils. Recent studies have reported that resting memory CD4 T cells are closely related with the pathogenesis of various malignant tumors, including GC, and pointed out that they might be affected by the key genes (28). Numerous studies have demonstrated that neutrophils play a key role in various tumors, including the promotion of lymph node metastasis in early GC, and high levels of tumor-associated neutrophils also promote GC progression and are associated with poor clinical prognosis (29). These results suggest that m6A “eraser” might act as a key gene in changing the immune microenvironment by regulating the levels of T cells CD4 memory resting and neutrophils in GC. This might provide a potential target for the future clinical immunotherapy strategy in GC patients.
However, this study has some limitations. Firstly, this is a retrospective study, and selection bias cannot be avoided. Prospective clinical studies in subsequent studies may help to further determine the accuracy of the nomogram model. Secondly, although two sets of data from TCGA and GEO databases for analysis and validation were used, further clinical data from other databases and even in several hospitals is needed to verify the accuracy of the results. Thirdly, we hypothesize that FTO and ALKBH5 serve as “m6A erasers” to regulate gastric cancer. However, this cannot be analyzed only in silico. Their potential functions and effects on immune microenvironment of tumors also should be verified in both in vitro and in vivo experiments. Fourthly, although FTO and ALKBH5 are likely to promote tumors, they also have a lot of irreplaceable functions, including correct splicing of mRNAs, cell cycle and mitosis checkpoint regulation, and thus depletion of these two genes could cause chromosome instability (https://www.pnas.org/content/115/2/E325 and https://pubmed.ncbi.nlm.nih.gov/30719031/). As a result, FTO and ALKBH5 are not likely to become ideal therapy targets. Fortunately, m6A “eraser” related risk genes may be potential alternatives.
In conclusion, our results suggest that the expression of m6A “eraser” related genes is associated with GC prognosis, and thus a nomogram model for predicting the OS was constructed. Also m6A “eraser” could play a potential role in regulating the occurrence and development of GC. In addition, m6A “eraser” led to some immune cell changes in GC patients, which might act as a potential target for immunotherapy of GC.
The datasets presented in this study can be found in online repositories. The names of the repository/repositories and accession number(s) can be found in the article/Supplementary Material.
JY and JL designed the study. XX, EZ, and JZ drafted the manuscript. XX, EZ, JZ, CZ, and YZ collected and performed all data analysis. All authors contributed to the article and approved the submitted version.
This study was funded by the Grant of Clinical Research Promotion Program of Shanghai Ninth People’s Hospital, School of Medical, Shanghai Jiao Tong University (JYLJ201822).
The authors declare that the research was conducted in the absence of any commercial or financial relationships that could be construed as a potential conflict of interest.
The Supplementary Material for this article can be found online at: https://www.frontiersin.org/articles/10.3389/fonc.2021.631803/full#supplementary-material
1. Karimi P, Islami F, Anandasabapathy S, Freedman ND, Kamangar F. Gastric cancer: descriptive epidemiology, risk factors, screening, and prevention. Cancer Epidemiol Biomarkers Prev (2014) 23(5):700–13. doi: 10.1158/1055-9965.Epi-13-1057
2. Bray F, Ren JS, Masuyer E, Ferlay J. Global estimates of cancer prevalence for 27 sites in the adult population in 2008. Int J Cancer (2013) 132(5):1133–45. doi: 10.1002/ijc.27711
3. Soerjomataram I, Lortet-Tieulent J, Parkin DM, Ferlay J, Mathers C, Forman D, et al. Global burden of cancer in 2008: a systematic analysis of disability-adjusted life-years in 12 world regions. Lancet (London England) (2012) 380(9856):1840–50. doi: 10.1016/s0140-6736(12)60919-2
4. Zhao BS, Roundtree IA, He C. Post-transcriptional gene regulation by mRNA modifications. Nat Rev Mol Cell Biol (2017) 18(1):31–42. doi: 10.1038/nrm.2016.132
5. Dai D, Wang H, Zhu L, Jin H, Wang X. N6-methyladenosine links RNA metabolism to cancer progression. Cell Death Dis (2018) 9(2):124. doi: 10.1038/s41419-017-0129-x
6. Zaccara S, Ries RJ, Jaffrey SR. Reading, writing and erasing mRNA methylation. Nat Rev Mol Cell Biol (2019) 20(10):608–24. doi: 10.1038/s41580-019-0168-5
7. Yue B, Song C, Yang L, Cui R, Cheng X, Zhang Z, et al. METTL3-mediated N6-methyladenosine modification is critical for epithelial-mesenchymal transition and metastasis of gastric cancer. Mol Cancer (2019) 18(1):142. doi: 10.1186/s12943-019-1065-4
8. Zheng G, Dahl JA, Niu Y, Fedorcsak P, Huang CM, Li CJ, et al. ALKBH5 is a mammalian RNA demethylase that impacts RNA metabolism and mouse fertility. Mol Cell (2013) 49(1):18–29. doi: 10.1016/j.molcel.2012.10.015
9. Fedeles BI, Singh V, Delaney JC, Li D, Essigmann JM. The AlkB Family of Fe(II)/α-Ketoglutarate-dependent Dioxygenases: Repairing Nucleic Acid Alkylation Damage and Beyond. J Biol Chem (2015) 290(34):20734–42. doi: 10.1074/jbc.R115.656462
10. Zhang S, Zhao BS, Zhou A, Lin K, Zheng S, Lu Z, et al. m(6)A Demethylase ALKBH5 Maintains Tumorigenicity of Glioblastoma Stem-like Cells by Sustaining FOXM1 Expression and Cell Proliferation Program. Cancer Cell (2017) 31(4):591–606.e6. doi: 10.1016/j.ccell.2017.02.013
11. Li J, Han Y, Zhang H, Qian Z, Jia W, Gao Y, et al. The m6A demethylase FTO promotes the growth of lung cancer cells by regulating the m6A level of USP7 mRNA. Biochem Biophys Res Commun (2019) 512(3):479–85. doi: 10.1016/j.bbrc.2019.03.093
12. Zou D, Dong L, Li C, Yin Z, Rao S, Zhou Q. The m(6)A eraser FTO facilitates proliferation and migration of human cervical cancer cells. Cancer Cell Int (2019) 19:321. doi: 10.1186/s12935-019-1045-1
13. Su Y, Huang J, Hu J. m(6)A RNA Methylation Regulators Contribute to Malignant Progression and Have Clinical Prognostic Impact in Gastric Cancer. Front Oncol (2019) 9:1038. doi: 10.3389/fonc.2019.01038
14. Irizarry RA, Hobbs B, Collin F, Beazer-Barclay YD, Antonellis KJ, Scherf U, et al. Exploration, normalization, and summaries of high density oligonucleotide array probe level data. Biostatistics (2003) 4(2):249–64. doi: 10.1093/biostatistics/4.2.249
15. Li W, Li K, Zhao L, Zou H. Bioinformatics analysis reveals disturbance mechanism of MAPK signaling pathway and cell cycle in Glioblastoma multiforme. Gene (2014) 547(2):346–50. doi: 10.1016/j.gene.2014.06.042
16. Garcia-Laencina PJ, Abreu PH, Abreu MH, Afonoso N. Missing data imputation on the 5-year survival prediction of breast cancer patients with unknown discrete values. Comput Biol Med (2015) 59:125–33. doi: 10.1016/j.compbiomed.2015.02.006
17. Pan YB, Zhu Y, Zhang QW, Zhang CH, Shao A, Zhang J. Prognostic and Predictive Value of a Long Non-coding RNA Signature in Glioma: A lncRNA Expression Analysis. Front Oncol (2020) 10:1057. doi: 10.3389/fonc.2020.01057
18. Vickers AJ, Cronin AM, Elkin EB, Gonen M. Extensions to decision curve analysis, a novel method for evaluating diagnostic tests, prediction models and molecular markers. BMC Med Inform Decis Mak (2008) 8:53. doi: 10.1186/1472-6947-8-53
19. Zhang C, Zhang M, Ge S, Huang W, Lin X, Gao J, et al. Reduced m6A modification predicts malignant phenotypes and augmented Wnt/PI3K-Akt signaling in gastric cancer. Cancer Med (2019) 8(10):4766–81. doi: 10.1002/cam4.2360
20. Chen G, Cao Y, Zhang L, Ma H, Shen C, Zhao J. Analysis of long non-coding RNA expression profiles identifies novel lncRNA biomarkers in the tumorigenesis and malignant progression of gliomas. Oncotarget (2017) 8(40):67744–53. doi: 10.18632/oncotarget.18832
21. Wang W, Yang F, Zhang L, Chen J, Zhao Z, Wang H, et al. LncRNA profile study reveals four-lncRNA signature associated with the prognosis of patients with anaplastic gliomas. Oncotarget (2016) 7(47):77225–36. doi: 10.18632/oncotarget.12624
22. Zhang J, Guo S, Piao HY, Wang Y, Wu Y, Meng XY, et al. ALKBH5 promotes invasion and metastasis of gastric cancer by decreasing methylation of the lncRNA NEAT1. J Physiol Biochem (2019) 75(3):379–89. doi: 10.1007/s13105-019-00690-8
23. Zhang B, Wu Q, Li B, Wang D, Wang L, Zhou YL. m(6)A regulator-mediated methylation modification patterns and tumor microenvironment infiltration characterization in gastric cancer. Mol Cancer (2020) 19(1):53. doi: 10.1186/s12943-020-01170-0
24. Heuberger J, Birchmeier W. Interplay of cadherin-mediated cell adhesion and canonical Wnt signaling. Cold Spring Harb Perspect Biol (2010) 2(2):a002915. doi: 10.1101/cshperspect.a002915
25. Clements WM, Wang J, Sarnaik A, Kim OJ, MacDonald J, Fenoglio-Preiser C, et al. beta-Catenin mutation is a frequent cause of Wnt pathway activation in gastric cancer. Cancer Res (2002) 62(12):3503–6.
26. Ooi CH, Ivanova T, Wu J, Lee M, Tan IB, Tao J, et al. Oncogenic pathway combinations predict clinical prognosis in gastric cancer. PLoS Genet (2009) 5(10):e1000676. doi: 10.1371/journal.pgen.1000676
27. Sammarco G, Varricchi G, Ferraro V, Ammendola M, De Fazio M, Altomare DF, et al. Mast Cells, Angiogenesis and Lymphangiogenesis in Human Gastric Cancer. Int J Mol Sci (2019) 20(9):2106. doi: 10.3390/ijms20092106
28. Chen J, Chen JG, Sun B, Wu JH, Du CY. Integrative analysis of immune microenvironment-related CeRNA regulatory axis in gastric cancer. Math Biosci Eng (2020) 17(4):3953–71. doi: 10.3934/mbe.2020219
Keywords: gastric cancer, FTO, ALKBH5, prognosis, immune infiltrating cells
Citation: Xu X, Zhou E, Zheng J, Zhang C, Zou Y, Lin J and Yu J (2021) Prognostic and Predictive Value of m6A “Eraser” Related Gene Signature in Gastric Cancer. Front. Oncol. 11:631803. doi: 10.3389/fonc.2021.631803
Received: 23 November 2020; Accepted: 28 January 2021;
Published: 26 February 2021.
Edited by:
Dawit Kidane, University of Texas at Austin, United StatesReviewed by:
Alireza G. Senejani, University of New Haven, United StatesCopyright © 2021 Xu, Zhou, Zheng, Zhang, Zou, Lin and Yu. This is an open-access article distributed under the terms of the Creative Commons Attribution License (CC BY). The use, distribution or reproduction in other forums is permitted, provided the original author(s) and the copyright owner(s) are credited and that the original publication in this journal is cited, in accordance with accepted academic practice. No use, distribution or reproduction is permitted which does not comply with these terms.
*Correspondence: Jiwei Yu, amVubmlmZXJ5dTkxOUAxMjYuY29t; Jiayun Lin, bGluX2ppYXl1bkBvdXRsb29rLmNvbQ==
†These authors have contributed equally to this work
Disclaimer: All claims expressed in this article are solely those of the authors and do not necessarily represent those of their affiliated organizations, or those of the publisher, the editors and the reviewers. Any product that may be evaluated in this article or claim that may be made by its manufacturer is not guaranteed or endorsed by the publisher.
Research integrity at Frontiers
Learn more about the work of our research integrity team to safeguard the quality of each article we publish.