
95% of researchers rate our articles as excellent or good
Learn more about the work of our research integrity team to safeguard the quality of each article we publish.
Find out more
ORIGINAL RESEARCH article
Front. Oncol. , 14 April 2021
Sec. Gastrointestinal Cancers
Volume 11 - 2021 | https://doi.org/10.3389/fonc.2021.626620
This article is part of the Research Topic Influence of Molecular Mechanisms in the Progression of Colorectal Cancer View all 6 articles
 Qiankun Li1†Wenjing Yue1†Ming Li1Zhipeng Jiang2Zehui Hou2Wei Liu2Ning Ma2Wenchang Gan2Yingru Li2Taicheng Zhou2Wenjing Yue1*
 Shuang Chen2*
Background: Colorectal cancer (CRC), the most commonly diagnosed cancer in the world, has a high mortality rate. In recent decades, long non-coding RNAs (lncRNAs) have been proven to exert an important effect on CRC growth. However, the CTBP1-AS2 expression and function in CRC are largely unknown.
Materials and Methods: The CTBP1-AS2 and miR-93-5p expression in CRC and para-cancerous tissues was detected by reverse transcription-PCR. The expression of CTBP1-AS2, miR-93-5p and the transforming growth factor-beta (TGF-β)/small mothers against decapentaplegic 2/3 (SMAD2/3) pathway was selectively regulated to study the correlation between CTBP1-AS2 expression and prognosis of patients with CRC. CRC cell proliferation, apoptosis, and invasion were measured in vivo and in vitro. In addition, bioinformatics was applied to explore the targeting relationship between CTBP1-AS2 and miR-93-5p. The targeting binding sites between CTBP1-AS2 and miR-93-5p, as well as between miR-93-5p and TGF-β, were verified by the dual-luciferase reporter assay and the RNA immunoprecipitation experiment.
Results: Compared with normal para-cancerous tissues, CTBP1-AS2 was considerably overexpressed in CRC tissues and was closely associated with worse survival of patients with CRC. Functionally, gain and loss in experiments illustrated that CTBP1-AS2 accelerated CRC cell proliferation and invasion and inhibited cell apoptosis. Mechanistically, CTBP1-AS2 regulated the malignant phenotype of tumor cells through the TGF-β/SMAD2/3 pathway. Moreover, miR-93-5p, as an endogenous competitive RNA of CTBP1-AS2, attenuated the oncogenic effects mediated by CTBP1-AS2.
Conclusion: CTBP1-AS2 promotes the TGF-β/SMAD2/3 pathway activation by inhibiting miR-93-5p, thereby accelerating CRC development.
Worldwide, colorectal cancer (CRC) is the third most prevalent malignant tumor in both men and women and is the third most common factor for tumor-related deaths (1). With the continuous progress of hospital diagnosis and treatment, the 5-year survival period of patients with CRC is extending (2). However, early diagnosis is difficult due to its occult onset. Therefore, it is crucial to explore the early molecular diagnostic indicators of CRC.
Long non-coding RNAs (lncRNAs) are >200 nucleotides in length. Functionally, lncRNAs affect gene expression through various mechanisms such as silencing X chromosome, chromatin modification, imprinting genome, transcriptional activation, transcriptional interference, and nuclear transport (3, 4). In particular, a variety of lncRNAs are aberrantly expressed in CRC and modulate its malignant phenotypes. Taking lncRNA GAS8-AS as an example, it was downregulated in CRC, and it inhibited CRC cell proliferation by inhibiting the expression of AFAP1-AS1, another lncRNA with carcinogenic effects (5). In another study, lncRNA NEAT1 indirectly activated the Wnt/β-catenin signaling pathway through DDX5, thereby promoting CRC cell proliferation, migration, and invasion (6). CTBP1-AS2 is 2945 bp long and is located at 4p16.3. Previous studies have stated that CTBP1-AS2 can be used as a diagnostic indicator for type 2 diabetes (7). Besides, CTBP1-AS2 stabilizes toll-like receptor 4 (TLR4) and regulates cardiomyocyte hypertrophy by interacting with FUS RNA binding protein (8). Here, we have testified that CTBP1-AS2 has increased high expression in healthy human tissues (Supplementary Figure 1A), and its expression is upregulated in a variety of tumor tissues. However, its effect on CRC development is limited.
Together with lncRNAs, microRNAs (miRNAs) are a class of small RNAs with 18–24 bp in length. Various studies have discovered that miRNAs regulate tumor growth (9). As a miRNA, miR-93-5p inhibits the Hippo signaling pathway, thus promoting gastric cancer cell process (10), and its knockdown inhibits CRC cell proliferation and metastasis by targeting programmed death ligand 1 (PD-L1) (11). Functionally, miRNAs are competitively inhibited by lncRNAs, on the other hand, it binds to the 3′ untranslated region (3′-UTR) of mRNAs. This lncRNA–miRNA-mRNA network is believed to contribute significantly to the regulation of tumor progression (12).
Here, we detected CTBP1-AS2 expression in CRC tissues. The results revealed that CTBP1-AS2 expression was notably increased in CRC tissues and cells, and it was closely related to the worse survival of patients with CRC. In terms of the functions, CTBP1-AS2 upregulation promoted CRC cell proliferation, invasion, and inhibited cell apoptosis. Besides, CTBP1-AS2 significantly promoted the activation of the transforming growth factor-β (TGF-β)/small mothers against decapentaplegic 2/3 (SMAD2/3) signaling pathway. Furthermore, through bioinformatics analysis, we found that miR-93-5p was a targeted miRNA for CTBP1-AS2 and TGF-β. Therefore, we hypothesized that there was a key regulatory axis in CRC, namely, the CTBP1-AS2-miR-93-5p-TGF-β/SMAD2/3 network.
From July 2014 to March 2015, 50 CRC tumor tissues and their paired healthy tissues were obtained from the Sixth Affiliated Hospital of Sun Yat-sen University. The adjacent healthy tissues were >3 cm away from the tumor edge and were stored in a refrigerator at −80°C, once isolated. All patients received surgical treatment in the Sixth Affiliated Hospital of Sun Yat-sen University and were independently diagnosed as having CRC by two pathologists. None of the selected patients received radiotherapy or chemotherapy before the operation. The general clinical data such as age, sex, height, weight, and tumor characteristics were collected, and the patients' prognosis was followed by telephone. This research was approved by the ethics committee of the Sixth Affiliated Hospital of Sun Yat-sen University. All patients gave their written informed consent prior to participation.
Human intestinal mucosal normal cell fetal human cell (FHC) and CRC cell lines SW620, HCT116, SW480, T84, Caco-2, and HT29 were purchased from the American Type Collection Center. All of the cells were cultured in the Roswell Park Memorial Institute Medium (RPMI) 1640 medium (Thermo Fisher Scientific, MA, USA), which contained 10% fetal bovine serum (FBS) (Thermo Fisher Scientific, MA, USA) and 1% penicillin/streptomycin (Invitrogen, CA, USA). The medium was placed in an incubator with 5% CO2 at 37°C, and the solution was changed every 2–3 days. During the logarithmic growth period, the cells underwent 0.25% trypsinization (Thermo Fisher HyClone, UT, USA) for subculture.
The pcDNA3.1 empty vector (pcDNA3.1), pcDNA-CTBP1-AS2 (CTBP1-AS2), small interfering RNA negative control (si-NC), siRNA against CTBP1-AS2 (si-CTBP1-AS2), miRNA negative control (miR-NC), and miR-93-5p mimics were purchased from GenePharma Co. Ltd. (Shanghai, China). SW620 and HT29 cells were inoculated in 24-well plates (3 × 10⁵ cells per well), incubated for 24 h at 37°C in an incubator with 5% CO2, and transfected with the above-mentioned vectors using Lipofectamine 3000 (Invitrogen; Thermo Fisher Scientific, Shanghai, China) according to the specifications of the manufacturer. The cells were then cultured for 24 h at 37°C in an incubator with 5% CO2. Finally, the original medium was replaced with a complete fresh medium. After 24 h of culture, the transfection efficiency was detected by reverse transcription (RT)-PCR.
Recombinant human transforming growth factor beta 1 (TGF-β1, catalog no. PRP100188) was purchased from Wuhan AmyJet Scientific Inc. LY2109761 (catalog no s2704) was a new, selective TGF-β receptor type I/II dual inhibitor, and was purchased from Selleck (Shanghai, China). When the cells were in the stable growth stage, TGF-β1 (100 ng/ml) and LY2109761 (5 μM) were adopted to treat the cells for 4 h.
SW620 and HT29 cells in the exponential growth phase were taken and made into a single-cell suspension. After cell counting, cell density was adjusted (1,000 cells per well). They were then inoculated into 96-well plates (six replicates in each group, six plates in total). After 24, 48, and 72 h, we added 90 μl medium and 10 μl cell counting kit-8 (CCK-8) solution to the samples. Meanwhile, a blank control well-containing only medium and the CCK-8 solution was set. After 2 h of incubation, the absorbance (A) value of each well was measured and recorded with a microplate reader at 450 nm wavelength. The measurement was performed every 24 h for 5 days. The A value of the corresponding blank group was subtracted from the A value of each experimental group, and the cell proliferation in each group was calculated according to the standard curve.
The single-cell suspension was prepared from SW620 and HT29 cells and corresponding control cells in the logarithmic growth period. The cell suspension was diluted (50 cells/ml), and 10 ml cell suspensions were evenly inoculated in a 60 mm Petri dish and cultured in an incubator for 2–3 weeks. When the cells in the Petri dish formed visible colonies, we stopped the culture and washed the cells with phosphate-buffered saline (PBS) three times (3 min each time). The fixing solution was removed after 15 min of methanol fixing, and the excess dye solution was washed away after Giemsa staining solution was added for 30 min. Finally, the plate was inverted, and the number of colonies (10 cells/colony) was labeled under the microscope.
The sequences of CTBP1-AS2 and TGF-β1 were amplified and transfected into the downstream luciferase gene of the pMIRGLO plasmid (Promega, Fitchburg, WI, USA) to obtain pMIR-CTBP1-AS2-WT and pMIR-TGF-β1-WT. According to the binding sites between miR-93-5p and CTBP1-AS2 and TGF-β1, the fragments containing the mutant target region were designed as pMIR-CTBP1-AS2-MT and pMIR-TGF-β1-MT. CTBP1-AS2-WT, TGF-β1-WT, CTBP1-AS2-MT, and TGF-β1-MT were co-transfected with miR-NC or miR-93-5p mimics into SW620 cells using Lipofectamine 3000. After 48 h, the dual-luciferase reporter assay system was used to evaluate the luciferase activity.
SW620 cells were cultured in a T75 culture flask. When the cells were in the logarithmic growth stage and reached 80% fusion rate, they were trypsinized and centrifuged. Next, the cells were fully lysed with the complete radioimmunoprecipitation assay (RIPA) lysis buffer (Merck Millipore, MA, USA). After the supplementation of 100 μl cell lysates, the human anti-Ago2 antibody (Merck Millipore, MA, USA) and healthy mouse immunoglobulin G (IgG; Merck Millipore, MA, USA) were incubated overnight with rotation at 4°C. Afterward, RNA was eluted from the beads through 2-h incubation with 400 μl elution buffer. Next, the eluted RNA was precipitated with ethanol and dissolved with RNase-free water. The enrichment of certain fragments was detected by RT-PCR.
SW620 and HT29 cells went through dispersing with 0.25% trypsin, centrifugation, and resuscitation. Transwell chambers (8 μm pore size; Corning, Beijing, China) were coated with BD Matrigel (Shanghai, China) overnight. We placed 5 × 10⁴ cells in the upper chamber and 10% FBS medium in the lower chamber, which was filled with 400 μl RPMI 1640. After 24-h incubation at 37°C, the non-invasive cells were removed from the upper chamber. The Transwell membranes were fixed with 4% paraformaldehyde (10 min) and then stained with 0.5% crystal violet. Then, the cells were counted under an inverted microscope after rinsing under running water. In this research, all the experiments were carried out in triplicate.
After cell treatment, the medium was collected. SW620 and HT29 cells underwent 10-min centrifugation (1,000 rpm). The supernatant was taken, and the contents of TGF-β1 were examined according to the instructions of the manufacturer of the TGF-β1 kit (Abcam, ab100647, Shanghai, China).
Cells were cultured in six-well plates, trypsinized with 0.25% trypsin and centrifuged. Then, total RNA was extracted according to the instructions of the manufacturer of TRIzol reagent (Invitrogen, Shanghai, China), and its concentration and purity were detected by Thermo Fisher Scientific, Waltham, Massachusetts, USA. ReverTra Ace qPCR RT Kit (TOYOBO, Osaka, Japan) was used to reverse transcribe the total RNA into complementary DNA (cDNA). The cDNA obtained was used for RT-PCR using SYBR Green qPCR Master Mix (MedChemExpress, NJ, USA). The reaction conditions were set as follows: pre-denaturation at 95°C for 30 s, denaturation at 95°C for 5 s, and annealing at 60°C for 30 s, with 45 cycles in total. The target genes and endogenous control genes of each sample were amplified. Three duplicate wells were designed for each cell group. Meanwhile, the relative expression of RNA was verified by glyceraldehyde 3-phosphate dehydrogenase (GAPDH) or U6 gene-level correction and analyzed with the 2−ΔΔCT method. The primer sequence was as follows: CTBP1-AS2, forward primer 5′-CGTTCTGATTCCTGGCATGG-3′, reverse primer 5′-TACCTCATCGACGTTCCCAG-3′; miR-93-5p, forward primer 5′- AACAATCAAAGTGCTGTTCGTGC-3′, reverse primer 5′- CAGTGCAGGGTCCGAGGT-3′.
After the treated cells were extracted, RIPA lysis buffer (Applygen Technologies, Beijing, China) was added. Next, the cells were fully lysed on ice and centrifuged at 14,000 rpm for 15 min at 4°C. After the supernatant was collected, the protein concentration was detected using the BCA kit (Thermo Fisher Scientific, Shanghai, China). Then, the protein was isolated by adding sodium dodecyl sulfate-polyacrylamide gel electrophoresis sample loading buffer (5X) (Beyotime, Wuhan, China). The separated proteins were later transferred to the polyvinylidene fluoride membranes. The membranes were sealed with 5% skimmed milk powder (room temperature, 1 h) and incubated with the addition of a primary antibody diluted with 5% skimmed milk, including anti-TGF-β1 antibody (Abcam, ab92486), anti-Smad2 (phospho S467) antibody (Abcam, ab53100), anti-Smad3 (phospho S423+S425) antibody (Abcam, ab52903), anti-Smad2 antibody (Abcam, ab40855), anti-Smad3 antibody (Abcam, ab40854), anticaspase 3 antibody (Proteintech, 19677-1-AP), and anti-Bax antibody (Proteintech, 50599-2-Ig) at 4°C overnight. The next morning, the membranes were rinsed with Tris-buffered saline with Tween 20 (TBST) (three times, 10 min each), coated with horseradish peroxidase-conjugated AffiniPure secondary antibody (2 h, room temperature). Afterward, the membranes were rewashed three times with TBST (10 min each). Then, the BeyoECL Plus Detection Kit (Beyotime, Wuhan, China) was used to expose the membranes, and the strip was displayed on an x-ray film. This study used β-actin as an endogenous control for the protein, and all trials were repeated three times.
A total number of 20 female nude BALB/c mice aged 6 weeks were purchased from the Beijing Vital River Laboratory (Beijing, China). All animal procedures were performed in accordance with the protocols approved by the Animal Care and Use Committees of Yantai Affiliated Hospital of Binzhou Medical University. For the construction of the xenograft model, SW620 cells with stable transfection of CTBP1-AS2 overexpression vector or negative vector were harvested. Then, 1 × 10⁶ SW620 cells were suspended in 0.1 ml PBS and were injected subcutaneously in the right flank of the mice (10 mice per group). Tumor volumes were examined every 7 days when the implantations started to grow bigger. Tumor volumes were calculated by using the equation V (mm3) = A × B2/2, where A is the largest diameter and B is the perpendicular diameter. After 5 weeks of this experiment, the mice were sacrificed to collect the tumor tissues. The tumor tissues were weighed, and the expression of TGF-β1, Ki-67, terminal deoxynucleotidyl transferase-mediated dUTP nick-end labeling (TUNEL) was detected by immunohistochemistry (13) and/or western blotting. Moreover, the lung tissues of each mouse were isolated, and the lung metastasis of tumor cells was evaluated by H&E staining.
The data of this study were shown as mean ± SD using SPSS version 17.0 (SPSS Inc., Chicago, IL, USA) for data difference analysis. One-way ANOVA was performed for intergroup comparison. When the mean value of the groups was different, Student's t-test was employed for pairwise comparison between the groups. The percentage (%) or statistical data were compared using the χ2 analysis. Pearson's linear regression was taken to analyze the correlation between CTBP1-AS2 and miR-93-5p in the CRC tissues. The value of p < 0.05 was considered to be statistically significant.
To investigate the effect of CTBP1-AS2 in CRC, RT-PCR was employed to evaluate CRC expression in healthy tissues and para-cancerous tissues from 50 cases. It was found that CTBP1-AS2 was overexpressed in CRC as compared with normal adjacent tissues (Figure 1A). Through the Gene Expression Profiling Interactive Analysis (GEPIA) (http://gepia.cancer-pku.cn/), a newly developed interactive web server for analyzing the RNA-sequencing expression data of 9,736 tumors and 8,587 healthy samples from the The Cancer Genome Atlas and the Genotype Tissue Expression projects (14), we found that CTBP1-AS2 upregulation also occurred in most tumor tissues (Supplementary Figure 1B), including colon adenocarcinoma (COAD) and rectal adenocarcinoma (READ) (Figure 1B). Besides, we also found that CTBP1-AS2 expressions in CRC cancer lines SW620, HCT116, SW480, T84, Caco-2, and HT29 were significantly upregulated compared with normal human intestinal mucosal cells FHC (Figure 1C). Furthermore, we analyzed the correlation between CTBP1-AS2 level and prognosis of patients with CRC. The results revealed that those patients with CRC with higher expression of CTBP1-AS2 not only had a worse overall survival rate (Figure 1D), but also had larger tumor volumes and earlier distant metastasis (Table 1). These results suggest that CTBP1-AS2 can not only be used as a diagnostic indicator for CRC prognosis, but may also be involved in CRC development.
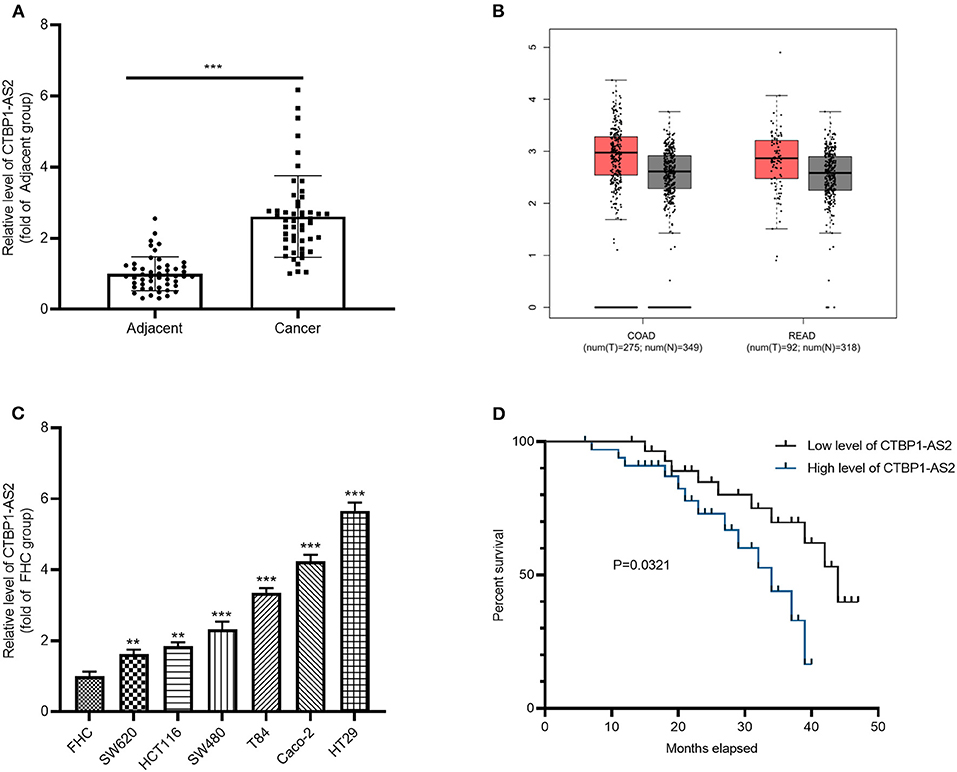
Figure 1. Increased expression of CTBP1-AS2 in CRC tissues and correlation with poorer prognosis in patients with CRC. (A) Use of RT-PCR to measure CTBP1-AS2 expression in 50 CRC tissues and adjacent healthy tissues, ***p < 0.001. (B) Analysis of CTBP1-AS2 expression in COAD and READ tissues by GEPIA. (C) Evaluation of CTBP1-AS2 levels in healthy human intestinal mucosa FHC and CRC cancer cell lines SW620, HCT116, SW480, T84, Caco-2, and HT29 by RT-PCR, **p < 0.01, ***p < 0.001 vs. FHC group. N = 3. (D). Kaplan–Meier analysis of the association between CTBP1-AS2 level and the survival in patients with CRC. CRC, colorectal cancer; COAD, colon adenocarcinoma; FHC, fetal human cell; GEPIA, Gene Expression Profiling Interactive Analysis; READ, rectal adenocarcinoma; RT, reverse transcription.

Table 1. Relationship between CTBP1-AS2 level and clinical characteristics in colorectal cancer.
To further explore the effect of CTBP1-AS2 in CRC growth, we constructed a cell model of CTBP1-AS2 overexpression or knockdown (Figure 2A). CCK-8 and colony formation experiments were used to measure cell proliferation, and the results illustrated that the proliferative ability of SW620 cells with overexpressed CTBP1-AS2 was notably enhanced, while that of CTBP1-AS2 knockdown cells was considerably decreased (Figures 2B,C). Additionally, we applied Western blotting to examine the expression of apoptosis-related proteins caspase 3 and Bax in the tumor cells. The results showed that caspase 3 and Bax expressions were remarkably downregulated after the CTBP1-AS2 overexpression, while CTBP1-AS2 knockdown promoted their expressions (Figure 2D). Furthermore, cell invasion was detected by the Transwell method, and it was found that CTBP1-AS2 overexpression promoted CRC cell invasion, while CTBP1-AS2 knockdown inhibited cell invasion. Thus, CTBP1-AS2 upregulation accelerated CRC growth by promoting cell proliferation and invasion and inhibiting apoptosis.
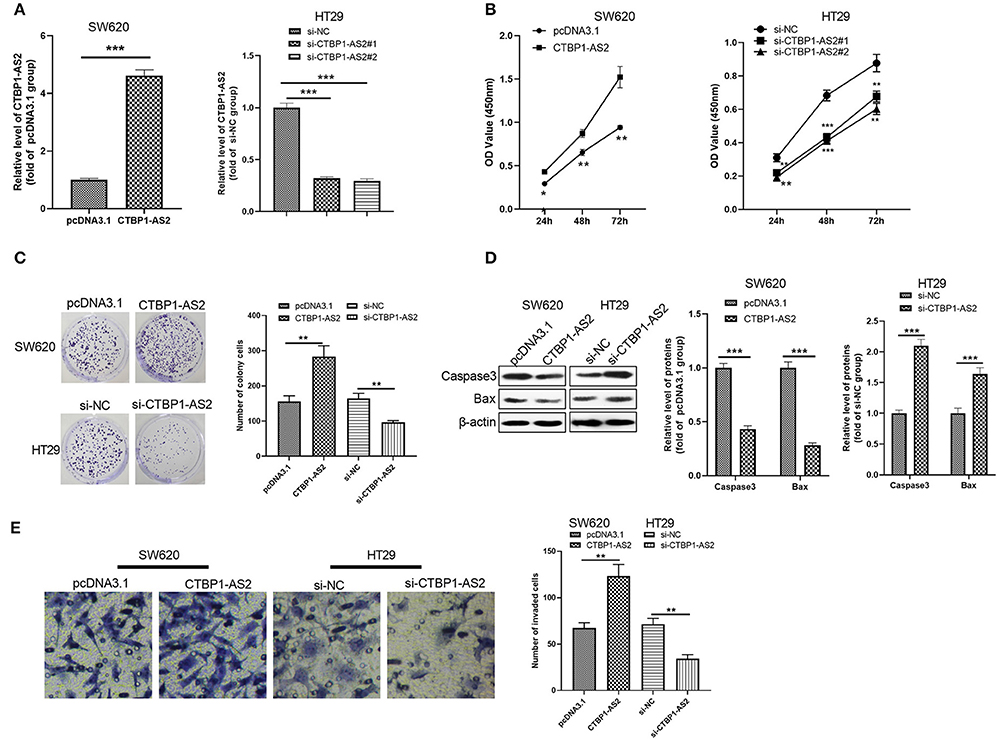
Figure 2. Regulation of CTBP1-AS2 on CRC proliferation, apoptosis, and invasion. (A) SW620 cells transfected with CTBP1-AS2 overexpression plasmids or pcDNA3.1, and HT29 cells transfected with si-CTBP1-AS2 or si-NC. Performing RT-PCT to measure CTBP1-AS2 expression in the two cell lines. (B) Incubation of SW620 and HT29 cells in the 96-well plates for different time points (24, 48, and 72 h). Use of CCK-8 assay to examine cell proliferation with different levels of CTBP1-AS2. *p < 0.05, **p < 0.01, ***p < 0.001 vs. pcDNA3.1 group or si-NC group. (C) Examination of cell proliferation of SW620 and HT29 cells through colony formation experiments. (D) Detection of apoptosis-related proteins caspase-3 and Bax expressions in SW620 and HT29 cells using Western blotting. (E) Use of the Transwell method to measure cell invasion of SW620 and HT29 cells. **p < 0.01, ***p < 0.001. N = 3. CCK-8, cell counting kit-8; CRC, colorectal cancer; RT, reverse transcription; si-NC, small interfering RNA negative control.
Through GEPIA database, we found that in both COAD and READ, CTBP1-AS2 expression level positively correlated with the level of TGF-β1, SMAD2, and SMAD3 (p < 0.01, Figure 3A). In view of this fact, we performed RT-PCR, ELISA, and Western blotting to detect TGF-β1, SMAD2, and SMAD3 levels in overexpressed and low-expressed CTBP1-AS2 cells. It was found that overexpressed CTBP1-AS2 promoted the expressions of TGF-β1, SMAD2, and SMAD3, as well as the phosphorylated levels of SMAD2/3, while CTBP1-AS2 knockdown had the opposite effect (Figures 3B–D). These statistics indicated that the TGF-β1/SMAD2/3 pathway is an important signaling pathway of CTBP1-AS2 downstream.
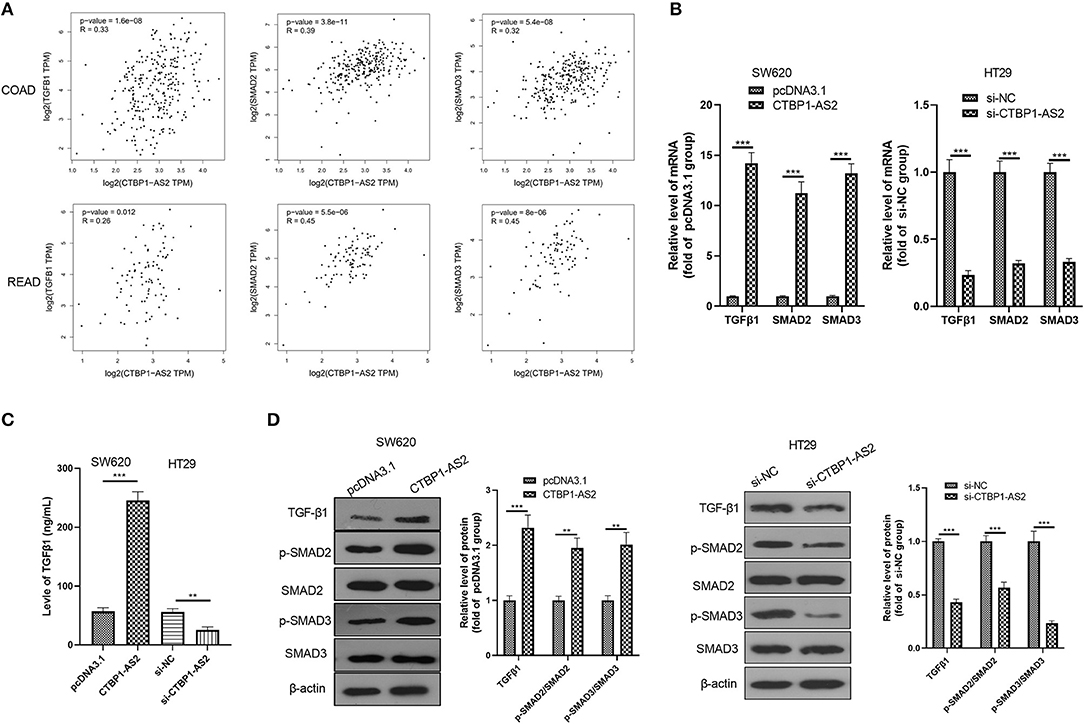
Figure 3. Regulation of CTBP1-AS2 on CRC proliferation, apoptosis, and invasion. (A) SW620 cells transfected with CTBP1-AS2 overexpression plasmids or pcDNA3.1, and HT29 cells transfected with si-CTBP1-AS2 or si-NC. Performing RT-PCT to measure CTBP1-AS2 expression in the two cell lines. (B) Incubation of SW620 and HT29 cells in the 96-well plates for different time points (24, 48, and 72 h). Use of CCK-8 assay to examine cell proliferation with different levels of CTBP1-AS2. *p < 0.05, **p < 0.01, ***p < 0.001 vs. pcDNA3.1 group or si-NC group. (C) Examination of cell proliferation of SW620 and HT29 cells through colony formation experiments. (D) Detection of apoptosis-related proteins caspase-3 and Bax expressions in SW620 and HT29 cells using Western blotting. (E) Use of the Transwell method to measure cell invasion of SW620 and HT29 cells. **p < 0.01, ***p < 0.001. N = 3. CCK-8, cell counting kit-8; CRC, colorectal cancer; RT, reverse transcription; si-NC, small interfering RNA negative control.
Aiming at further exploration on the effect of TGF-β1/SMAD2/3 pathway in the regulation of CTBP1-AS2, we used human recombinant TGF-β1 to activate the TGF-β1/SMAD2/3 pathway and LY2109761 to inhibit the TGF-β1/SMAD2/3 pathway. It was found that LY2109761 inactivated the TGF-β1/SMAD2/3 pathway mediated by CTBP1-AS2, while TGF-β1 treatment enhanced SMAD2/3 phosphorylation (Figure 4A). Then, we examined the CRC cell proliferation, apoptosis, and invasion. The results demonstrated that, compared with the CTBP1-AS2 group, restraining TGF-β1/SMAD2/3 pathway reduced CRC cell proliferation (Figures 4B,C), enhanced the cell apoptosis (Figure 4D), and inhibited the CRC cell invasion (Figure 4E). Compared with the si-CTBP1-AS2 group, the activation of the TGF-β1/SMAD2/3 pathway accelerated CRC cell proliferation (Figures 4B,C) and invasion (Figure 4E), while reducing the cell apoptosis (Figure 4D). Thus, CTBP1-AS2 regulates the CRC cell proliferation, apoptosis, and invasion in a TGF-β1/SMAD2/3-dependent pathway.
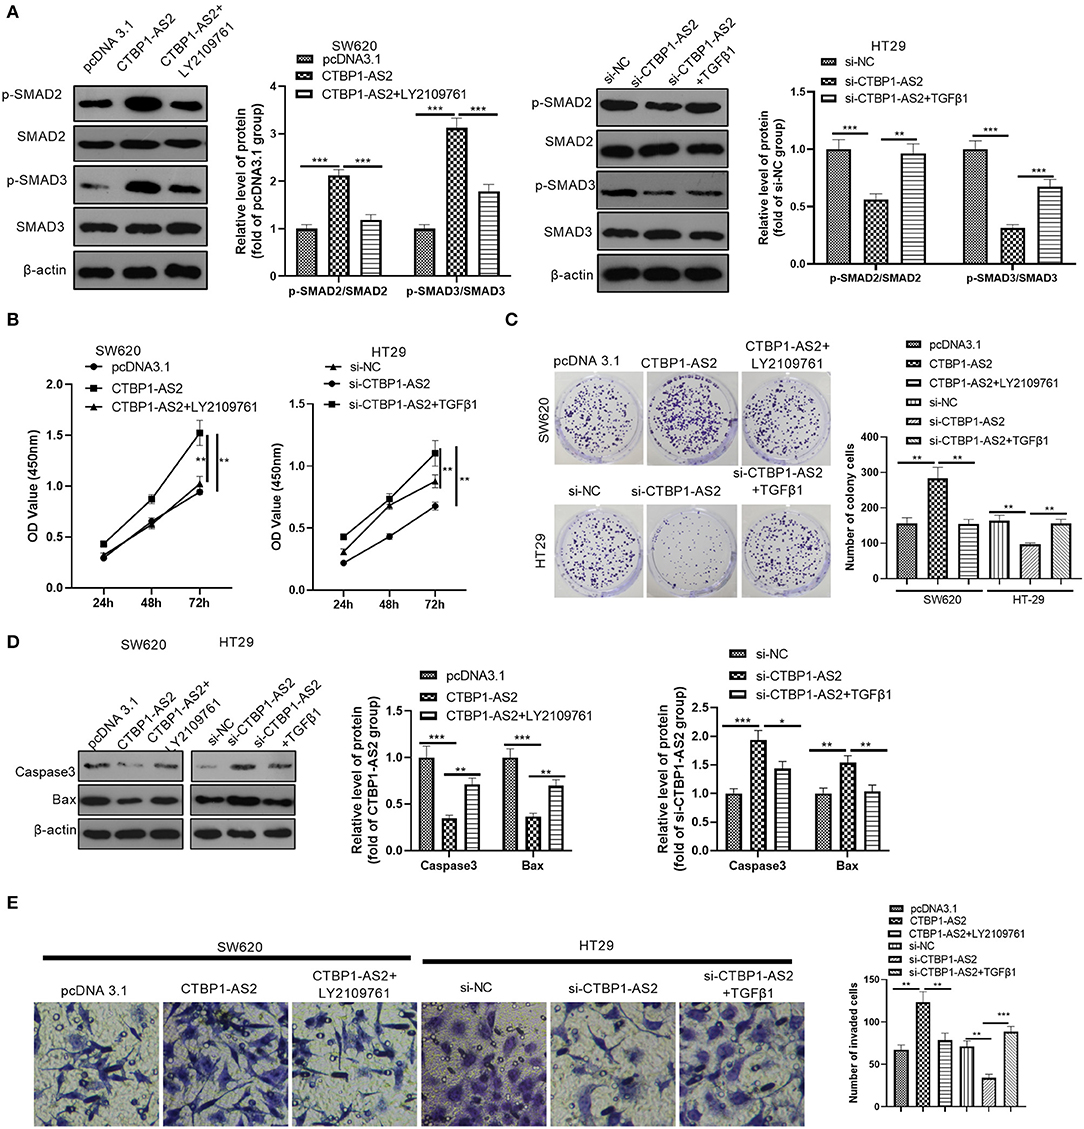
Figure 4. Effect of interference with the TGF-β/SMAD2/3 pathway on CTBP1-AS2 function. (A) Use of human recombinant TGF-β1 (100 ng/ml) to activate the TGF-β/SMAD2/3 pathway in HT29 cells transfected with si-CTBP1-AS2, and LY2109761 (5 μM) to inhibit the TGF-β/SMAD2/3 pathway in SW620 cells transfected with CTBP1-AS2 overexpression plasmids for 4 h. Evaluation of the phosphorylation and total protein levels of SMAD2/3 by Western blotting. (B) Examination of cell proliferation of SW620 and HT29 cells using CCK-8 assay. (C) Detection of cell proliferation of SW620 and HT29 cells using colony formation experiments. (D). Use of Western blotting to measure the expression of apoptosis-related proteins caspase-3 and Bax in tumor cells in SW620 and HT29 cells. (E). Use of the Transwell method to measure cell invasion of SW620 and HT29 cells. *p < 0.05, **p < 0.01, ***p < 0.001. N = 3. Abbreviations: CCK-8, cell counting kit-8; TGF-β/SMAD2/3, transforming growth factor-β/small mothers against decapentaplegic 2/3.
Inspired by the regulatory axis of lncRNA–miRNA–mRNA, we attempted to explore the regulatory molecules between CTBP1-AS2 and TGF-β1. The results demonstrated that 14 miRNAs were the potential targets (Figure 5A). Next, we performed RT-PCR to detect those miRNAs in SW620 cells with upregulated CTBP1-AS2. It was found that miR-93-5p was markedly downregulated in SW620 cells (compared with pcDNA3.1 group) (Figure 5B), suggesting that miR-93-5p is a potentially important target. Through mirPath version 3 (http://snf-515788.vm.okeanos.grnet.gr/index.php?R=mirpath), we found that miR-93-5p participated in the TGF-β signaling pathway and in the progression of CRC (Figure 5C). The binding sites between miR-93-5p and CTBP1-AS2, miR-93-5p, and TGF-β1 are shown in Figure 5D. Then, we detected miR-93-5p expression in CRC tissues, and the statistics showed that it was downregulated compared with healthy adjacent CRC tissues (Figure 5E) and had a negative correlation with CTBP1-AS2 (Figure 5F). In addition, the online databases Starbase and Kaplan–Meier plotter both indicated that lower level of miR-93-5p was associated with worse survival of patients with CRC (p = 0.063) (Supplementary Figures 2A,B). Interestingly, the levels of miR-93-5p and TGF-β1 were significantly negatively correlated in COAD and READ (Supplementary Figures 3A,B). Besides, through the dual-luciferase activity assay, we found that miR-93-5p mimics remarkably inhibited the dual-luciferase activity of SW620 cells transfected with CTBP1-AS2-WT and TGF-β1-WT, but had no significant effect on CTBP1-AS2-MT and TGF-β1-MT (Figures 5G,H). Besides, experimental results regarding RIPA lysis buffer illustrated that, compared with IgG group, the enrichment of CTBP1-AS2, miR-93-5p, and TGF-β1 in Ago2 group increased significantly (Figure 5I). In summary, the data mentioned above indicate that miR-93-5p is a key regulatory molecule intermediate between CTBP1-AS2 and TGF-β1.
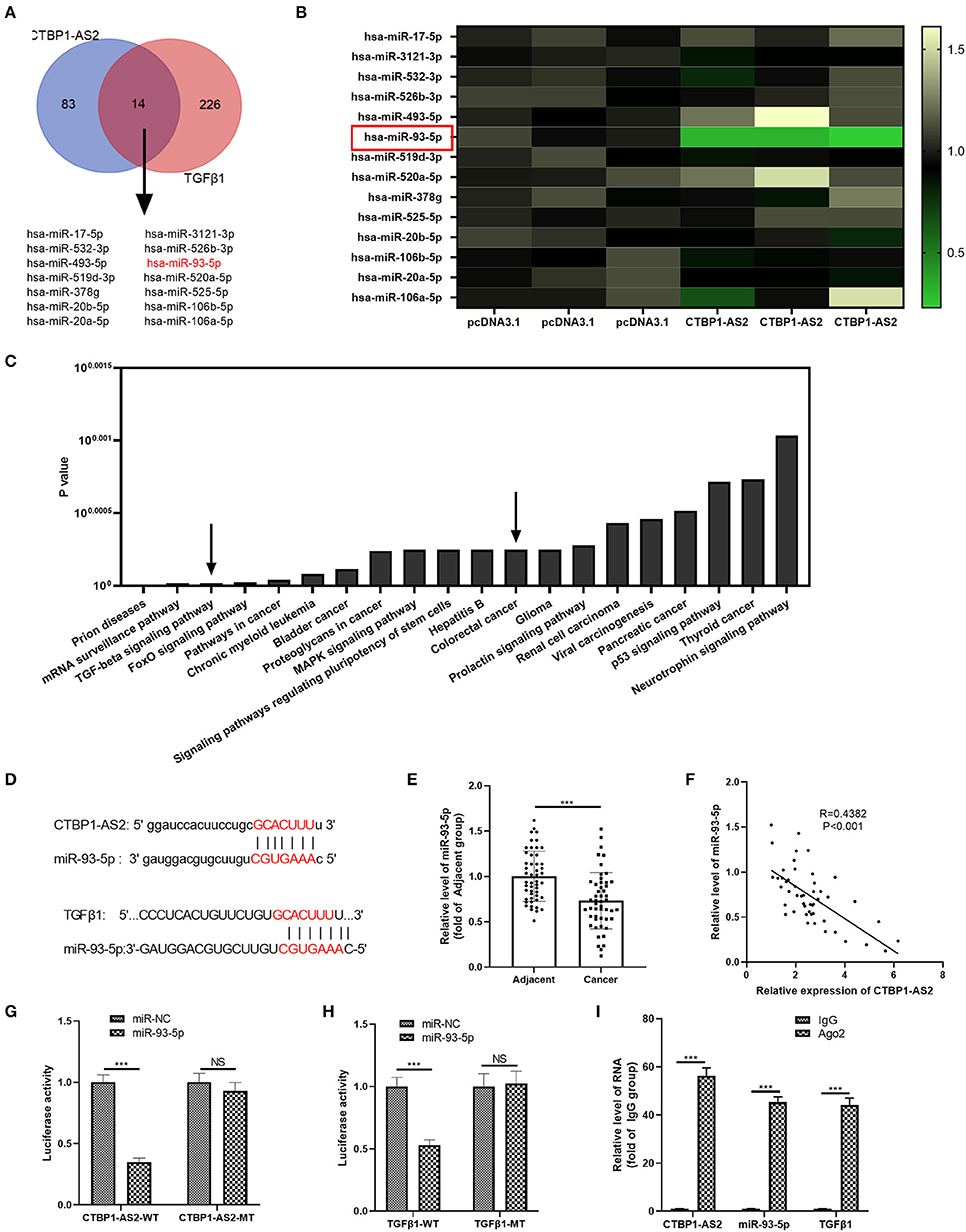
Figure 5. miR-93-5p as a potential target for CTBP1-AS2 and TGF-β1. (A) Prediction of miRNAs targeting CTBP1-AS2 by Starbase (http://starbase.sysu.edu.cn/), prediction of miRNAs targeting TGF-β1 by TargetScan (http://www.targetscan.org/vert_72/), use of Venn diagram to analyze the common miRNA of the two. Fourteen potential miRNAs were found. (B) Detection of the 14 miRNAs in SW620 cells transfected with CTBP1-AS2 or pcDNA3.1 by performing RT-PCR. (C) Analysis of the signal pathways involved in miR-93-5p through mirPath version 3. (D) Base pairing sites of miR-93-5p with CTBP1-AS2 and TGF-βTGF-β1 are shown. (E) Detection of miR-93-5p expression in CRC tissues and the adjacent normal tissues by RT-PCR. (F) Analysis of the correlation between miR-93-5p and CTBP1-AS2 in CRC tissues by Pearson's linear regression. (G,H) Use of dual-luciferase activity experiments to verify the binding relationship of miR-93-5p to CTBP1-AS2 (G) and TGF-β1 (H). (I) Use of RIPA lysis buffer to verify the relationship of miR-93-5p, CTBP1-AS2, and TGF-β1. Performing the RT-PCR to detect the levels of CTBP1-AS2, miR-93-5p, and TGF-β1 in RIPA precipitates. ***p < 0.001. N = 3. CRC, colorectal cancer; miRNA, microRNA; NS, not significant; RIPA, radioimmunoprecipitation assay; RT, reverse transcription; TGF-β, transforming growth factor-β.
Considering the expression characteristics of miR-93-5p and CTBP1-AS2 in CRC, we further constructed an overexpressed miR-93-5p cell model and added overexpressed CTBP1-AS2 plasmids to study the interaction of CTBP1-AS2-miR-93-5p in CRC progression. The results showed that CTBP1-AS2 overexpression notably decreased miR-93-5p expression compared with the miR-93-5p group (Figures 6A,B). Moreover, after miR-93-5p was overexpressed, the TGF-β/SMAD2/3 pathway was significantly inhibited, while supplementation of CTBP1-AS2 upregulated the expression of TGF-β/SMAD2/3 (Figure 6C). Through CCK-8 and Transwell experiments, we discovered that overexpressed miR-93-5p considerably inhibited CRC cell proliferation and invasion, while these effects were reversed by CTBP1-AS2 overexpression (Figures 6D,E). Therefore, the CTBPA-AS2 expression promoted the proliferation and invasion via inhibiting miR-93-5p.
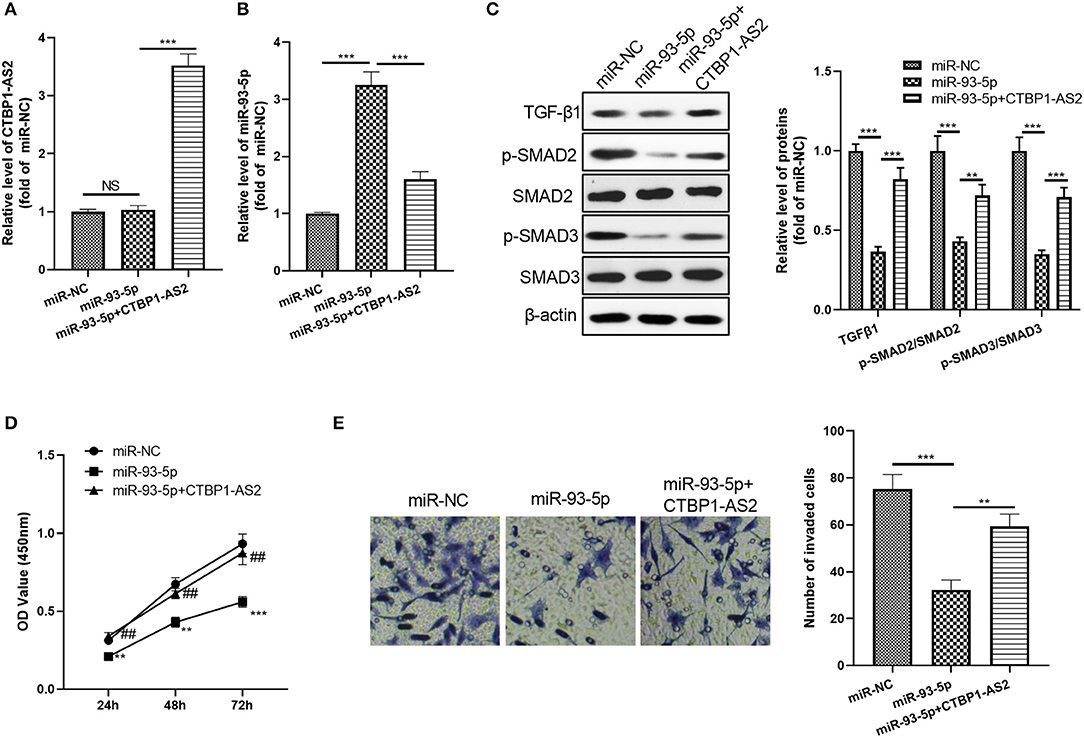
Figure 6. Effect of CTBP1-AS2/miR-93-5p on CRC proliferation and invasion. (A,B) Construction of a cell model of miR-93-5p overexpression in SW620 cells, and adding CTBP1-AS2 overexpression plasmid to investigate the interaction of CTBP1-AS2-miR-93-5p axis in CRC. Use of RT-PCR to measure the levels of CTBP1-AS2 (A) and miR-93-5p (B). (C) Detection of the levels of TGF-β1, SMAD2, and SMAD3 in the cells by using Western blotting. (D) Use of CCK-8 to examine the cell proliferation. **p < 0.01, ***p < 0.001 vs. miR-NC group, ##p <0.01 vs. miR-93-5p group. (E) Use of the Transwell method to detect cell invasion. **p < 0.01, ***p < 0.001. N = 3. CCK-8, cell counting kit-8; CRC, colorectal cancer; NC, negative control; NS, not significant; RT, reverse transcription; TGF-β, transforming growth factor-β.
We explored the effect of CTBP1-AS2 expression on the growth of CRC cells in tumors in vivo. The results represented that the overexpression of CTBP1-AS2 markedly accelerated the growth of SW620 cells (Figures 7A–C). In addition, CTBP1-AS2 upregulation enhanced the lung metastasis of SW620 cells (Figure 7D), increased the rate of Ki-67-positive cells while reducing the rate of TUNEL-positive cells (Figures 7E,F). We also measured TGF-β1 and SMAD2/3 expression in tumor tissues by using immunohistochemistry or Western blotting. The results illustrated that upregulation of CTBP1-AS2 notably promoted TGF-β1 expression and the phosphorylation levels of SMAD2 and SMAD3 (Figures 7G,H). Collectively, in CRC, upregulated CTBP1-AS2 promotes TGF-β expression by inhibiting miR-93-5p. Meanwhile, inside the cells, upregulated TGF-β activates SMAD2/3 to promote CRC cell proliferation and invasion and inhibits cell apoptosis. Furthermore, intracellular TGF-β can also be exocrine to adjacent cells to accelerate its growth and metastasis (Figure 7I).
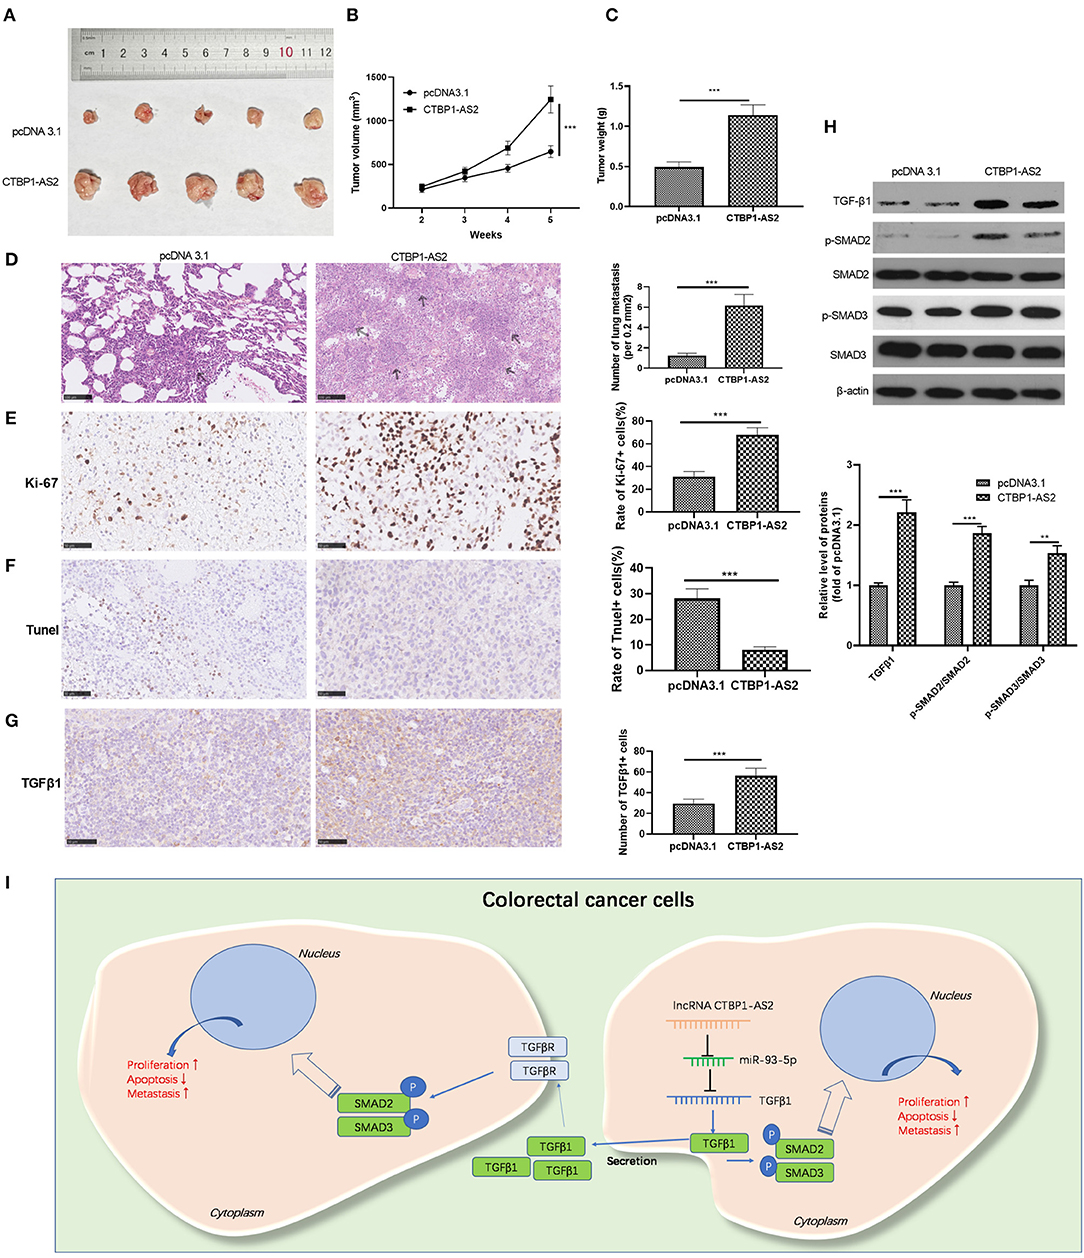
Figure 7. Effect of CTBP1-AS2/miR-93-5p on CRC proliferation and invasion. (A,B) Construction of a cell model of miR-93-5p overexpression in SW620 cells, and adding CTBP1-AS2 overexpression plasmid to investigate the interaction of CTBP1-AS2-miR-93-5p axis in CRC. Use of RT-PCR to measure the levels of CTBP1-AS2 (A) and miR-93-5p (B). (C) Detection of the levels of TGF-β1, SMAD2, and SMAD3 in the cells by using Western blotting. (D) Use of CCK-8 to examine the cell proliferation. **p < 0.01, ***p < 0.001 vs. miR-NC group, ##p <0.01 vs. miR-93-5p group. (E) Use of the Transwell method to detect cell invasion. *p > 0.05, **p < 0.01, ***p < 0.001. N = 3. CCK-8, cell counting kit-8; CRC, colorectal cancer; NC, negative control; NS, not significant; RT, reverse transcription; TGF-β, transforming growth factor-β.
In this study, we investigated the mechanism of CTBP1-AS2 in regulating CRC proliferation and metastasis through in vitro and in vivo experiments. Our results suggested that CTBP1-AS2 can not only be used as a prognostic and diagnostic indicator of CRC, but can also promote CRC development by regulating the miR-93-5p/TGF-β/SMAD2/3 axis (Figure 7I).
In the course of CRC progression, unrestricted proliferation and metastasis are the core factors that contribute to the worse survival of patients with CRC. A variety of clinical drugs exert their effects by inhibiting the proliferation of tumor cells (15, 16). Besides, for patients with CRC with localized lesions, the 5-year survival rate is as high as 90%. However, once local metastasis and distant metastasis of CRC occur, the 5-year survival rate of patients with CRC decreases by 70% and 15–20%, respectively (17). Therefore, it is very important to develop indicators for the early diagnosis of CRC and implement early treatment. In recent decades, accumulating lncRNAs have been found to be abnormally expressed in CRC and can be used as potential therapeutic targets. Taking lncRNA CRNDE as an example, it is upregulated in CRC tissues and promotes the Wnt/β-catenin pathway by inhibiting miR-181a-5p, thus promoting the proliferation and chemotherapeutic resistance of CRC (18). Moreover, lncRNA BANCR upregulation promoted the proliferation, invasion, and adriamycin resistance of CRC (19). As a novel lncRNA, CTBP1-AS2 was found to regulate the ardiomyocyte hypertrophy in previous studies (8). In particular, CTBP1-AS2 is a potential prognostic indicator for papillary thyroid cancer (20). Here, we initially found that high levels of CTBP1-AS2 can be used as a molecular marker for worse survival of patients with CRC, and its overexpression accelerates CRC cell proliferation and invasion and inhibits cell apoptosis. This fact suggests that CTBP1-AS2 has an oncogenic effect in CRC.
In addition to lncRNAs, a variety of miRNAs have also been found to be extensively involved in CRC progression. By regulating the expression of tumor-related genes, miRNA makes a significant contribution to the regulation of cell proliferation, apoptosis, metastasis, stem cell maintenance, angiogenesis, and chemotherapy resistance of CRC. For example, miR-145-5p (21) and miR-873-5p (22) are downregulated in CRC, which can reduce the progress of CRC by inhibiting cell proliferation, invasion, and epithelial–mesenchymal transformation. Similarly, miR-375-3p exerts an antitumor role by enhancing the sensitivity of CRC to 5-fluorouracil by targeting thymidylate synthase (23). In turn, doxorubicin can upregulate PD-L1 by inhibiting miR-140, a tumor suppressor miRNA (24). Besides, miR-25-3p from tumor cell exosomes promotes CRC development by accelerating angiogenesis (25). These studies fully confirm that miRNA functions in CRC growth diversely, both as a carcinogenic and anticancer molecule. In previous studies, miR-93-5p showed a bidirectional effect in CRC progression, either by inhibiting PD-L1 from weakening CRC cell transfer (11) or by inhibiting cyclin-dependent kinase inhibitor 1A from enhancing the multidrug resistance of CRC cells (26). In the present study, we proved that miR-93-5p is a competitive miRNA of CTBP1-AS2 and is limited by the upregulated CTBP1-AS2. Furthermore, in vivo and in vitro experiments confirmed that miR-93-5p upregulation inhibited CRC proliferation and invasion, while the compensation experiments confirmed that CTBP1-AS2 upregulation inhibited miR-93-5p and promoted tumor progression, indicating that miR-93-5p was a negative regulator of CRC progression.
As a classic cytokine, TGF-β plays an essential role in inflammation, tissue repair, and embryonic development by interacting with TGF receptors on the cell surface (27, 28). In recent decades, TGF-β has been proved to have an essential regulatory effect on the growth, differentiation, and immune function of tumor cells. In healthy cells and early cancer cells, TGF-β pathway functions in tumor inhibition, including cell cycle arrest and apoptosis. However, its activation in advanced tumors accelerates tumor development, including metastasis and drug resistance. Therefore, it is an important target for tumor immunotherapy (29, 30). In addition, SMAD2/3, as an intracellular signal transduction molecule in the TGF-β pathway, is phosphorylated after the action of TGF-β, leading to tumor formation (31, 32). Interestingly, miRNA regulates tumor development by regulating the TGF-β pathway. Upregulation of miR-582-3p and miR-582-5p has been found to limit bone metastasis of prostate cancer by inhibiting TGF-β signaling (33). Here, we found that CTBP1-AS2 upregulated the intracellular and extracellular expression of TGF-β1 and its downstream phosphorylation of SMAD2/3. Interference with TGF-β and SMAD2/3 significantly affected CTBP1-AS2-mediated CRC progression. Furthermore, we found that miR-93-5p is a downstream molecule of CTBP1-AS2 and targets the 3′-UTR of TGF-β. Functionally, overexpressed miR-93-5p exerts an anticancer effect by inhibiting the TGF-β/SMAD2/3 pathway.
This study explored the effect of the CTBP1-AS2-miR-93-5p-TGF-β/SMAD2/3 axis in CRC development. Our results indicate that CTBP1-AS2 activates the TGF-β/SMAD2/3 pathway by inhibiting miR-93-5p, resulting in increased CRC cell proliferation and invasion and decreased apoptosis. To sum up, this study provides a new reference for CRC progress. However, the diagnostic value of CTBP1-AS2 in CRC still needs to be verified in more research samples.
The datasets presented in this study can be found in online repositories. The names of the repository/repositories and accession number(s) can be found in the article/Supplementary Material.
The studies involving human participants were reviewed and approved by Ethics Review Board of The Sixth Affiliated Hospital of Sun Yat-sen University. The patients/participants provided their written informed consent to participate in this study. The animal study was reviewed and approved by The Animal Care and Use Committees of Yantai Affiliated Hospital of Binzhou Medical University. Written informed consent was obtained from the individual(s) for the publication of any potentially identifiable images or data included in this article.
QL, WY (2nd author), and SC: conceived and designed the experiments. ZJ and WY (11th author): performed the experiments. YL, TZ, and ML: statistical analysis. ZJ: wrote the paper. All authors read and approved the final manuscript.
The authors declare that the research was conducted in the absence of any commercial or financial relationships that could be construed as a potential conflict of interest.
The Supplementary Material for this article can be found online at: https://www.frontiersin.org/articles/10.3389/fonc.2021.626620/full#supplementary-material
Supplementary Figure 1. (A). CTBP1-AS2 expression in human tissues. (B). CTBP1-AS2 expression in 20 human tumor tissues and adjacent healthy tissues.
Supplementary Figure 2. (A). Relationship between miR-93-5p levels and overall COAD survival. (B). Relationship between miR-93 levels and overall READ survival.
Supplementary Figure 3. (A). Correlation of miR-93-5p levels with TGFβ1 in COAD. (B). Correlation of miR-93-5p levels with TGFβ1 in READ.
1. Siegel RL, Miller KD, Jemal A. Cancer statistics, 2019. CA Cancer J Clin. (2019) 69:7–34. doi: 10.3322/caac.21551
2. Buccafusca G, Proserpio I, Tralongo AC, Rametta Giuliano S, Tralongo P. Early colorectal cancer: diagnosis, treatment and survivorship care. Crit Rev Oncol Hematol. (2019) 136:20–30. doi: 10.1016/j.critrevonc.2019.01.023
3. Peng WX, Koirala P, Mo YY. LncRNA-mediated regulation of cell signaling in cancer. Oncogene. (2017) 36:5661–7. doi: 10.1038/onc.2017.184
4. Dykes IM, Emanueli C. Transcriptional and post-transcriptional gene regulation by long non-coding RNA. Genomics Proteomics Bioinformatics. (2017) 15:177–86. doi: 10.1016/j.gpb.2016.12.005
5. Zhao Y, Chu Y, Sun J, Song R, Li Y, Xu F. LncRNA GAS8-AS inhibits colorectal cancer (CRC) cell proliferation by downregulating lncRNA AFAP1-AS1. Gene. (2019) 710:140–4. doi: 10.1016/j.gene.2019.05.040
6. Zhang M, Weng W, Zhang Q, Wu Y, Ni S, Tan C, et al. The lncRNA NEAT1 activates Wnt/β-catenin signaling and promotes colorectal cancer progression via interacting with DDX5. J Hematol Oncol. (2018) 11:113. doi: 10.1186/s13045-018-0656-7
7. ErfanianOmidvar M, Ghaedi H, Kazerouni F, Kalbasi S, Shanaki M, Miraalamy G, et al. Clinical significance of long noncoding RNA VIM-AS1 and CTBP1-AS2 expression in type 2 diabetes. J Cell Biochem. (2019) 120:9315–23. doi: 10.1002/jcb.28206
8. Luo X, He S, Hu Y, Liu J, Chen X. Sp1-induced LncRNA CTBP1-AS2 is a novel regulator in cardiomyocyte hypertrophy by interacting with FUS to stabilize TLR4. Cardiovasc Pathol. (2019) 42:21–9. doi: 10.1016/j.carpath.2019.04.005
9. Rupaimoole R, Slack FJ. MicroRNA therapeutics: towards a new era for the management of cancer and other diseases. Nat Rev Drug Discov. (2017) 16:203–22. doi: 10.1038/nrd.2016.246
10. Li L, Zhao J, Huang S, Wang Y, Zhu L, Cao Y, et al. MiR-93-5p promotes gastric cancer-cell progression via inactivation of the Hippo signaling pathway. Gene. (2018) 641:240–7. doi: 10.1016/j.gene.2017.09.071
11. Chen YL, Wang GX, Lin BA, Huang JS. MicroRNA-93-5p expression in tumor tissue and its tumor suppressor function via targeting programmed death ligand-1 in colorectal cancer. Cell Biol Int. (2020) 44:1224–36. doi: 10.1002/cbin.11323
12. Liu J, Li H, Zheng B, Sun L, Yuan Y, Xing C. Competitive endogenous RNA (ceRNA) regulation network of lncRNA-miRNA-mRNA in colorectal carcinogenesis. Dig Dis Sci. (2019) 64:1868–77. doi: 10.1007/s10620-019-05506-9
13. Yasukawa M, Fujihara H, Fujimori H, Kawaguchi K, Yamada H, Nakayama R, et al. Synergetic effects of PARP inhibitor AZD2281 and cisplatin in oral squamous cell carcinoma in vitro and in vivo. Int J Mol Sci. (2016) 17:272. doi: 10.3390/ijms17030272
14. Tang Z, Li C, Kang B, Gao G, Li C, Zhang Z. GEPIA: a web server for cancer and normal gene expression profiling and interactive analyses. Nucleic Acids Res. (2017) 45W98–102. doi: 10.1093/nar/gkx247
15. Geng F, Wang Z, Yin H, Yu J, Cao B. Molecular targeted drugs and treatment of colorectal cancer: recent progress and future perspectives. Cancer BiotherRadiopharm. (2017) 32:149–60. doi: 10.1089/cbr.2017.2210
16. Prenen H, Vecchione L, Van Cutsem E. Role of targeted agents in metastatic colorectal cancer. Target Oncol. (2013) 8:83–96. doi: 10.1007/s11523-013-0281-x
17. Alnabulsi A, Murray GI. Proteomics for early detection of colorectal cancer: recent updates. Expert Rev Proteomics. (2018) 15:55–63. doi: 10.1080/14789450.2018.1396893
18. Han P, Li JW, Zhang BM, Lv JC, Li YM, Gu XY, et al. The lncRNA CRNDE promotes colorectal cancer cell proliferation and chemoresistance via miR-181a-5p-mediated regulation of Wnt/β-catenin signaling. Mol Cancer. (2017) 16:9. doi: 10.1186/s12943-017-0583-1
19. Ma S, Yang D, Liu Y, Wang Y, Lin T, Li Y, et al. LncRNA BANCR promotes tumorigenesis and enhances adriamycin resistance in colorectal cancer. Aging (Albany NY). (2018) 10:2062–78. doi: 10.18632/aging.101530
20. Ma B, Liao T, Wen D, Dong C, Zhou L, Yang S, et al. Long intergenic non-coding RNA 271 is predictive of a poorer prognosis of papillary thyroid cancer. Sci Rep. (2016) 6:36973. doi: 10.1038/srep36973
21. Chen Q, Zhou L, Ye X, Tao M, Wu J. miR-145-5p suppresses proliferation, metastasis and EMT of colorectal cancer by targeting CDCA3. Pathol Res Pract. (2020) 4:152872. doi: 10.1016/j.prp.2020.152872
22. Wang L, Jiang F, Ma F, Zhang B. MiR-873-5p suppresses cell proliferation and epithelial-mesenchymal transition via directly targeting Jumonji domain-containing protein 8 through the NF-κB pathway in colorectal cancer. J Cell Commun Signal. (2019) 13:549–60. doi: 10.1007/s12079-019-00522-w
23. Xu F, Ye ML, Zhang YP, Li WJ, Li MT, Wang HZ, et al. MicroRNA-375-3p enhances chemosensitivity to 5-fluorouracil by targeting thymidylate synthase in colorectal cancer. Cancer Sci. (2020) 111:1528–41. doi: 10.1111/cas.14356
24. Naba NM, Tolay N, Erman B, SayiYazgan A. Doxorubicin inhibits miR-140 expression and upregulates PD-L1 expression in HCT116 cells, opposite to its effects on MDA-MB-231 cells. Turk J Biol. (2020) 44:15–23. doi: 10.3906/biy-1909-12
25. Zeng Z, Li Y, Pan Y, Lan X, Song F, Sun J, et al. Cancer-derived exosomal miR-25-3p promotes pre-metastatic niche formation by inducing vascular permeability and angiogenesis. Nat Commun. (2018) 9:5395. doi: 10.1038/s41467-018-07810-w
26. Wang SJ, Cao YF, Yang ZQ, Jian ZY, Cai B, Guo J, et al. MicroRNA-93-5p increases multidrug resistance in human colorectal carcinoma cells by downregulating cyclin dependent kinase inhibitor 1A gene expression. Oncol Lett. (2017) 13:722–30. doi: 10.3892/ol.2016.5463
27. Lodyga M, Hinz B. TGF-β1-A truly transforming growth factor in fibrosis and immunity. Semin Cell Dev Biol. (2019) 101:123–39. doi: 10.1016/j.semcdb.2019.12.010
28. McEntee CP, Gunaltay S, Travis MA. Regulation of barrier immunity and homeostasis by integrin-mediated transforming growth factor β activation. Immunology. (2019) 160:139–48. doi: 10.1111/imm.13162
29. Colak S, Ten Dijke P. Targeting TGF-β signaling in cancer. Trends Cancer. (2017) 3:56–71. doi: 10.1016/j.trecan.2016.11.008
30. Neuzillet C, Tijeras-Raballand A, Cohen R, Cros J, Faivre S, Raymond E, et al. Targeting the TGF-β pathway for cancer therapy. Pharmacol Ther. (2015) 147:22–31. doi: 10.1016/j.pharmthera.2014.11.001
31. Ouanouki A, Lamy S, Annabi B. Anthocyanidins inhibit epithelial-mesenchymal transition through a TGF-β/Smad2 signaling pathway in glioblastoma cells. Mol Carcinog. (2017) 56:1088–99. doi: 10.1002/mc.22575
32. Chen S, Shen J, Zhao J, Wang J, Shan T, Li J, et al. Magnolol suppresses pancreatic cancer development in vivo and in vitro via negatively regulating TGF-β/Smad signaling. Front Oncol. (2020) 10:597672. doi: 10.3389/fonc.2020.597672
Keywords: CRC, progression, CTBP1-AS2, TGF-β/SMAD2/3 pathways, MiR-93-5p
Citation: Li Q, Yue W, Li M, Jiang Z, Hou Z, Liu W, Ma N, Gan W, Li Y, Zhou T, Yue W and Chen S (2021) Downregulating Long Non-coding RNAs CTBP1-AS2 Inhibits Colorectal Cancer Development by Modulating the miR-93-5p/TGF-β/SMAD2/3 Pathway. Front. Oncol. 11:626620. doi: 10.3389/fonc.2021.626620
Received: 06 November 2020; Accepted: 04 February 2021;
Published: 14 April 2021.
Edited by:
Zhaohui Huang, Affiliated Hospital of Jiangnan University, ChinaReviewed by:
Nandita Mishra, Amrita Vishwa Vidyapeetham University, IndiaCopyright © 2021 Li, Yue, Li, Jiang, Hou, Liu, Ma, Gan, Li, Zhou, Yue and Chen. This is an open-access article distributed under the terms of the Creative Commons Attribution License (CC BY). The use, distribution or reproduction in other forums is permitted, provided the original author(s) and the copyright owner(s) are credited and that the original publication in this journal is cited, in accordance with accepted academic practice. No use, distribution or reproduction is permitted which does not comply with these terms.
*Correspondence: Shuang Chen, ZG9jY2hlbnNodWFuZ0AxNjMuY29t; Wenjing Yue, d3VtYWl5YW4xOTg2QDE2My5jb20=
†These authors have contributed equally to this work
Disclaimer: All claims expressed in this article are solely those of the authors and do not necessarily represent those of their affiliated organizations, or those of the publisher, the editors and the reviewers. Any product that may be evaluated in this article or claim that may be made by its manufacturer is not guaranteed or endorsed by the publisher.
Research integrity at Frontiers
Learn more about the work of our research integrity team to safeguard the quality of each article we publish.