 Wei Sun
 Yuan Qin
 Hao Zhang
- Department of Thyroid Surgery, The First Hospital of China Medical University, Shenyang, China
NEAT1 (nuclear paraspeckle assembly transcript 1) is an oncogenic long non-coding RNA (lncRNA) that facilitates tumorigenesis in multiple cancers. In papillary thyroid cancer (PTC), the molecular mechanism by which NEAT1 affects invasion and metastasis remains elusive. RNA sequencing was used to discover differentially expressed NEAT1_2 downstream genes. Protein and RNA expression analyses and immunohistochemistry detected the expression of NEAT1_2, Transglutaminase 2 (TGM2), and microRNA-491 (miR-491) among PTC and non-cancerous tissues. Transwell and wound healing assays, and a mouse model of lung metastasis were used for further functional analyses. Bioinformatics was performed to predict miRNAs binding to both NEAT1_2 and TGM2. Rescue experiments and dual-luciferase reporter assays were performed. In PTC tissues, NEAT1_2 expression was markedly increased and regulated TGM2 expression. TGM2 was overexpressed in PTC, correlating positively with exthyroidal extension and lymph node metastasis. TGM2 knockdown significantly inhibited invasion and metastasis. NEAT1_2 sponged miR-491, acting as a competing endogenous RNA to regulate TGM2 expression. Fibronectin 1 (FN1) was predicted as a TGM2 target. TGM2 could transcriptionally activate FN1 by promoting nuclear factor kappa B (NFκb) p65 nuclear translocation, ultimately promoting PTC invasion/metastasis. These findings identify that NEAT1_2 sponges miR-491 to regulate TGM2 expression. TGM2 activates FN1 via NFκb to promote PTC invasion and metastasis.
Introduction
Among endocrine malignancies, thyroid cancer is the most common, representing almost 5% of new cancer cases and its incidence has increased rapidly worldwide over the past 20 years (1). Papillary thyroid carcinoma (PTC) accounting for 80 to 90% (2). Despite improvement in detection and surgical management, including surgical resection, radiotherapy, and levothyroxine treatment, among patients with aggressive PTC, 30% will suffer from recurrence and distant metastasis, which can cause death (3, 4). According to American Joint Committee on Cancer 8th stage for differentiated thyroid cancer, local invasion and distant metastasis are critical factors that affect the prognosis of thyroid cancer (5). There are many risk factors that are closely related to PTC initiation and progression, such as genetic factors, environmental exposure, and epigenetic alterations (6). However, its precise mechanism remains elusive. Therefore, understanding the underlying molecular mechanism of PTC invasion and metastasis is essential to identify valuable biomarkers and therapeutic targets for PTC.
Long non-coding RNAs (lncRNAs) comprise RNA transcripts of >200 nucleotides with little or no capacity to encode proteins (7). Recent studies have reported that lncRNAs can function as molecular sponges, scaffolds, and guides in interactions with microRNAs (miRNAs), proteins, and mRNAs, resulting in complex networks that modulate a variety of cancer phenotypes (8). NEAT1 (nuclear paraspeckle assembly transcript 1) is an lncRNA that was discovered recently to be a vital component of nuclear paraspeckles, and is dysregulated in multiple solid cancers (9–11). Previously, we reported that knockdown of NEAT1_2 induced apoptosis and inhibited migration by regulating ATPase family AAA domain containing 2 (ATAD2) expression in PTC (12). However, rescue experiments indicated that ATAD2 was not the only downstream target of NEAT1_2. This means that there must be other downstream targets that mediate the invasion and metastasis of PTC.
The transglutaminase family of enzymes includes transglutaminase 2 (TGM2), a calcium-dependent cross-linking enzyme that uses transamidation to catalyze protein modifications, which promotes the formation of polyaminated proteins or lysine combinations in the presence of calcium (13, 14). TGM2 functions in many biological processes, such as extracellular matrix stabilization, cell differentiation, maintenance of cancer stem cell survival, and invasive and metastatic behavior (15–19). However, the expression and function of TGM2 in PTC is unknown.
Research has shown that lncRNAs might function as competing endogenous RNAs (ceRNAs) to modulate microRNAs (miRNAs). As an oncogene, NEAT1 promotes docetaxel resistance in prostate cancer by regulating acyl-CoA synthetase long chain family member 4 (ACSL4) via sponging miR-34a-5p and miR-204-5p (9). Moreover, NEAT1 could contribute to cell proliferation, apoptosis, and invasion in lung cancer via the miR-1224/Kruppel like factor 3 (KLF3) axis, and promoted autophagy by regulating miR-204/autophagy related 3 (ATG3) and enhanced cell resistance to sorafenib in hepatocellular carcinoma (10, 11). Taken together, NEAT1 could play a critical role in human cancers by inhibiting the effects of miRNAs.
In the present study, we initially assessed the regulatory relationship between TGM2 and NEAT1_2. We then analyzed TGM2’s function and expression in PTC cell lines and tissues. Further mechanistic research identified that NEAT1_2 might act as a competing endogenous RNA (ceRNA) that modulates miR-491 levels to regulate TGM2. Furthermore, TGM2 could regulate PTC invasion and metastasis by promoting nuclear factor kappa B (NFκb) p65 nuclear translocation, resulting in transcriptional activation fibronectin 1 (FN1). The results revealed that NEAT1_2 affects PTC progression by multiple mechanisms; thus, our study contributes to the characterization of the detailed molecular mechanisms of invasion and metastasis in PTC.
Materials and Methods
Collection of Patient Specimens and PTC Cell Lines
We collected 174 paired PTC tissues samples and their adjacent non-cancerous thyroid tissue samples from patients who attended the First Hospital of China Medical University between 2011 and 2017. Eighty pairs of PTC tissues and adjacent non-cancerous was used in quantitative real-time reverse transcription PCR (qRT-PCR), 92 pairs were used for immunohistochemistry, and 12 pairs was used for western blotting. For qRT-PCR and western blotting, all tissue specimens were confirmed by two pathologists independently, frozen in liquid nitrogen immediately after surgical resection, and then stored at −80°C until later use. The Ethics Committee of the First Affiliated Hospital of China Medical University, Shenyang, China approved this study. Written informed consent was obtained from all study participants. Two PTC verified NEAT1_2 overexpressing cell lines (compared with that in Nthy-ori 3-1 cells, a normal human thyroid follicular epithelial cell line), K1 and TPC1, were used in this study. The source and culture method of the cell lines were the same as those reported in previous studies (12).
RNA Extraction, Sequencing, and Expression Quantification
Total RNA was extracted from three pairs of NC or si-NEAT1_2 K1 (K1 cells transfected to express a small interfering RNA targeting NEAT1_2) or NC (negative control) cells, and then the mRNA was enriched using Oligo(dT) beads. Further mRNA enrichment was achieved by removing rRNA by Ribo-ZeroTM Magnetic Kit (Epicentre). TopHat2 (version 2.1.1) was used to map the reads from each sample to the reference genome. RSEM software was then used to quantify expression. Transcripts were identified as differentially expressed genes (DEGs) if they had a fold change ≥ 2 and a false discovery rate (FDR) < 0.05.
Plasmids, Cell Transfection, and Lentivirus Infection
Gene Pharma (Suzhou, China) provided the NEAT1_2 and NC siRNAs. The sequences were si-NEAT1_2 (sense): 5′-GGA GGA GUC AGG AGG AAU AUU-3′, si-TGM2 (sense): 5′- GCC TCG TGG TTA TTA GCA AGG -3′, and si-p65 (sense): 5′- GGA GTA CCC TGA GGC TAT AAC TCG C -3′. The sequence of the negative control (NC) was 5′-UUC UCC GAA CGU GUC ACG UUU-3′. The miR-135b-5p mimic, miR-491 mimic, and miR-19b-3p mimic were purchased from Gene Pharma. The pcDNA-TGM2 plasmid and the pcDNA empty plasmid were purchased from GeneChem (Shanghai, China). Transfections were performed using Lipofectamine 2000 (Invitrogen, Carlsbad, CA, USA) according to the manufacturer’s instruction. Recombinant lentiviruses containing a NEAT1_2 small hairpin RNA (shRNA) or the control were purchased from Obio Technology (Shanghai, China). For shRNA lentivirus infection, cells were infected in six-well plates and subsequently split into 75 cm2 cell culture bottle in the presence of 2 μg/ml puromycin for selection over 96 h. The stably transfected cell lines were identified using qRT-PCR.
Total RNA Extraction and qRT-PCR
RNAiso (Takara, Dalian, China) was used to extract total RNA from frozen samples of tissues and cells. PrimeScript™ RT Master Mix and SYBR® Premix Ex Taq™ II (Takara) in the Light Cycler 480 system (Roche, USA) were used to perform the qRT-PCR reactions. The primers used comprised NEAT1_2 (sense): 5′-CTA GAG GCT CGC ATT GTG TG-3′; NEAT1_2 (antisense): 5′-GCC CAC ACG AAA CCT TAC AT-3′. TGM2 (sense): 5′-ATA AGT TAG CGC CGC TCT CC-3′; TGM2 (antisense): 5′-CCA GCT CCA GAT CAC ACC TC-3′. GAPDH (sense): 5′-CCG GGA AAC TGT GGC GTG ATG G-3′; GAPDH (antisense): 5′-AGG TGG AGG AGT GGG TGT CGC TGT T-3′. miR-491 (sense): 5′-AGU GGG GAA CCC UUC CAU GAG G-3′. The miRNA antisense primer was provided by the 638313 Mir-X™ miRNA First-Strand Synthesis Kit (Takara). The primers for the endogenous control gene U6 were: U6 (sense): 5′-TCG GCA GCA CAT ATA CTA A-3′; U6 (antisense): 5′-AAC ATG GAA CGC TTC ACG AAT-3′. The relative expression levels were calculated using the 2-ΔCT method (CT, cycle threshold).
Transwell Assay
After transfection of K1 and TPC1 cells for 24 h, the cell concentration in each group was adjusted to 1.5 × 10⁴ cells/ml using serum-free medium. The upper Transwell chamber was filled with 200 μl of cell suspension with or without Matrigel™ (Corning, Corning, NY, USA), and the lower Transwell chamber was filled with 600 μl of medium containing 10% fetal bovine serum (FBS). Cells were incubated for 12 h for the migration assay and 24 h for the invasion assay at 37°C in an incubator at 5% CO2. After the indicate times, cultured cells that migrated through the membrane were fixed with methanol and stained with 0.5% crystal violet. Cell numbers were counted in five randomly chosen microscopic fields (100×) per membrane.
Wound-Healing Assay
After transfection of K1 and TPC1 cells for 24 h, K1 and TPC1 cells were seeded in six−well plates until they reached 80% confluency. A 200-μl pipette tip was used to create scratches. Cells were washed with phosphate-buffered saline (PBS) and cultured in serum-free medium. The scratches were observed and photographed at 0 and 24 h after wounding in three randomly observed fields. The percentage of wound closure was measured using Image J software (NIH, Bethesda, MD, USA).
Western Blotting
A Protein Extraction Kit (KeyGEN, Nanjing, China) was used to extract the proteins in PTC cells and tissues, and from adjacent non-cancerous thyroid tissues. Total proteins (40–50 μg) were subjected to sodium dodecyl sulfate polyacrylamide gel electrophoresis (SDS-PAGE). The separated proteins were then transferred electrophoretically onto 0.45-μm polyvinylidene difluoride membranes (Millipore, Billerica, MA, USA). The membranes were blocked using 5% skim milk, and then incubated with primary antibodies diluted with primary antibody dilution buffer, including those recognizing glyceraldehyde-3-phosphate dehydrogenase (GAPDH) (1:1,000 dilution, ZSGB-Bio, Beijing, China), TGM2 (1:2,000, ab109200, Abcam, Cambridge, MA, USA), p65 (1:2,000, ab32536, Abcam), and FN1 (1:1,000 dilution, 15613-1-AP Proteintech, Rosemont, IL, USA), at 4°C overnight. Subsequently, the antibodies bound to the membranes were reacted with secondary antibodies (1:1,000 dilution, ZSGB-Bio). The immunoreactive protein bands were detected using an enhanced chemiluminescence (ECL) kit from Thermo Fisher Scientific (Waltham, MA, USA).
Immunohistochemistry (IHC)
Immunohistochemistry for the target molecules was performed on paraffin sections using a primary antibody recognizing TGM2 (1:200; ab2386, Abcam). The semi-quantitative Remmele scoring system was used to score the immunohistochemical staining.
Immunofluorescence Staining
PTC cells at 1.5 × 10⁵ cells per well were transfected and cultured in six-well plates with cell slides. When the cells reached 70% confluence, they were subjected to fixation in 4% polyformaldehyde at room temperature for 15 min. After treatment with 0.3% Triton X-100 and blocking with goat serum for 30 min, the cells were incubated with anti-p65 antibodies (1:2,000, ab32536, Abcam) at 4° overnight. Finally, the cells were mounted under a fluorescence inverted microscope, observed, and photographed.
Tumor Xenograft Model
All animal procedures were conducted in accordance with the guidelines of the China Medical University Institutional Animal Care and Use Committee. For the tumor metastasis assay, K1 cells (1 × 10⁶ K1) stably transfected with the LV-empty vector, LV-shRNA-NEAT1_2+pcDNA-TGM2, or LV-sh NEAT1_2, were injected into nude mice via the tail vein, separately. Seven weeks later, the mice were euthanized and their lungs were removed. The images and number of metastatic nodules in the lungs were captured and counted.
Luciferase Assay
NEAT1_2-wild type (NEAT1_2-Wt) and NEAT1_2-mutation type (NEAT1_2-Mt) constructs containing the putative binding sites or mutated the putative binding sites, for miR-491 were amplified and ligated into pMIR-REPORT, a firefly luciferase expression vector (Obio Technology, Shanghai, China). Lipofectamine 2000 (Invitrogen, Carlsbad, CA, USA) was used to transfect HEK 293T cells with NEAT1_2-Wt and NEAT1_2-Mt, together with the Renilla luciferase expressing vector pRL-TK (Promega, Madison, WI, USA), which were then transfected with the miR-491 mimic or NC. Similarly, cells were cotransfected with the wild-type TGM2 3′ UTR (TGM2-3′ UTR-Wt) or the mutated TGM2 3′ UTR (TGM2-3′UTR-Mt) together with the miR-491 mimic or NC. All the co-transfected cells were also transfected with pRL-TK. We also constructed a pcDNA3.1-NEAT1_2 wild-type plasmid (pcDNA3.1-NEAT1_2 Wt), which contained miR-491 binding sites, and pcDNA3.1-NEAT1_2 mutated plasmid (pcDNA3.1-NEAT1_2 Mt), which contained mutated miR-491 binding sites, to further verify that TGM2 was regulated by NEAT1_2 via NEAT1_2’s interaction with miR-491. Next, the region of the FN1 promoter containing p65 binding sites was cloned into the luciferase reporter vector pGL3-Basic (Promega). Cells were then subjected to cotransfection with the indicated reporter plasmids and pcDNA-p65, or with negative controls. Finally, the luciferase activities in the cells were assessed as mentioned above.
Bioinformatic Analyses
Correlation analysis of the downstream factors of TGM2 was performed in gene expression profiles from The Cancer Genome Atlas (TCGA) database (http://cancergenome.nih.gov/) using the R software (version 3.4.2). PTC samples (n = 497) were divided into TGM2 high-expression and TGM2 low-expression groups according to the upper quartile value of TGM2 expression levels. The top 200 significantly upregulated genes in the TGM2 high-expression group were summarized using Microsoft Excel 2010 (Supplementary Material 1). Functional analysis was performed using Kyoto Encyclopedia of Genes and Genomes (KEGG) pathway enrichment analysis and KOBAS 2.0 software. Gene set enrichment analysis (GSEA) (https://www.broadinstitute.org/) was used to explore whether the identified gene sets displayed statistically significant differences between the two groups. The statistical significance was determined using the normalized enrichment score (NES) and false discovery rate (FDR). Four online prediction tools, RegRNA 2.0 (http://regrna2.mbc.nctu.edu.tw/index.html), miRDB (http://www.mirdb.org/), Targetcan (http://www.targetscan.org/vert_72/), and ENCORI (http://starbase.sysu.edu.cn/panCancer.php) were used to determine whether the miRNAs could not only bind to NEAT1_2, but also target TGM2. The putative binding sequences of p65 in the FN1 promoter were obtained from JASPAR (http://jaspar.genereg.net/).
Statistical Analysis
All statistical analyses were performed using SPSS 13.0 software (IBM Corp., Armonk, NY, USA). The differences in the relative expression levels of TGM2, miR-491, and NEAT1_2, in PTC tissues and adjacent non-cancerous tissues were assessed using a Wilcoxon signed-rank test. The relationships between TGM2 or NEAT1_2 expression and the patients’ clinicopathological characteristics were assessed using a chi-squared test. Comparisons between two independent groups used a two-tailed independent sample t test, Statistical significance was indicated by p-values < 0.05.
Results
NEAT1_2 Expression Was High and Could Regulate TGM2 in PTC
NEAT1_2 expression was initially investigated using qRT-PCR in 80 PTC tissues and their adjacent non−cancerous tissues. Compared with that in adjacent non-cancerous tissues, NEAT1_2 expression was markedly increased in PTC tissues (Figure 1A). Next, to investigate the downstream targets of NEAT1_2, we performed mRNA-seq in the NEAT1_2 knockdown group and NC group in the K1 cell line. We found that after knockdown of NEAT1_2, 615 mRNAs were upregulated and 2364 mRNAs were downregulated. Among the downregulated mRNAs, TGM2 was identified as a downstream target, which was downregulated by 66.67% in the NEAT1_2 knockdown group compared with that in the NC group (p < 0.01) (Figures 1B, C). The regulatory relationship between NEAT1_2 and TGM2 was further confirmed in PTC tissues and cell lines. Compared with that in the non-cancerous tissue group, TGM2 expression was significantly increased in the PTC group (Figures 1D, E). Spearman’ s correlation analysis indicated that a positive relationship existed between NEAT1_2 and TGM2 (R2 = 0.12, p < 0.05) (Figure 1F). Exthyroidal extension and lymph node metastasis were positively associated with the large difference in relative TGM2 expression in PTC tissues (both p < 0.01) (Figures 1G, H). Upon knockdown of NEAT1_2 expression in PTC cells, the expression of TGM2 mRNA or protein was significantly lower in the NEAT1_2 knockdown group compared with that in the control group (Figures 1I–K). Thus, NEAT1_2 might function by regulating the expression of TGM2.
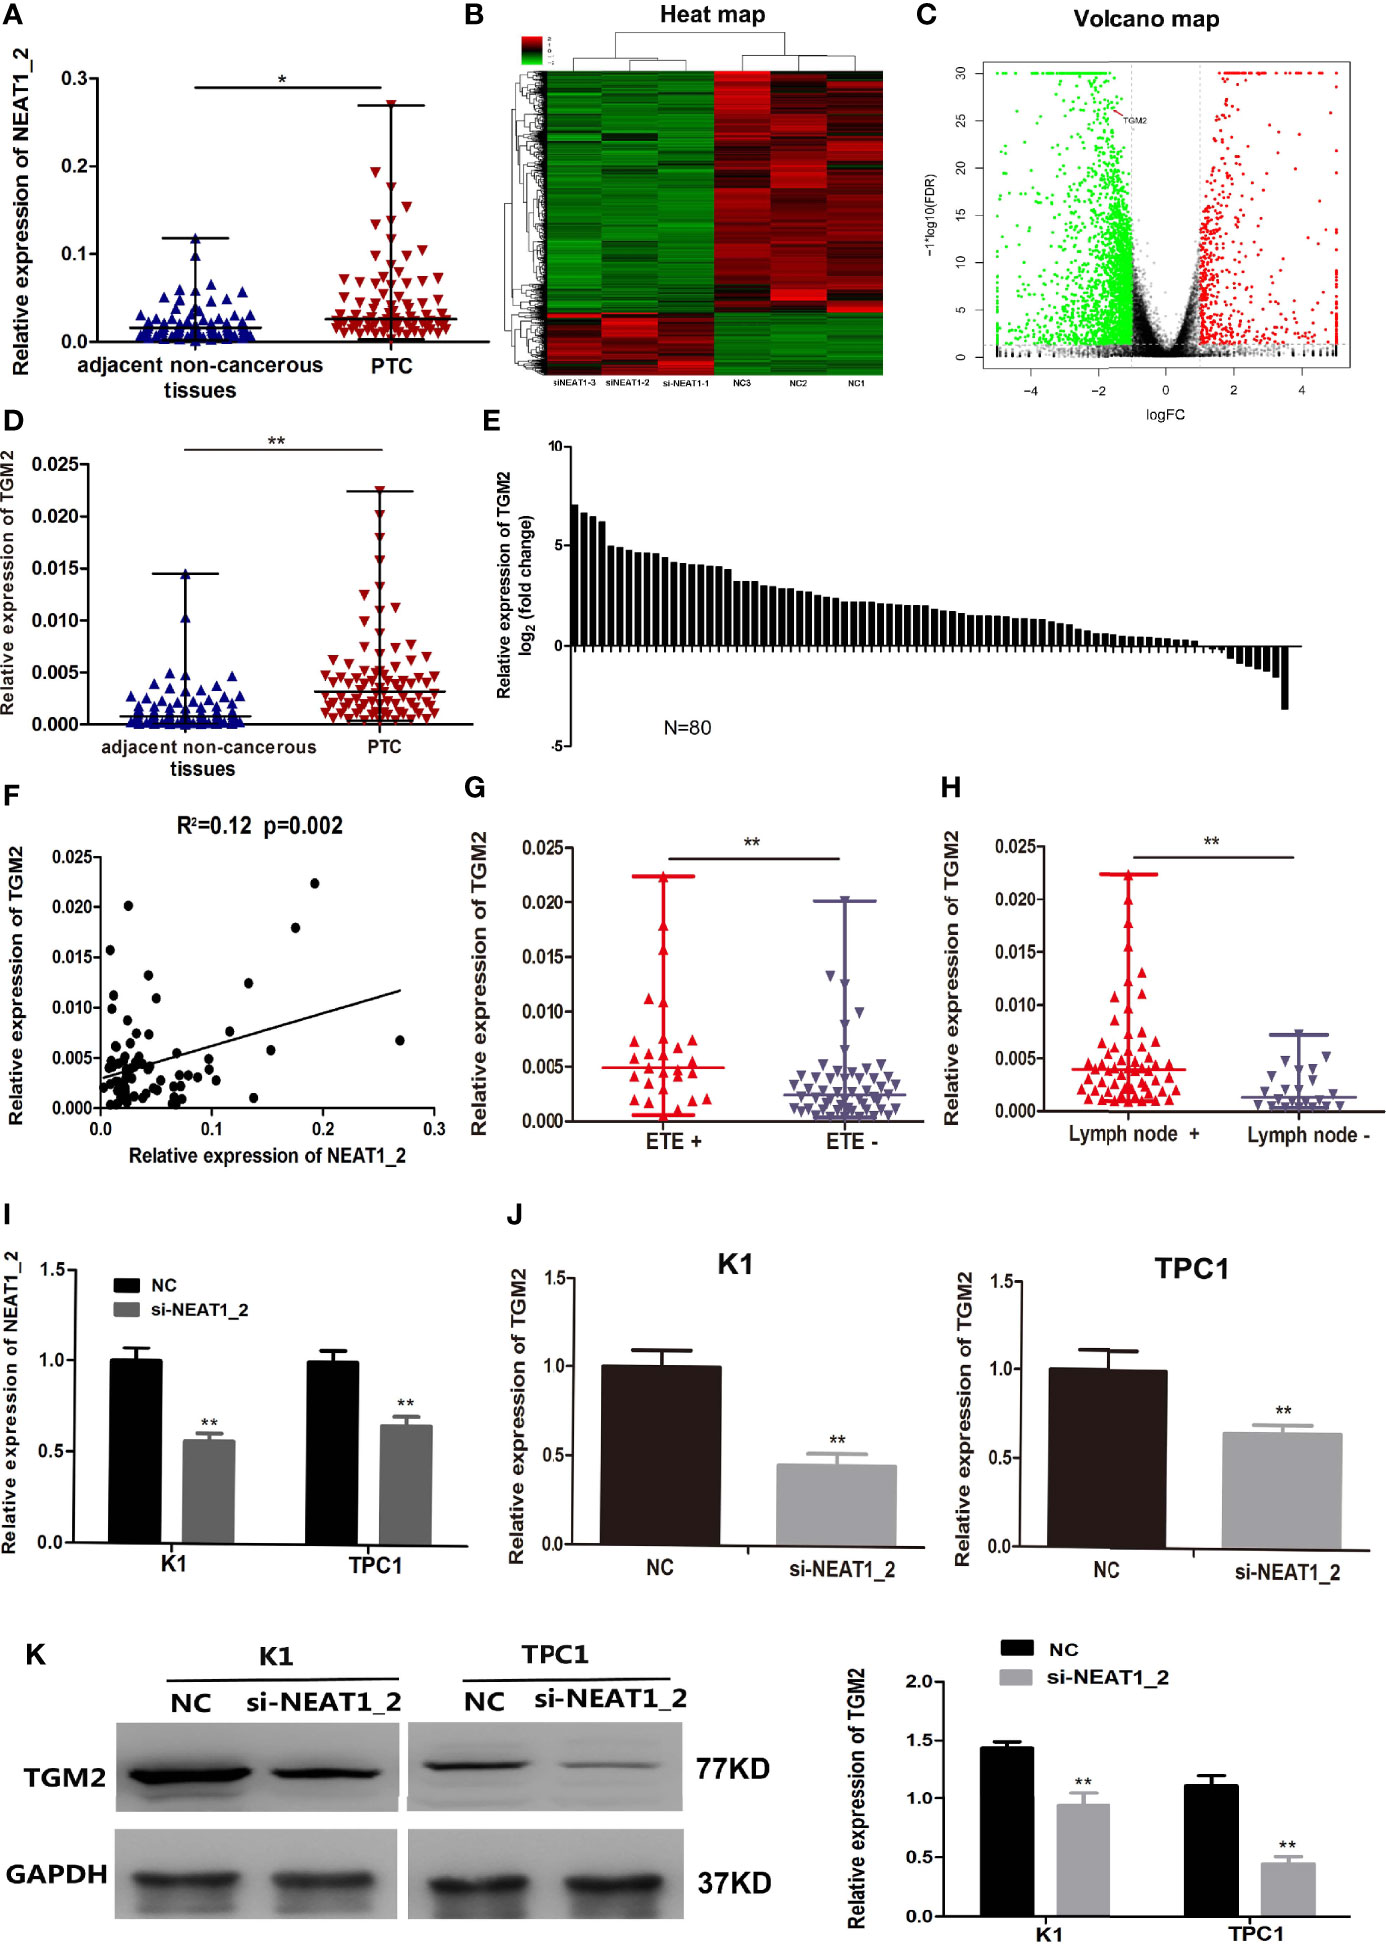
Figure 1 NEAT1_2 expression was high and could regulate TGM2 in PTC. (A) The relative expression levels of NEAT1_2 in 80 pairs of PTC tissues and adjacent non-cancerous tissues, as determined using qRT-PCR. The Wilcoxon signed-rank test was used to analyzed the differences between the two groups; data are presented as the median with a range. *P < 0.05. (B) Heat map of differentially expressed mRNAs (615 upregulated and 2364 downregulated) in K1 cells transfected with si-NEAT1_2 and NC. (Fold change ≥ 2, P < 0.05). (C) Volcano plots were constructed based on the sequencing results of the differentially expressed mRNAs between K1 cells transfected with si-NEAT1_2 and NC. The red points represent differentially upregulated genes, and green points represent downregulated genes (Fold change ≥ 2, P < 0.05). A red arrow indicates TGM2 in the plots. (D) The relative expression levels of TGM2 in 80 pairs of PTC tissues and adjacent non-cancerous tissues, as determined using qRT-PCR. The Wilcoxon signed-rank test was used to analyzed the differences between the two groups; data are presented as the median with a range. **P < 0.01. (E) The fold change of TGM2 expression between PTC and corresponding adjacent non-cancerous tissues. (F) Pearson’s correlation analysis was performed to analyze the correlations between NEAT1_2 and TGM2 expression in PTC tissues (R2 = 0.15, P < 0.05). (G) TGM2 expression in the extrathyroidal extension positive (n = 27) and extrathyroidal extension negative (n = 53) subgroups The Mann-Whitney U test was used to analyze the differences between the two groups; data are presented as the median with a range. **P < 0.01. (H) TGM2 expression in the lymph node metastasis positive (n = 58) and lymph node metastasis negative (n= 22) groups. The Mann-Whitney U test was used to analyze the differences between the two groups; data are presented as the median with a range. **P < 0.05. (I) qRT-PCR analysis of NEAT1_2 interference efficiency after si-NEAT1_2 or NC transfection in PTC cells. **P < 0.01 versus NC. (J) The relative mRNA expression of TGM2 was detected using qRT-PCR in PTC cells after transfection with si-NEAT1_2 or NC. Data are presented as the mean ± S.D., as analyzed using an independent samples t-test. **P < 0.01 versus NC. (K) Western blotting was applied to detect the protein level of TGM2 in PTC cells transfected with si-NEAT1_2 or NC. Data are presented as the mean ± S.D., as analyzed using an independent samples t-test. **P < 0.01 versus NC.
Upregulation of TGM2 Expression Promoted the Migration and Invasion in PTC Cells
Protein levels of TGM2 were detected via immunohistochemistry (IHC) and western blotting. To analysis whether TGM2 levels were associated with PTC clinicopathological features, IHC scoring was applied. As shown in Table 1 and Figure 2A, significantly increased TGM2 protein levels were observed in PTC tissues, and positive expression of TGM2 was significantly related to lymph node metastasis (P = 0.003) and extrathyroidal extension (P = 0.035). PTC tissue overexpression of TGM2 was verified using western blotting using samples from 12 pairs of PTC and adjacent normal tissues (Figure 2B). To determine the functional roles of TGM2 in PTC, we further downregulated TGM2 expression to investigate whether inhibition of TGM2 could affect PTC cell biological activity. The knockdown efficiency of si-TGM2 is shown in Figures 2C, D. Transwell assays demonstrated that after si-TGM2 transfection, PTC cell invasion and migration abilities were decreased compared with those of the NC group (Figure 2E). The effect of TGM2 knockdown on migration was confirmed using a wound-healing assay (Figure 2F). Taken together, these results revealed that TGM2 was overexpressed in PTC and promoted the migration and invasion in PTC cells.
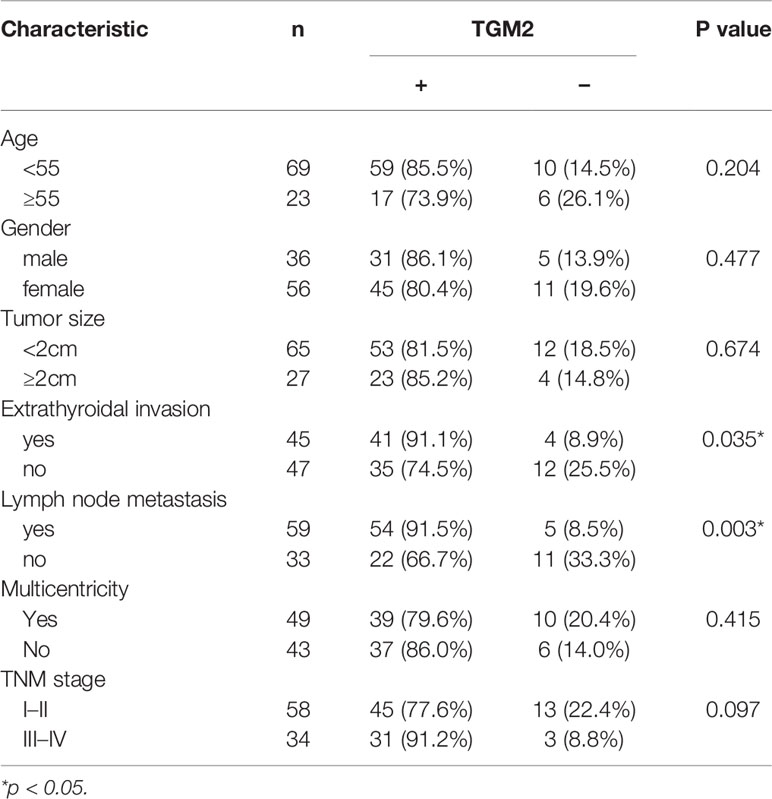
Table 1 Correlation between TGM2 expression and clinicopathological features in patients with papillary thyroid cancer (n = 92).
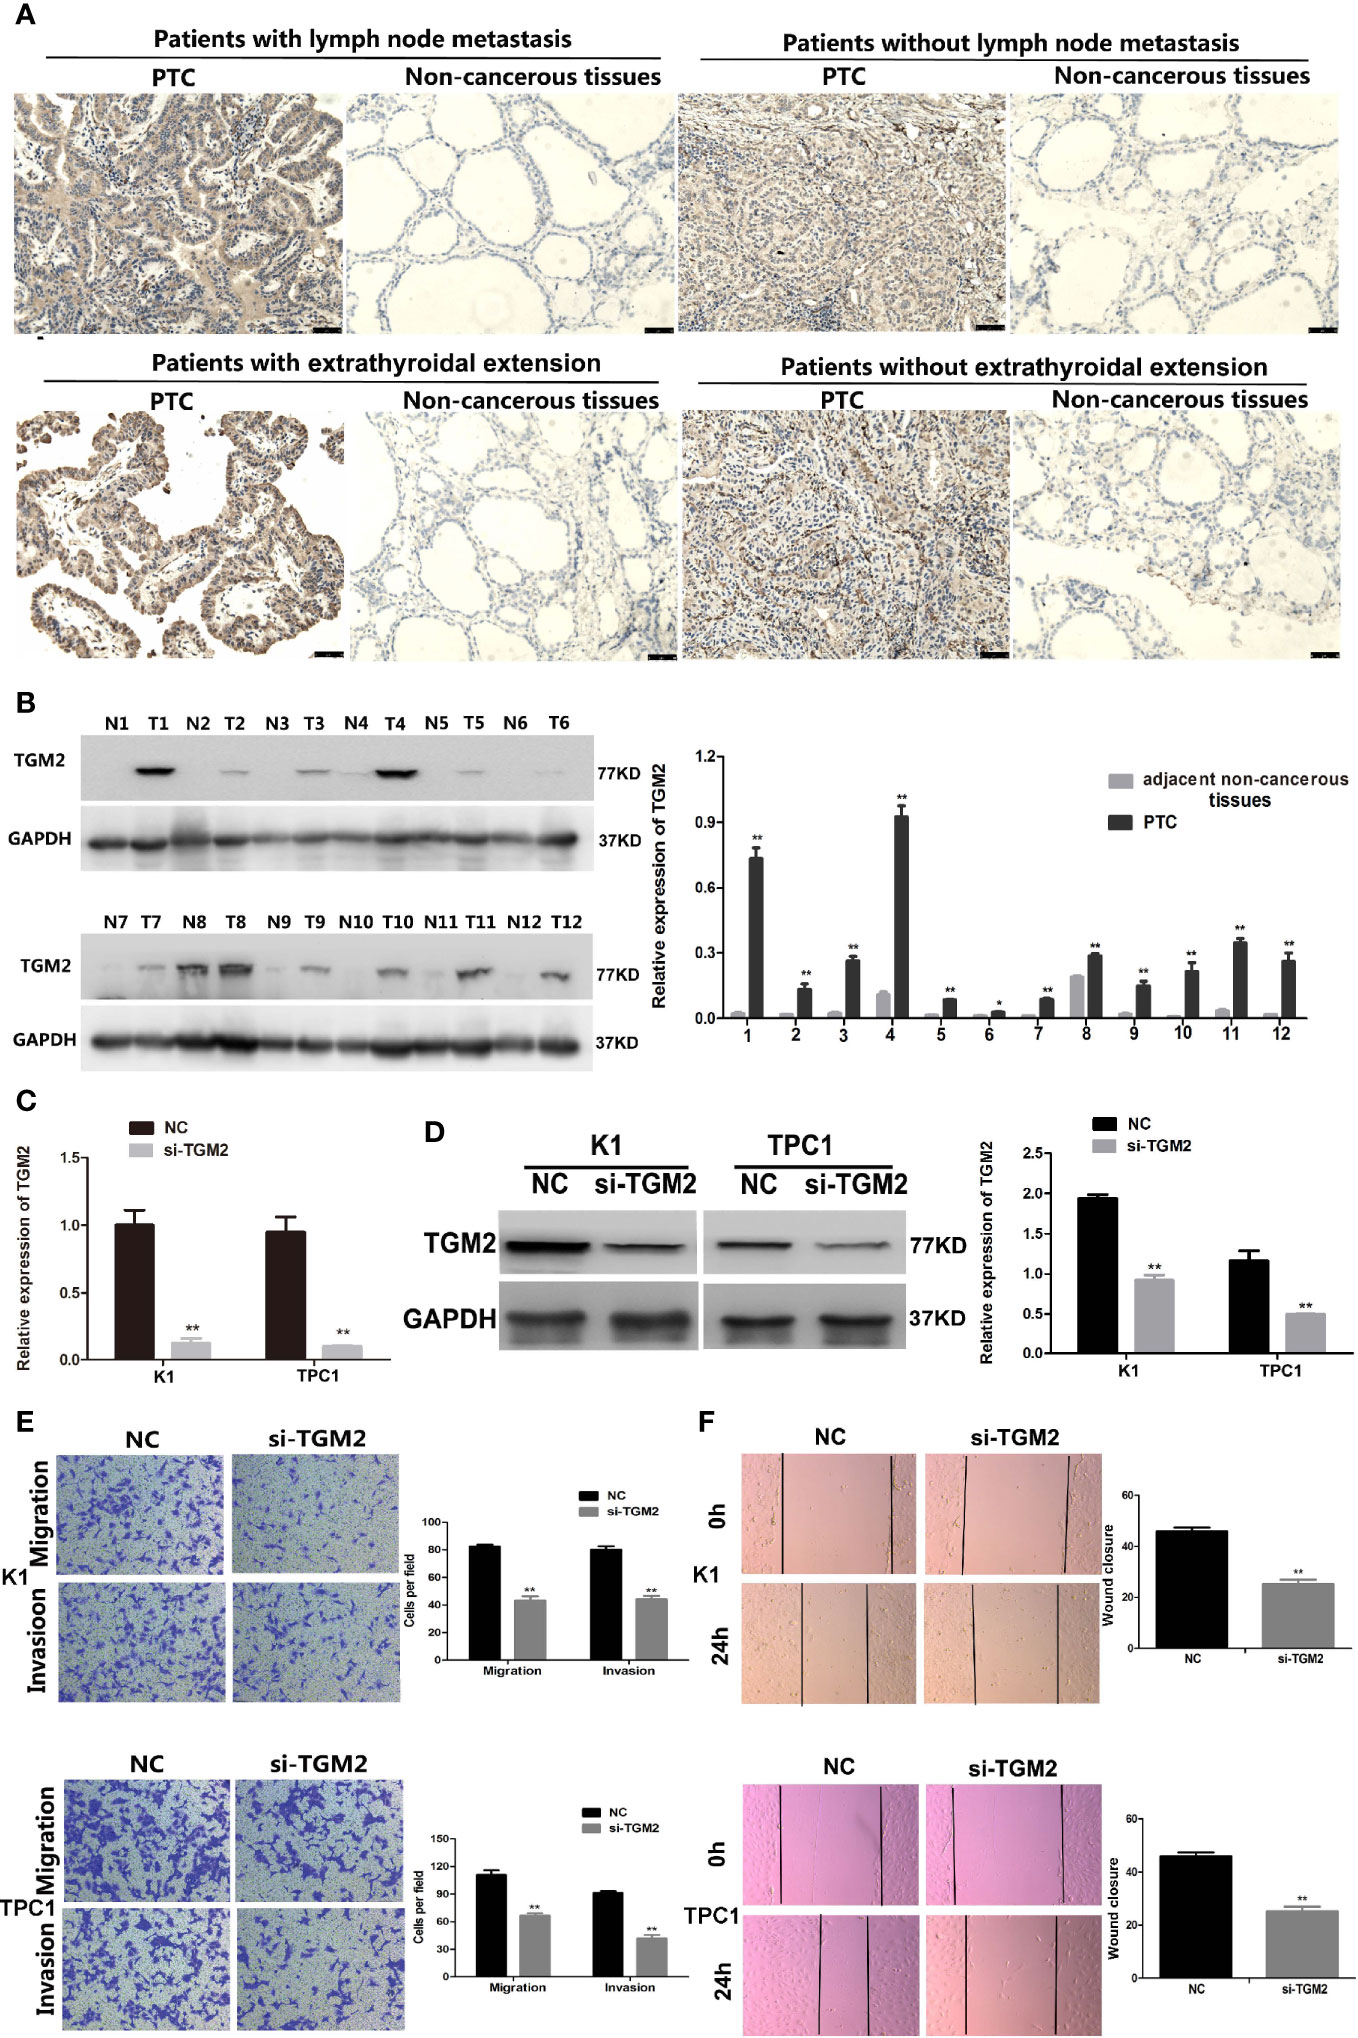
Figure 2 Upregulation of TGM2 expression promoted the migration and invasion of PTC cells. (A) Representative photographs from IHC analysis of TGM2 protein levels in normal and tumor samples, with or without lymph node metastasis and extrathyroidal extension. Scale bars: 50 μm. (B) Western blotting analysis of relative TGM2 protein levels in 12 pairs of PTC tissues (T) and corresponding adjacent non-cancerous tissues (N). *P < 0.05, **P < 0.01 versus adjacent non-cancerous tissues. (C) The relative mRNA expression of TGM2 was detected using qRT-PCR in PTC cells after transfection with si-TGM2 or NC. Data are presented as the mean ± S.D., as analyzed using an independent samples t-test. **P < 0.01 versus NC. (D) Western blotting was applied to detect the protein level of TGM2 in PTC cells transfected with si-TGM2 or NC. Data are presented as the mean ± S.D., as analyzed using an independent samples t-test. **P < 0.01 versus NC. (E) Transwell assays were used to evaluate the migration and invasion in PTC cells after transfection with si-TGM2 or NC. Data are presented as the mean ± S.D., as analyzed using an samples t-test. **P < 0.01 versus NC. (F) A wound healing assay was applied to analyze the migration capacity in PTC cells after transfection with si-TGM2 or NC. All data are presented as the mean ± S.D.
The Overexpression of TGM2 Partially Impairs NEAT1_2 Depletion-Mediated Migration and Invasion in PTC Cells or In Vitro
To investigate whether TGM2 mediated the invasion-inhibition effects of NEAT1_2 knockdown in PTC cells, construct pCDNA3.1-TGM2 was cotransfected with si-NEAT1 into K1 or TPC1 cells. Figure 3A shows the western blotting results for TGM2 expression in the NC group, si-NEAT1_2 group, and the co-transfected si-NEAT1_2+TGM2 group. Compared with that in the si-NEAT1_2 group, the TGM2 levels increased significantly in the co−transfected group. Subsequently, functional experiments showed that the si-NEAT1_2-induced inhibition of migration and invasion was partly impaired by overexpression of TGM2 (Figures 3B, C). To further investigate TGM2’s effect PTC metastasis, a pulmonary metastasis assay was performed in nude mice by injecting LV-empty vector, LV-shRNA-NEAT1_2, and LV-shRNA-NEAT1_2+ pcDNA-TGM2 transfected cells into the mouse tail vein. Compared with those in the LV-empty vector group, the number of visible nodules in the LV-shRNA-NEAT1_2 group had decreased significantly (Figure 3D). The effects of co-transfected LV-shRNA-NEAT1_2+ pcDNA-TGM2 cells were similar to the effects of the LV-empty vector group in terms of invasion and metastasis. Moreover, the IHC staining to analyze FN1, NFκb, and TGM2 expression in the mouse lung tissue (Figure 3E). Thus, these results suggested strongly that in PTC cells or in vivo, NEAT1_2 exerts an oncogenic function by targeting TGM2.
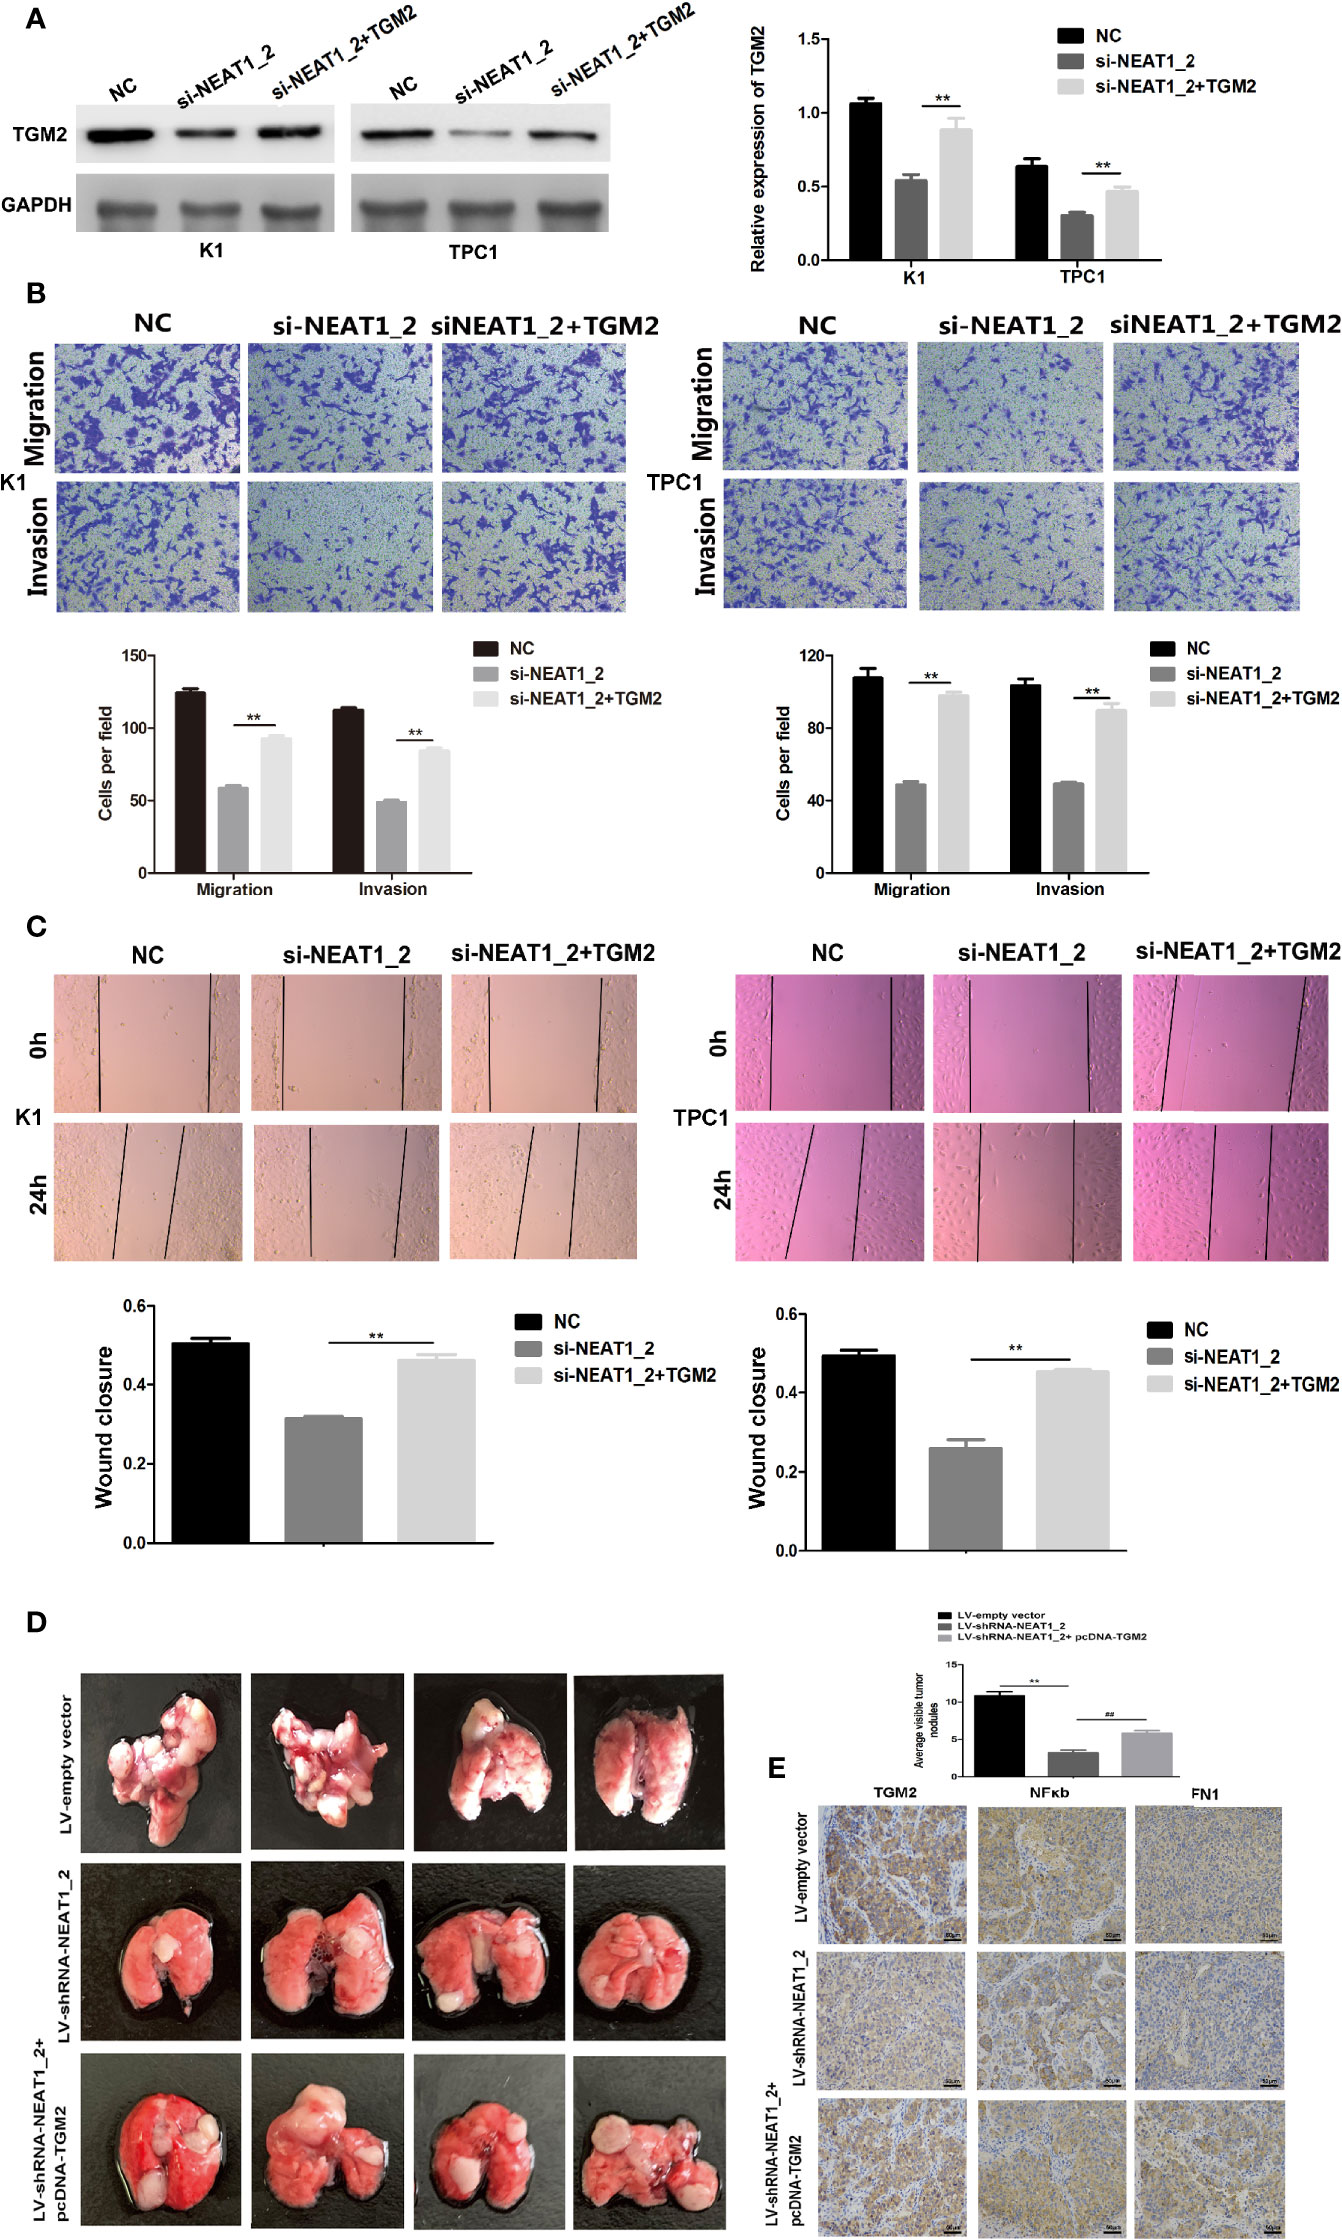
Figure 3 Overexpression of TGM2 partially impairs NEAT1_2 depletion-mediated migration and invasion in PTC cells or in vitro. (A) Western blotting was used to analyze the level of TGM2 in PTC cells transfected with si-NEAT1_2 or co-transfected pCDNA3.1-TGM2 and si-NEAT1_2 or NC. Data are presented as the mean ± S.D., as analyzed using an independent samples t-test. **P < 0.01 versus NC. (B) Transwell assay analysis was used to evaluate the migration and invasion of PTC cells after transfection with si-TGM2 or after co-transfection pCDNA3.1-TGM2 and si-NEAT1_2 or NC. Data are presented as the mean ± S.D., as analyzed using an independent samples t-test. **P < 0.01 versus the si-NEAT1_2 group. (C) A wound healing assay was applied to analyze the migratory capacity of PTC cells after transfection with si-NEAT1_2 or co-transfected pCDNA3.1-TGM2 and si-NEAT1_2 or NC. (D) Lung metastasis nodules from model mice after intravenous injection of 1 × 10⁶ K1 cells of the LV-sh-NEAT1_2 group, the LV-empty vector group, and the LV-shRNA-NEAT1_2 + pcDNA-TGM2 group. Data are presented as the mean ± S.D., as analyzed using an independent samples t-test. **P < 0.01 versus LV-empty vector group, ##P < 0.01 versus LV-sh-NEAT1_2 group. (E) IHC staining to analyze FN1, NFκb, and TGM2 expression in the mouse lung tissue.
NEAT1_2 Regulates TGM2 via Downregulating miR-491
Our results so far indicated that NEAT1_2 promotes invasion and metastasis by targeting TGM2. To further understand the mechanism by which NEAT1_2 inhibits the expression of TGM2 in PTC cells, we determined whether there were interactions between NEAT1_2 and certain miRNAs, because it has been reported that lncRNAs may act as miRNA sponges. We used the target prediction and bioinformatic analysis tools RegRNA 2.0, miRDB, TargetScan, and ENCORI to identify potential miRNAs that could target TGM2 and had NEAT1_2 binding sites (Figure 4A). This analysis identified 22 miRNAs that were predicted to bind to both the 3′ UTR of TGM2 and NEAT1_2 (Figure 4B). Then, in K1 and TPC1 cells, we confirmed whether downregulation of NEAT1_2 could upregulate the expression of the 22 predicted miRNAs, as assessed using qRT-PCR. The expression levels of miR-135b, miR−19b, and miR-491 were significantly lower in the NC group than in the NEAT1_2 knockdown group (Figure 4C). Next, in K1 and TPC1 cells, we detected whether TGM2 expression was downregulated by overexpressing miR-135b, miR-19b, and miR-491. TGM2 expression was downregulated only by overexpression of miR-491 (Figure 4D). Thus, we believe that miR-491 regulates the TGM2 protein level in PTC cell lines.
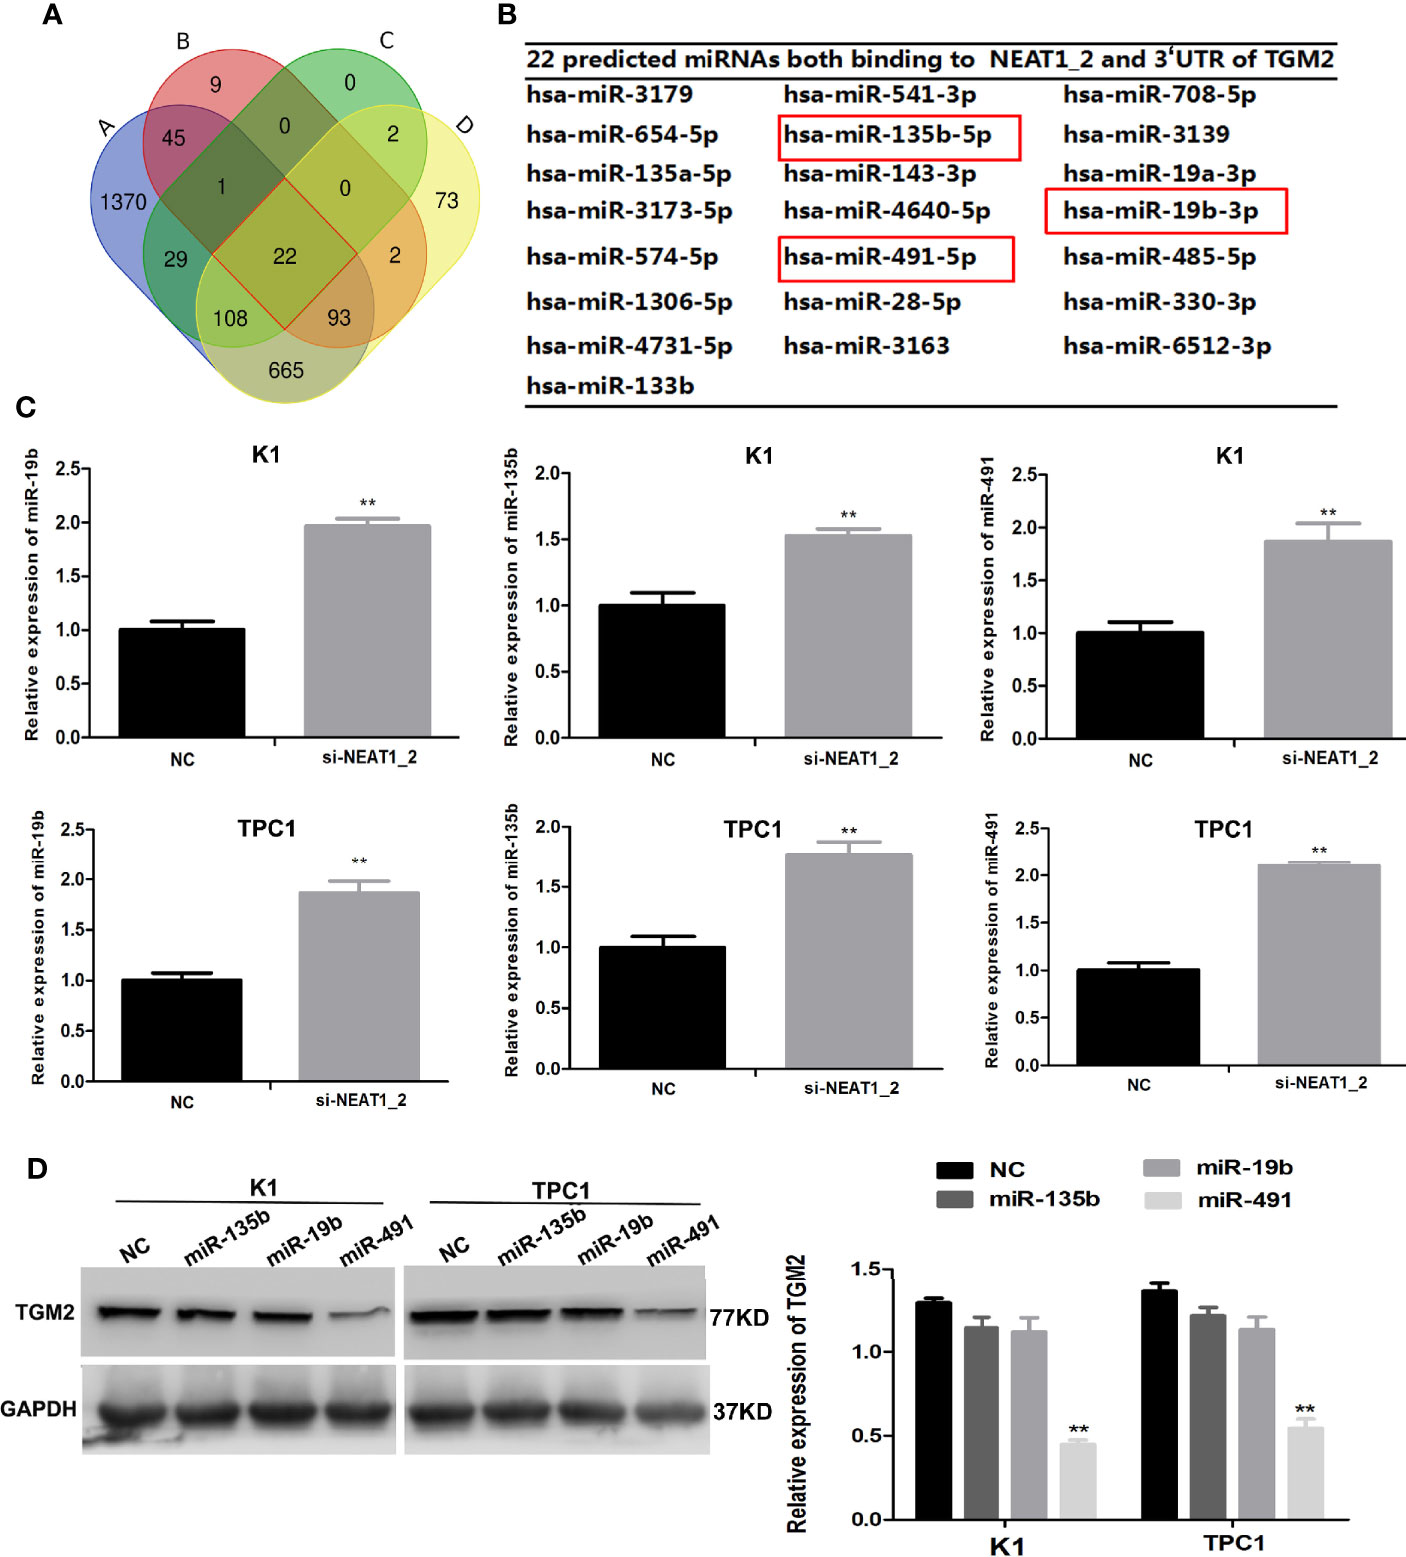
Figure 4 NEAT1_2 regulates TGM2 via downregulating miR-491. (A) Identification of 22 common miRNAs that bind to both NEAT1_2 and TGM2 from four publicly available datasets (A: RegRNA 2.0, B: miRDB, C: Targetcan, and D: ENCORI). Different colored areas represent different datasets. (B) The 22 miRNAs that bind to both NEAT1_2 and TGM2 from bioinformatic prediction. (C) The relative expression levels of miR-19b, miR-135b, and miR-491 were detected using qRT-PCR in PTC cells transfected with si-NEAT1_2 or NC. Data are presented as the mean ± S.D., as analyzed using an independent samples t-test. **P < 0.01 versus NC. (D) Protein expression of TGM2 was detected using western blotting in PTC cells transfected with miR-19b mimic, miR-135b mimic, and miR-491 mimic or NC. Data are presented as the mean ± S.D., as analyzed using an independent samples t-test. **P < 0.01 versus NC.
miR-491 Inhibited PTC Migration and Invasion in PTC and Could Directly Bind to NEAT1_2 and the 3′ UTR of TGM2
To understand the role of miR-491 in PTC, we analyzed the expression of miR-491 in PTC tissues and non-cancerous tissues. qRT-PCR revealed that miR-491 was overexpressed in 80 paired non-cancerous tissues compared with its expression in PTC tissues (Figure 5A). In 80 PTC tissues, the expression of miR-491 correlated negatively and significantly with NEAT1_2 or TGM2, according to the Pearson correlation test (Figures 5B, C). We further examined the effects of miR-491 on PTC progress. Transwell assays indicated that upregulation of miR-491 using its mimics decreased PTC migration and invasion activity in K1 and TPC1 cell lines (Figure 5D). In addition, a wound-healing assay suggested that overexpression of miR-491 in PTC cells led to a notable reduction in cell migration ability (Figure 5E). In addition, we confirmed that that miR-491 could bind to NEAT1_2 and directly targeted TGM2 using dual luciferase reporter assays. Luciferase activity was reduced significantly in cells co-transfected with NEAT1_2-Wt and the miR-491 mimic, while co-transfection with NEAT1_2-Mt and the miR-491 mimic did not change the luciferase activity (Figure 5F). Similarly, to ascertain whether TGM2 is a direct target of miR-491, dual−luciferase reporter assays were performed. In HEK 293T cells, the luciferase activity from TGM2-3′UTR-Wt was reduced significantly after ectopic overexpression of miR-491; however, miR-491 overexpression did not affect the luciferase activity from TGM2-3′UTR-Mt (Figure 5G). Further dual luciferase reporter assays were performed to verify whether NEAT1_2’s interaction with miR-491 could regulate TGM2. The luciferase activity from TGM2-3′ UTR-Wt was increased significantly by pcDNA3.1-NEAT1_2 Wt; whereas pcDNA3.1-NEAT1_2 Mt did not alter the luciferase activity from TGM2-3′ UTR-Wt (Figure 5H). Thus, miR-491 inhibited PTC migration and invasion and could bind directly to the 3′ UTR of TGM2 and NEAT1_2.
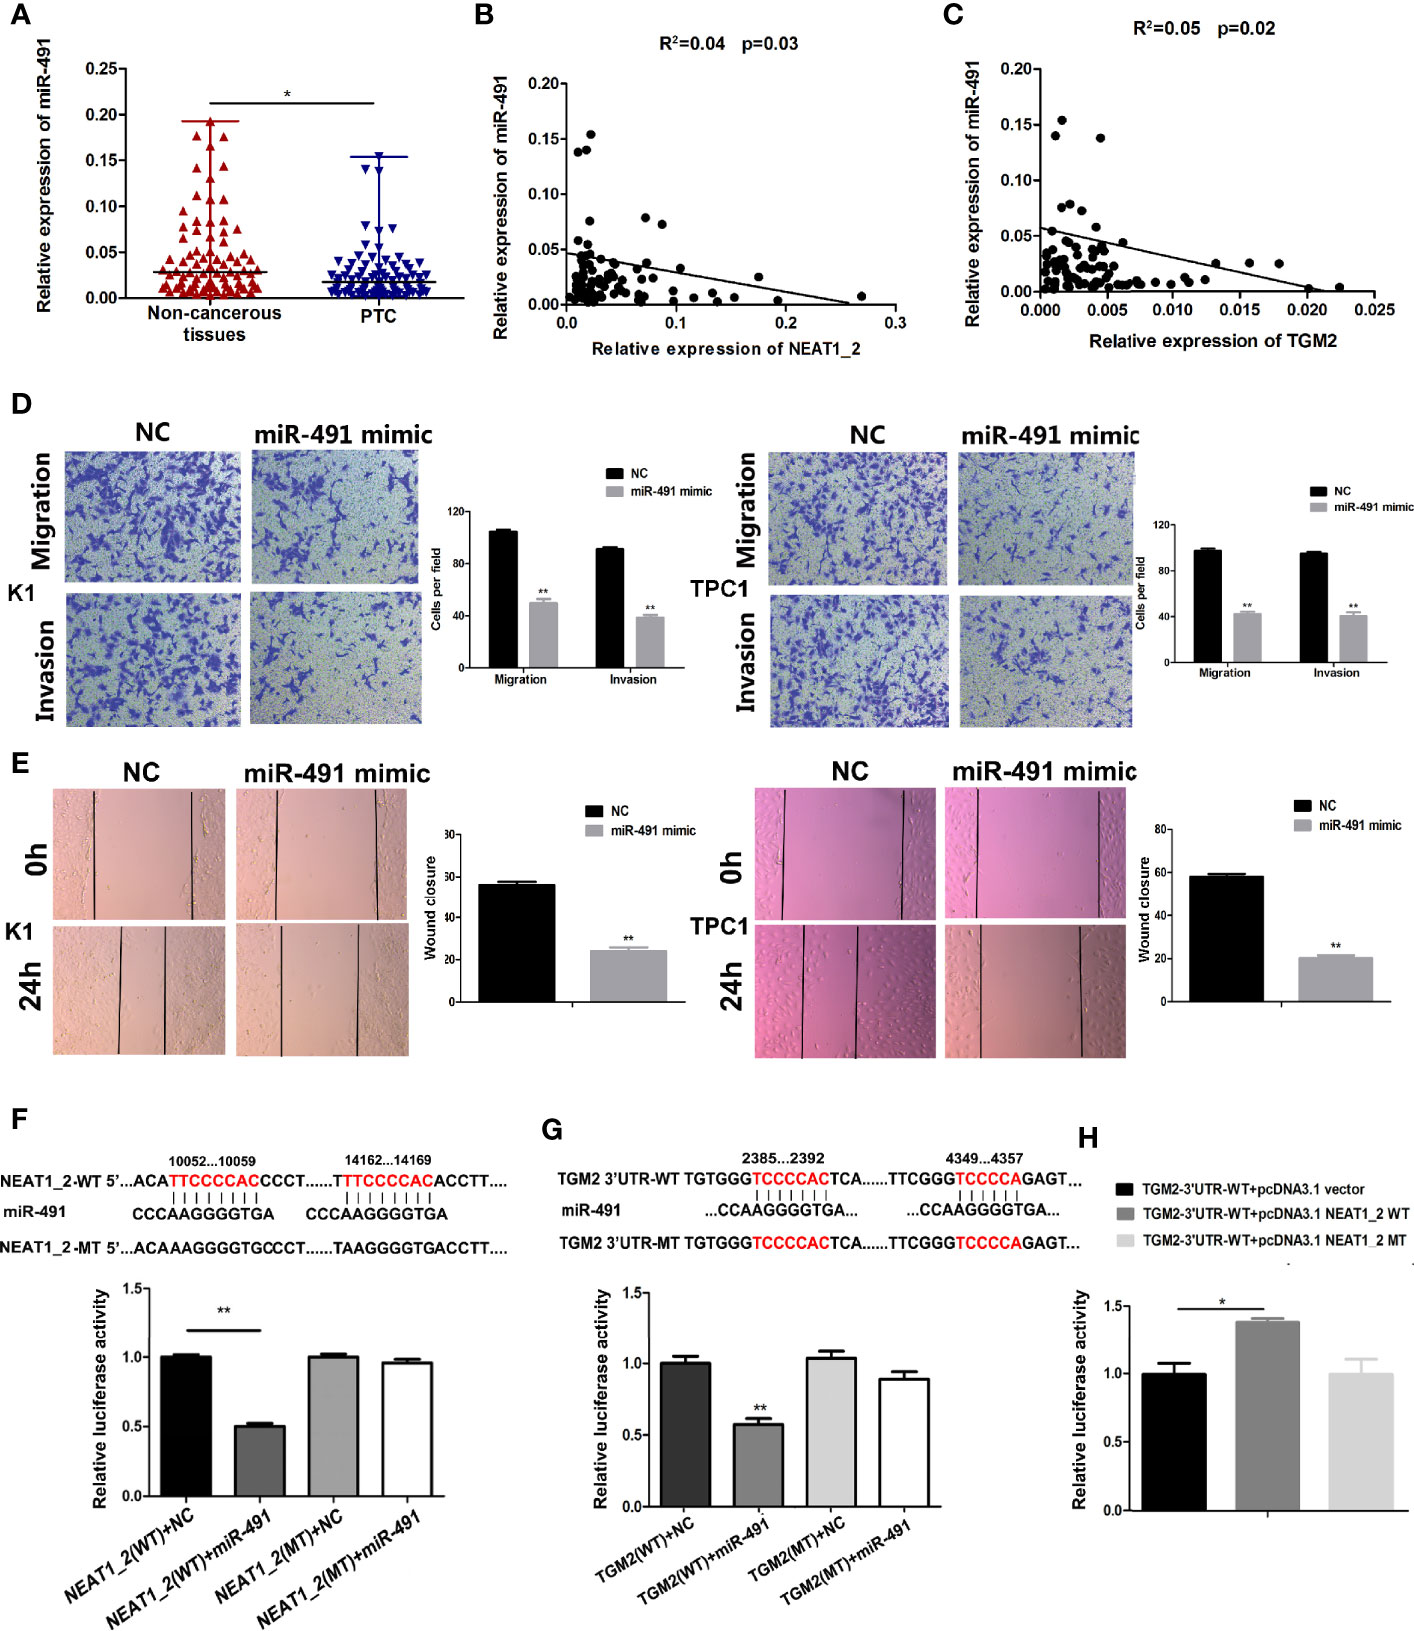
Figure 5 miR-491 inhibited PTC migration and invasion and could directly bind to NEAT1_2 and the 3′ UTR of TGM2. (A) The relative expression levels of miR-491 in 80 pairs of PTC tissues and adjacent non-cancerous tissues, as determined using qRT-PCR. The Wilcoxon signed-rank test was used to analyze the differences between the two groups; data are presented as the median with a range. *P < 0.05. (B) Pearson’s correlation analysis was performed to analyze the correlations between NEAT1_2 and TGM2 expression in PTC tissues (R2 = 0.056, P = 0.042). (C) Pearson’s correlation was performed to analyze the correlations between miR-491 and TGM2 expression in PTC tissues (R2 = 0.05, P = 0.029). (D) Transwell assays were used to evaluate the migration and invasion in PTC cells after transfection with miR-491 mimics or NC. Data are presented as the mean ± S.D., as analyzed using an independent samples t-test. **P < 0.01 versus NC. (E) A wound healing assay was applied to analyze the migration capacity in PTC cells after transfection with miR-491 mimics or NC. All data are presented as the mean ± S.D. (F) The predicted miR-491 binding sites in NEAT1_2 (NEAT1_2-Wt) and the designed mutant sequence (NEAT1_2-Mt) are indicated. HEK 293T cells were transfected with NEAT1_2-Wt, NEAT1_2-Mt, and the indicated miRNAs, and then a luciferase reporter assay was conducted. Data are presented as the mean ± S.D., as analyzed using an independent samples t-test. **P < 0.01 versus NEAT1_2-Wt+NC. (G) The predicted miR-491 binding sites in the 3′-UTR region of TGM2 (TGM2-3′UTR-Wt) and the designed mutant sequence (TGM2-3′UTR-Mt) are indicated. HEK 293T cells were transfected with TGM2-3′UTR-Wt or TGM2-3′UTR-Mt and the indicated miRNAs, and then a luciferase reporter assay was conducted. Data are presented as the mean ± S.D., as analyzed using an independent samples t-test. **P < 0.01 versus TGM2-3′UTR-Wt+NC. (H) TGM2-3′UTR-Wt was cotransfected with vectors pcDNA3.1, pcDNA3.1-NEAT1_2 Wt, and pcDNA3.1-NEAT1_2 Mt, respectively, and then a luciferase reporter assay was conducted. Data are presented as mean ± S.D., as analyzed using an independent samples t-test. **P < 0.01 versus TGM2-3′UTR-Wt+pcDNA3.1 vector.
Bioinformatic Analysis Showed That FN1 Is a Target of TGM2 in PTC
To further investigate the mechanism of TGM2’s involvement in PTC metastasis, we performed correlation analysis of TGM2 in gene expression profiles from the TCGA database. According to the upper quartile value of their TGM2 expression levels, PTC samples (n = 497) were classified as TGM2 high-expression and TGM2 low-expression. In the TGM2 high-expression group, Microsoft Excel 2010 was used to summarize the top 200 significantly upregulated genes (Supplementary Material 1). KEGG and GSEA using the TCGA thyroid cancer dataset was performed. As shown in Figures 6A, B, both KEGG and GSEA indicated that TGM2 was associated the function of Focal adherence and Cell adhesion molecules. By overlapping these two gene sets, 12 genes, which were identified with functions in both Focal adherence and Cell adhesion molecules, were screened using the VENNY tool (Figure 6C). Among these genes, the most relevant gene was FN1 (encoding fibronectin) (r = 0.734, P < 0.0001), which is known to play an extremely important role in both focal adherence and cancer-related metastasis, and was chosen for further mechanistic study (Figure 6D). To confirm the regulatory relationship between TGM2 and FN1, we knocked down the expression of TGM2 in PTC cell lines and found that the mRNA and protein levels of FN1 were dramatically downregulated (Figures 6E, F).
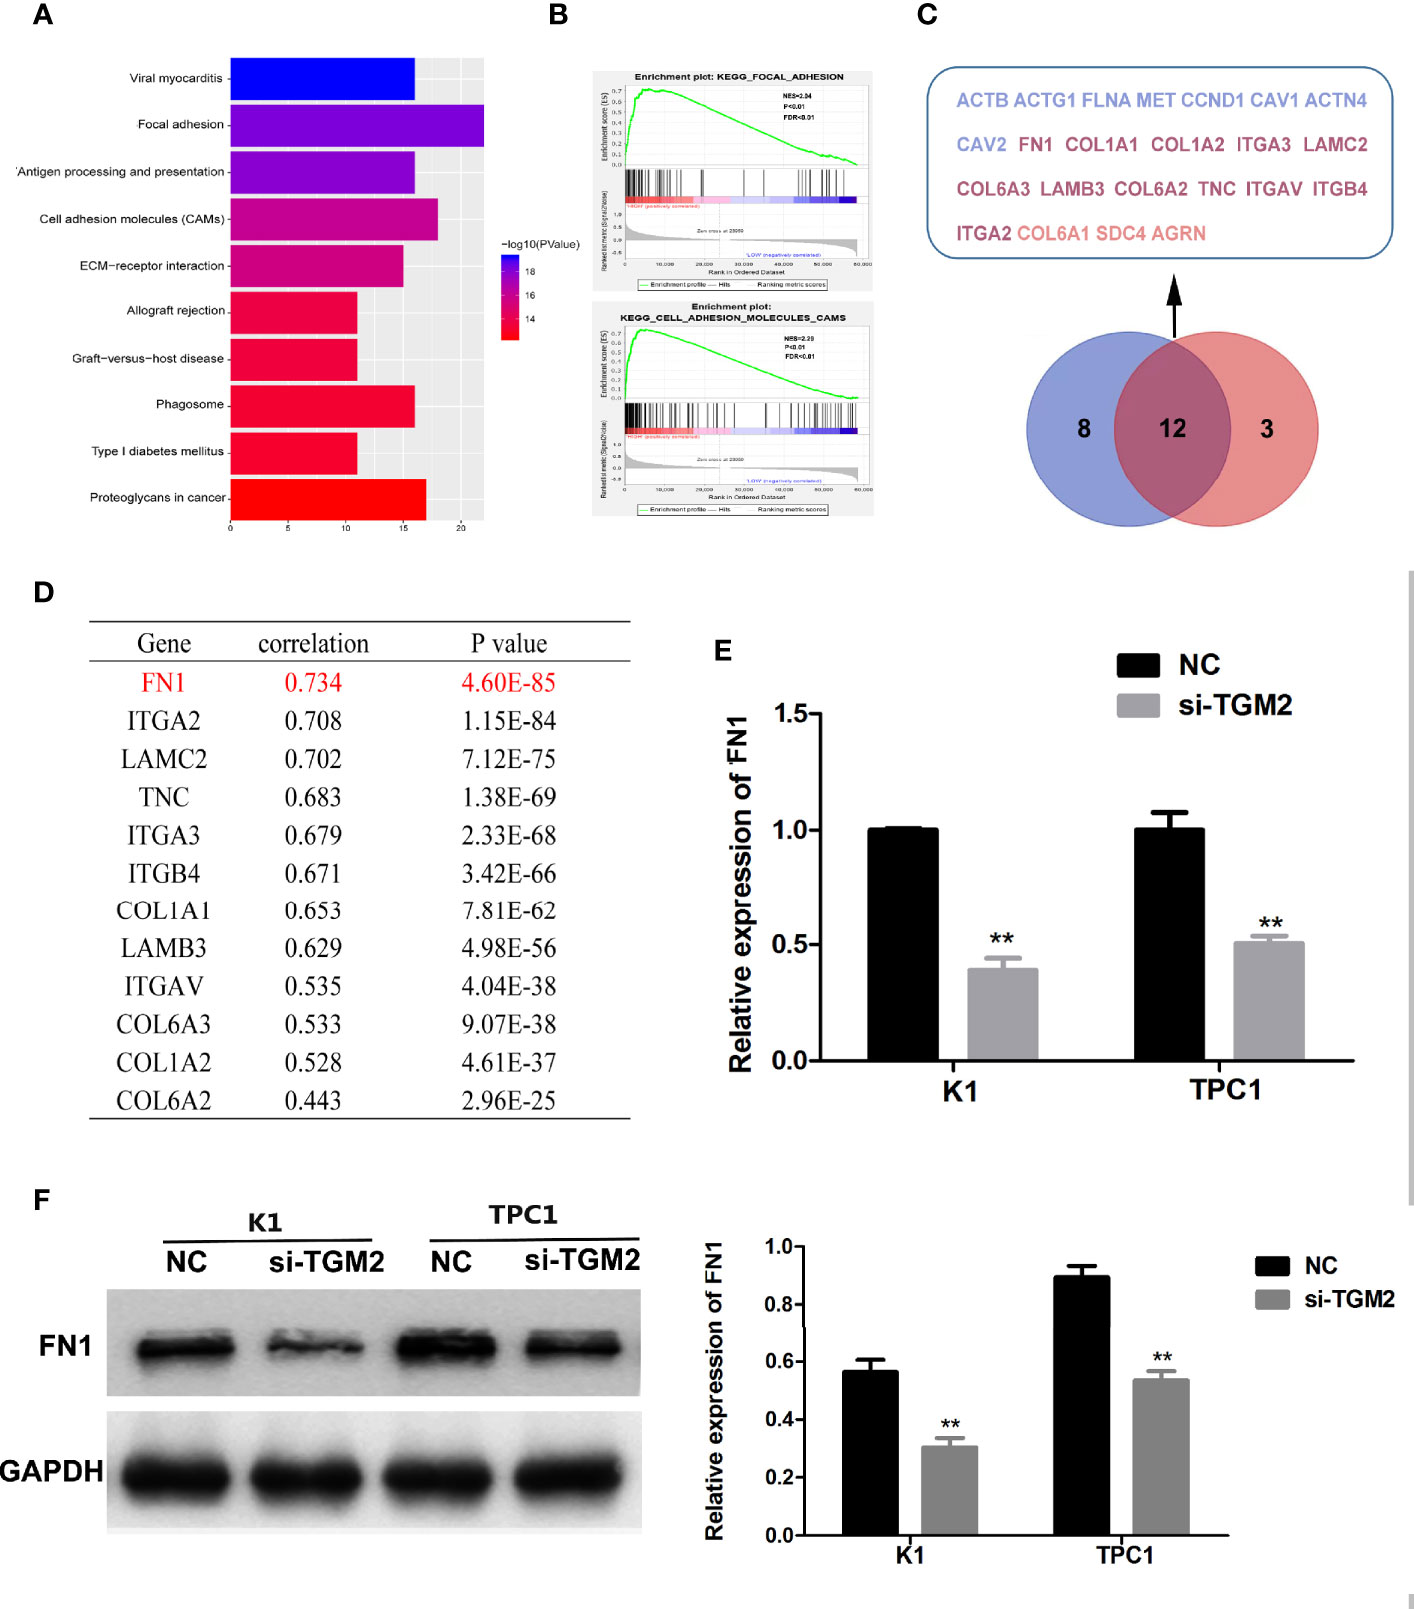
Figure 6 Bioinformatic analysis showing that FN1 is a target of TGM2 in PTC. (A) KEGG analysis of the top 200 differentially upregulated genes in TGM2 high-expression tumors. (B) GSEA highlighting the positive association of upregulated TGM2 expression levels with Focal adherence and Cell adhesion molecules. (C) Venn diagram analysis of the co-expressed genes in the set Focal adherence and Cell adhesion molecules. (D) Pearson’s correlation was performed to analyze the correlations between TGM2 and co-expressed genes in the set Focal adherence and Cell adhesion molecules. (E) The relative mRNA expression of FN1 was detected using qRT-PCR in PTC cells after transfection with si-TGM2 or NC. Data are presented as the mean ± S.D., as analyzed using an independent samples t-test. **P < 0.01 versus NC. (F) Western blotting was applied to detect the protein level of FN1 in PTC cells transfected with si-TGM2 or NC. Data are presented as the mean ± S.D., as analyzed using an independent samples t-test. **P < 0.01 versus NC.
TGM2 Transcriptionally Activates FN1 by Promoting p65 Nuclear Translocation in PTC Cell Lines
TGM2 could regulate FN1 mRNA and protein expression; therefore, TGM2 might regulate FN1 at the transcription level. TGM2 is not a transcription factor. However, studies have reported that TGM2 could trigger cancer invasion by regulating master transcription factors (TFs) or promoting TF nuclear translocation, such as for C/EBPβ, STAT3, and p65 (19). Interestingly, we found that the upregulation of TGM2 could significantly promote the levels of p65 in the nucleus and decreased in cytoplasm (Figure 7A). Then, using a cell immunofluorescence assay, we found similar results: The p65 fluorescence intensity in the nucleus increased significantly in the TGM2 overexpression group compared with its level in the control group (Figure 7B). P65 overexpression resulted in significant upregulation of FN1 mRNA and protein levels (Figures 7C, D). To further explore the regulatory mechanism of FN1 in PTC, we matched the promoter sequences of FN1 with potential transcription factors using JASPAR and found four potential binding sites for p65 in the FN1 promoter (Figure 7E). Moreover, we performed a luciferase assay to further investigate the specific binding sites between p65 and the FN1 promoter. As shown in Figure 7F, luciferase activity was elevated in wild-type group, but failed to affect that from mutation group, indicating that p65 could indeed bind to the promoter of FN1. To further detect the specific binding sites of p65 in FN1, we constructed a luciferase reporter vector containing the FN1 promoter or containing mutant site 1, site 2, site 3, or site 4. The results showed that the luciferase activity resulting from p65 overexpression was abolished only when site 4 was mutated (Figure 7G). Therefore, site 4 was responsible for the transcription activation of p65 on FN1. All these results indicated that TGM2 transcriptional activated FN1 by promoting p65 nuclear translocation in PTC cell lines.
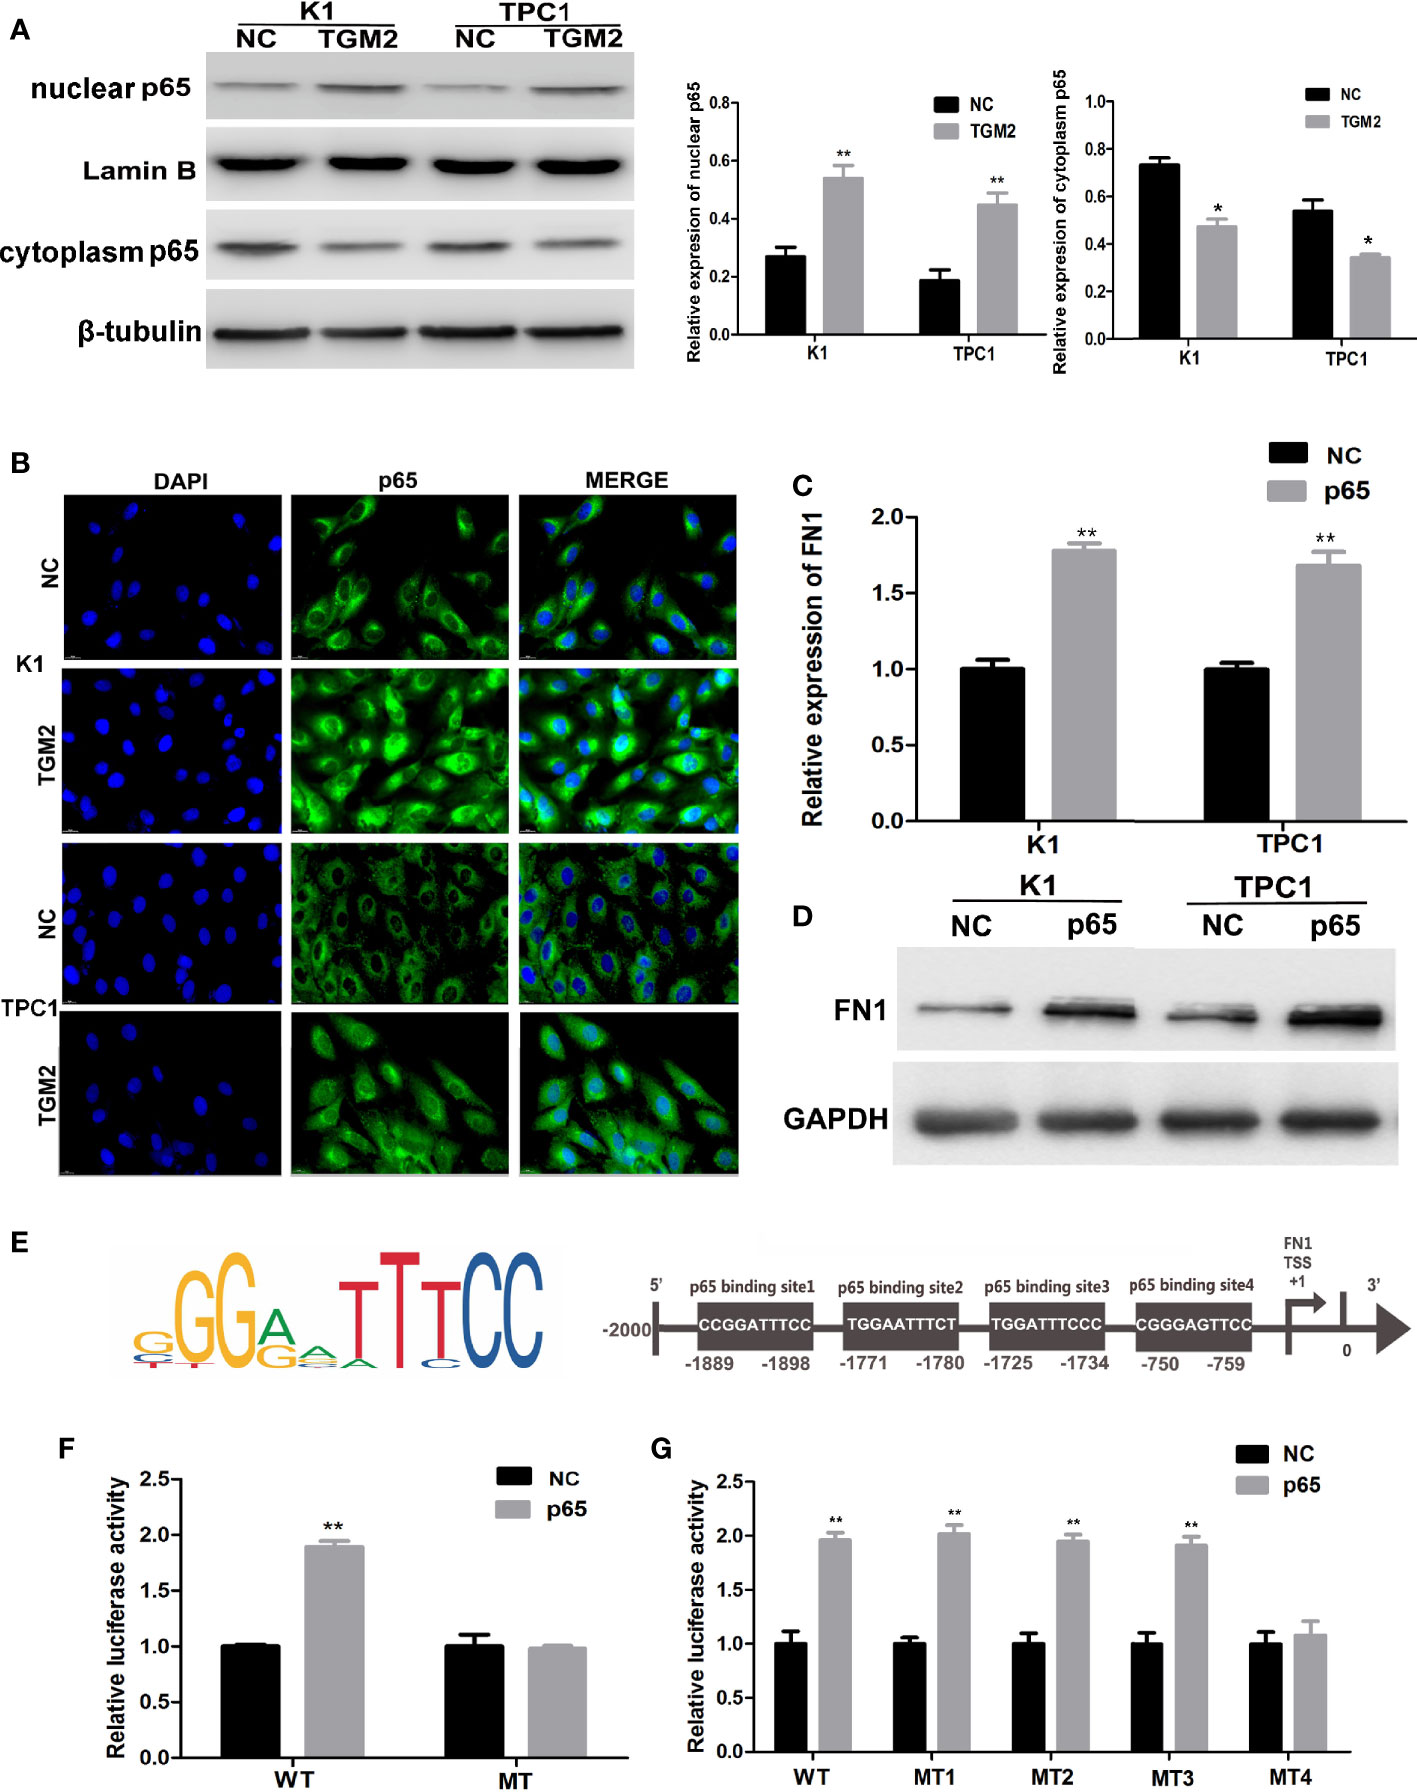
Figure 7 TGM2 transcriptionally activates FN1 by promoting p65 nuclear translocation in PTC cell lines. (A) Overexpression of TGM2 activates p65 nuclear translocation in PTC cells, as measured using western blot assays. Data are presented as the mean ± S.D., as analyzed using an independent samples t-test. *P < 0.05; **P < 0.01 versus NC. (B) Overexpression of TGM2 activates p65 nuclear translocation in PTC, as measured using immunofluorescence staining. (C) qRT-PCR was applied to detect the protein level of FN1 in PTC cells transfected with p65 or NC. Data are presented as the mean ± S.D., as analyzed using an independent samples t-test. **P < 0.01 versus NC. (D) Western blotting was applied to detect the protein level of FN1 in PTC cells transfected with p65 or NC. Data are presented as the mean ± S.D., as analyzed using an independent samples t-test. **P < 0.01 versus NC. (E) Prediction of the p65 binding site in the FN1 promoter region using JASPAR (http://jaspar.genereg.net/). (F) The effect of overexpression of p65 on luciferase activity of a vector containing the FN1 wild-type promoter or mutated promoter. Data are presented as the mean ± S.D., as analyzed using an independent samples t-test. **P < 0.01 versus NC. (G) The effect of p65 overexpression on the luciferase activity of a vector containing the FN1 wild−type promoter or mutation site 1, mutation site 2, mutation site 3, or mutation site 4. Data are presented as the mean ± S.D., as analyzed using an independent samples t-test. **P < 0.01 versus NC.
Discussion
The various forms of PTC are characterized as differentiated cancers, and PTCs alone account for more than 80% of all thyroid tissue malignancies (2). According to American Joint Committee on Cancer 8th stage for differentiated thyroid cancer, local invasion and distant metastasis are critical factors affecting the prognosis of patients with thyroid cancer (5). However, so far, there are no effective therapeutic targets and biomarkers for thyroid cancer with invasion and metastasis. Therefore, there is an urgent need to determine the molecular mechanism of PTC, which will allow the development of new and effective therapeutic approaches.
Over the past decades, aberrant expression of lncRNAs in cancers has been widely observed and has been reported to correlate with tumorigenesis. Our previous microarray study reported a genome-wide analysis on the expression profile of lncRNAs and identified 3499 lncRNAs that were differentially expressed (fold change ≥ 2.0, P < 0.05) in five paired PTC tissues and non-cancerous tissues (20). Among them, we found that NEAT1_2, a transcript of NEAT1, was significantly overexpressed in PTC tissues compared with adjacent non-cancerous tissues (fold change = 4.65, p < 0.05) (20). Recent studies indicated that NEAT1 is upregulated and plays a functional role in tumorigenesis. For example, NEAT1 can promote prostate cancer by regulating ACSL4 via sponging miR-34a-5p and miR-204-5p, and promotes the growth of gastric cancer cells by regulating the miR-497-5p/PIK3R1 axis (9, 21). Moreover, NEAT1 expression is a novel prognostic and diagnostic biomarker in gastric cancer, colorectal cancer, esophageal squamous cell carcinoma, and prostate cancer (22). Our previous study demonstrated that knockdown of NEAT1_2 induced apoptosis and inhibited the migration and invasion of PTC cells by regulating ATAD2 (12). However, rescue experiments indicated that ATAD2 was not the only downstream target of NEAT1_2 (12). This means that there must be other downstream targets that mediate the invasion and metastasis of PTC. Thus, identifying further target genes of NEAT1_2 in PTC invasion and metastasis was the main focus of this study.
Through mRNA sequencing of transfected si-NEAT1_2 K1 cells and NC K1 cell, we identified that TGM2 was downregulated by 66.67% after NEAT1_2 knockdown. In 80-paired PTC tissues and non-cancerous tissues, the expression of TGM2 mRNA correlated positively with that of NEAT1_2. Then, knockdown of NEAT1_2 in two PTC cell lines using si-NEAT1_2 downregulated TGM2 mRNA and protein expression, suggesting that NEAT1_2 could regulate the expression of TGM2 in PTC.
TGM2 is a complex and widely present member of the transglutaminase family, responsible for the calcium-dependent posttranslational modification of proteins, in which stable ϵ-(γ-glutamyl) lysine isopeptide linkages are introduced or polyamines are incorporated at certain peptide-bound glutamine residues (23). Recent studies have implicated TGM2 in various biological processes, including cell differentiation, extracellular matrix (ECM) stabilization, and cell migration (24). For example, TGM2 could regulate angiogenesis and apoptosis via Wnt/β-catenin pathway in colorectal cancer and TGM2 inhibition reversed mesenchymal transdifferentiation by regulating C/EBPβ signaling in glioma stem cells (25–27). However, whether TGM2 functions in PTC is unknown. The results of the present study demonstrated that PTC tissues overexpressed TGM2 compared with adjacent non-cancerous tissues. In addition, overexpression of TGM2 was associated with lymph node metastasis and extrathyroidal extension in PTC tissues. TGM2 knockdown significantly affected PTC cell migration and invasion, suggesting an oncogenic role for TGM2 in PTC. A “rescue” strategy comprising cotransfecting pCDNA3.1-TGM2 and si-NEAT1_2 not only increased TGM2 protein expression, but also rescued the inhibition of migration, invasion, and metastasis in PTC cell lines or in vitro. Taken together, these results suggested that TGM2 acts as an oncogene in PTC invasion or metastasis, under the regulation of NEAT1_2.
LncRNAs can modulate miRNA functions by acting as ceRNAs (also known as molecular sponges) (28). In the development of different cancers, NEAT1 has been observed to function as a ceRNA (9–11). This led us to speculate that NEAT1_2 regulates TGM2 expression in PTC by acting as a ceRNA to sponge miRNAs. Bioinformatic analyses identified 22 miRNAs with binding sites for NEAT1_2 and for the 3′ UTR of TGM2. qRT-PCR and western blotting showed that only miR-491 could reduce TGM2 expression in PTC cells. Hence, we speculated that miR-491 could bind both the 3′ UTR of TGM2 and NEAT1_2.
The gene encoding miR-491 resides in the 9p21.3 region, and recent studies have shown that miR-491 functions as an important tumor suppressor (29). miR-491 affects apoptosis and proliferation in pancreatic carcinoma, ovarian carcinoma, and breast cancer; and reduces the invasive behavior of human hepatocellular carcinoma, breast cancer, and oral squamous cancer (30–35). However, whether miR-491 functions in PTC is not clear. Consistently, we found that miR-491 was overexpressed in 80 paired non-cancerous tissues compared with that in PTC tissues. The expression of miR-491 was significantly inversely correlated with NEAT1_2 and TGM2 expression. Next, PTC cell invasion and migration were inhibited significantly by miR-491 overexpression. Dual luciferase reporter assays suggested that miR-491 is the specific miRNA that binds to both the 3′ UTR of TGM2 and NEAT1_2. In addition, NEAT1_2 sponges miR-491 to regulate TGM2 expression, revealing the mechanism by which NEAT1_2 modulates TGM2 expression to promote migration or invasion of PTC.
KEGG and GSEA analysis of the top 200 significantly upregulated genes in the TGM2 high-expression group from the TCGA database found that high expression of TGM2 correlated significantly with Focal adherence and Cell adhesion molecules, which are significantly related to cancer invasion and metastasis (36). Among the genes that were highly positive correlated with TGM2 was FN1, which is involved in both Focal adherence and Cell adhesion molecules. FN1, a glycoprotein, has major roles in cell growth, differentiation, migration, and adhesion, and is vital for embryonic development and wound-healing (37). Degradation or alteration of FN1 expression has been associated with cancer progression, such as in squamous cell carcinoma, nasopharyngeal carcinoma, ovarian cancer, and renal cancer (37–39). Moreover, studies have reported that FN1 is overexpressed and associated with lymph node metastasis in PTC (40, 41). In the present study, we found that TGM2 could regulate the mRNA and protein of levels of FN1, indicating that TGM2 might regulate FN1 at the transcription level. Although TGM2 is not a TF, it can trigger cancer progression by regulating master TFs or promoting TF nuclear translocation. For example, TGM2 could form complexes with NFκb components and promote p65 nuclear translocation (15, 42). P65 could further activate IL−6 in mantle cell lymphoma cells, or hypoxia inducible factor (HIF), vascular endothelial growth factor (VEGF) and EMT-associated proteins in breast cancer (15, 42). Bioinformatic prediction identified four binding sites between p65 and the promoter of FN1. Thus, we speculated that TGM2 might regulate FN1 transcription by promoting p65 nuclear translocation. Upregulation of TGM2 significantly promoted the p65 level in the nuclei of PTC cell lines, and overexpression of p65 significantly upregulated the mRNA and protein levels of FN1. Luciferase assays using wild-type and mutant FN1 promoters confirmed that p65 binds to the FN1 promoter via binding site 4 among four putative binding sites. All these results suggested that TGM2 promoted the nuclear translocation of p65, where p65 transcriptional activates FN1, finally promoting invasion and metastasis of PTC.
Conclusions
In conclusion, our study identified that the lncRNA NEAT1_2 might act as a ceRNA to sponge miR-491, thus regulating TGM2 expression. TGM2 could transcriptionally activate FN1 via the binding of p65 to the FN1 promoter, thereby promoting the invasion and metastasis of PTC. These data regarding the multiple mechanisms of NEAT1_2 in PTC increase our understanding of the detailed molecular mechanisms associated with PTC progression.
Data Availability Statement
The datasets presented in this study can be found in online repositories. The names of the repository/repositories and accession number(s) can be found below: https://www.ncbi.nlm.nih.gov/geo/query/acc.cgi?acc=GSE159905.
Ethics Statement
The studies involving human participants were reviewed and approved by the Ethics Committee of the First Affiliated Hospital of China Medical University. The patients/participants provided their written informed consent to participate in this study. All animal studies were conducted in accordance with the principles and procedures outlined in the guidelines of the Institutional Animal Care and Use Committee (IACUC) of China Medical University (IACUC approval number: TZ2019137).
Author Contributions
Conceived and designed the experiments: WS, HZ, WD, ZW, LH, TZ, and YQ. Performed the experiments: WS and YQ. Analyzed the data: WS and HZ. Wrote the paper: WS. All authors contributed to the article and approved the submitted version.
Funding
This work was supported by the National Natural Science Foundation of China (grant number 81902726), the Project funded by China Postdoctoral Science Foundation (grant number 2018M641739), and Natural Science Foundation of Liaoning Province (grant number 20180530090).
Conflict of Interest
The authors declare that the research was conducted in the absence of any commercial or financial relationships that could be construed as a potential conflict of interest.
Supplementary Material
The Supplementary Material for this article can be found online at: https://www.frontiersin.org/articles/10.3389/fonc.2021.610547/full#supplementary-material
Supplement Material 1 | The top 200 significantly upregulated genes in the TGM2 high-expression group.
References
1. Torre LA, Bray F, Siegel RL, Ferlay J, Lortet-Tieulent J, Jemal A. Global cancer statistics, 2012. CA Cancer J Clin (2015) 65:87–108. doi: 10.3322/caac.21262
2. Davies L, Welch HG. Current thyroid cancer trends in the United States. JAMA Otolaryngol Head Neck Surg (2014) 140:317–22. doi: 10.1001/jamaoto.2014.1
3. Hundahl SA, Fleming ID, Fremgen AM, Menck HR. A National Cancer Data Base report on 53,856 cases of thyroid carcinoma treated in the U.S., 1985-1995 [see comments]. Cancer-Am Cancer Soc (1998) 83:2638–48. doi: 10.1002/(SICI)1097-0142(19981215)83:12<2638::AID-CNCR31>3.0.CO;2-1
4. Shoup M, Stojadinovic A, Nissan A, Ghossein RA, Freedman S, Brennan MF, et al. Prognostic indicators of outcomes in patients with distant metastases from differentiated thyroid carcinoma. J Am Coll Surg (2003) 197:191–7. doi: 10.1016/S1072-7515(03)00332-6
5. Lamartina L, Grani G, Arvat E, Nervo A, Zatelli MC, Rossi R, et al. 8th edition of the AJCC/TNM staging system of thyroid cancer: what to expect (ITCO#2). Endocr Relat Cancer (2018) 25:L7–L11. doi: 10.1530/ERC-17-0453
6. Zheng H, Wang M, Jiang L, Chu H, Hu J, Ning J, et al. BRAF-Activated Long Noncoding RNA Modulates Papillary Thyroid Carcinoma Cell Proliferation through Regulating Thyroid Stimulating Hormone Receptor. Cancer Res Treat (2016) 48:698–707. doi: 10.4143/crt.2015.118
7. Uszczynska-Ratajczak B, Lagarde J, Frankish A, Guigo R, Johnson R. Towards a complete map of the human long non-coding RNA transcriptome. Nat Rev Genet (2018) 19:535–48. doi: 10.1038/s41576-018-0017-y
8. Fernandes J, Acuna SM, Aoki JI, Floeter-Winter LM, Muxel SM. Long Non-Coding RNAs in the Regulation of Gene Expression: Physiology and Disease. Noncoding RNA. (2019) 5:17. doi: 10.3390/ncrna5010017
9. Jiang X, Guo S, Zhang Y, Zhao Y, Li X, Jia Y, et al. LncRNA NEAT1 promotes docetaxel resistance in prostate cancer by regulating ACSL4 via sponging miR-34a-5p and miR-204-5p. Cell Signal (2020) 65:109422. doi: 10.1016/j.cellsig.2019.109422
10. Yu PF, Wang Y, Lv W, Kou D, Hu HL, Guo SS, et al. LncRNA NEAT1/miR-1224/KLF3 contributes to cell proliferation, apoptosis and invasion in lung cancer. Eur Rev Med Pharmacol Sci (2019) 23:8403–10. doi: 10.26355/eurrev_201910_19151
11. Li X, Zhou Y, Yang L, Ma Y, Peng X, Yang S, et al. LncRNA NEAT1 promotes autophagy via regulating miR-204/ATG3 and enhanced cell resistance to sorafenib in hepatocellular carcinoma. J Cell Physiol (2020) 235:3402–13. doi: 10.1002/jcp.29230
12. Sun W, Lan X, Zhang H, Wang Z, Dong W, He L, et al. NEAT1_2 functions as a competing endogenous RNA to regulate ATAD2 expression by sponging microRNA-106b-5p in papillary thyroid cancer. Cell Death Dis (2018) 9:380. doi: 10.1038/s41419-018-0418-z
14. Gundemir S, Colak G, Tucholski J, Johnson GV. Transglutaminase 2: a molecular Swiss army knife. Biochim Biophys Acta (2012) 1823:406–19. doi: 10.1016/j.bbamcr.2011.09.012
15. Agnihotri N, Kumar S, Mehta K. Tissue transglutaminase as a central mediator in inflammation-induced progression of breast cancer. Breast Cancer Res (2013) 15(1):202. doi: 10.1186/bcr3371
16. Cho SY, Oh Y, Jeong EM, Park S, Lee D, Wang X, et al. Amplification of transglutaminase 2 enhances tumor-promoting inflammation in gastric cancers. Exp Mol Med (2020) 52:854–64. doi: 10.1038/s12276-020-0444-7
17. Adhikary G, Grun D, Alexander HR, Friedberg JS, Xu W, Keillor JW, et al. Transglutaminase is a mesothelioma cancer stem cell survival protein that is required for tumor formation. Oncotarget (2018) 9:34495–505. doi: 10.18632/oncotarget.26130
18. Leicht DT, Kausar T, Wang Z, Ferrer-Torres D, Wang TD, Thomas DG, et al. TGM2: a cell surface marker in esophageal adenocarcinomas. J Thorac Oncol (2014) 9:872–81. doi: 10.1097/JTO.0000000000000229
19. Huang H, Chen Z, Ni X. Tissue transglutaminase-1 promotes stemness and chemoresistance in gastric cancer cells by regulating Wnt/beta-catenin signaling. Exp Biol Med (Maywood) (2017) 242:194–202. doi: 10.1177/1535370216670541
20. Lan X, Zhang H, Wang Z, Dong W, Sun W, Shao L, et al. Genome-wide analysis of long noncoding RNA expression profile in papillary thyroid carcinoma. Gene (2015) 569:109–17. doi: 10.1016/j.gene.2015.05.046
21. Xia TF, Chen J, Wu K, Zhang J, Yan Q. Long noncoding RNA NEAT1 promotes the growth of gastric cancer cells by regulating miR-497-5p/PIK3R1 axis. Eur Rev Med Pharmacol Sci (2019) 23:6914–26. doi: 10.26355/eurrev_201908_18731
22. Yu X, Li Z, Zheng H, Chan MT, Wu WK. NEAT1: A novel cancer-related long non-coding RNA. Cell Prolif (2017) 50:e12329. doi: 10.1111/cpr.12329
23. Lorand L, Graham RM. Transglutaminases: crosslinking enzymes with pleiotropic functions. Nat Rev Mol Cell Biol (2003) 4:140–56. doi: 10.1038/nrm1014
24. Eckert RL, Kaartinen MT, Nurminskaya M, Belkin AM, Colak G, Johnson GV, et al. Transglutaminase regulation of cell function. Physiol Rev (2014) 94:383–417. doi: 10.1152/physrev.00019.2013
25. Yin J, Oh YT, Kim JY, Kim SS, Choi E, Kim TH, et al. Transglutaminase 2 Inhibition Reverses Mesenchymal Transdifferentiation of Glioma Stem Cells by Regulating C/EBPbeta Signaling. Cancer Res (2017) 77:4973–84. doi: 10.1158/0008-5472.CAN-17-0388
26. Yang P, Yu D, Zhou J, Zhuang S, Jiang T. TGM2 interference regulates the angiogenesis and apoptosis of colorectal cancer via Wnt/beta-catenin pathway. Cell Cycle (2019) 18:1122–34. doi: 10.1080/15384101.2019.1609831
27. He W, Sun Z, Liu Z. Silencing of TGM2 reverses epithelial to mesenchymal transition and modulates the chemosensitivity of breast cancer to docetaxel. Exp Ther Med (2015) 10:1413–8. doi: 10.3892/etm.2015.2679
28. Li X, Liu Y, Granberg KJ, Wang Q, Moore LM, Ji P, et al. Two mature products of MIR-491 coordinate to suppress key cancer hallmarks in glioblastoma. Oncogene (2015) 34:1619–28. doi: 10.1038/onc.2014.98
29. Guo R, Wang Y, Shi WY, Liu B, Hou SQ, Liu L. MicroRNA miR-491-5p targeting both TP53 and Bcl-XL induces cell apoptosis in SW1990 pancreatic cancer cells through mitochondria mediated pathway. Molecules (2012) 17:14733–47. doi: 10.3390/molecules171214733
30. Leivonen SK, Sahlberg KK, Makela R, Due EU, Kallioniemi O, Borresen-Dale AL, et al. High-throughput screens identify microRNAs essential for HER2 positive breast cancer cell growth. Mol Oncol (2014) 8:93–104. doi: 10.1016/j.molonc.2013.10.001
31. Denoyelle C, Lambert B, Meryet-Figuiere M, Vigneron N, Brotin E, Lecerf C, et al. miR-491-5p-induced apoptosis in ovarian carcinoma depends on the direct inhibition of both BCL-XL and EGFR leading to BIM activation. Cell Death Dis (2014) 5:e1445. doi: 10.1038/cddis.2014.389
32. Huang WC, Chan SH, Jang TH, Chang JW, Ko YC, Yen TC, et al. miRNA-491-5p and GIT1 serve as modulators and biomarkers for oral squamous cell carcinoma invasion and metastasis. Cancer Res (2014) 74:751–64. doi: 10.1158/0008-5472.CAN-13-1297
33. Rutnam ZJ, Yang BB. The non-coding 3’ UTR of CD44 induces metastasis by regulating extracellular matrix functions. J Cell Sci (2012) 125:2075–85. doi: 10.1242/jcs.100818
34. Zhou Y, Li Y, Ye J, Jiang R, Yan H, Yang X, et al. MicroRNA-491 is involved in metastasis of hepatocellular carcinoma by inhibitions of matrix metalloproteinase and epithelial to mesenchymal transition. Liver Int (2013) 33:1271–80. doi: 10.1111/liv.12190
35. Yang X, Ye J, Yan H, Tang Z, Shen J, Zhang J, et al. MiR-491 attenuates cancer stem cells-like properties of hepatocellular carcinoma by inhibition of GIT-1/NF-kappaB-mediated EMT. Tumour Biol (2016) 37:201–9. doi: 10.1007/s13277-015-3687-5
36. Samanta D, Almo SC. Nectin family of cell-adhesion molecules: structural and molecular aspects of function and specificity. Cell Mol Life Sci (2015) 72:645–58. doi: 10.1007/s00018-014-1763-4
37. Sung CO, Park CK, Kim SH. Classification of epithelial-mesenchymal transition phenotypes in esophageal squamous cell carcinoma is strongly associated with patient prognosis. Mod Pathol (2011) 24:1060–8. doi: 10.1038/modpathol.2011.59
38. Xiao J, Yang W, Xu B, Zhu H, Zou J, Su C, et al. Expression of fibronectin in esophageal squamous cell carcinoma and its role in migration. BMC Cancer (2018) 18:976. doi: 10.1186/s12885-018-4850-3
39. Takayasu H, Horie H, Hiyama E, Matsunaga T, Hayashi Y, Watanabe Y, et al. Frequent deletions and mutations of the beta-catenin gene are associated with overexpression of cyclin D1 and fibronectin and poorly differentiated histology in childhood hepatoblastoma. Clin Cancer Res (2001) 7:901–8.
40. Zhai T, Muhanhali D, Jia X, Wu Z, Cai Z, Ling Y. Identification of gene co-expression modules and hub genes associated with lymph node metastasis of papillary thyroid cancer. Endocrine (2019) 66:573–84. doi: 10.1007/s12020-019-02021-9
41. Liu C, Feng Z, Chen T, Lv J, Liu P, Jia L, et al. Downregulation of NEAT1 reverses the radioactive iodine resistance of papillary thyroid carcinoma cell via miR-101-3p/FN1/PI3K-AKT signaling pathway. Cell Cycle (2019) 18:167–203. doi: 10.1080/15384101.2018.1560203
Keywords: papillary thyroid cancer, lncRNA, TGM2, FN1, NEAT1_2
Citation: Sun W, Qin Y, Wang Z, Dong W, He L, Zhang T and Zhang H (2021) The NEAT1_2/miR-491 Axis Modulates Papillary Thyroid Cancer Invasion and Metastasis Through TGM2/NFκb/FN1 Signaling. Front. Oncol. 11:610547. doi: 10.3389/fonc.2021.610547
Received: 26 September 2020; Accepted: 11 January 2021;
Published: 02 March 2021.
Edited by:
Rengyun Liu, The First Affiliated Hospital of Sun Yat-Sen University, ChinaReviewed by:
David Alvarado, Washington University School of Medicine in St. Louis, United StatesMyriem Boufraqech, National Cancer Institute (NCI), United States
Copyright © 2021 Sun, Qin, Wang, Dong, He, Zhang and Zhang. This is an open-access article distributed under the terms of the Creative Commons Attribution License (CC BY). The use, distribution or reproduction in other forums is permitted, provided the original author(s) and the copyright owner(s) are credited and that the original publication in this journal is cited, in accordance with accepted academic practice. No use, distribution or reproduction is permitted which does not comply with these terms.
*Correspondence: Hao Zhang, aGFvemhhbmdAY211LmVkdS5jbg==