 Shengyu Fang1†
 Ziwen Fan2†Zhiyan Sun1
 Yiming Li2
 Xing Liu3Yuchao Liang2
 Yukun Liu2Chunyao Zhou2Qiang Zhu2Hong Zhang2Tianshi Li2
 Shaowu Li4
 Tao Jiang1,2
 Yinyan Wang1,2*‡Lei Wang2*‡
- 1Beijing Neurosurgical Institute, Capital Medical University, Beijing, China
- 2Department of Neurosurgery, Beijing Tiantan Hospital, Capital Medical University, Beijing, China
- 3Department of Pathology, Beijing Tiantan Hospital, Capital Medical University, Beijing, China
- 4Department of Neuroradiology, Beijing Tiantan Hospital, Capital Medical University, Beijing, China
The detection of mutations in telomerase reverse transcriptase promoter (pTERT) is important since preoperative diagnosis of pTERT status helps with evaluating prognosis and determining the surgical strategy. Here, we aimed to establish a radiomics-based machine-learning algorithm and evaluated its performance with regard to the prediction of mutations in pTERT in patients with World Health Organization (WHO) grade II gliomas. In total, 164 patients with WHO grade II gliomas were enrolled in this retrospective study. We extracted a total of 1,293 radiomics features from multi-parametric magnetic resonance imaging scans. Elastic net (used for feature selection) and support vector machine with linear kernel were applied in nested 10-fold cross-validation loops. The predictive model was evaluated by receiver operating characteristic and precision-recall analyses. We performed an unpaired t-test to compare the posterior predictive probabilities among patients with differing pTERT statuses. We selected 12 valuable radiomics features using nested 10-fold cross-validation loops. The area under the curve (AUC) was 0.8446 (95% confidence interval [CI], 0.7735–0.9065) with an optimal summed value of sensitivity of 0.9355 (95% CI, 0.8802–0.9788) and specificity of 0.6197 (95% CI, 0.5071–0.7371). The overall accuracy was 0.7988 (95% CI, 0.7378–0.8598). The F1-score was 0.8406 (95% CI, 0.7684–0.902) with an optimal precision of 0.7632 (95% CI, 0.6818–0.8364) and recall of 0.9355 (95% CI, 0.8802–0.9788). Posterior probabilities of pTERT mutations were significantly different between patients with wild-type and mutant TERT promoters. Our findings suggest that a radiomics analysis with a machine-learning algorithm can be useful for predicting pTERT status in patients with WHO grade II glioma and may aid in glioma management.
Introduction
Large-scale tumor genomics research has altered the perspective of tumor research by revealing a novel method for classification of central nervous system (CNS) tumors, especially for the most malignant primary brain tumor: gliomas. Currently, gliomas are primarily classified based on the molecular characteristics of tumor tissues according to the 2016 World Health Organization (WHO) classification of CNS tumors (1), with the status of these molecular biomarkers guiding the chemotherapy and radiation therapy strategies after surgical resection. Based on these new classification standards, glioblastomas and oligodendrogliomas often exhibit mutations in the telomerase reverse transcriptase promoter (pTERT) (1, 2). The function of TERT is to maintain telomere length, which shortens with each division of normal cells (3, 4). When pTERT is mutated, TERT is upregulated, resulting in maintenance of cellular growth (5). Mutations in pTERT can be detected in a variety of tumors. In high-grade glioma glioblastoma and low-grade glioma oligodendroglioma, mutations in pTERT can be detected with a high probability. According to the cIMPACT-NOW update, mutations in pTERT usually suggest a better prognosis in IDH-mutant diffuse gliomas. Conversely, mutations in pTERT in IDH-wild-type diffuse gliomas and glioblastomas suggest a poor prognosis (6). Thus, determining pTERT status can be helpful for predicting prognosis and optimizing clinical treatment targets.
Radiomics analysis has been widely adopted in the field of preoperative prediction in gliomas. The use of radiomics to analyze the WHO grades, molecular characteristics, and clinical outcomes of tumor tissue via preoperative magnetic resonance imaging (MRI) has produced good results (7–10). However, the predominant focus of many prior studies has been the prediction of the subtype combination of pTERT and IDH, which has demonstrated moderate performance (11, 12), rather than the status of pTERT alone. Other studies have exhibited superior performance at predicting pTERT status in patients, including those with higher-grade gliomas (WHO grade III or IV) (13, 14). In this regard, pTERT status in WHO grade II gliomas has rarely been predicted directly. In addition, the limited sample sizes used in previous prediction models pose several issues arising from overfitting when generalizing to other patient populations.
In the present study, we aimed to investigate the potential association between radiomics features and pTERT mutations by selecting valuable radiomics-based features. Based on extracted radiomics features from conventional MRI sequences used in most hospitals and clinical centers, we attempt to preoperatively predict the pTERT mutation status of WHO grade II gliomas by developing a machine-learning-based predictive model with limited overfitting and bias via a nested 10-fold cross-validation.
Materials and Methods
Patients
The clinical histories of 275 patients with pathologically confirmed primary WHO grade II gliomas were retrospectively collected from the CGGA database from June 2014 to June 2019. The following inclusion criteria were used: (a) adult (age ≥18 years); (b) histopathological diagnosis of primary grade II glioma; (c) no history of preoperative therapy or biopsy; and (d) available preoperative conventional MRI sequences, including T1-weighted images (T1WIs), T2-weighted images (T2WIs), and contrast-enhancement T1WIs (CE-T1WIs). Information on IDH and 1p/19q statuses was acquired from the CGGA database (http://www.cgga.org.cn/), and the details of the measurements and relationship among molecular biomarkers are shown in the Supplementary Materials and Supplementary Table S1, respectively.
Ethics Statement
All clinical information was retrospectively collected from the institutional medical database, and the retrospective study was approved by the local institutional review board.
Telomerase Reverse Transcriptase Promoter Mutation
Polymerase chain reaction (PCR) and Sanger sequencing were used to identify mutations in pTERT (15). The genomic mutational hotspots in the core promoter region of TERT were covered by sequences, including the nucleotide positions 1,295,228 [C228T] and 1,295,250 [C250T]. Nested PCR was performed for amplification based on the human genome reference sequence (grCh37 February 2009; http://genome.ucsc.edu/). To remove any unused primers, PCR products were purified using Illustra ExoProStar system (GE Healthcare, Buckinghamshire, UK) after amplification. The quality of PCR products was analyzed by electrophoresis on 2% agarose gels before sequencing. Then, PCR products were directly sequenced using a BigDye Terminator cycle sequencing kit on an ABI 3100 PRISM DNA sequencer (Applied Biosystems, Foster City, CA, USA).
Magnetic Resonance Imaging Acquisition and Preprocessing
Regions of interest (ROIs) were drawn in slices presenting with tumors based on T2WI, in which the abnormal area could accurately represent the region implicated in low-grade gliomas (16–19). MRI was mainly performed using a Trio 3.0-T scanner (Siemens, Erlangen, Germany). T2WIs were obtained with the following imaging parameters: TR = 5,500 ms; TE = 120 ms; field of view = 240 × 240 mm2; flip angle = 150°; and voxel size = 0.65 × 0.65 × 5 mm3. T1WIs were obtained with the following parameters: TR = 450 ms; TE = 15 ms; field of view = 240 × 240 mm2; voxel size = 0.65 ×0.65 × 5 mm3. Patients were injected with gadopentetate dimeglumine intravenously (0.1 mM/kg), and CE-T1WIs were collected after contrast injection. To delineate tumor masks, two neurosurgeons (>5 years of experience, ZF and ZS) who were blinded to the patients’ clinical information used MRIcro (http://www.mccauslandcenter.sc.edu/mricro/) to draw the ROIs. Regions with hyperintense signals on T2WI were considered tumor areas. The T2WI and ROI for each patient were then registered to the high-resolution (1.0-mm isotropic) MNI (Montreal Neurological Institute) brain space using the SPM8 software (http://www.fil.ion.ucl.ac.uk/spm/software/spm8). A senior neuroradiologist (>20 years of experience, SL) made the final decision when the inter-neurosurgeon’s discrepancies of tumor masks exceeded 5% (DICE coefficient).
Quantitative Radiological Feature Extraction
To avoid heterogeneity bias, various MRI signal intensity values were transformed into standardized intensity ranges via z-score transformation. Radiomics features were then extracted from tumor masks based on the different types of MRI sequences using an automated approach (details are provided in the Supplementary Material) (20). For each sequence, 431 radiomics features were extracted and classified into four types (Figure 1): (1) first-order statistics features (n = 14), which quantitatively delineate the distribution of voxel intensities with the MRI scan through commonly used and basic metrics; (2) shape- and size-based features (n = 8), which used three dimensional features to reflect the shape and size of the ROI; (3) textural features (n = 33), which are calculated from gray-level run-length and gray level co-occurrence texture metrics and reflect the intra-tumoral heterogeneity differences; and (4) wavelet features (n = 376), which were transferred from intensity and texture features.
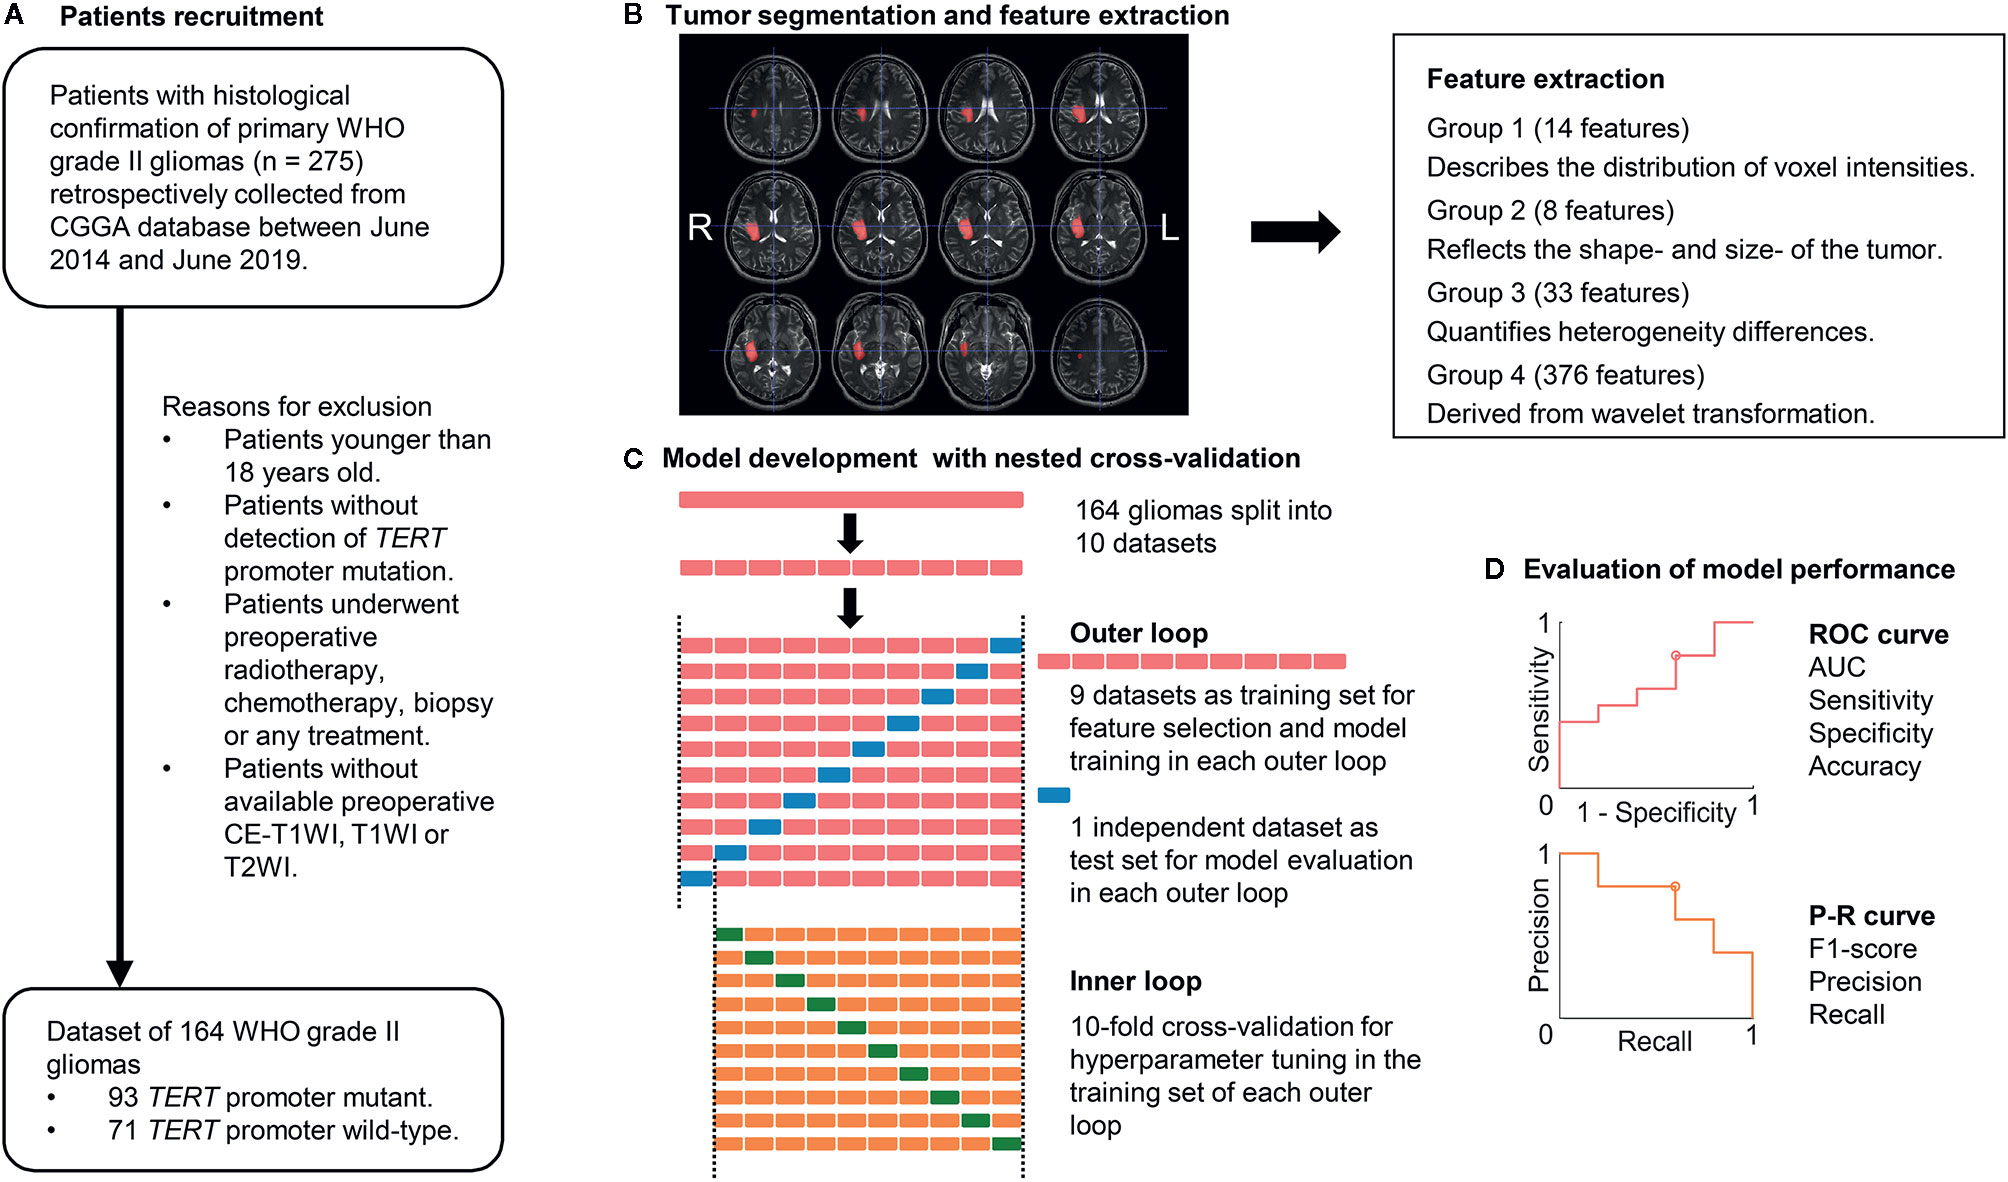
Figure 1 Workflow of patient recruitment, image processing, and machine-learning. (A) Patient recruitment process. (B) Image processing. Tumor segmentation was performed with T2-weighted images (T2WIs). Radiomics features were extracted from T1-weighted images (T1WIs), T2WIs, and contrast-enhanced T1WI using region-of-interest masks. (C) Feature selection and machine-learning were computed in a nested 10-fold cross-validation scheme, which comprised an inner and outer loop. The inner loop included hyperparameter tuning and feature selection. The outer loop was performed for the evaluation of model performance. (D) ROC analysis and P-R analysis were used for model performance evaluation. AUC, area under the curve; CGGA, Chinese Glioma Genome Atlas database; TERT, telomerase reverse transcriptase; P-R analysis, precision and recall analysis; ROC, receiver operating characteristic.
Feature Selection and Model Development
We developed a commonly used machine-learning algorithm, the linear support vector machine (linear SVM), to build predictive models. A linear SVM, which specified the use of a linear kernel, aimed to identify the best hyperplane that maximizes the margin between the data points of two classes (21–25). The fitcsvm function in MATLAB was used to build the linear SVM model. To optimize the predictive models, we varied the box constraint and kernel scale parameters in a 10-fold cross-validation (CV). In the CV, predictive models with minimal loss were considered as the optimal model.
The linear SVM was evaluated with a nested k-fold CV approach. Nested CV is widely employed in the machine-learning analysis of neuro-imaging (12, 26–29). Compared to simple CV, nested CV can reduce overfitting and limit optimistic biases, especially in relatively small samples (30, 31). These methods can make full use of all the information in the dataset and prevent circular analysis. After the dataset is split into 10 non-overlapping subsets, one selected subset (test dataset) is used to estimate the performance of a model that is trained by the remaining nine subsets (training dataset), which used another 10-fold CV for hyperparameter tuning (inner loop). These processes are repeated 10 times (outer loop), each time selecting an independent subset as the test dataset for model evaluation. We performed a 10-fold CV in the outer loops and computed the model performance, which was evaluated by ROC and PR analyses, using posterior probabilities.
Feature selection using elastic net (E-net) was conducted in the training component with nine datasets of each outer loop. The E-net penalty was regarded as a weighted sum of the least absolute shrinkage and selection operator penalty (LASSO) and ridge penalty (32, 33). λ and α, ranging from 0 to 1 in steps of 0.1, were selected using 10-fold CV via minimum or minimum plus one standard error criteria in the E-net model. We then selected the valuable features with non-zero coefficient resulting from the optimal λ and α for further analysis. After feature selection, a linear SVM was trained using the training dataset with an inner 10-fold CV loop for hyperparameter tuning. Grid searches were used for all of the hyperparameter tuning processes. Thus, 10 different linear SVM models were built with specific sets of features and hyperparameters.
Statistical Analyses
The entire nested 10-fold CV process was computed in MATLAB 2019b (MathWorks, Natick, MA, USA). Receiver operating characteristic (ROC) and precision-recall analyses were conducted to determine the performance of models in the prediction of pTERT status. The optimal threshold was identified when the sum of sensitivity and specificity was maximal. The 95% confidence interval (CI) of performance was evaluated using bootstrapping. We report the correlation coefficients and corresponding p values of the point-biserial-correlation between the true labels and posterior probabilities of TERT status, which were transformed from the decision values of SVM (34). The linear SVM model decision values of patients with wild-type or mutant pTERT were compared using unpaired t-test. Data are presented as means ± standard deviations. Differences were considered statistically significant at a P-value (p) <0.05.
Results
Clinical Characteristics
Overall, 275 patients with pathological confirmed primary WHO grade II gliomas were retrospectively collected from the CGGA database. We excluded 26 patients younger than 18 years of age; 11 patients without results of TERT promoter mutation; eight patient received radiotherapy; chemotherapy, biopsy, or any treatment before preoperative MRI examinations; and 66 patients without available preoperative MRIs. As a result, we retrospectively enrolled 164 patients with primary WHO grade II gliomas (89 men and 75 women; age range, 20–80 years; Table 1). The proportion of patients with a mutation in pTERT was 56.7% (93/164). The proportion of patients with a mutation in IDH and a 1p/19q codeletion were 86% (141/164) and 48.2% (79/164), respectively. The mean ( ± standard deviation) age and tumor volume were 41.6 ± 10.4 years and 61.4 ± 55.3 cm3, respectively.
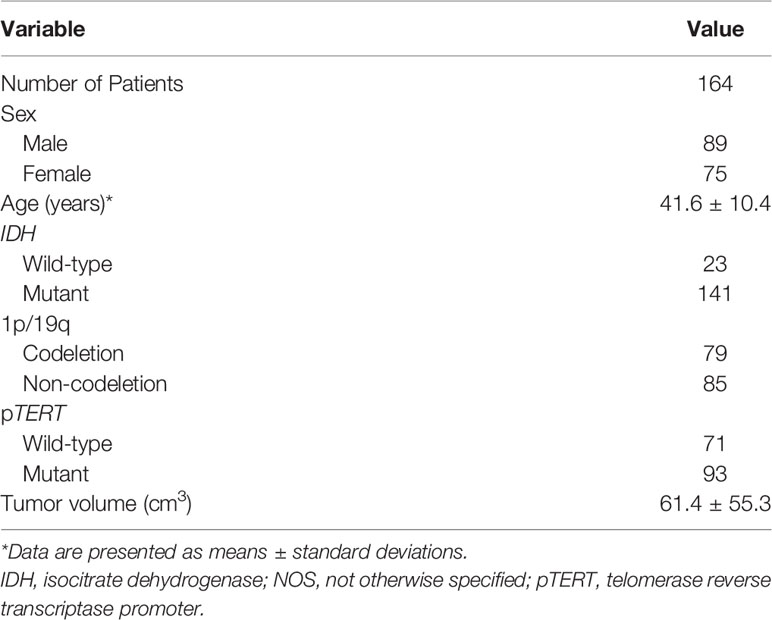
Table 1 Baseline demographics and clinical characteristics of patients.
Radiomics Feature Selection
We extracted 431 features from each sequence and a total of 1,293 radiomics features from all conventional sequences for each patient. The radiomics features selected by E-net in each outer loop ranged from 12 to 234. Features that were selected in at least nine of the 10 loops were considered to be the most valuable (Table 2). The 12 valuable radiomics features that were retained were textual features (Group 3) and their wavelet-transformed features (Group 4), such as CE-T1WI_Cluster Tendency, T1WI_Contrast, T1WI_Long Run Low Gray Level Emphasis_1, T1WI_Low Gray Level Run Emphasis, T2WI_Long Run High Gray Level Emphasis_1, etc. The z-score-transformed value of each important radiomics feature and pTERT status were compared, revealing that all valuable radiomics features in patients with mutations in pTERT were significantly different from patients with wild-type pTERT (p < 0.05).
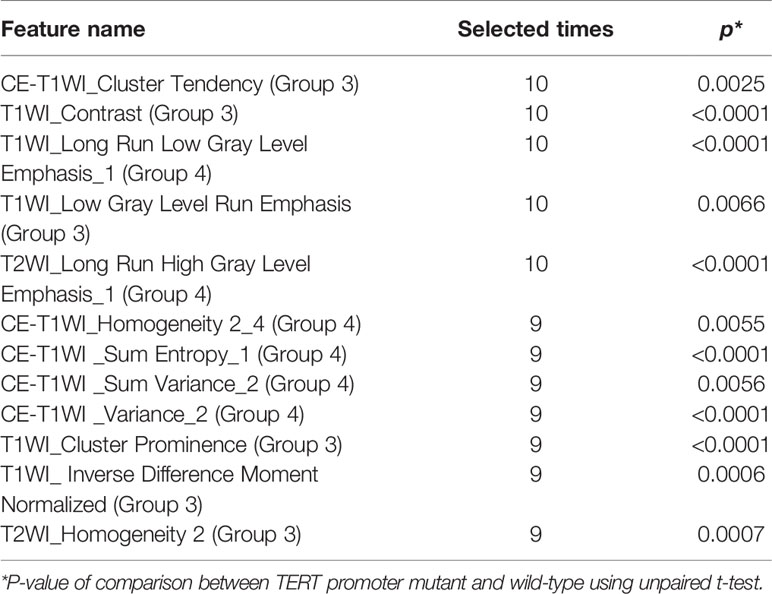
Table 2 Selected valuable features.
Model Performance
Ten predictive models were built in this study. Model parameters are shown in Table 3, and the performance of each predictive model in each loop are summarized in Supplementary Table S2. The box constraints and kernel scale ranged from 10 to 1,000 and 0.46 to 215.4, respectively. The ROC analysis revealed an AUC value of 0.8446 (95% CI, 0.7735–0.9065), with optimal summed values of sensitivity of 0.9355 (95% CI, 0.8802–0.9788) and specificity of 0.6197 (95% CI, 0.5071–0.7371) (Figure 2). The overall accuracy was 0.7988 (95% CI, 0.7378–0.8598). The P-R analysis displayed an F1-score value of 0.8406 (95% CI, 0.7684–0.902) with an optimal precision of 0.7632 (95% CI, 0.6818–0.8364) and optimal recall of 0.9355 (95% CI, 0.8802–0.9788). A total of 34 patients were misclassified. There were 27 (79.4%) patients with wild-type pTERT, 28 (82.4%) patients with wild-type IDH, and 26 (76.5%) patients with 1p/19q non-codeletion. To evaluate the association between posterior probability and true labels, we computed point-biserial-correlations, revealing r and p values of 0.59 and <0.0001, respectively. Further, we compared the posterior probability between wild-type and mutant pTERT, revealing a p-value <0.0001, which indicated that our model can be used to predict the pTERT status of WHO grade II gliomas (Figure 3).
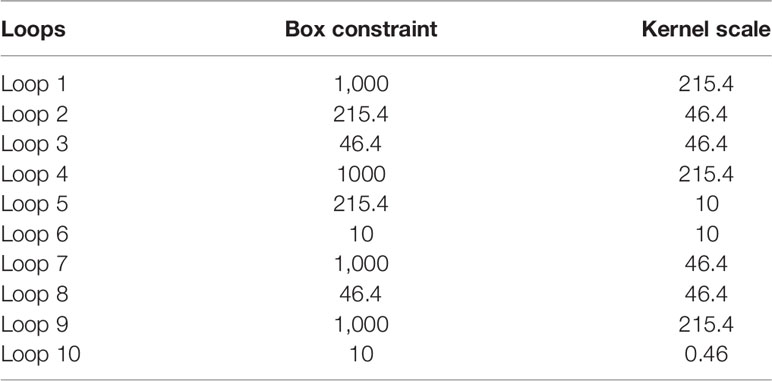
Table 3 Optimal model parameters in each outer loop.
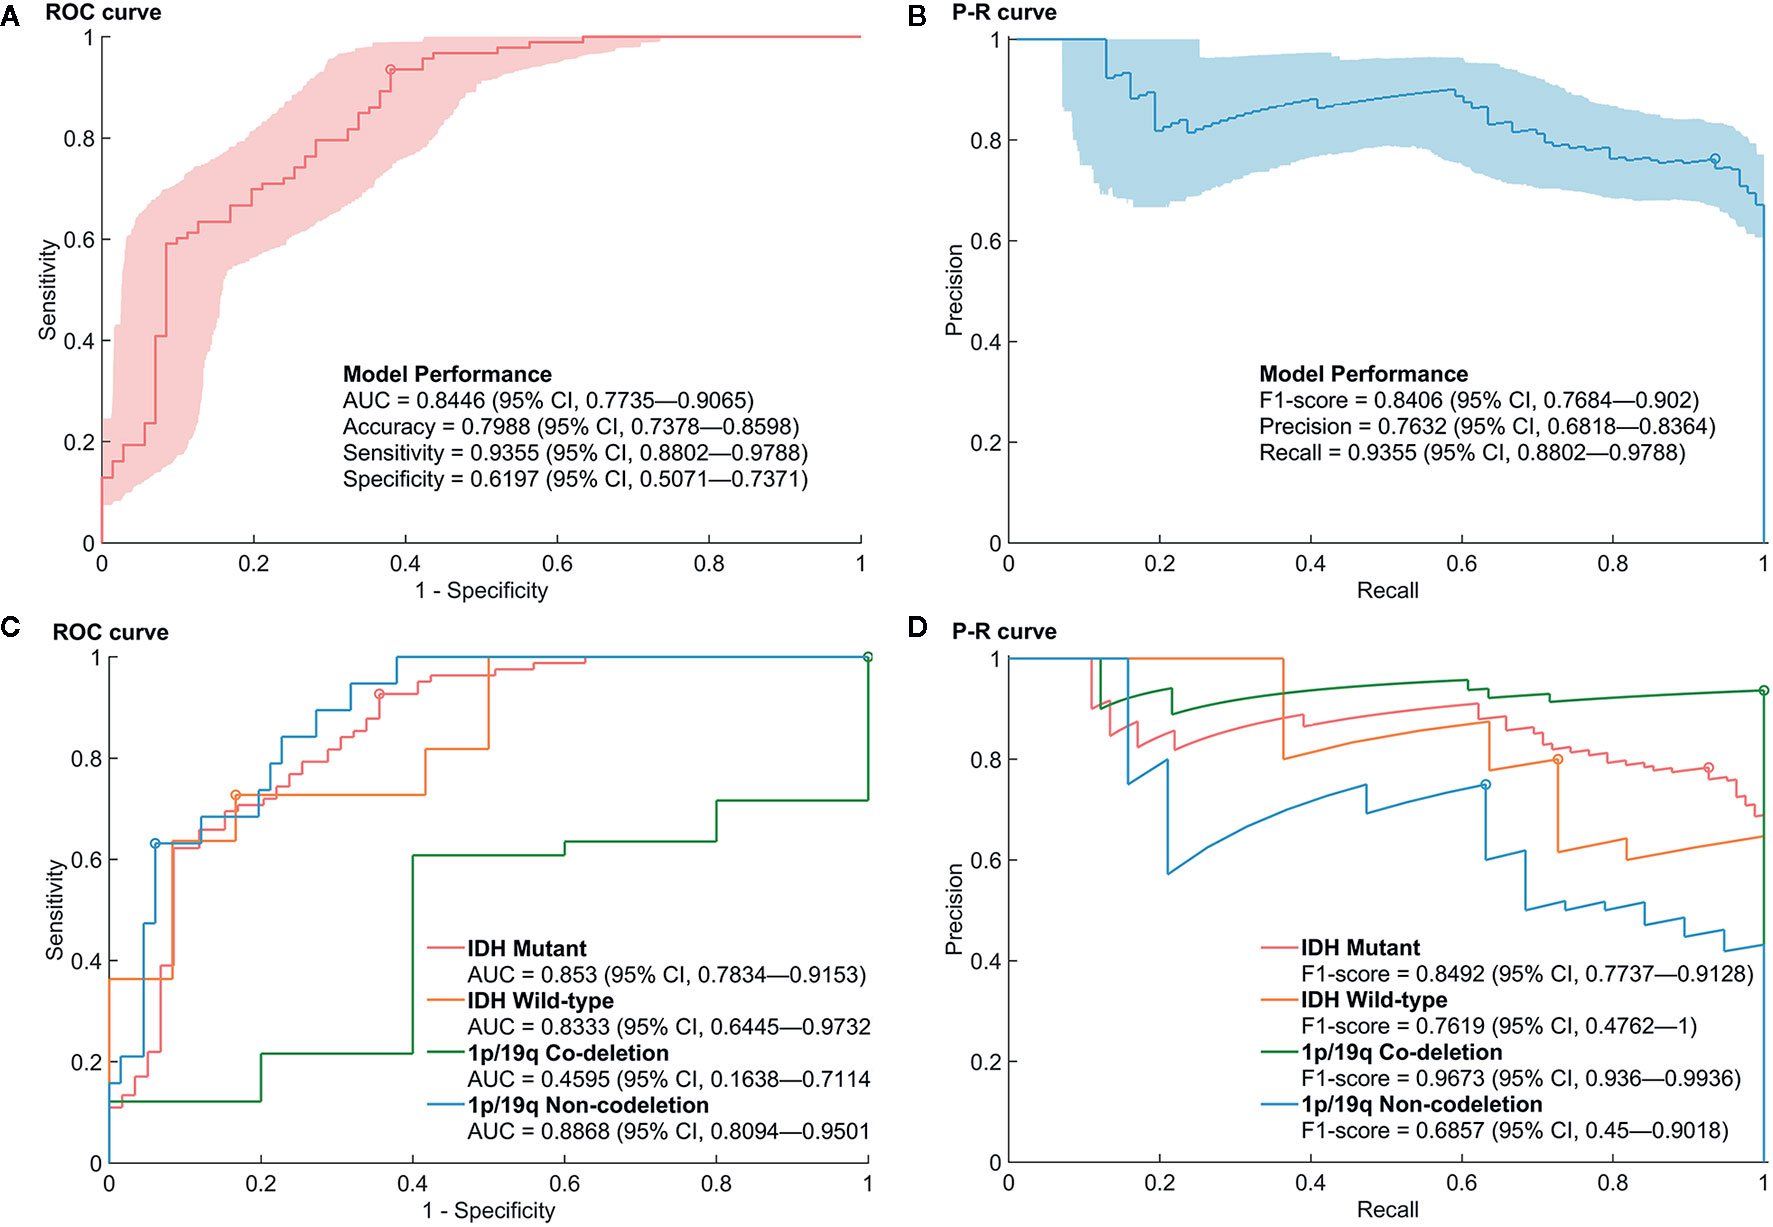
Figure 2 Performance of the prediction model for mutations in the promoter region of TERT (pTERT) in WHO grade II gliomas. (A, B) The receiver operating characteristic (ROC) curve and P–R curve in the prediction of mutations in pTERT in WHO grade II gliomas. (C, D) The ROC curve and P–R curve in the prediction of mutations in pTERT in the subgroups of molecular biomarkers in WHO grade II gliomas.
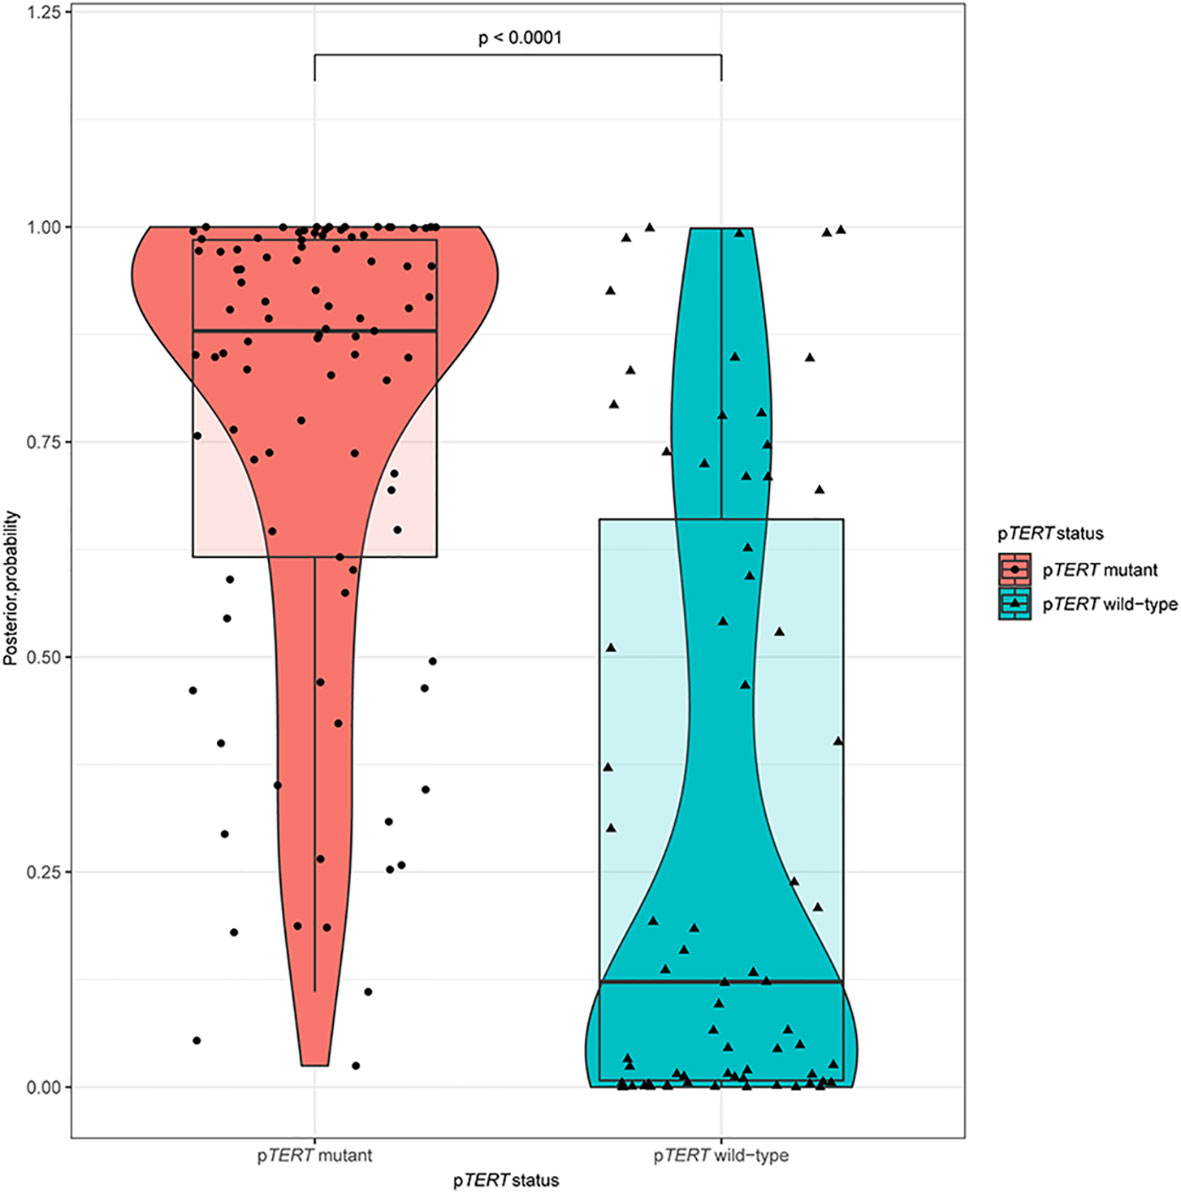
Figure 3 A violin plot comparing the differences in posterior probabilities between mutants and wild-types promoter regions of TERT.
Furthermore, the performances of the prediction model in the subgroup of IDH and 1p/19q were evaluated. Although the AUCs of the ROC analysis reached a value of 0.853 (95% CI, 0.7834–0.9153), 0.8333 (95% CI, 0.6445–0.9732), and 0.8868 (95% CI, 0.8094–0.9501) for mutant IDH, wild-type IDH, and 1p/19q non-deletion groups, respectively, the AUC for the 1p/19q codeletion showed a rather low value of 0.4595 (95% CI, 0.1638–0.7114). Regarding the high rate of pTERT mutations in the 1p/19q codeletion (74/79), the P–R Curve, which is suitable for describing imbalances in binary data, showed a more reliable result to evaluate the model performance. The precision, recall, and F1-score in 1p/19q codeletion group were 0.9367 (95% CI, 0.8797–0.9873), 1 (95% CI, 1–1), and 0.9673 (95% CI, 0.936–0.9936), respectively. In addition, the accuracies were 0.8085 (95% CI, 0.7447–0.8652), 0.7826 (95% CI, 0.6087–0.913), 0.9367 (95% CI, 0.8734–0.9873), and 0.8706 (95% CI, 0.8–0.9412) in mutant IDH, wild-type IDH, 1p/19q codeletion, and 1p/19q non-deletion groups, respectively. The detailed prediction model performances in molecular subgroups are shown in Supplementary Table S3.
Discussion
The clinical characteristics of patients with mutations in pTERT were associated with poor prognosis with glioblastomas and a good prognosis with oligodendroglioma (6, 35, 36). Based on the presence of pTERT mutations, IDH1/2 mutations, and 1p/19q codeletion status, gliomas were divided into five subtypes with different overall survival (37). Since patients with lower-grade gliomas (LGGs) who carry mutations in pTERT always have a better survival, the determination of pTERT status by a non-invasive MRI scan may help patients make better decisions regarding their treatment plan. The development of an efficient method to accurately and preoperatively identify the pTERT status of the tumor before surgery is a critical unmet need. In this regard, radiomics offers a promising approach. To predict pTERT mutation status preoperatively, we built a preoperative model based on radiomics analysis that exhibited good performance and robustness.
Based on artificial intelligence, radiomics showed its potential to connect radiological images and tumor metadata (38). Radiological images contain tumor features, such as shape, volume, density, structure, and other characteristics, which are associated with tumor genomics (39). In this study, data from 164 patients with WHO grade II gliomas, whose pTERT status and preoperative MRIs were available, were included into the dataset. We used E-net to reduce dimensionality, identified the main features of the data, and attempted to eliminate the overfitting phenomenon of the model caused by excessive features (40). In total, 12 important radiomics features were selected more than nine times by E-net in the loops. These valuable radiomics features were predominantly textual information that could not be fully identified by the human eye in imaging and reflected the internal tissue characteristics of tumor imaging, such as internal density, morphological cell proliferation state, and infiltration degree (41–44). Among the five top radiomics features selected by the loops (10 times), three features were selected from T1WIs, and one feature was selected from CE-T1WIs and T2WIs, respectively. These results indicated that T1WIs provide the most valuable information for predictions given that WHO grade II gliomas are rarely contrast-enhanced.
By analyzing the textures extracted from patients’ radiological images, substantial progress has been made with regard to WHO grade and genotype prediction of gliomas (7, 9, 16, 45–48). On one hand, since the classification of pTERT status has predominantly been associated with IDH and 1p/19q alterations, previous studies have aimed at combining subtypes of mutations in pTERT and IDH mutations for predictions. However, these attempts did not achieve a satisfactory result. Based on the radiomics analysis of conventional MRI, a LASSO regression model was used for predicting molecular subtypes of LGGs including mutant IDH1/2, mutant IDH1/2 with pTERT mutations, and wild-type IDH (11). The accuracies of the prediction model reached 0.74 in the training set and 0.56 in the validation set. Another study showed lower performance based on the combination of patient age, radiomics features, and convolutional neural network features; a linear SVM model was used for predicting three subtypes of LGGs, and the accuracy reached 0.63 ± 0.08 (12). On the other hand, some studies presenting radiomics analysis focus on pTERT mutations only. A previous study compared three machine-learning methods in predicting pTERT mutations in LGGs, including random forest, SVM, and adaboost methods (13). The results showed that the random forest method had the best performance after feature selection using LASSO, and the AUC value reached 0.827 (95% CI, 0.667–0.988) in the validation group. An extreme gradient boosting model with recursive feature selection showed similarity AUC of 0.82 ± 0.04 (29), which was similar to our prediction models. In addition, based on the convolutional neural network features described above, the linear SVM model reached an accuracy of 0.84 ± 0.09 (12). Further, the prediction of mutations in pTERT in the subgroup of IDH also reached stable performances, where the random forest model achieved an AUC of 0.824 (95% CI, 0.639–1) and 0.750 (95% CI, 0.260–1) in the mutant IDH and wild-type IDH groups, respectively (13).
Although the above radiomics-based analysis achieved good performance in the predication of mutations in pTERT, previous studies have focused on LGGs, which are composed of WHO grades II and III gliomas, with limited sample sizes (11–13, 29). However, gliomas in WHO grade II and HGG showed differences in biological and radiomics features (49). Thus, the present study focuses on WHO grade II gliomas, which decreased the sample size but improved the consistency and practicality of the results. As a result, we enrolled 164 patients with WHO grade II gliomas and used nested CV to fully utilize the information of the enrolled patients. In addition, the performance of the prediction was also evaluated in the subgroups with IDH and 1p/19q alterations, which reached high and stable accuracies. However, because of the highly skewed dataset of the 1p/19q codeletion group (74 pTERT mutant and five wild-type samples), the ROC curve was limited, and the P–R curve gave a more informative picture of performance (50), which showed a high F1-score of 0.9673 (95% CI, 0.936–0.9936) and a high accuracy of 0.9367 (95% CI, 0.8734–0.9873).
There are some limitations of this study. First, as all patients enrolled were from a single hospital, multi-center data verification is lacking. In subsequent experiments, we will include other clinical centers or glioma imaging datasets, such as TCIA, to eliminate potential systematic errors caused by using different equipment to collect image information. Second, ROI labeling in this study relied on manual labeling by imaging scientists, which inevitably resulted in differences in ROI interpretation and affected subsequent analysis and processing. To overcome this limitation, artificial intelligence labeling should be introduced in future research to automatically label ROIs and improve the efficiency and consistency of the prediction system.
In conclusion, our results demonstrate the clinical utility of radiomics analysis for predicting pTERT mutation status preoperatively. Through nested CV, we developed an efficient machine-learning-based model with robust performance. Given that pTERT mutation status plays an important role in glioma patients’ outcomes, our predictive model will facilitate the optimization of clinical management strategies for patients with gliomas.
Data Availability Statement
The raw data supporting the conclusions of this article will be made available by the authors, without undue reservation.
Ethics Statement
The studies involving human participants were reviewed and approved by the ethics committee of Beijing Tiantan Hospital (Beijing Tiantan Hospital, Capital Medical University, Beijing 100070, China). The patients/participants provided their written informed consent to participate in this study.
Author Contributions
YW, TJ, and LW conceptualized and designed the study. SF, XL, YCL, YKL, CZ, QZ, TL, and HZ acquired the data. ZF, SF, ZS, YKL, SL, and YW analyzed and interpreted the data. SF and ZF drafted the manuscript. YW and LW critically revised the manuscript. All authors contributed to the article and approved the submitted version.
Funding
This study was supported by grants from the Beijing Nova Program (No. Z181100006218064), Beijing Municipal Natural Science Foundation (No. 7202021), and Capital’s Funds for Health Improvement and Research (CFH 2018-2-1072).
Conflict of Interest
The authors declare that the research was conducted in the absence of any commercial or financial relationships that could be construed as a potential conflict of interest.
Acknowledgments
The authors would like to acknowledge the support of Zitong Zhao.
Supplementary Material
The Supplementary Material for this article can be found online at: https://www.frontiersin.org/articles/10.3389/fonc.2020.606741/full#supplementary-material
References
1. Louis DN, Perry A, Reifenberger G, von Deimling A, Figarella-Branger D, Cavenee WK, et al. The 2016 World Health Organization Classification of Tumors of the Central Nervous System: a summary. Acta Neuropathol (2016) 131(6):803–20. doi: 10.1007/s00401-016-1545-1
2. Cancer Genome Atlas Research N, Brat DJ, Verhaak RG, Aldape KD, Yung WK, Salama SR, et al. Comprehensive, Integrative Genomic Analysis of Diffuse Lower-Grade Gliomas. N Engl J Med (2015) 372(26):2481–98. doi: 10.1056/NEJMoa1402121
3. Blackburn EH. Structure and function of telomeres. Nature (1991) 350(6319):569–73. doi: 10.1038/350569a0
4. Liu L, Lai S, Andrews LG, Tollefsbol TO. Genetic and epigenetic modulation of telomerase activity in development and disease. Gene (2004) 340(1):1–10. doi: 10.1016/j.gene.2004.06.011
5. Chiba K, Lorbeer FK, Shain AH, McSwiggen DT, Schruf E, Oh A, et al. Mutations in the promoter of the telomerase gene TERT contribute to tumorigenesis by a two-step mechanism. Science (2017) 357(6358):1416–20. doi: 10.1126/science.aao0535
6. Brat DJ, Aldape K, Colman H, Holland EC, Louis DN, Jenkins RB, et al. cIMPACT-NOW update 3: recommended diagnostic criteria for “Diffuse astrocytic glioma, IDH-wildtype, with molecular features of glioblastoma, WHO grade IV”. Acta Neuropathol (2018) 136(5):805–10. doi: 10.1007/s00401-018-1913-0
7. Li Y, Liu X, Xu K, Qian Z, Wang K, Fan X, et al. MRI features can predict EGFR expression in lower grade gliomas: A voxel-based radiomic analysis. Eur Radiol (2018) 28(1):356–62. doi: 10.1007/s00330-017-4964-z
8. Qian Z, Li Y, Sun Z, Fan X, Xu K, Wang K, et al. Radiogenomics of lower-grade gliomas: a radiomic signature as a biological surrogate for survival prediction. Aging (2018) 10(10):2884–99. doi: 10.18632/aging.101594
9. Liu X, Li Y, Li S, Fan X, Sun Z, Yang Z, et al. IDH mutation-specific radiomic signature in lower-grade gliomas. Aging (2019) 11(2):673–96. doi: 10.18632/aging.101769
10. Liu X, Li Y, Qian Z, Sun Z, Xu K, Wang K, et al. A radiomic signature as a non-invasive predictor of progression-free survival in patients with lower-grade gliomas. NeuroImage Clin (2018) 20:1070–7. doi: 10.1016/j.nicl.2018.10.014
11. Arita H, Kinoshita M, Kawaguchi A, Takahashi M, Narita Y, Terakawa Y, et al. Lesion location implemented magnetic resonance imaging radiomics for predicting IDH and TERT promoter mutations in grade II/III gliomas. Sci Rep (2018) 8(1):11773. doi: 10.1038/s41598-018-30273-4
12. Fukuma R, Yanagisawa T, Kinoshita M, Shinozaki T, Arita H, Kawaguchi A, et al. Prediction of IDH and TERT promoter mutations in low-grade glioma from magnetic resonance images using a convolutional neural network. Sci Rep (2019) 9(1):20311. doi: 10.1038/s41598-019-56767-3
13. Jiang C, Kong Z, Zhang Y, Liu S, Liu Z, Chen W, et al. Conventional magnetic resonance imaging-based radiomic signature predicts telomerase reverse transcriptase promoter mutation status in grade II and III gliomas. Neuroradiology (2020) 62(7):803–13. doi: 10.1007/s00234-020-02392-1
14. Tian H, Wu H, Wu G, Xu G. Noninvasive Prediction of TERT Promoter Mutations in High-Grade Glioma by Radiomics Analysis Based on Multiparameter MRI. BioMed Res Int (2020) 2020:3872314. doi: 10.1155/2020/3872314
15. Arita H, Narita Y, Fukushima S, Tateishi K, Matsushita Y, Yoshida A, et al. Upregulating mutations in the TERT promoter commonly occur in adult malignant gliomas and are strongly associated with total 1p19q loss. Acta Neuropathol (2013) 126(2):267–76. doi: 10.1007/s00401-013-1141-6
16. Li Y, Qian Z, Xu K, Wang K, Fan X, Li S, et al. MRI features predict p53 status in lower-grade gliomas via a machine-learning approach. NeuroImage Clin (2018) 17:306–11. doi: 10.1016/j.nicl.2017.10.030
17. Wang Y, Fan X, Li H, Lin Z, Bao H, Li S, et al. Tumor border sharpness correlates with HLA-G expression in low-grade gliomas. J Neuroimmunol (2015) 282:1–6. doi: 10.1016/j.jneuroim.2015.02.013
18. Kinoshita M, Sakai M, Arita H, Shofuda T, Chiba Y, Kagawa N, et al. Introduction of high throughput magnetic resonance T2-weighted image texture analysis for WHO grade 2 and 3 gliomas. PLoS One (2016) 11(10):e0164268. doi: 10.1371/journal.pone.0164268
19. Mandonnet E, Delattre JY, Tanguy ML, Swanson KR, Carpentier AF, Duffau H, et al. Continuous growth of mean tumor diameter in a subset of grade II gliomas. Ann Neurol (2003) 53(4):524–8. doi: 10.1002/ana.10528
20. Aerts HJ, Velazquez ER, Leijenaar RT, Parmar C, Grossmann P, Carvalho S, et al. Decoding tumour phenotype by noninvasive imaging using a quantitative radiomics approach. Nat Commun (2014) 5:4006. doi: 10.1038/ncomms5644
21. Hastie T, Tibshirani R, Friedman J. The Elements of Statistical Learning, Ed. New York: Spriner (2008).
22. Cristianini N, Shawe-Taylor J. An introduction to support vector machines and other kernel-based learning methods. Cambridge, England: Cambridge University Press (2000). doi: 10.1017/CBO9780511801389
23. Schölkopf B, Smola AJ, Bach F. Learning with kernels: support vector machines, regularization, optimization, and beyond. Cambridge, MA, London, England: MIT Press (2002).
24. Fan R-E, Chen P-H, Lin C-J. Working set selection using second order information for training support vector machines. J Mach Learn Res (2005) 6(Dec):1889–918. doi: 10.1115/1.1898234
25. Kecman V, Huang T-M, Vogt M. Iterative single data algorithm for training kernel machines from huge data sets: Theory and performance. Support vector machines: Theory and Applications. Berlin, Germany: Springer (2005). p. 255–74. doi: 10.1007/10984697_12
26. Laurent J, Watts R, Adise S, Allgaier N, Chaarani B, Garavan H, et al. Associations Among Body Mass Index, Cortical Thickness, and Executive Function in Children. JAMA Pediatr (2020) 174(2):170–7. doi: 10.1001/jamapediatrics.2019.4708
27. Castillo-Barnes D, Su L, Ramírez J, Salas-Gonzalez D, Martinez-Murcia F, Illan I, et al. Autosomal Dominantly Inherited Alzheimer Disease: Analysis of genetic subgroups by Machine Learning. Int J Inf Fusion (2020) 58:153–67. doi: 10.1016/j.inffus.2020.01.001
28. Hahn T, Kircher T, Straube B, Wittchen H, Konrad C, Ströhle A, et al. Predicting treatment response to cognitive behavioral therapy in panic disorder with agoraphobia by integrating local neural information. JAMA Psychiatry (2015) 72(1):68–74. doi: 10.1001/jamapsychiatry.2014.1741
29. Shboul Z, Chen J M, Iftekharuddin K. Prediction of Molecular Mutations in Diffuse Low-Grade Gliomas using MR Imaging Features. Sci Rep (2020) 10(1):3711. doi: 10.1038/s41598-020-60550-0
30. Varoquaux G, Raamana PR, Engemann DA, Hoyos-Idrobo A, Schwartz Y, Thirion B. Assessing and tuning brain decoders: cross-validation, caveats, and guidelines. NeuroImage (2017) 145:166–79. doi: 10.1016/j.neuroimage.2016.10.038
31. Cawley GC, Talbot NL. On over-fitting in model selection and subsequent selection bias in performance evaluation. J Mach Learn Res (2010) 11:2079–107. doi: 10.1007/s10846-010-9395-x
32. Friedman J, Hastie T, Tibshirani R. Regularization Paths for Generalized Linear Models via Coordinate Descent. J Stat Softw (2010) 33(1):1–22. doi: 10.18637/jss.v033.i01
33. Zou H, Hastie T. Regularization and variable selection via the elastic net. J R Stat Soc: Ser B Stat Methodol (2005) 67(2):301–20. doi: 10.1111/j.1467-9868.2005.00503.x
34. De Cáceres M, Legendre P. Associations between species and groups of sites: indices and statistical inference. Ecology (2009) 90(12):3566–74. doi: 10.1890/08-1823.1
35. Nonoguchi N, Ohta T, Oh JE, Kim YH, Kleihues P, Ohgaki H. TERT promoter mutations in primary and secondary glioblastomas. Acta Neuropathol (2013) 126(6):931–7. doi: 10.1007/s00401-013-1163-0
36. Louis DN, Aldape K, Brat DJ, Capper D, Ellison DW, Hawkins C, et al. Announcing cIMPACT-NOW: the Consortium to Inform Molecular and Practical Approaches to CNS Tumor Taxonomy. Acta Neuropathol (2017) 133(1):1–3. doi: 10.1007/s00401-016-1646-x
37. Eckel-Passow JE, Lachance DH, Molinaro AM, Walsh KM, Decker PA, Sicotte H, et al. Glioma Groups Based on 1p/19q, IDH, and TERT Promoter Mutations in Tumors. N Engl J Med (2015) 372(26):2499–508. doi: 10.1056/NEJMoa1407279
38. Gillies RJ, Kinahan PE, Hricak H. Radiomics: Images Are More than Pictures, They Are Data. Radiology (2016) 278(2):563–77. doi: 10.1148/radiol.2015151169
39. Lambin P, Rios-Velazquez E, Leijenaar R, Carvalho S, van Stiphout RG, Granton P, et al. Radiomics: extracting more information from medical images using advanced feature analysis. Eur J Cancer (2012) 48(4):441–6. doi: 10.1016/j.ejca.2011.11.036
40. Qian Z, Li Y, Wang Y, Li L, Li R, Wang K, et al. Differentiation of glioblastoma from solitary brain metastases using radiomic machine-learning classifiers. Cancer Lett (2019) 451:128–35. doi: 10.1016/j.canlet.2019.02.054
41. Aerts HJ. The Potential of Radiomic-Based Phenotyping in Precision Medicine: A Review. JAMA Oncol (2016) 2(12):1636–42. doi: 10.1001/jamaoncol.2016.2631
42. Joo L, Park JE, Park SY, Nam SJ, Kim YH, Kim JH, et al. Extensive Peritumoral Edema and Brain-to-Tumor Interface MR Imaging Features Enable Prediction of Brain Invasion in Meningioma: Development and Validation. Neuro-oncology (2020) noaa190. doi: 10.1093/neuonc/noaa190
43. Tang X. Texture information in run-length matrices. IEEE Trans Image Process (1998) 7(11):1602–9. doi: 10.1109/83.725367
44. Lambin P, Leijenaar RTH, Deist TM, Peerlings J, de Jong EEC, van Timmeren J, et al. Radiomics: the bridge between medical imaging and personalized medicine. Nat Rev Clin Oncol (2017) 14(12):749–62. doi: 10.1038/nrclinonc.2017.141
45. Li Y, Liu X, Qian Z, Sun Z, Xu K, Wang K, et al. Genotype prediction of ATRX mutation in lower-grade gliomas using an MRI radiomics signature. Eur Radiol (2018) 28(7):2960–8. doi: 10.1007/s00330-017-5267-0
46. Qian J, Herman MG, Brinkmann DH, Laack NN, Kemp BJ, Hunt CH, et al. Prediction of MGMT Status for Glioblastoma Patients Using Radiomics Feature Extraction From (18)F-DOPA-PET Imaging. Int J Radiat Oncol Biol Phys (2020) 108(5):1339–46. doi: 10.1016/j.ijrobp.2020.06.073
47. Zhang Z, Xiao J, Wu S, Lv F, Gong J, Jiang L, et al. Deep Convolutional Radiomic Features on Diffusion Tensor Images for Classification of Glioma Grades. J Digit Imaging (2020) 33(4):826–37. doi: 10.1007/s10278-020-00322-4
48. Kocak B, Durmaz ES, Ates E, Sel I, Turgut Gunes S, Kaya OK, et al. Radiogenomics of lower-grade gliomas: machine learning-based MRI texture analysis for predicting 1p/19q codeletion status. Eur Radiol (2020) 30(2):877–86. doi: 10.1007/s00330-019-06492-2
49. Tian Q, Yan L, Zhang X, Zhang X, Hu Y, Han Y, et al. Radiomics strategy for glioma grading using texture features from multiparametric MRI. J Magn Reson Imaging JMRI (2018) 48(6):1518–28. doi: 10.1002/jmri.26010
Keywords: low-grade glioma, machine-learning, nested cross-validation, radiomics, TERT promoter mutation
Citation: Fang S, Fan Z, Sun Z, Li Y, Liu X, Liang Y, Liu Y, Zhou C, Zhu Q, Zhang H, Li T, Li S, Jiang T, Wang Y and Wang L (2021) Radiomics Features Predict Telomerase Reverse Transcriptase Promoter Mutations in World Health Organization Grade II Gliomas via a Machine-Learning Approach. Front. Oncol. 10:606741. doi: 10.3389/fonc.2020.606741
Received: 15 September 2020; Accepted: 24 December 2020;
Published: 11 February 2021.
Edited by:
Harrison Bai, Brown University, United StatesReviewed by:
Wenbin Ma, Peking Union Medical College Hospital (CAMS), ChinaJiaojian Wang, University of Electronic Science and Technology of China, China
Copyright © 2021 Fang, Fan, Sun, Li, Liu, Liang, Liu, Zhou, Zhu, Zhang, Li, Li, Jiang, Wang and Wang. This is an open-access article distributed under the terms of the Creative Commons Attribution License (CC BY). The use, distribution or reproduction in other forums is permitted, provided the original author(s) and the copyright owner(s) are credited and that the original publication in this journal is cited, in accordance with accepted academic practice. No use, distribution or reproduction is permitted which does not comply with these terms.
*Correspondence: Lei Wang, d2FuZ2xlaV90aWFudGFuQDE2My5jb20=; Yinyan Wang, dGlhbnRhbnlpbnlhbkAxMjYuY29t
†These authors have contributed equally to this work and share first authorship
‡These authors have contributed equally to this work and share last authorship