
94% of researchers rate our articles as excellent or good
Learn more about the work of our research integrity team to safeguard the quality of each article we publish.
Find out more
ORIGINAL RESEARCH article
Front. Oncol. , 02 December 2020
Sec. Neuro-Oncology and Neurosurgical Oncology
Volume 10 - 2020 | https://doi.org/10.3389/fonc.2020.598965
This article is part of the Research Topic Novel Diagnostic and Therapeutic Strategies in the Management of Cerebral Gliomas View all 55 articles
 Zhe Zhang1,2Zeping Jin1,2Dayuan Liu3
 Yang Zhang1,2Chunzhao Li1,2Yazhou Miao1,2Xiaohan Chi1,2
 Jie Feng2,4,5Yaming Wang6*
 Shuyu Hao1,2*
 Nan Ji1,2,7*
Background: The extent of resection of non-contrast enhancing tumors (EOR-NCEs) has been shown to be associated with prognosis in patients with newly diagnosed glioblastoma (nGBM). This study aimed to develop and independently validate a nomogram integrated with EOR-NCE to assess individual prognosis.
Methods: Data for this nomogram were based on 301 patients hospitalized for nGBM from October 2011 to April 2019 at the Beijing Tiantan Hospital, Capital Medical University. These patients were randomly divided into derivation (n=181) and validation (n=120) cohorts at a ratio of 6:4. To evaluate predictive accuracy, discriminative ability, and clinical net benefit, concordance index (C-index), receiver operating characteristic (ROC) curves, calibration curves, and decision curve analysis (DCA) were calculated for the extent of resection of contrast enhancing tumor (EOR-CE) and EOR-NCE nomograms. Comparison between these two models was performed as well.
Results: The Cox proportional hazards model was used to establish nomograms for this study. Older age at diagnosis, Karnofsky performance status (KPS)<70, unmethylated O6-methylguanine-DNA methyltransferase (MGMT) status, wild-type isocitrate dehydrogenase enzyme (IDH), and lower EOR-CE and EOR-NCE were independent factors associated with shorter survival. The EOR-NCE nomogram had a higher C-index than the EOR-CE nomogram. Its calibration curve for the probability of survival exhibited good agreement between the identical and actual probabilities. The EOR-NCE nomogram showed superior net benefits and improved performance over the EOR-CE nomogram with respect to DCA and ROC for survival probability. These results were also confirmed in the validation cohort.
Conclusions: An EOR-NCE nomogram assessing individualized survival probabilities (12-, 18-, and 24-month) for patients with nGBM could be useful to provide patients and their relatives with health care consultations on optimizing therapeutic approaches and prognosis.
Glioblastoma (GBM) is the most fatal and malignant of primary brain tumors in adults (1–3). Its highly aggressive behavior often proves clinically challenging to treat. Although advanced treatments have been applied in patients with newly diagnosed GBM (nGBM), satisfactory outcomes are rarely achieved. The high heterogeneity of GBM leads to a variable prognosis for these patients. Several clinical, imaging and biomarker studies have been employed to identify variable outcomes in patients with GBM. Karnofsky performance status (KPS), extent of surgical resection, O6-methylguanine-DNA methyltransferase (MGMT) methylation status and isocitrate dehydrogenase enzyme (IDH) mutation are the most uniformly documented prognostic factors in previous studies (4, 5).
Among these factors, the maximal safe surgical resection of contrast enhancing (CE) tumors has been recognized as a predominant treatment associated with prolonged survival in nGBM (6–8). Moreover, a number of studies on extending surgical resection to the non-contrast enhancing tumor (NCE) area further showed that reduced residual NCE tumor volume would be beneficial from survival (9, 10). Therefore, the extent of resection of NCE tumors (EOR-NCE) should not be neglected in our clinical practice.
Nomograms are an easy-to-use statistical model with representations of graphical diagrams that convey precise and individualized prognosis for multiple illnesses (11–14). This modality is also well-suited for highly heterogeneous GBM. The nomogram was first developed to identify new prognostic factors for survival in 2008 by Thierry Gorlia (15). Other established nomograms have since been widely used to predict prognosis in GBM (16, 17). Although these nomograms presented good prediction capacity, they did not include EOR-NCE for analysis.
To the best of our knowledge, we are the first to develop a nomogram including EOR-NCE in patients with nGBM. We hypothesized that the nomogram integrated with EOR-NCE would be more robust for identifying individual prognosis. The primary aim of this study was to assess the prognostic value of EOR-NCE for survival in patients with nGBM who received standard care of the Stupp protocol and to establish a nomogram integrated with the extent of surgical resection of NCE tumors for the prediction of these patients’ prognosis. Furthermore, a nomogram on the extent of resection of CE tumors (EOR-CE) was contrasted using the same dataset and compared to the EOR-NCE nomogram to gauge its predictive accuracy.
A total of 301 patients in the Beijing Tiantan Hospital neurosurgical ward between October 2011 and April 2019 who were histologically diagnosed with nGBM and met inclusion criteria were included in our study. The eligibility criteria were (1) age at diagnosis≥18 years; (2) underwent neurosurgical resection with microscopic and histologic diagnosis as GBM; (3) received standard medical care primarily including maximum tumor resection, post-operative concurrent chemoradiotherapy and adjuvant chemotherapy according to the Stupp protocol (18); (4) had accessible clinical, imaging and molecular data for this analysis. Exclusion criteria: (1) multifocal or multicentric diseases; (2) participate in other clinical trials; (3) received secondary resection. All enrolled patients were randomly assigned into the training or testing cohort. All of them provided written informed consent, and this study was approved by the Ethical Committee of Beijing Tiantan Hospital.
Pre-operative magnetic resonance imaging (MRI) scans were obtained within 1 week before tumor resection, and post-operative scans were performed within 48 to 72 h after surgery. Both pre-operative and post-operative CE and NCE tumor volumes were measured. T1-weighted post-contrast images were used for measuring CE tumor volume, and T2 or fluid-attenuated inversion-recovery (FLAIR) images were used to screen NCE tumor volume.
Regions of interest (ROIs) of each quantitative volume parameter for analysis were well drawn on contrast-enhancing T1-weighted sequences and T2 or FLAIR sequences (in cubic centimeter). All imaging parameters were independently assessed in consensus by two neuroradiologists (SJS and HCS) with more than 10 years’ experiences and were blinded to pathological and molecular diagnosis. And the average of 2 ROIs of each parameter was used to represent as its volume. Tumor volume was calculated by MRIcron software (www.nitrc.org). EOR was determined according to the following equation: (pre-operative tumor volume - post-operative tumor volume)/pre-operative tumor volume x 100%. T2 or FLAIR pre- and post-operative signals were carefully compared to corresponding slices’ diffusion weighted imaging (DWI) sequences when the ROI was drawn to distinguish surgery related edema or ischemia from residual tumor (10).
Our study chose the survminer package in R software to determine optimal cutoff values of imaging variables which were possible risk factors for outcome. The optimal cutoff values were calculated according to each continuous imaging variables, the survival time, and the survival status. These cutoff values were shown in Figure 1 [pre-operative CE tumor volume (≥42.38 cm3 vs <42.38 cm3), pre-operative NCE tumor volume (≥28.66 cm3 vs <28.66 cm3) and EOR-CE (≥98.42% vs <98.42%) and EOR-NCE (≥73.80% vs <73.80%)]. The patients were then divided into high and low imaging variable subgroups according to the above optimal cutoff values. The overall survival analysis was performed between high and low imaging variable subgroups as well to confirm their prognostic difference (Figure 2). These cutoff values were used for both EOR-NCE and EOR-CE nomograms.
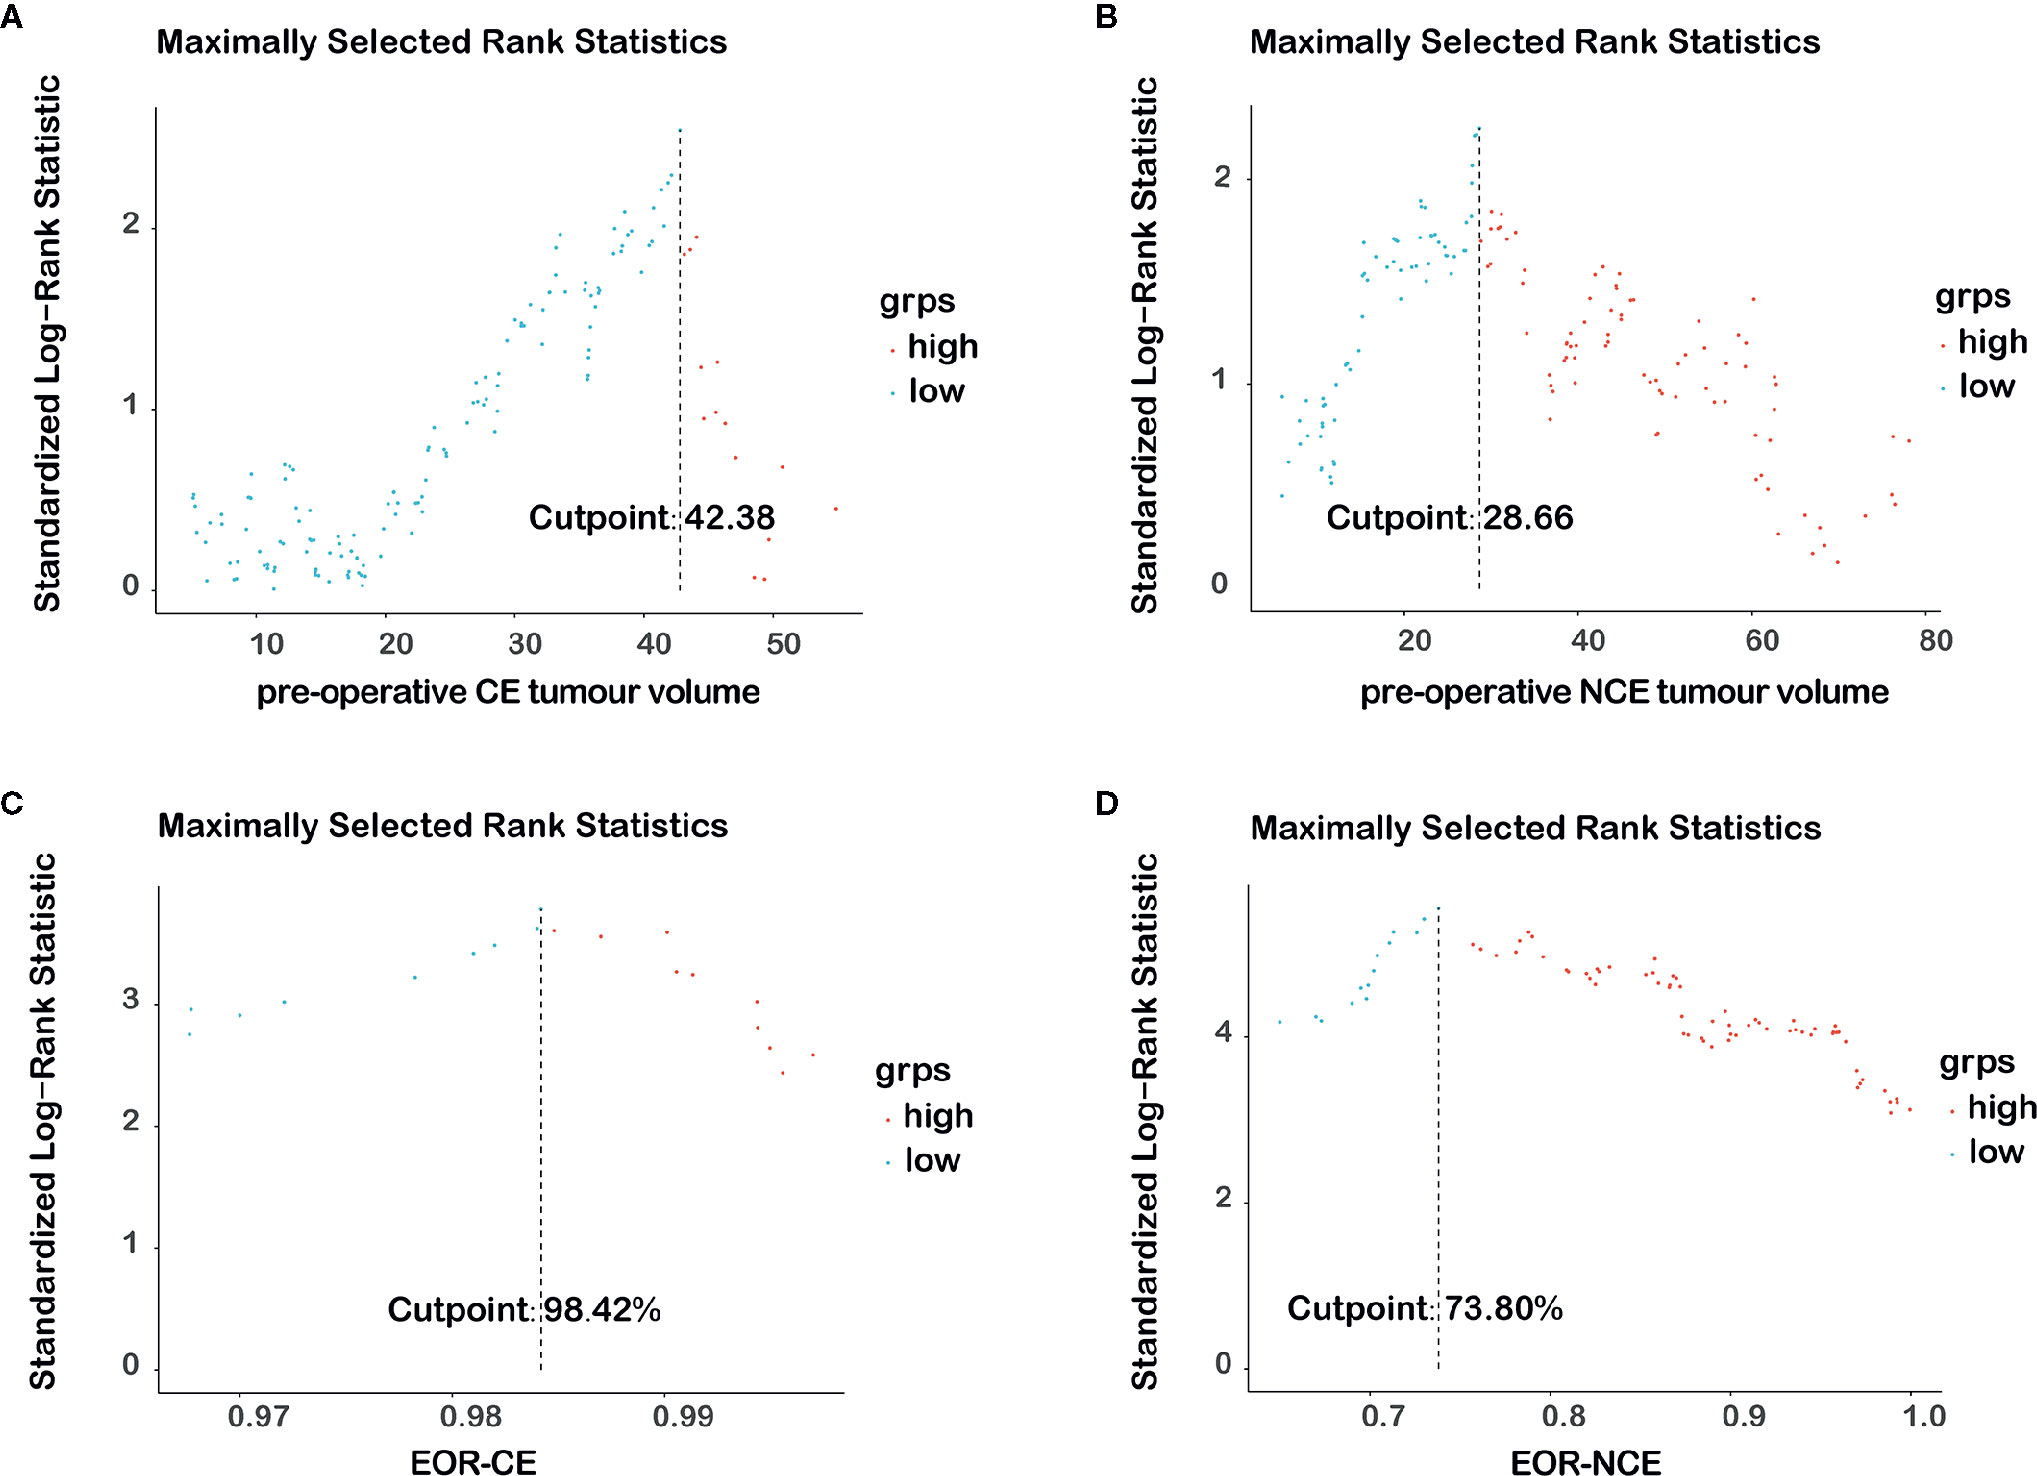
Figure 1 The distributions and optimal cutoff values of each imaging variable were shown in (A–D).
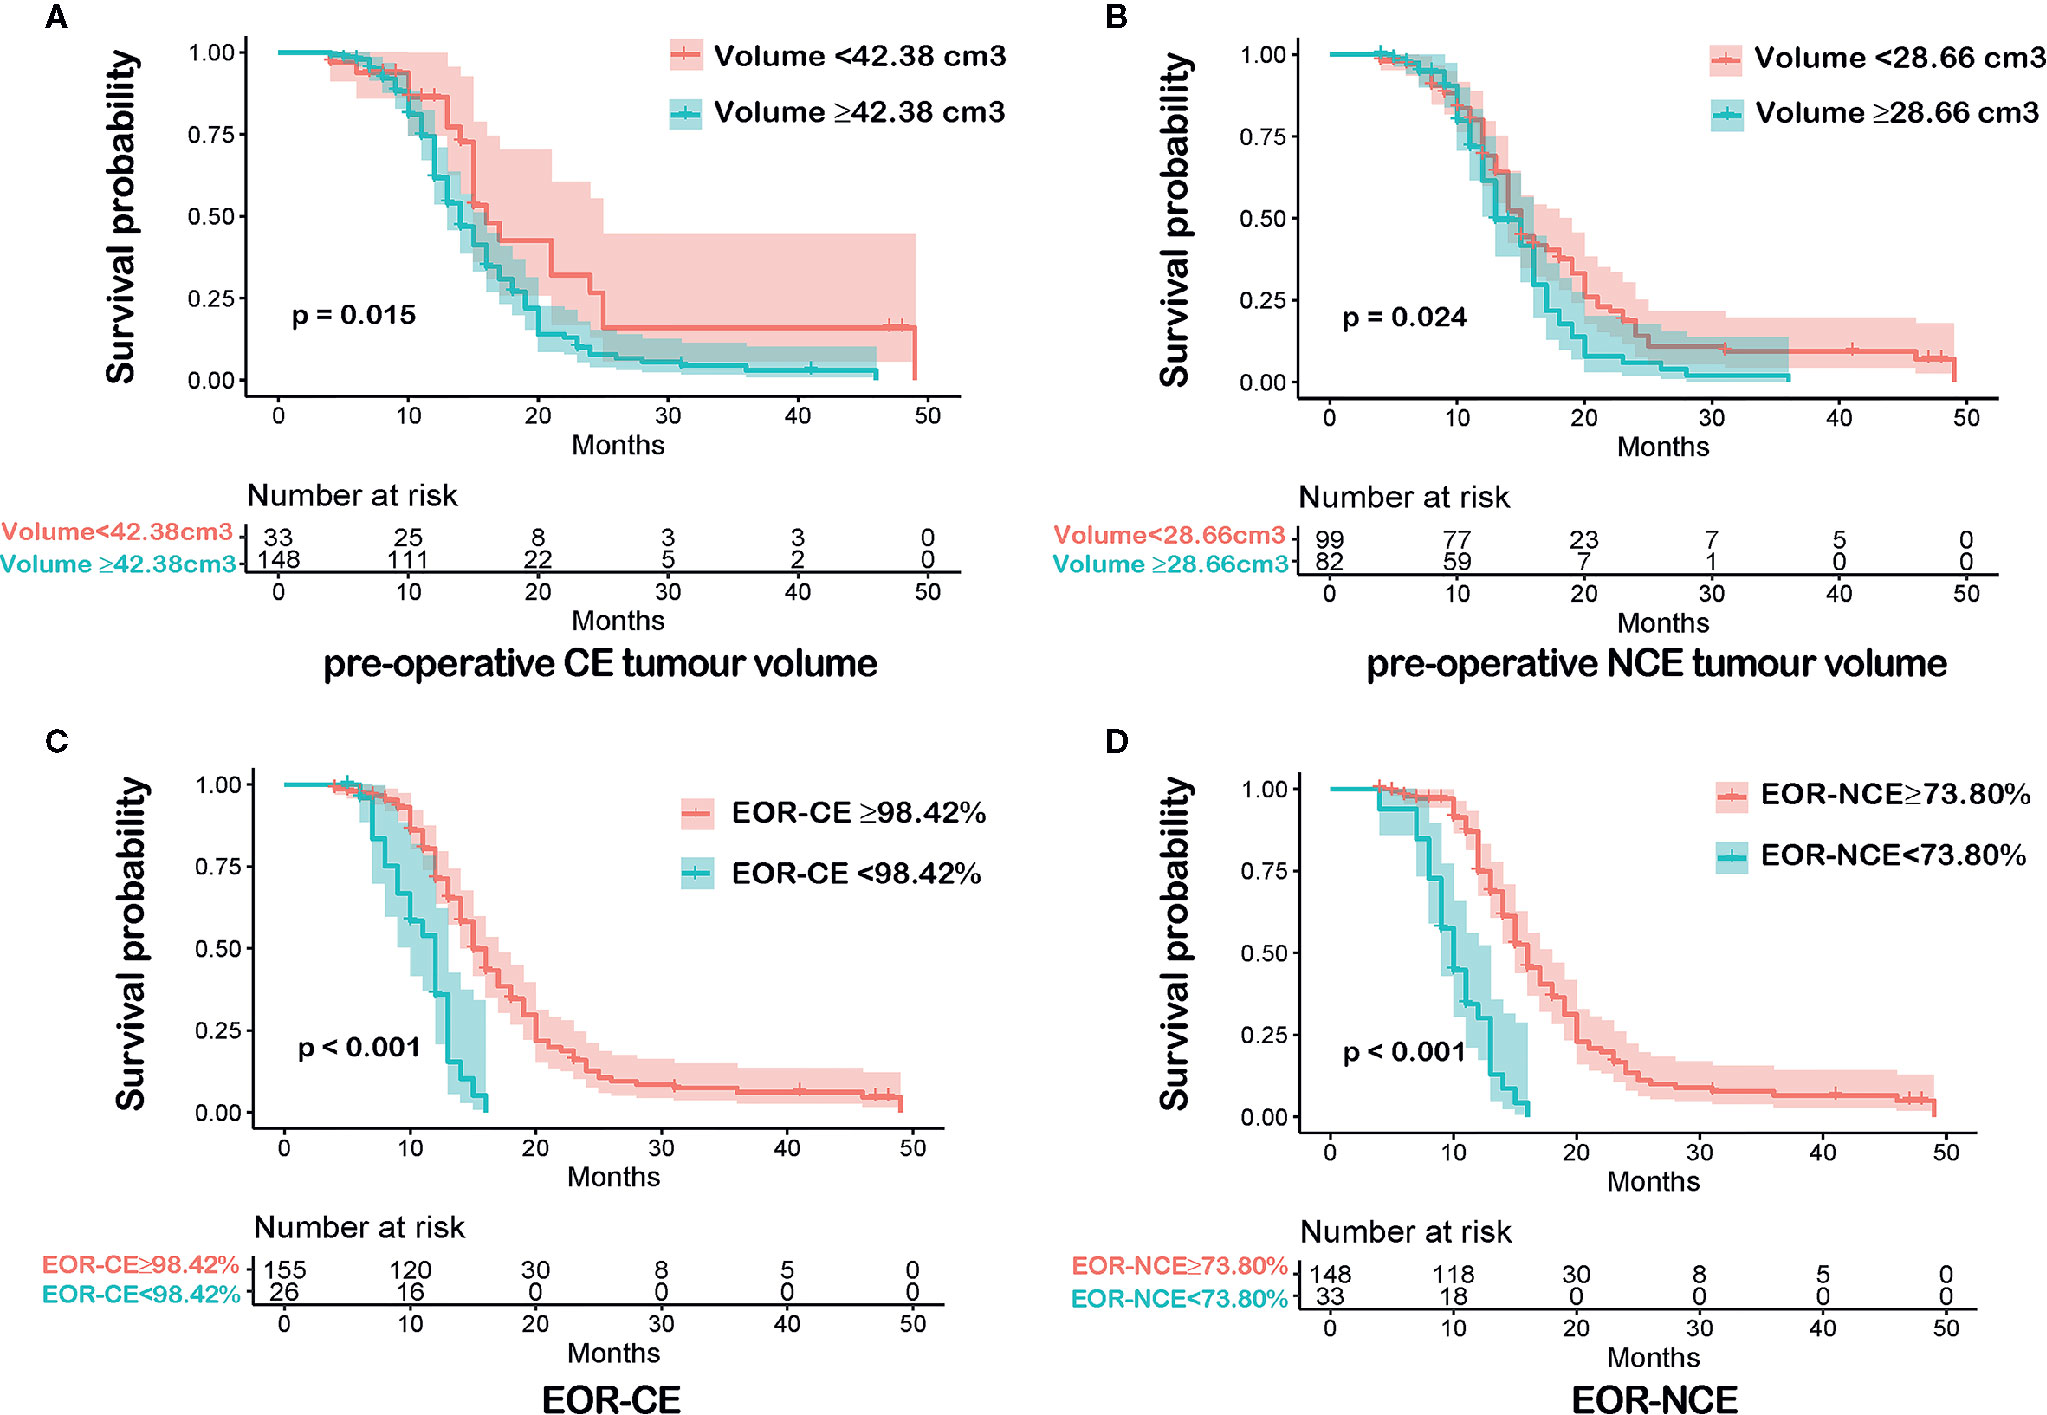
Figure 2 Kaplan-Meier survival analyses between each imaging variable subgroups according to the optimal cutoff value were shown in (A–D). Patients with pre-operative CE tumour volume<42.38 cm3 had a longer overall survival (OS) than that of pre-operative CE tumour volume≥42.38 cm3, P = 0.015 (A). Patients with pre-operative NCE tumour volume<28.66 cm3 exhibited a more favorable OS than that of pre-operative NCE tumour volume≥28.66 cm3, P = 0.024 (B). Patients with EOR-CE≥98.42% showed a better OS than that of EOR-CE <98.42%, P < 0.001 (C). Patients with EOR-NCE≥73.80% demonstrated a longer OS than that of EOR-NCE<73.80%, P < 0.001 (D).
All pathological sections of these patients were re-evaluated by three neuropathologists (JMW, GLL and JD) according to the 2016 WHO classification of tumors of the CNS. MGMT promoter methylation and IDH mutation were detected by sequencing. The data were deposited in Dryad Digital Repository (doi:10.5061/dryad.xsj3tx9d4).
For the EOR-NCE nomogram, clinical variables that may be associated with survival of nGBM were recorded from the medical history by two neurosurgeons (PZ and XHC), including age (continuous), sex (male or female) KPS (<70 or ≥70), MGMT methylation (yes, no), IDH mutant (yes, no). Imaging variables included pre-operative CE tumor volume≥42.38 cm3 (yes, no), pre-operative NCE tumor volume≥28.66 cm3 (yes, no), EOR-CE≥98.42% (yes, no) and EOR-NCE≥73.80% (yes, no). Survival time was defined as the period from tumor resection to death or last follow-up. Survival status (alive or dead) at the 12-, 18- and 24-month time points was recorded according to patients’ follow-up results.
In addition, an EOR-CE nomogram was also established using the same cohorts of patients and statistical methods as for the EOR-NCE nomogram. The EOR-CE nomogram included all the above-mentioned prognostic factors for analysis, without EOR-NCE.
The statistical analysis was performed by R software (version 4.0.2, The R Foundation for Statistical Computing, Vienna, Austria). Continuous variables were compared by t-tests and categorical variables were assessed by chi-square tests. Survival analysis was calculated using the Kaplan–Meier method and log-rank test to compared the difference between derivation and validation cohorts. Univariate analysis was to evaluate the risk of possible factors, then these factors reached P<0.05 were subjected to Cox regression analysis. The nomogram was constructed according to the results of Cox regression analyses using the rms package. The final model was determined based on backward step-down selection process. The discrimination of the models was assessed in terms of the concordance index(C-index). Calibration curves were also drawn to evaluate the concordance between predicted and actual probabilities. Decision curve analyses (DCA) were employed to compare the benefits and improved performance of different models (19). Receiver operating characteristic (ROC) curves were conducted, and the area under the curve (AUC) values were calculated in order to compare the predictive efficacies of the different models. All tests were two-sided and were considered statistically significant when P<0.05.
In this study, we enrolled 301 patients from Beijing Tiantan Hospital. Patients were randomly sub-grouped into either the training cohort (n=181) or the testing cohort (n=120) in a 6 to 4 ratio, respectively. Both demographics and clinical characteristics of each group were compared as shown in Table 1. No statistically significant differences in these characteristics were observed between the derivation and validation cohorts. The overall survival time between these two cohorts was not significant (P=0.600, Figure 3).
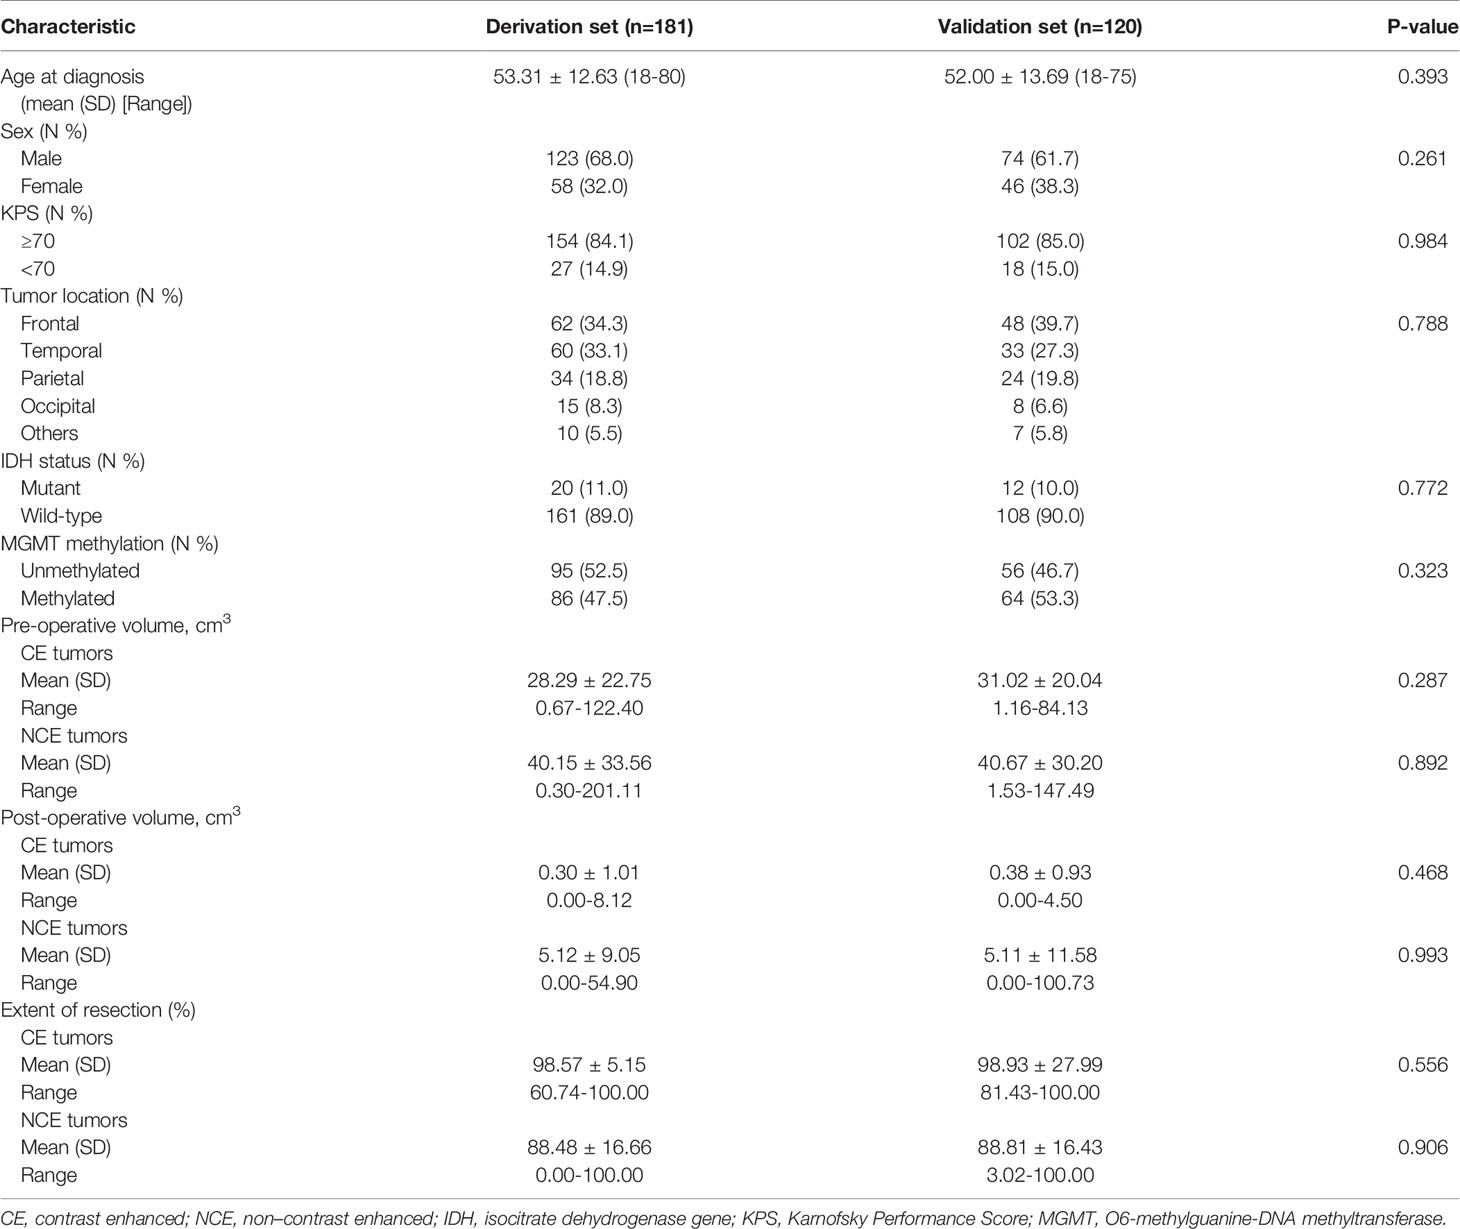
Table 1 Baseline characteristics of enrolled patients with newly diagnosed glioblastoma in the derivation and external validation cohorts.
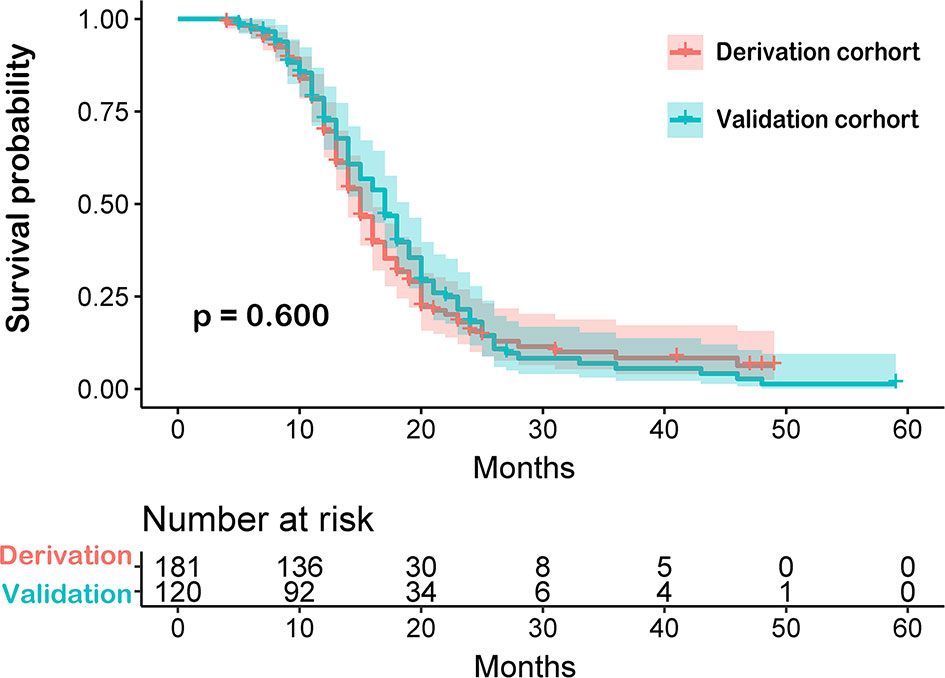
Figure 3 Comparison between derivation and validation cohorts of newly diagnosed glioblastoma patients by Kaplan-Meier survival curves. The overall survival time between these two cohorts was not significant.
Age at diagnosis, sex, KPS, IDH mutation status, MGMT methylation status, pre-operative CE tumor volume, pre-operative NCE tumor volume, EOR-CE and EOR-NCE were possible prognostic risk factors for univariate analysis for the derivation cohort of patients with nGBM. Results showed that older age, KPS<70, unmethylated MGMT, wild type IDH, larger pre-operative CE and NCE tumor volume, lower EOR-CE and EOR-NCE were significantly associated with increased risk of mortality in the derivation cohort (all P<0.05), but sex did not exhibit a significant difference (P=0.178). Both EOR-NCE and EOR-CE nomograms used the same cohort of patients and cutoff values of variables for univariate analysis. The included variables for each nomogram were presented in Supplemental Table 1. Then variables with significant difference were next subjected to multivariate Cox regression analyses for the two models, respectively.
For the EOR-NCE nomogram, multivariate Cox regression analyses indicated that older age (HR=1.019, 95% confidence interval [CI]: 1.003–1.035, P=0.020), KPS≥70 (HR=0.455, 95% CI: 0.280–0.739, P=0.001), methylated MGMT (HR=0.539, 95% CI: 0.372–0.780, P=0.001), IDH mutant (HR=0.311, 95% CI: 0.160–0.606, P <0.001), EOR-CE≥98.42% (HR=0.457, 95% CI: 0.249–0.837, P=0.011) and EOR-NCE≥73.80% (HR=0.149, 95% CI: 0.256–0.873, P<0.001) were independent prognostic factors for outcomes (Table 2).
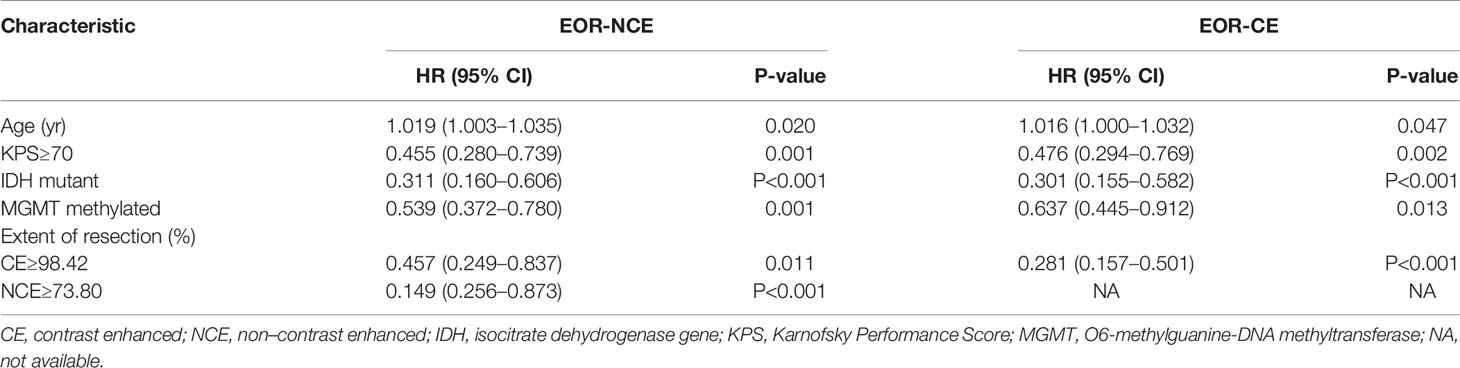
Table 2 Multivariate Cox regression analyses in patients with newly diagnosed GBM for the derivation cohort of EOR-NCE and EOR-CE nomogram.
For the EOR-CE nomogram, multivariate Cox regression analyses showed that older age (HR=1.016, 95% CI: 1.000–1.032, P=0.047), KPS≥70 (HR=0.476, 95% CI: 0.294–0.769, P=0.002), methylated MGMT (HR=0.637, 95% CI: 0.445–0.912, P=0.013), IDH mutant (HR=0.301, 95% CI: 0.155–0.582, P<0.001), EOR-CE≥98.42% (HR=0.281, 95% CI: 0.157–0.501, P<0.001) were independent prognostic factors for survival (Table 2).
The EOR-NCE and EOR-CE prognostic nomogram were constructed according to coefficients of the Cox multivariate regression analysis (Figure 4 and Supplemental Figure 1, respectively). Each factor’s single score presenting on a point scale axis was summed for total score. Then, the total score was used to determine the likelihood of 12-, 18-, and 24-month survival probabilities for individual patients based on the total point scale axis.
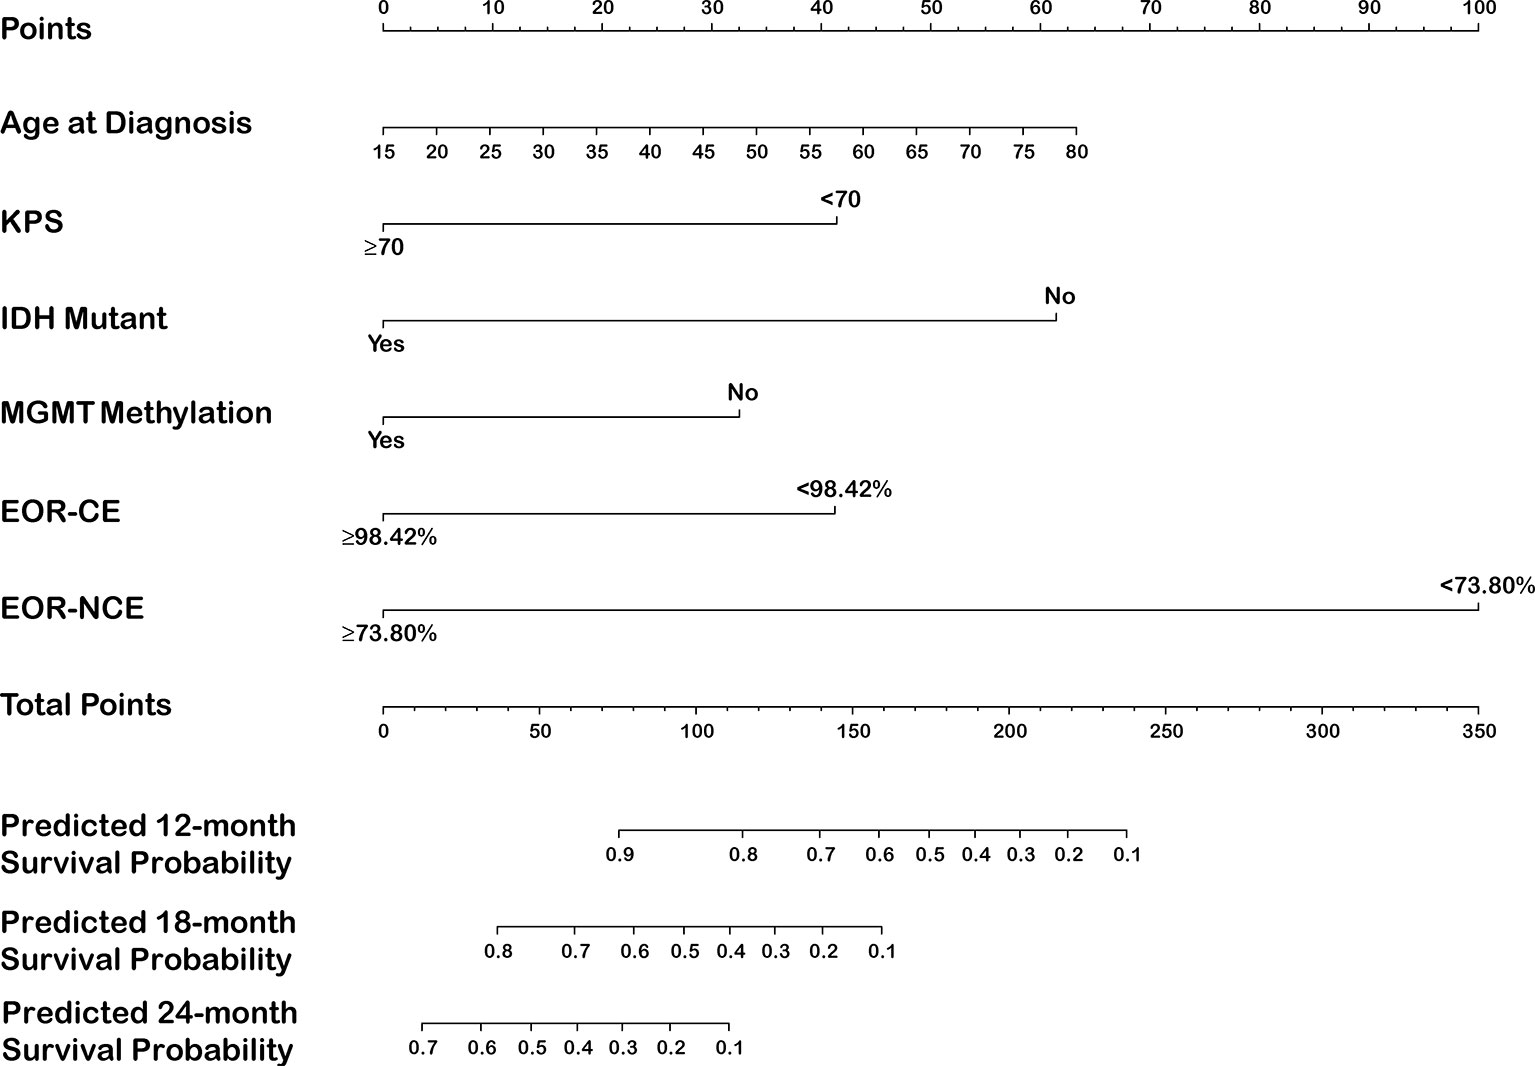
Figure 4 Nomogram for predicting 12-, 18-, and 24-month survival in newly diagnosed glioblastoma patients integrated with EOR-NCE.
The C-index of the EOR-NCE nomogram was 0.779 (95% CI, 0.733–0.824, P<0.05) in the derivation cohort. Moreover, to verify the validity of the derivation nomogram, we developed a random cohort of patients with nGBM. The C-index of the validation nomogram was 0.790 (95% CI, 0.743–0.838, P<0.05). Additionally, the calibration curve showed that there was high consistency between the nomogram’s predicted probability and actual survival probability for 12-, 18-, and 24-month survival (Figure 5).
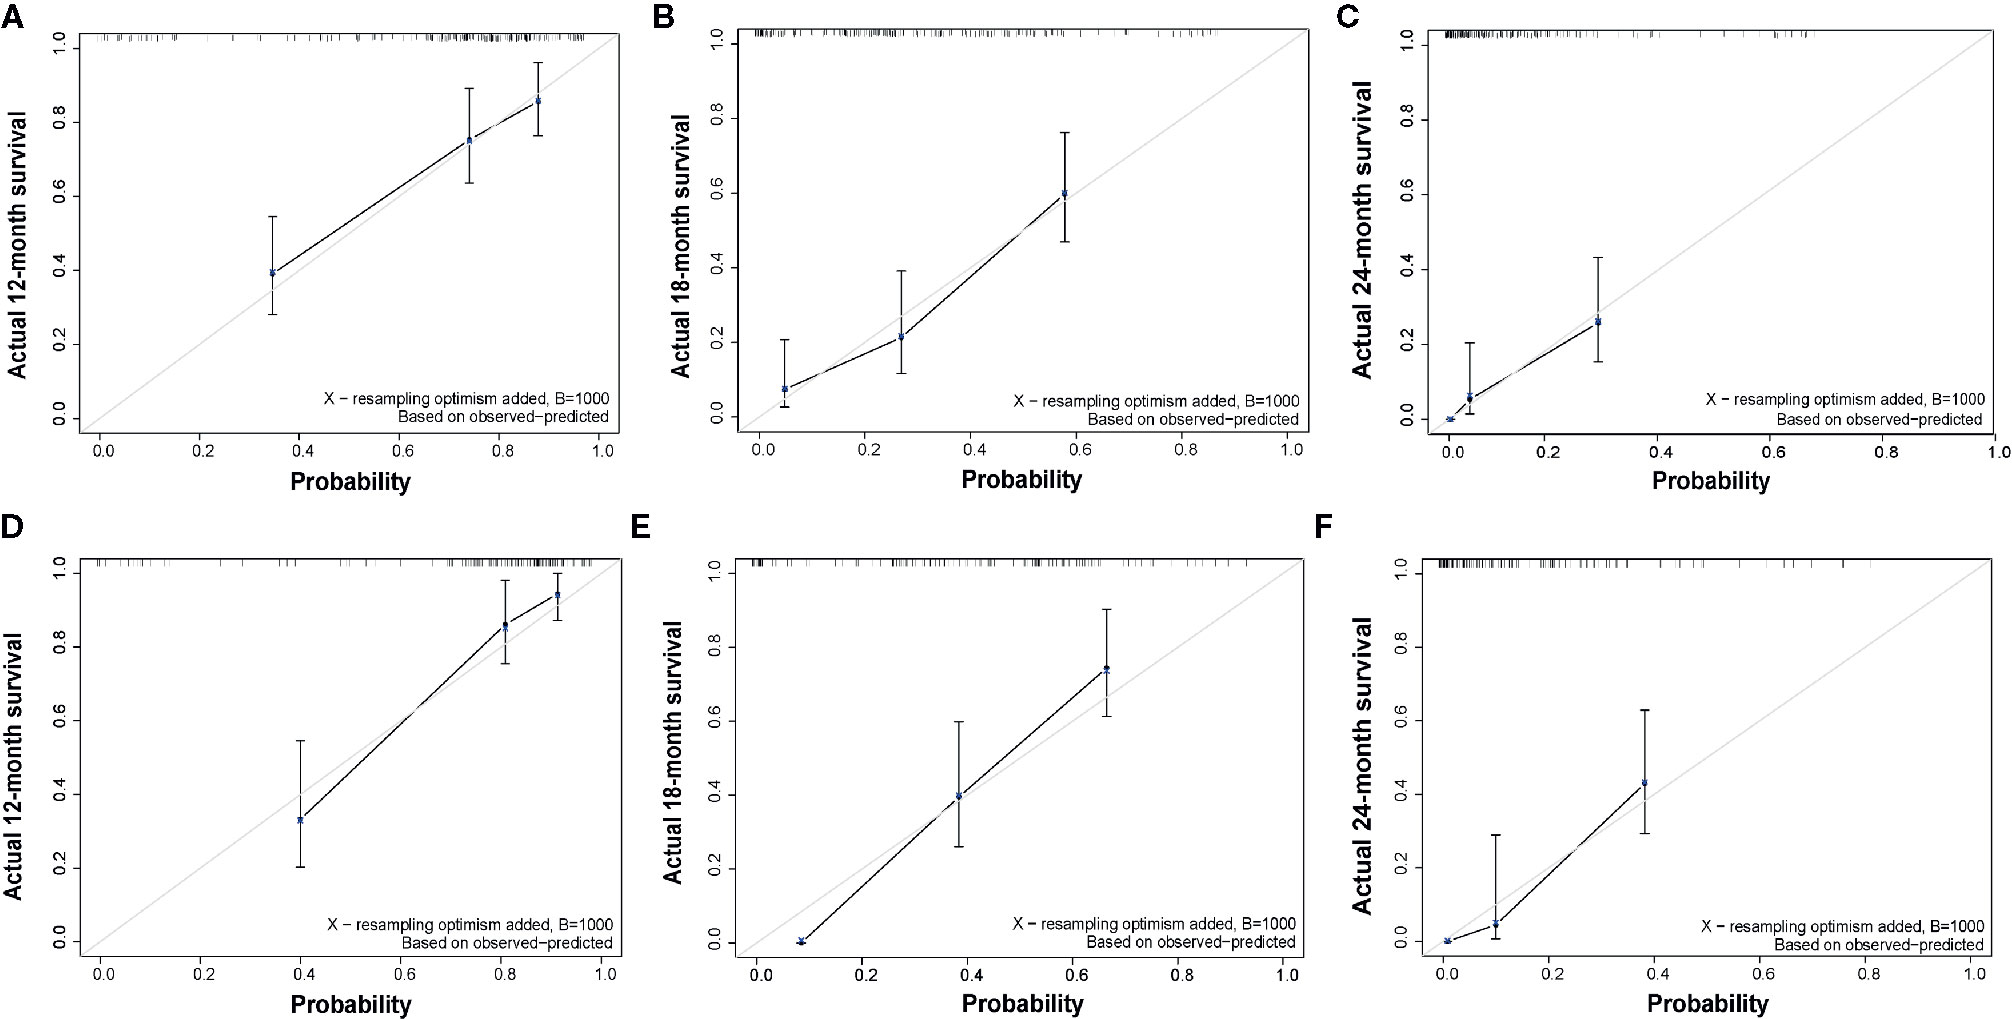
Figure 5 Calibration curve of overall survival at 12-, 18-, and 24-months for the derivation (A–C) and validation (D–F) cohorts for EOR-NCE nomogram, showing that there was high consistency between the nomogram’s predicted probability and actual survival probability. The nomogram-predicted probability of survival and actual survival are plotted on the x-axis and y-axis, respectively.
Similarly, we also calculate the predictive parameters of EOR-CE nomogram. The C-index was 0.727 (95% CI, 0.681–0.774, P<0.05)] in derivation cohort. And the C-index was 0.748 (95% CI, 0.699–0.797, P<0.05) in validation cohort. Besides, the calibration curve showed a modest consistency between the nomogram’s predicted probability and actual survival probability for 12-, 18-, and 24-month survivals (Supplemental Figure 2).
The EOR-NCE nomogram showed superior predictive ability compared to that of the EOR-CE nomogram for nGBM, supported by the evaluative parameters. First, C-indexes of these two models with statistical significance were compared to assess their concordance. We found the C-index of the EOR-NCE nomogram was higher than for the EOR-CE in both the derivation (0.779 vs 0.727) and validation (0.790 vs 0.748) cohorts, illustrating that this nomogram was well suited for predicting survival in nGBM patients. Second, on decision curve analysis (DCA), the EOR-NCE nomogram provided superior net benefit and improved performance for the 12-, 18-, and 24-month prognostic assessments compared to EOR-CE models in the derivation (Figures 6A–C) and validation (Figures 6D–F) cohorts. Last but not least, in the established ROC, AUC of the EOR-NCE nomogram was higher than that in the EOR-CE nomogram (0.730 vs 0.656 for 12-month, 0.803 vs 0.756 for 18-month, 0.803 vs 0.763 for 24-month in derivation cohort; 0.870 vs 0.809 for 12-month, 0.848 vs 0.821 for 18-month, 0.920 vs 0.902 for 24-month in validation cohort, Table 3).
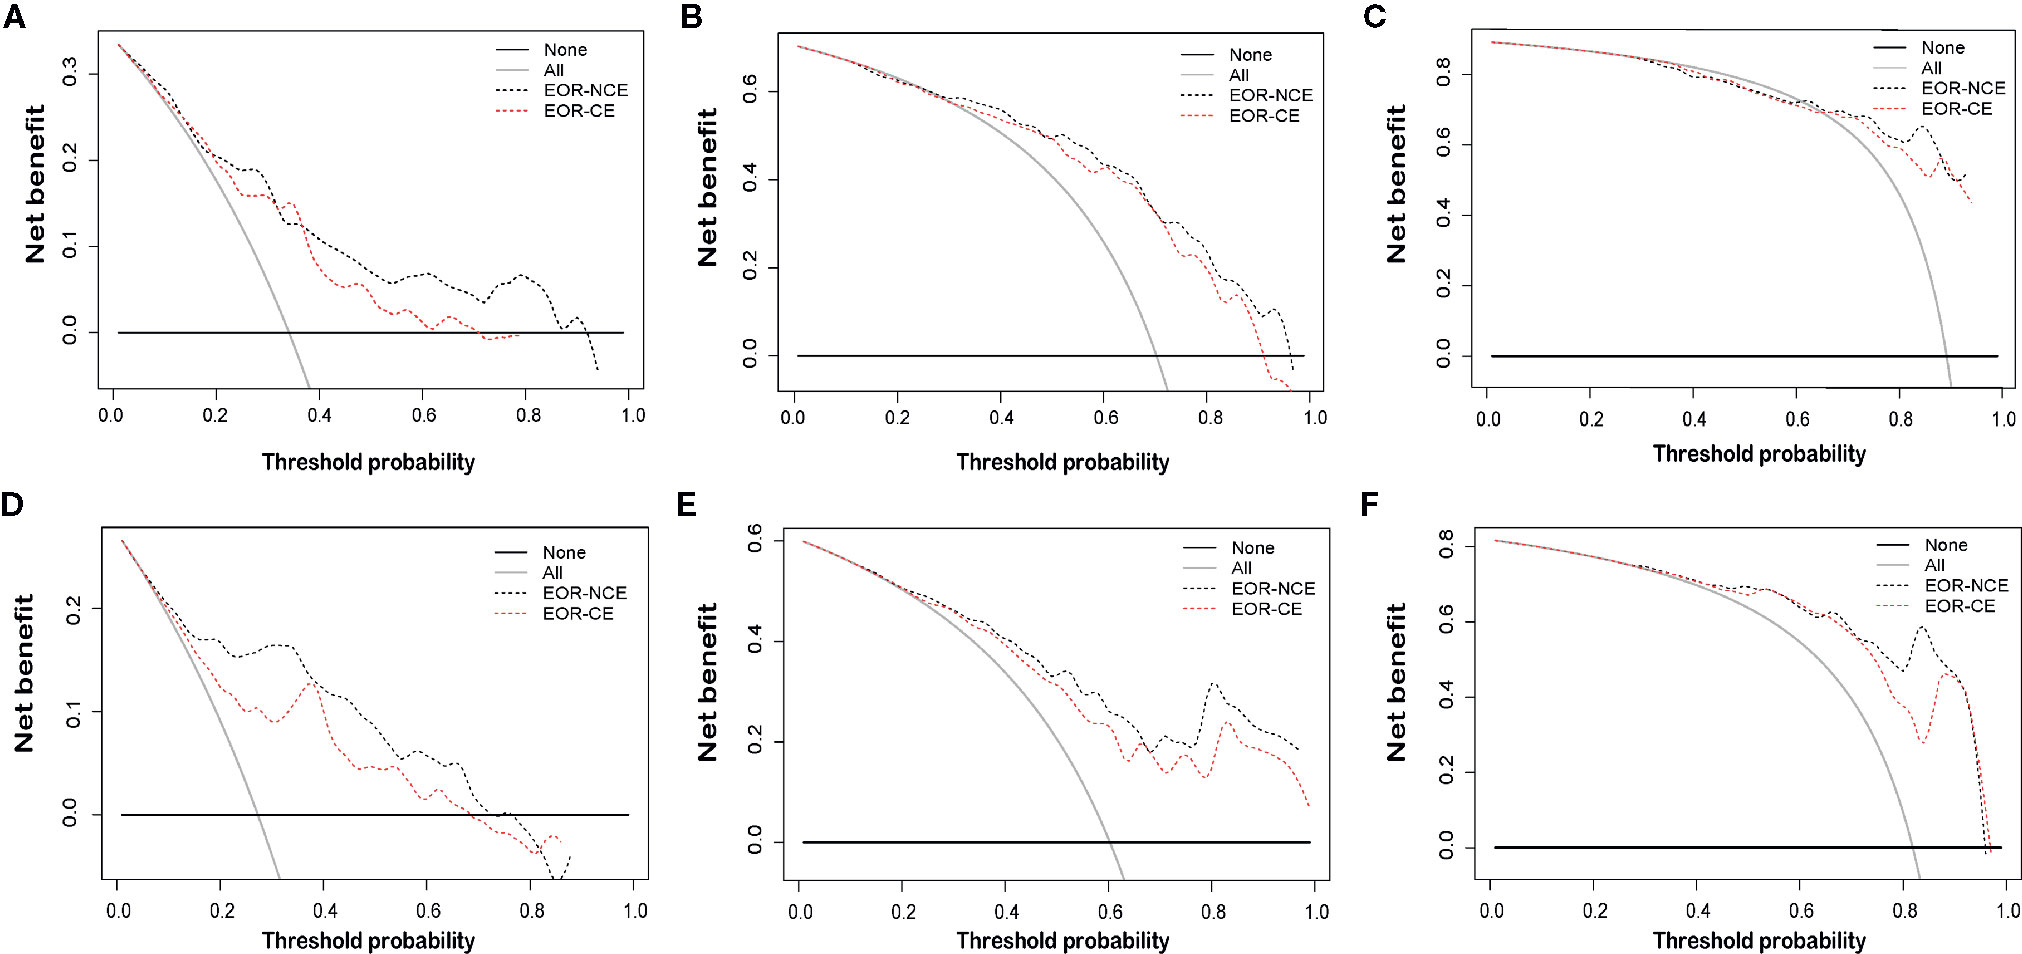
Figure 6 Decision curve analysis (DCA) at 12-, 18-, and 24-months for the derivation (A–C) and validation (D–F) cohorts. DCAs also showed the difference of net benefit between EOR-NCE and EOR-CE nomograms. The horizontal black line represents no patients experiencing a survival event, while the grey line represents all patients reaching the survival endpoint. The decision curve analysis of the EOR-NCE nomogram provides better net benefit than the EOR-CE models across a range of threshold probabilities.
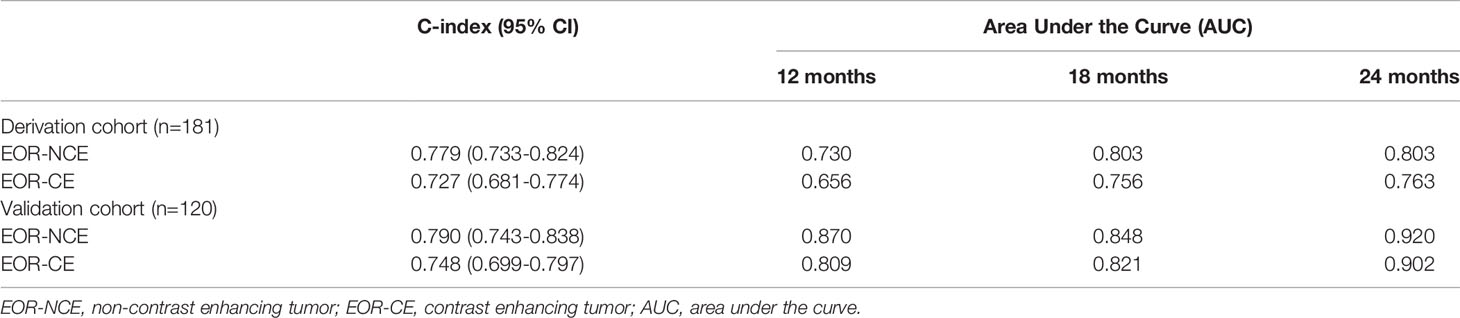
Table 3 The predictive discrimination ability of the EOR-NCE nomogram compared to EOR-CE nomogram in the derivation and validation cohorts.
Patients with nGBM inevitably suffer a very poor prognosis. Only approximately 5% of patients survive beyond 5 years (1, 3). Therefore, precise evaluation of individual prognosis is of high value for treatment decision-making and providing patients with consultation on intervals of follow-up and prognosis. Given that nomograms are commonly used for prediction of survival among many kinds of cancer in a visual manner (11–14), we created nomograms to estimate individual survival probability at 12-, 18-, 24-months in nGBM and included clinical, imaging, molecular factors and EOR of CE and NCE tumors as prognostic variables. Our nomogram model was simple and clinically practical since all risk factors were easily accessible for clinical use to predict survival.
In previous nomograms on nGBM, a series of prognostic factors associated with survival were documented. Gorlia et al. constructed an easy-to-use nomogram for nGBM patients showing that MGMT promoter methylation status was significant for prognosis, as well as age at diagnosis, performance status and EOR (15). Similar results were also reported by Molitoris et al (20). In addition, Haley et al. used gender for analysis and found that age at diagnosis, KPS, EOR and MGMT promoter methylation status were all prognostic factors (16). Then, they added concurrent chemoradiotherapy and confirmed its predictive value in a subsequent nomogram of a wild type IDH nGBM cohort (17). Although there remain some nomograms that were developed using other prognostic factors (20–22), little attention has been paid to the extent of neurosurgical resection of NCE.
To the best of our knowledge, we are the first to construct an individual nomogram including the prognostic variable of EOR-NCE for nGBM. There were several reasons we made this choice. First, GBM cells infiltrate beyond the CE component and form NCE lesions containing higher tumor burden than that of the CE area (23). Moreover, with the increased understanding of the NCE component, many neurosurgical studies have recommended the extended strategy of removing the NCE component of GBM rather than focusing only on the EOR-CE (9, 24, 25). Subsequently, several studies further confirmed that patients with GBM who underwent aggressive resection of NCE tumors achieved longer survival than patients who only received gross total resection of the CE component (10, 26, 27). Therefore, supported by these findings, we evaluated the EOR-NCE in the current nomogram.
Consistently, our proposed model suggested that older age at diagnosis, KPS<70, unmethylated MGMT, IDH wild-type, lower EOR-CE and EOR-NCE were independently associated with decreased survival (10, 15–17, 20, 26, 27). However, our study did not identify significant prognostic significance for male gender (15, 16, 20), pre-operative CE tumor volume or pre-operative NCE tumor volume (28–32), which were controversial in previous studies.
In this study, the EOR-NCE nomogram was well suited for estimating survival probability, as supported by the C-index (0.779 for divarication and 0.790 for validation cohorts) and the good agreement calibration curves. Furthermore, we compared the EOR-NCE nomogram to the EOR-CE nomogram to confirm their predictive value. As expected, in both derivation and validation cohorts the EOR-NCE nomogram showed superior predictive abilities compared to the EOR-CE model for survival probability in C-index and the AUC; moreover, the EOR-NCE nomogram exhibited better net benefit and improved performance for 12-, 18-, and 24-month prognostic assessment compared to EOR-CE nomogram. The AUC of the EOR-NCE nomogram was higher than in the EOR-CE nomogram 12-, 18-, and 24-months. This result also demonstrated that the EOR-NCE nomogram much was better than the EOR-CE nomogram for survival prediction.
There are several limitations in our study. Firstly, although patients in this nomogram were randomly assigned to the derivation and validation cohorts, they were from a single center without including their races for analysis. To make the predictive model widely applicable, it needs additional datasets from other centers to validate the predictive efficiency of our derivation model. Secondly, in order to reduce bias manual segmentation in clinical use, CE and NCE tumor volumes should be automatically measured by advanced computer technologies in the future. Besides, IDH mutation in our study is only relative to IDH1 gene alterations, since IDH2 gene mutants are rare in GBM (33). The predictive value of IDH2 remains to be explored in future nomograms. IDH1 mutation is 10% to 11% in our cohort was mildly higher than the previous report (10%) (34), which may have been caused by selection bias of these enrolled patients. Moreover, the sample size of our study was small; therefore, we will enlarge the numbers in our cohorts to further confirm the accuracy of the current nomogram model. This study included patients with nGBM who received standard treatment for this derivation and validation model. One reason is that concurrent chemoradiotherapy with temozolomide has been advanced all over the world as standard of care since 2005 and prolongs survival (18). Additionally, the uniform post-operative treatment allowed full evaluation of the prognostic value of the EOR-NCE nomogram. Therefore, our study did not include patients with nGBM who underwent monotherapy of either chemotherapy or radiotherapy.
This nomogram integrated with EOR-NCE to examine survival probability in nGBM patients was developed and independently validated. In addition, the EOR-NCE nomogram exhibited better performance than the EOR-CE nomogram in predicting survival. Our nomogram has important clinical and prognostic significance in assessment of individualized survival rather than of group evaluation. We believe this model will have important use for providing health consultations for patients and their relatives with respect to treatment decisions and prognosis.
Free online tool for implementing EOR-NCE nomogram is provided: https://ttns-6.shinyapps.io/nomogram_for_gbm_patients/.
The data were deposited in Dryad Digital Repository (doi: 10.5061/dryad.xsj3tx9d4).
The studies involving human participants were reviewed and approved by This study was approved by the Ethical Committee of Beijing Tiantan Hospital, Capital Medical University. The patients/participants provided their written informed consent to participate in this study.
ZZ: design study, analysis and manuscript drafting. ZJ: data analysis and plotting of figures. DL, YZ, CL, YM, XC, and JF: clinical data collection and follow-up of patients. YW and SH: manuscript preparation, revising and language polish. NJ: study design, approved the final version of the manuscript and study supervision. All authors contributed to the article and approved the submitted version.
This work was supported by Capital Characteristic Clinical Application Project (Z181100001718196).
The authors declare that the research was conducted in the absence of any commercial or financial relationships that could be construed as a potential conflict of interest.
We would like to thank Dr. Zehao Wu (Beijing Children’s Hospital, Capital Medical University) and Dr. Meiping Wang (School of Public Health, Capital Medical University) for statistical consultation.
The Supplementary Material for this article can be found online at: https://www.frontiersin.org/articles/10.3389/fonc.2020.598965/full#supplementary-material
Supplementary Figure 1 | Nomogram for predicting 12-, 18-, and 24-month survival in newly diagnosed glioblastoma patients integrated with EOR-CE.
Supplementary Figure 2 | Calibration curve of overall survival at 12-, 18-, and 24-months for the derivation (A-C) and validation (D-F) cohorts for EOR-CE nomogram, showing a modest consistency between the nomogram’s predicted probability and actual survival probability. The nomogram-predicted probability of survival and actual survival are plotted on the x-axis and y-axis, respectively.
1. Ostrom QT, Cioffi G, Gittleman H, Patil N, Waite K, Kruchko C, et al. CBTRUS Statistical Report: Primary Brain and Other Central Nervous System Tumors Diagnosed in the United States in 2012-2016. Neuro Oncol (2019) 21(Suppl 5):v1–v100. doi: 10.1093/neuonc/noz150
2. Alexander BMTF. Cloughesy, Adult Glioblastoma. J Clin Oncol (2017) 35(21):2402–9. doi: 10.1200/JCO.2017.73.0119
3. Lapointe S, Perry A, Butowski NA. Primary brain tumours in adults. Lancet (2018) 392(10145):432–46. doi: 10.1016/S0140-6736(18)30990-5
4. Molinaro AM, Taylor JW, Wiencke JK, Wrensch MR. Genetic and molecular epidemiology of adult diffuse glioma. Nat Rev Neurol (2019) 15(7):405–17. doi: 10.1038/s41582-019-0220-2
5. Binabaj MM, Bahrami A, ShahidSales S, Joodi M, Joudi Mashhad M, Hassanian SM, et al. The prognostic value of MGMT promoter methylation in glioblastoma: A meta-analysis of clinical trials. J Cell Physiol (2018) 233(1):378–86. doi: 10.1002/jcp.25896
6. McGirt MJ, Chaichana KL, Gathinji M, Attenello FJ, Than K, Olivi A, et al. Independent association of extent of resection with survival in patients with malignant brain astrocytoma. J Neurosurg (2009) 110(1):156–62. doi: 10.3171/2008.4.17536
7. Sanai N, Polley MY, McDermott MW, Parsa AT, Berger MS. An extent of resection threshold for newly diagnosed glioblastomas. J Neurosurg (2011) 115(1):3–8. doi: 10.3171/2011.2.JNS10998
8. Stummer W, van den Bent MJ, Westphal M. Cytoreductive surgery of glioblastoma as the key to successful adjuvant therapies: new arguments in an old discussion. Acta Neurochir (Wien) (2011) 153(6):1211–8. doi: 10.1007/s00701-011-1001-x
9. Lasocki AF. Gaillard, Non-Contrast-Enhancing Tumor: A New Frontier in Glioblastoma Research. AJNR Am J Neuroradiol (2019) 40(5):758–65. doi: 10.3174/ajnr.A6025
10. Molinaro AM, Hervey-Jumper S, Morshed RA, Young J, Han SJ, Chunduru P, et al. Association of Maximal Extent of Resection of Contrast-Enhanced and Non-Contrast-Enhanced Tumor With Survival Within Molecular Subgroups of Patients With Newly Diagnosed Glioblastoma. JAMA Oncol (2020) 6(4):495–03. doi: 10.1001/jamaoncol.2019.6143
11. Kim JH, Kim HS, Seo WY, Nam CM, Kim KY, Jeung HC, et al. External validation of nomogram for the prediction of recurrence after curative resection in early gastric cancer. Ann Oncol (2012) 23(2):361–7. doi: 10.1093/annonc/mdr118
12. Karakiewicz PI, Briganti A, Chun FK, Trinh QD, Perrotte P, Ficarra V, et al. Multi-institutional validation of a new renal cancer-specific survival nomogram. J Clin Oncol (2007) 25(11):1316–22. doi: 10.1200/JCO.2006.06.1218
13. Polterauer S, Grimm C, Hofstetter G, Concin N, Natter C, Sturdza A, et al. Nomogram prediction for overall survival of patients diagnosed with cervical cancer. Br J Cancer (2012) 107(6):918–24. doi: 10.1038/bjc.2012.340
14. Hartaigh BO, Gransar H, Callister T, Shaw LJ, Schulman-Marcus J, Stuijfzand WJ, et al. Development and Validation of a Simple-to-Use Nomogram for Predicting 5-, 10-, and 15-Year Survival in Asymptomatic Adults Undergoing Coronary Artery Calcium Scoring. JACC Cardiovasc Imaging (2018) 11(3):450–8. doi: 10.1016/j.jcmg.2017.03.018
15. Gorlia T, van den Bent MJ, Hegi ME, Mirimanoff RO, Weller M, Cairncross JG, et al. Nomograms for predicting survival of patients with newly diagnosed glioblastoma: prognostic factor analysis of EORTC and NCIC trial 26981-22981/CE.3. Lancet Oncol (2008) 9(1):29–38. doi: 10.1016/S1470-2045(07)70384-4
16. Gittleman H, Lim D, Kattan MW, Chakravarti A, Gilbert MR, Lassman AB, et al. An independently validated nomogram for individualized estimation of survival among patients with newly diagnosed glioblastoma: NRG Oncology RTOG 0525 and 0825. Neuro-Oncology (2017) 19(5):669–77. doi: 10.1093/neuonc/now208
17. Gittleman H, Cioffi G, Chunduru P, Molinaro AM, Berger MS, Sloan AE, et al. An independently validated nomogram for isocitrate dehydrogenase-wild-type glioblastoma patient survival. Neurooncol Adv (2019) 1(1):vdz007. doi: 10.1093/noajnl/vdz007
18. Stupp R, Mason WP, van den Bent MJ, Weller M, Fisher B, Taphoorn MJ, et al. Radiotherapy plus concomitant and adjuvant temozolomide for glioblastoma. N Engl J Med (2005) 352(10):987–96. doi: 10.1056/NEJMoa043330
19. Gao F, Li X, Wan G, Li Y, Zhang Q, Liu Y, et al. Development and external validation of a prognostic nomogram for acute decompensation of chronic hepatitis B cirrhosis. BMC Gastroenterol (2018) 18(1):179. doi: 10.1186/s12876-018-0911-y
20. Molitoris JK, Rao YJ, Patel RA, Kane LT, Badiyan SN, Gittleman H, et al. Multi-institutional external validation of a novel glioblastoma prognostic nomogram incorporating MGMT methylation. J Neurooncol (2017) 134(2):331–8. doi: 10.1007/s11060-017-2529-2
21. Bell EH, Pugh SL, McElroy JP, Gilbert MR, Mehta M, Klimowicz AC, et al. Molecular-Based Recursive Partitioning Analysis Model for Glioblastoma in the Temozolomide Era: A Correlative Analysis Based on NRG Oncology RTOG 0525. JAMA Oncol (2017) 3(6):784–92. doi: 10.1001/jamaoncol.2016.6020
22. Kim N, Chang JS, Wee CW, Kim IA, Chang JH, Lee HS, et al. Validation and optimization of a web-based nomogramfor predicting survival of patients with newly diagnosed glioblastoma. Strahlentherapie Und Onkol (2020) 196(1):58–69. doi: 10.1007/s00066-019-01512-y
23. Eidel O, Burth S, Neumann JO, Kieslich PJ, Sahm F, Jungk C, et al. Tumor Infiltration in Enhancing and Non-Enhancing Parts of Glioblastoma: A Correlation with Histopathology. PLoS One (2017) 12(1):e0169292. doi: 10.1371/journal.pone.0169292
24. Jain R, Poisson LM, Gutman D, Scarpace L, Hwang SN, Holder CA, et al. Outcome Prediction in Patients with Glioblastoma by Using Imaging, Clinical, and Genomic Biomarkers: Focus on the Nonenhancing Component of the Tumor. Radiology (2014) 272(2):484–93. doi: 10.1148/radiol.14131691
25. Lasocki A, Gaillard F, Tacey M, Drummond K, Stuckey S. Incidence and prognostic significance of non-enhancing cortical signal abnormality in glioblastoma. J Med Imaging Radiat Oncol (2016) 60(1):66–73. doi: 10.1111/1754-9485.12421
26. Li YM, Suki D, Hess K, Sawaya R. The influence of maximum safe resection of glioblastoma on survival in 1229 patients: Can we do better than gross-total resection? J Neurosurg (2016) 124(4):977–88. doi: 10.3171/2015.5.JNS142087
27. Pessina F, Navarria P, Cozzi L, Ascolese AM, Simonelli M, Santoro A, et al. Maximize surgical resection beyond contrast-enhancing boundaries in newly diagnosed glioblastoma multiforme: is it useful and safe? A single institution retrospective experience. J Neurooncol (2017) 135(1):129–39. doi: 10.1007/s11060-017-2559-9
28. Park JK, Hodges T, Arko L, Shen M, Dello Iacono D, McNabb A, et al. Scale to predict survival after surgery for recurrent glioblastoma multiforme. J Clin Oncol (2010) 28(24):3838–43. doi: 10.1200/JCO.2010.30.0582
29. Iliadis G, Selviaridis P, Kalogera-Fountzila A, Fragkoulidi A, Baltas D, Tselis N, et al. The importance of tumor volume in the prognosis of patients with glioblastoma: comparison of computerized volumetry and geometric models. Strahlenther Onkol (2009) 185(11):743–50. doi: 10.1007/s00066-009-2015-7
30. Pope WB, Sayre J, Perlina A, Villablanca JP, Mischel PS, Cloughesy TF. MR imaging correlates of survival in patients with high-grade gliomas. AJNR Am J Neuroradiol (2005) 26(10):2466–74. doi: 10.1080/02841850500216293
31. Lacroix M, Abi-Said D, Fourney DR, Gokaslan ZL, Shi W, DeMonte F, et al. A multivariate analysis of 416 patients with glioblastoma multiforme: prognosis, extent of resection, and survival. J Neurosurg (2001) 95(2):190–8. doi: 10.3171/jns.2001.95.2.0190
32. Ellingson BM, Cloughesy TF, Lai A, Nghiemphu PL, Mischel PS, Pope WB. Quantitative volumetric analysis of conventional MRI response in recurrent glioblastoma treated with bevacizumab. Neuro Oncol (2011) 13(4):401–9. doi: 10.1093/neuonc/noq206
33. Stupp R, Brada M, van den Bent MJ, Tonn JC, Pentheroudakis G, Group EGW. High-grade glioma: ESMO Clinical Practice Guidelines for diagnosis, treatment and follow-up. Ann Oncol (2014) 25 Suppl 3:iii93–101. doi: 10.1093/annonc/mdu050
Keywords: newly diagnosed glioblastoma, extent of resection, non-contrast enhancing tumor, nomogram, prognosis
Citation: Zhang Z, Jin Z, Liu D, Zhang Y, Li C, Miao Y, Chi X, Feng J, Wang Y, Hao S and Ji N (2020) A Nomogram Predicts Individual Prognosis in Patients With Newly Diagnosed Glioblastoma by Integrating the Extent of Resection of Non-Enhancing Tumors. Front. Oncol. 10:598965. doi: 10.3389/fonc.2020.598965
Received: 26 August 2020; Accepted: 21 October 2020;
Published: 02 December 2020.
Edited by:
Herui Wang, National Cancer Institute (NCI), United StatesReviewed by:
Jill Barnholtz-Sloan, Case Western Reserve University, United StatesCopyright © 2020 Zhang, Jin, Liu, Zhang, Li, Miao, Chi, Feng, Wang, Hao and Ji. This is an open-access article distributed under the terms of the Creative Commons Attribution License (CC BY). The use, distribution or reproduction in other forums is permitted, provided the original author(s) and the copyright owner(s) are credited and that the original publication in this journal is cited, in accordance with accepted academic practice. No use, distribution or reproduction is permitted which does not comply with these terms.
*Correspondence: Nan Ji, amluYW5AYmp0dGgub3Jn; Yaming Wang, eWFtaW5nd2FuZ0Bzb2h1LmNvbQ==; Shuyu Hao, U2h1eXVoYW9AaG90bWFpbC5jb20=
Disclaimer: All claims expressed in this article are solely those of the authors and do not necessarily represent those of their affiliated organizations, or those of the publisher, the editors and the reviewers. Any product that may be evaluated in this article or claim that may be made by its manufacturer is not guaranteed or endorsed by the publisher.
Research integrity at Frontiers
Learn more about the work of our research integrity team to safeguard the quality of each article we publish.