
94% of researchers rate our articles as excellent or good
Learn more about the work of our research integrity team to safeguard the quality of each article we publish.
Find out more
SYSTEMATIC REVIEW article
Front. Oncol. , 15 October 2020
Sec. Cancer Imaging and Image-directed Interventions
Volume 10 - 2020 | https://doi.org/10.3389/fonc.2020.552177
This article is part of the Research Topic Imaging Elasticity as a Tangible Prognostic Factor in Cancers View all 6 articles
 Xiao-wen Huang1†
 Qing-xiu Huang1†Hui Huang2Mei-qing Cheng2Wen-juan Tong2Meng-fei Xian2Jin-yu Liang2*
 Wei Wang2*
Background: Studies have shown inconsistent results regarding the diagnostic performance of ultrasound elastography for axillary lymph node metastasis (ALNM) in breast cancer. This meta-analysis aimed to estimate the diagnostic performance of ultrasound elastography (divided into quantitative and qualitative elastography) for ALNM in patients with breast cancer.
Methods: The PubMed and Embase databases were searched for eligible studies exploring the diagnostic performance of ultrasound elastography for ALNM in patients with breast cancer. The included studies were divided into quantitative and qualitative elastography groups to perform separate meta-analyses. The diagnostic performance was investigated with pooled sensitivity and specificity and diagnostic odds ratio (DOR) using a bivariate mixed-effects regression model. A summary receiver operating characteristic curve was constructed, and the area under the curve (AUC) was calculated.
Results: Seven and 11 studies were included in the quantitative and qualitative elastography meta-analyses, respectively. The pooled sensitivity and specificity, DOR, and AUC with their corresponding 95% confidence intervals were 0.82 (0.75, 0.87), 0.88 (0.78, 0.93), 33 (13, 83), and 0.89 (0.86, 0.91), respectively, for quantitative elastography and 0.81 (0.69, 0.89), 0.92 (0.79, 0.97), 46 (12, 181), and 0.92 (0.89, 0.94), respectively, for qualitative elastography. No significant publication bias existed. Fagan plots demonstrated good clinical utility. However, substantial heterogeneity existed among studies. Study design, measurement, and reference standard served as potential sources of heterogeneity for quantitative studies, which were measurement and reference standard for qualitative studies.
Conclusions: Both quantitative and qualitative elastography seem to be feasible, non-invasive diagnostic tools for ALNM in breast cancer. Nevertheless, the results must be interpreted carefully, paying attention to heterogeneity issues, especially for quantitative elastography studies.
The incidence of breast cancer is rising, and this disease is a serious threat to women's health. Pre-operative evaluation of axillary lymph node status can provide important reference values for determining the clinical stage of and treatment plans for breast cancer (1). Currently, axillary lymph node metastasis (ALNM) in breast cancer patients is diagnosed by axillary lymph node dissection, which may cause complications such as infection, nerve damage, or swelling of soft tissues in the axilla (2). Although sentinel lymph node biopsy is an important non-surgical alternative to axillary lymph node dissection, it is still an invasive procedure and inevitably produces false-negative results (3–5). Thus, it is necessary to explore non-invasive methods for the pre-operative assessment of ALNM.
Ultrasound elastography is a non-invasive detection method that can reflect information about the stiffness of the lesion (6, 7). Based on the fact that malignant lesions are usually harder than normal tissue, many studies have explored the diagnostic value of ultrasound elastography for ALNM in breast cancer (8–12). Some studies have demonstrated that ultrasound elastography is helpful in the pre-operative evaluation of axillary lymph node status (8–10). However, some researchers have reported that the diagnostic performance of ultrasound elastography in ALNM is insufficient (11, 12). Because of these conflicting results, it is necessary to perform a meta-analysis to assess the diagnostic value of ultrasound elastography for ALNM in breast cancer.
According to different imaging principles, ultrasound elastography can be methodologically divided into quantitative and qualitative elastography to assess tissue stiffness (6, 7). Quantitative elastography, mainly shear wave imaging, uses short-duration acoustic radiation forces to generate small localized tissue displacements (1–10 μm), which cause shear wave propagation and are tracked to calculate shear wave velocity or converted to Young's modulus to reflect tissue stiffness. Qualitative elastography, mainly strain imaging, reflects tissue stiffness through the color gradation superimposed on grayscale ultrasound images. Thus, to explore the impact of different imaging principles, we simultaneously investigated the diagnostic performance of quantitative and qualitative elastography for ALNM in breast cancer in this meta-analysis.
We searched the PubMed and Embase databases for studies that assessed the diagnostic performance of ultrasound elastography for ALNM in breast cancer through December 2019. The main search terms were elastography/stiffness, breast cancer, and lymph node/metastasis. The detailed search strategy is shown in the Supplementary Material. The search procedure was performed and confirmed by two investigators (X-wH and Q-xH).
Studies that met the following criteria were included in the meta-analysis: (1) the study was published in English; (2) ultrasound elastography was used to assess axillary lymph node status; (3) the study population consisted of at least 30 confirmed breast cancer patients; and (4) true-positive (TP), false-positive (FP), false-negative (FN), and true-negative (TN) data could be directly or indirectly obtained to construct a diagnostic 2 × 2 table. Duplicate studies, reviews, letters, editorials, case reports, non-human studies, and unrelated studies were excluded. The reference lists of the included studies were reviewed to identify other potentially eligible studies. Two investigators (HH and MC) independently reviewed and selected the studies. In case of disagreement, a consensus was required to reach a decision.
The following data were extracted: first author, published year, country, study design (prospective or retrospective), number of lymph nodes, number of patients, mean age, elastography method, region of interest (ROI) position and size, measurement index, cutoff value, area under the receiver operating characteristic curve (AUC), sensitivity, specificity, TP, FP, FN, TN, and reference standard. If more than one measurement index from the same elastography was reported, only the measurement index with the highest diagnostic performance was extracted. Study quality was assessed using the Quality Assessment of Studies of Diagnostic Accuracy included in Systematic Review (QUADAS-2 tool) (13). This tool was used to assess the quality of diagnostic tests with respect to the following four aspects: patient selection, index test, reference standard, and flow and timing. Each aspect was evaluated based on the risk of bias (low, high, or unclear), with the first three aspects related to applicability. Two investigators (W-jT and M-fX) were assigned to data extraction and quality assessment. When disagreement arose, a consensus was required to reach a decision.
All statistical analyses were performed using the MIDAS module of Stata, Version 12.0 (Stata, College Station, TX, USA), except for the quality assessment graphs, which were plotted using Review Manager, Version 5.3 (Copenhagen: The Nordic Cochrane Center, The Cochrane Collaboration, 2014). All analyses were applied to the quantitative and qualitative elastography meta-analyses.
A bivariate mixed-effects regression model was used to calculate the pooled sensitivity, specificity, positive likelihood ratio (PLR), and negative likelihood ratio (NLR). The diagnostic odds ratio (DOR), the ratio of positivity in diseased patients to positivity in non-diseased patients, was calculated to indicate the diagnostic performance (14). A summary receiver operating characteristic (SROC) curve was plotted, and the AUC with a 95% confidence interval (CI) was calculated to quantitatively assess the pooled result.
It is necessary to assess publication bias for the included studies because studies that report positive results may be easier to publish. Publication bias was assessed by testing the asymmetry of Deeks' funnel plot [the inverse of the square root of the effective sample size (1/rootESS) vs. the natural logarithm of the DOR (lnDOR)]. P < 0.05 for the slope coefficient indicates significant asymmetry, which thus indicates significant publication bias (15).
Heterogeneity was assessed using the inconsistency index I2; a value >50% was considered substantial heterogeneity. If heterogeneity existed, subgroup analysis and meta-regression analysis were performed to explore the potential sources of heterogeneity with the following factors: country, study design (prospective or retrospective), measurement index, reference standard, ex/in vivo research, ROI size, and publication form (conference abstract or full text).
The clinical utility was assessed using a Fagan plot (16), which provided the post-test probability (Ppost) of ALNM when pre-test probabilities (Ppre, suspicion of ALNM) were provided. Ppost was calculated from the likelihood ratio (LR) using Bayes's theorem, with Ppost = (LR × Ppre)/[(1 − Ppre) × (1 − LR)]. In this meta-analysis, a Ppre of 50% was provided to determine the corresponding Ppost of ALNM.
A total of 356 and 503 studies were initially searched from the PubMed and Embase databases, respectively. After removing duplicates, 675 studies were further reviewed. After reviewing the titles and abstracts, 643 studies not related to the topic were removed. Then, the full texts of 32 studies were further reviewed, and 15 studies were removed (one animal study, four studies not limited to breast cancer patients, three studies from which the data could not be extracted, and seven unrelated studies). Finally, 17 studies were included in this meta-analysis. Among the 17 included studies, six reported only quantitative elastography measurements (17–22), ten reported only qualitative elastography measurements (9–12, 23–28), and one reported both quantitative and qualitative elastography measurements (8). Therefore, the seven studies that reported quantitative elastography measurements were included in the quantitative elastography meta-analysis (8, 17–22). The 11 studies that reported qualitative elastography measurements were included in the qualitative elastography meta-analysis (8–12, 23–28). The inclusion and exclusion processes are summarized in Figure 1.
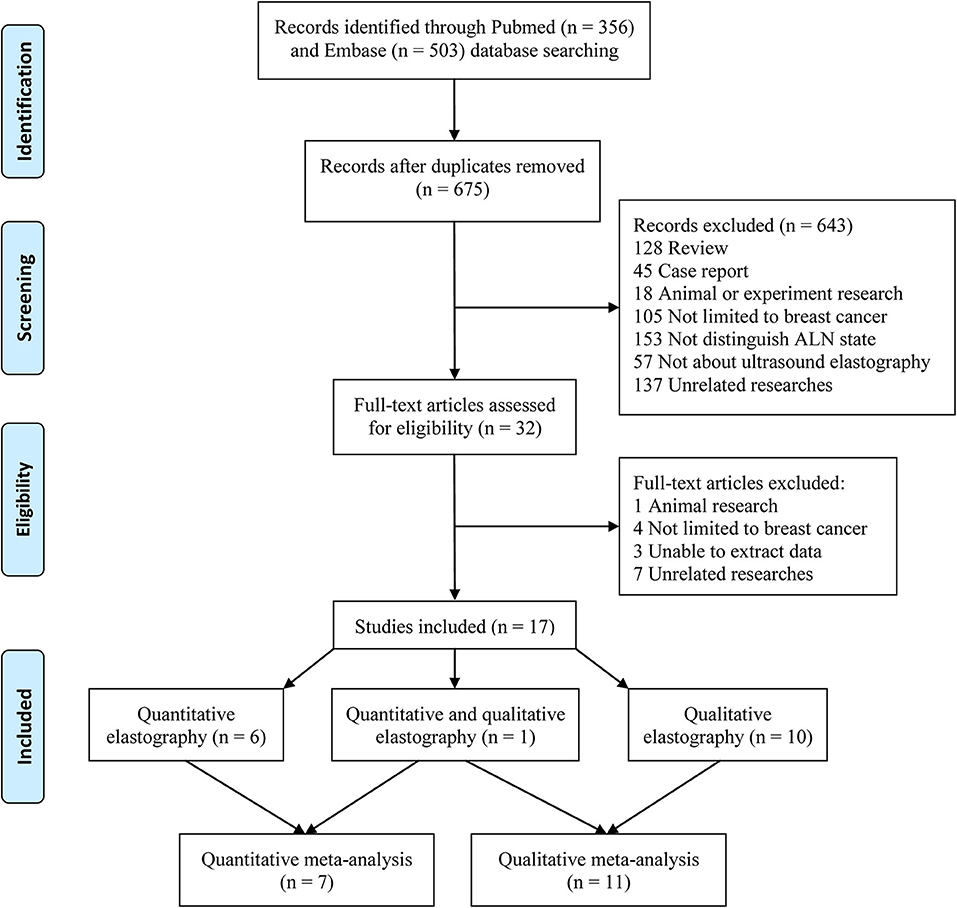
Figure 1. Flowchart of eligible studies.
The main characteristics of the included studies are displayed in Table 1. There were 827 (251 metastatic, 576 benign) and 1,072 (576 metastatic, 496 benign) lymph nodes included in the quantitative and qualitative elastography meta-analyses, respectively. In the quantitative studies, two were ex vivo assessments of lymph nodes (18, 20). In the qualitative studies, two were published as conference abstracts (9, 11). One study compared a new qualitative pattern classification for shear wave elastography (SWE) to quantitative SWE parameters (8). Therefore, this study was included in the quantitative elastography meta-analysis (including the quantitative SWE parameters) and the qualitative elastography meta-analysis (including the qualitative SWE pattern classification). The QUADAS-2 tool showed that the included studies generally had good methodological quality (Table 2), which was intuitively displayed in the corresponding quality assessment graphs (Supplementary Material, Supplementary Figures 1, 2).
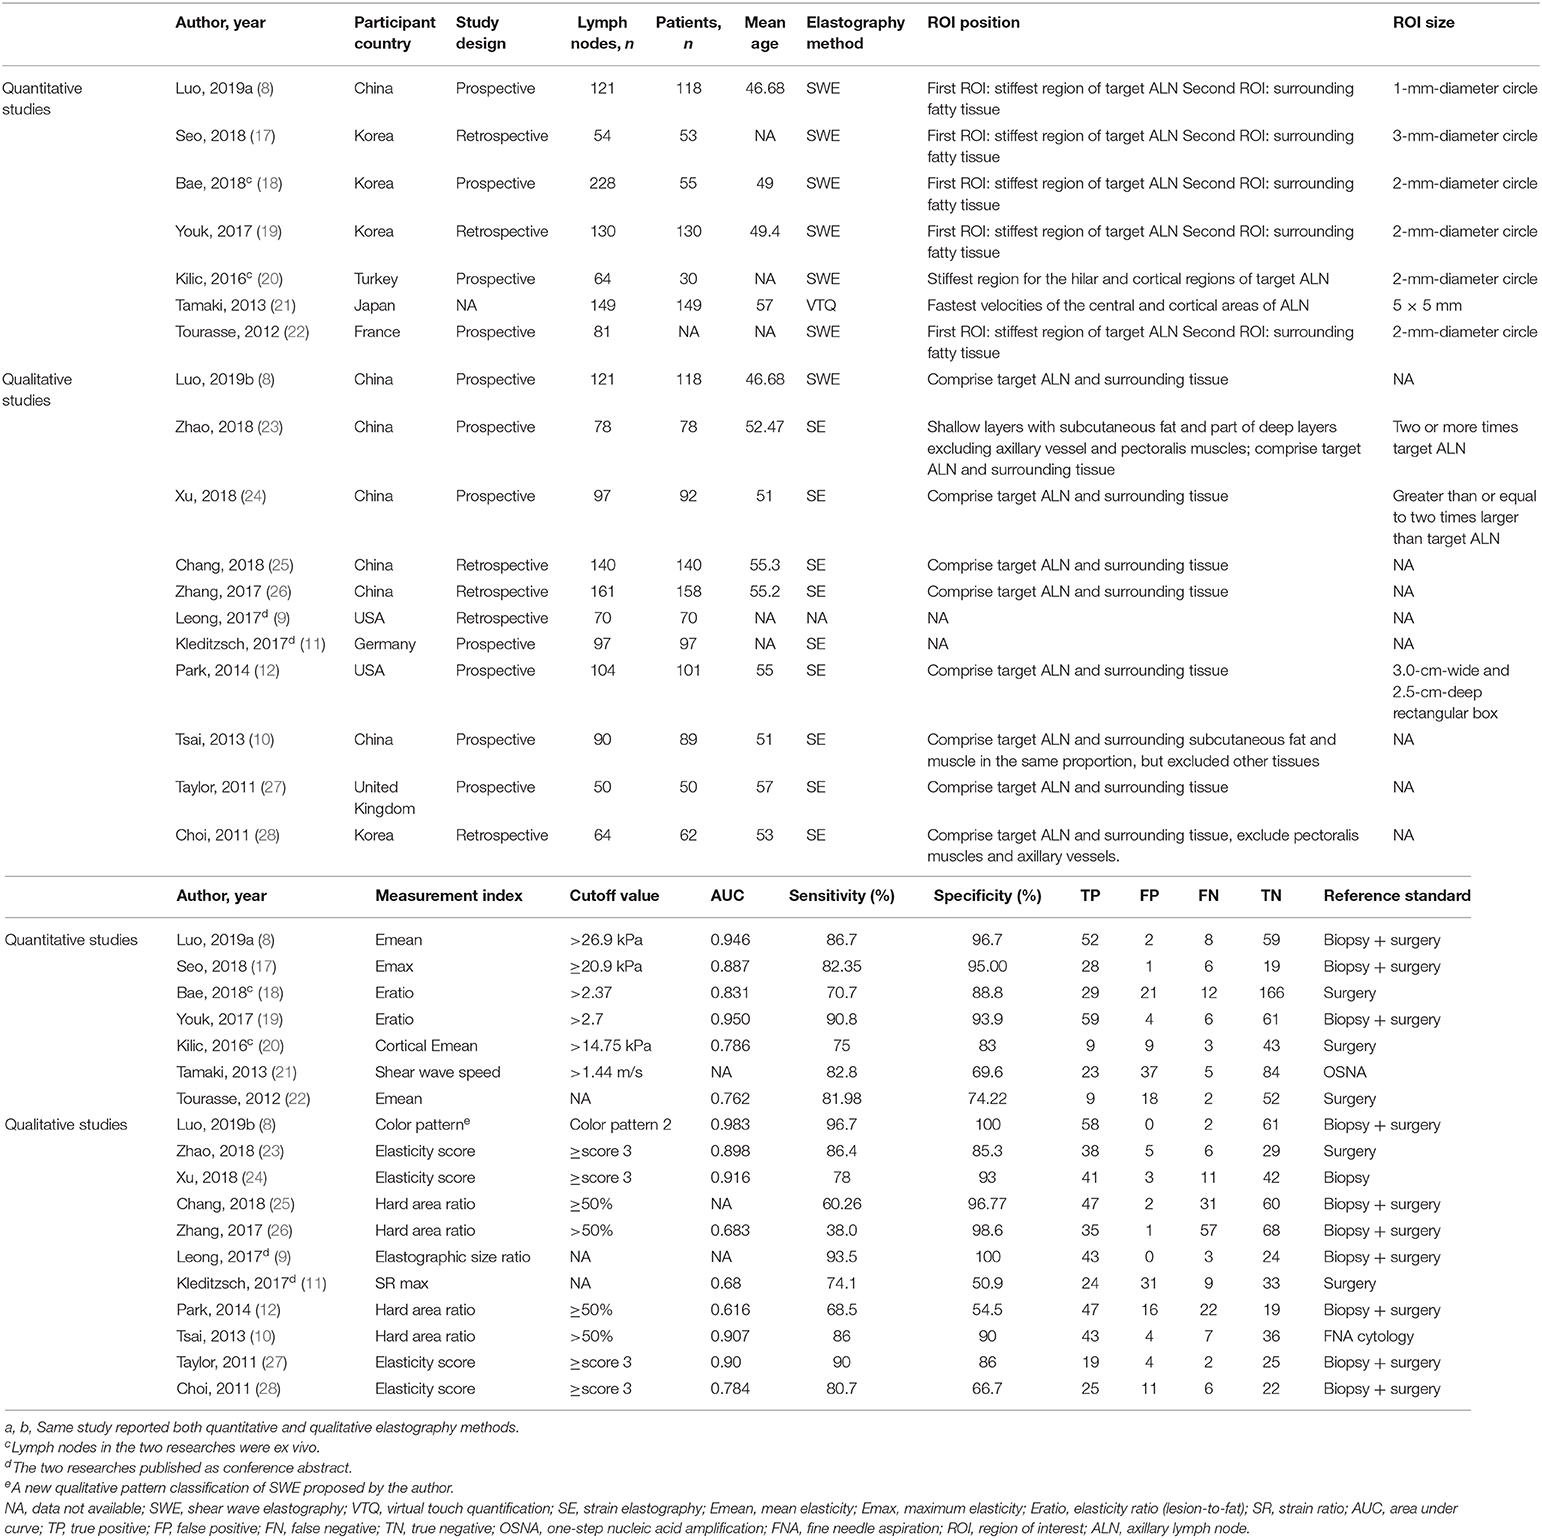
Table 1. Characteristics of the included studies.
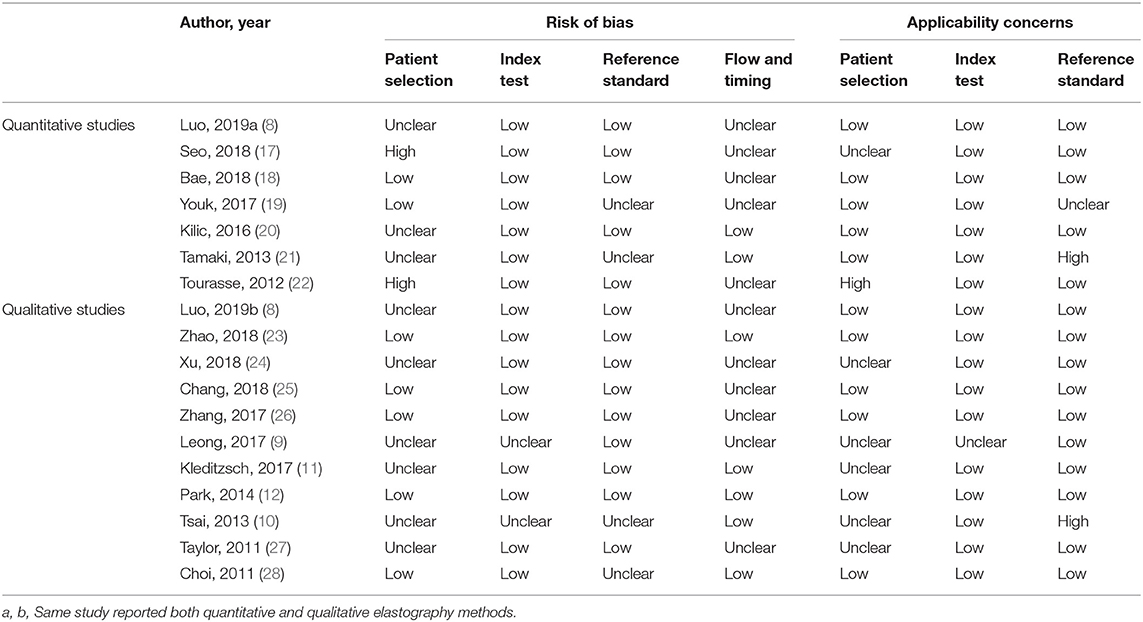
Table 2. Quality assessment of the included studies.
In the seven studies included in the quantitative elastography meta-analysis, the sensitivity and specificity for ALNM diagnosis ranged from 70.7 to 90.8% and 69.6 to 96.7%, respectively (Table 1). In the 11 studies included in the qualitative elastography meta-analysis, the sensitivity and specificity for ALNM diagnosis ranged from 38 to 96.7% and 50.9 to 100%, respectively (Table 1). The sensitivity and specificity of the pooled results are displayed in the forest plots (Figure 2). For the quantitative elastography studies, the pooled sensitivity, specificity, PLR, NLR, and DOR with their corresponding 95% CIs were 0.82 (0.75, 0.87), 0.88 (0.78, 0.93), 6.8 (3.6, 12.7), 0.20 (0.14, 0.29), and 33 (13, 83), respectively; the corresponding values for the quantitative studies were 0.81 (0.69, 0.89), 0.92 (0.79, 0.97), 9.7 (3.4, 27.4), 0.21 (0.12, 0.36), and 46 (12, 181). The areas under the SROC curves for the quantitative and qualitative elastography studies were 0.89 (0.86, 0.91) and 0.92 (0.89, 0.94), respectively (Figure 3).
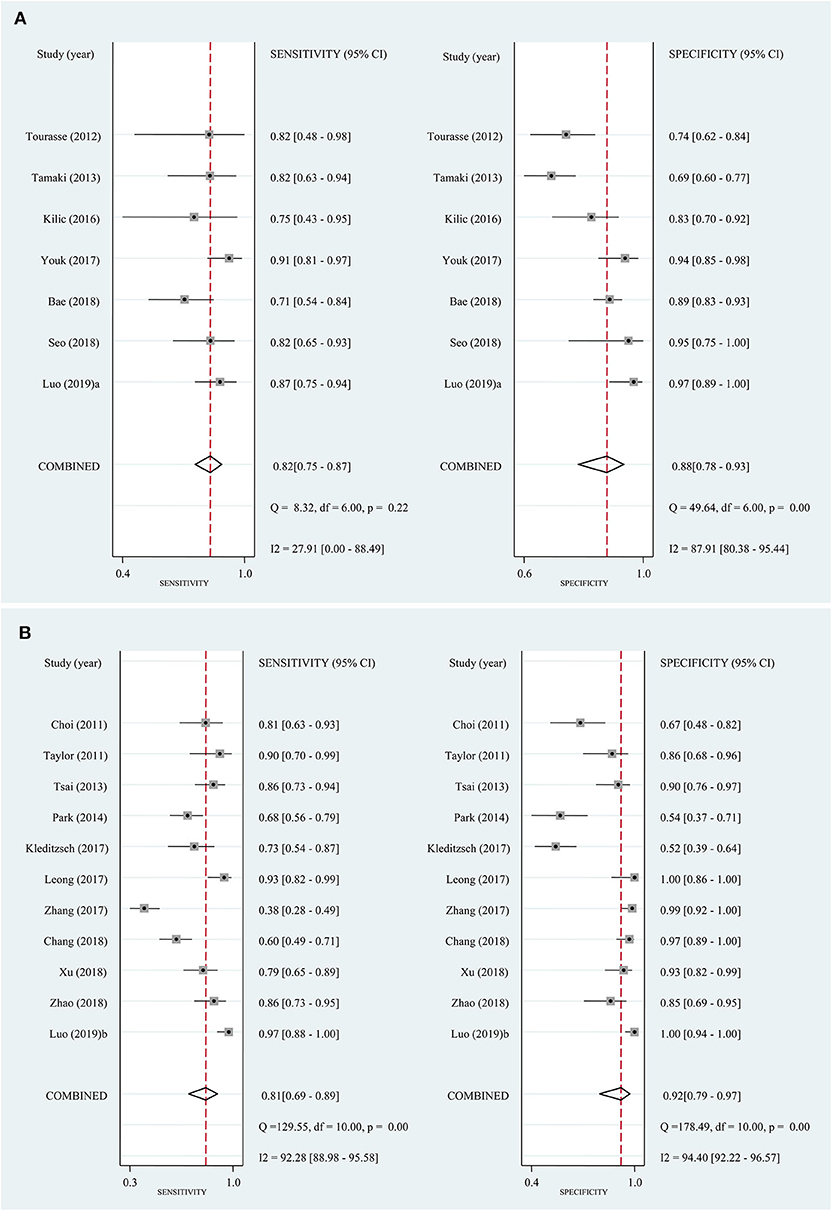
Figure 2. Forest plots of sensitivity and specificity for the included studies. Bivariate mixed-effects regression model was used to calculate the pooled sensitivity and specificity. (A) Quantitative elastography studies; (B) qualitative elastography studies. CI, confidence interval.
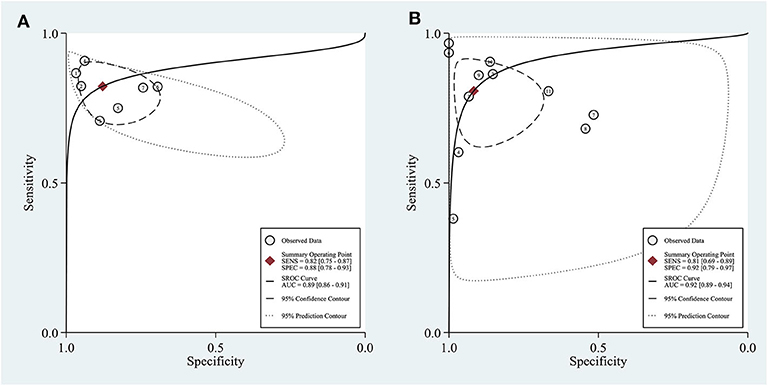
Figure 3. Sensitivity and specificity plotted in summary receiver operating characteristic (SROC) curves of the included studies. Area under the curve (AUC) was calculated to quantitatively assess the pooled result. (A) Quantitative elastography studies; (B) qualitative elastography studies. SENS, sensitivity; SPEC, specificity.
For the quantitative and qualitative elastography meta-analysis, P-values for testing the asymmetry of the Deeks' funnel plots were 0.42 and 0.63, respectively, which meant that there was no significant publication bias among the included studies (Figure 4).
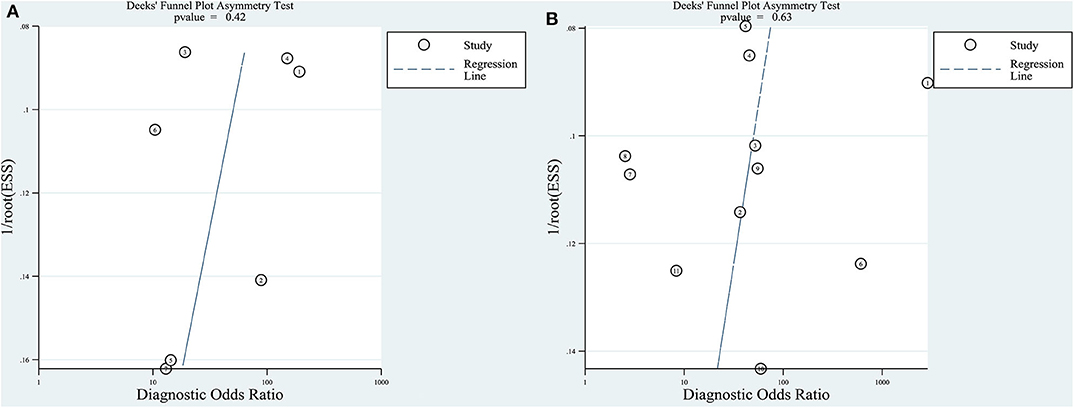
Figure 4. Deeks' funnel plot asymmetry test for testing publication bias. Publication bias was assessed by testing the asymmetry of Deeks' funnel plot [the inverse of the square root of the effective sample size (1/rootESS) vs. the natural logarithm of the DOR (lnDOR)]. P < 0.05 for the slope coefficient indicates significant asymmetry, i.e., significant publication bias. (A) Quantitative elastography studies; (B) qualitative elastography studies.
For the quantitative and qualitative elastography meta-analysis, the values of I2 and the corresponding 95% CIs were 66% (24%, 100%) and 97% (95%, 99%), respectively, which indicated substantial heterogeneity among the included studies. The results of subgroup analysis and meta-regression analysis for country, study design, measurement index, reference standard, ex/in vivo research, ROI size, and publication form (conference abstract or full text) are shown in Table 3. According to meta-regression analysis, study design (P < 0.01), measurement (P < 0.01), and reference standard (P < 0.01) were potential sources of heterogeneity for quantitative studies, which were measurement (P < 0.01) and reference standard (P < 0.01) for qualitative studies.
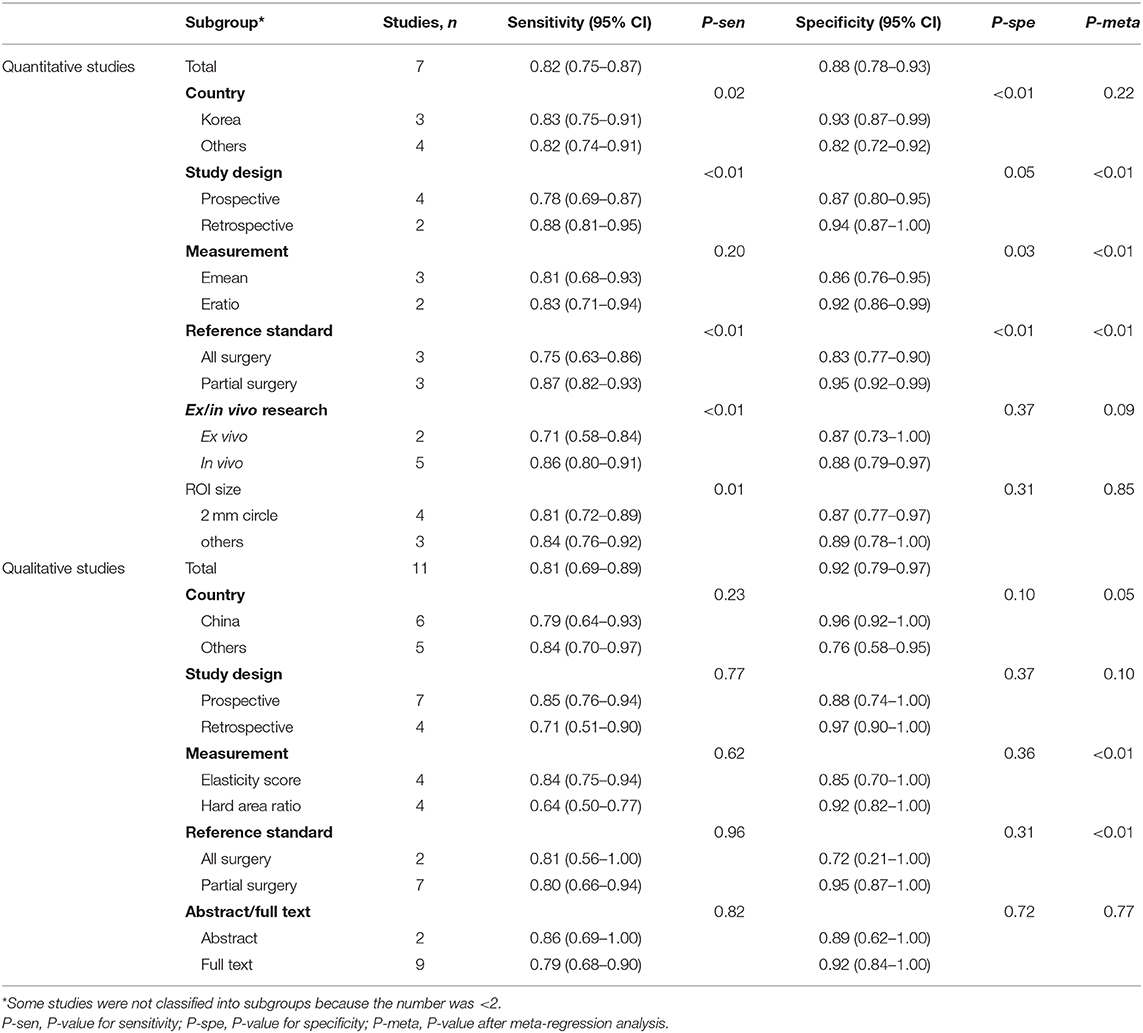
Table 3. Subgroup analysis and meta-regression analysis.
Both quantitative and qualitative elastography were demonstrated to have good clinical utility in the diagnosis of ALNM in breast cancer (Figure 5). At a Ppre of 50%, the positive and negative Ppost values were 87 and 17% for quantitative elastography (Figure 5A) and 91 and 17% for qualitative elastography, respectively (Figure 5B).
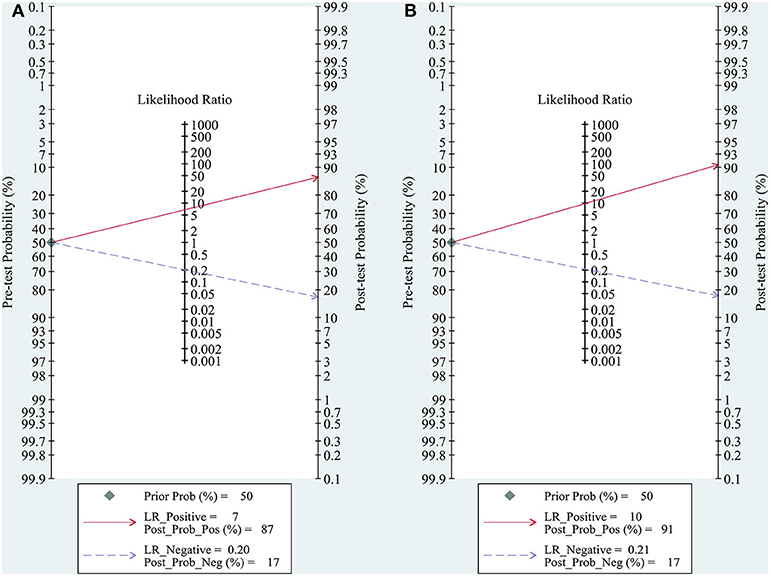
Figure 5. Fagan plots for assessing the clinical utility of quantitative (A) and qualitative (B) elastography to diagnose axillary lymph node metastasis (ALNM) in breast cancer. Fagan plot provided the post-test probability (Ppost) of ALNM when pre-test probabilities (Ppre, suspicion of ALNM) were provided. Ppost was calculated from the likelihood ratio (LR) using Bayes's theorem, with Ppost = (LR × Ppre)/[(1 – Ppre) × (1 – LR)]. In this meta-analysis, a Ppre of 50% was provided to determine the corresponding Ppost of ALNM.
We performed this meta-analysis to investigate the diagnostic performance of quantitative and qualitative elastography for ALNM in breast cancer. Elastography was found to have good diagnostic performance in diagnosing ALNM, with a pooled sensitivity and specificity of 0.82 and 0.88 for quantitative elastography and of 0.81 and 0.92 for qualitative elastography, respectively. Both quantitative and qualitative elastography were demonstrated to have good clinical utility in the diagnosis of ALNM in breast cancer.
The present meta-analysis encompassed both quantitative and qualitative elastography, which assess tissue stiffness based on different imaging principles (6, 7). Quantitative and qualitative elastography have comparable performance in diagnosing ALNM because the pooled sensitivity, specificity, and AUC of the two techniques were similar. In addition, the Fagan plots demonstrated the good clinical utility of quantitative and qualitative elastography in diagnosing ALNM in breast cancer (Figure 5). Thus, the differences between the imaging principles of the quantitative and qualitative elastography seemed to have not led to significant differences in diagnostic performance. However, no studies have directly compared the diagnostic performance of the two methods for ALNM except for one current study, which claimed that qualitative SWE classification showed better diagnostic performance than quantitative SWE parameters (8). However, the proposed qualitative SWE classification method was a new qualitative pattern classification first proposed by the authors, which differed from common qualitative elastography (strain imaging). On the other hand, compared with quantitative elastography, the qualitative one is simpler with relatively unified principle and measurement index based on strain pattern (7). In addition, regarding performance as the sensitivity and specificity as shown, in the forest plot (Figure 2), variations at each study of quantitative elastography is significantly larger than the qualitative one. Therefore, future studies are required to compare the differences in the diagnostic performance between quantitative and qualitative elastography for ALNM in breast cancer.
Quantitative elastography assesses tissue stiffness using shear wave velocity or Young's modulus. Among the seven included quantitative elastography studies, six investigated the diagnostic performance of SWE in ALNM. Various quantitative elasticity measurements can be obtained with SWE, including maximum elasticity (Emax), mean elasticity (Emean), minimum elasticity (Emin), the standard deviation of the ROI, and the ratio of elasticity (Eratio) of the lesion to the surrounding normal tissue. To maximize the diagnostic performance, if a study reported more than one quantitative elasticity measurement, only the measurement with the highest diagnostic performance was extracted to pool the estimates. Finally, heterogeneity was found among the studies, with an I2 of 66% (95% CI, 24, 100%). Subgroup analysis indicated a significant difference between the pooled specificity of Emean and Eratio. Meta-regression analysis suggests that the elasticity measurements were one possible source of heterogeneity. In addition, other factors, including the study design and reference standard, also served as potential sources of heterogeneity among the included quantitative elastography studies (Table 3). These results suggest that the heterogeneity among the quantitative elastography studies may be the result of many factors. Therefore, prospective multicenter studies controlling confounding variables as much as possible are necessary to explore the diagnostic performance of quantitative elastography in ALNM.
Qualitative elastography assesses tissue stiffness using the hard area ratio of the lymph nodes. The common two practices are to directly evaluate the hard area ratio or to convert the hard area ratio to an elasticity score to assess the stiffness of lymph nodes. In the qualitative elastography meta-analysis, four studies directly evaluated the hard area ratio (10, 12, 25, 26), while four others converted the hard area ratio as the elasticity score (23, 24, 27, 28). We found that the optimal cutoff values of the hard area ratio were all 50%, and the optimal cutoff values of elasticity score were all 3. A score of 3 corresponded to a hard area ratio ≥50% in three studies (23, 24, 27) and to a hard area ratio ≥45% in one study (28). Therefore, the optimal cutoff values of the hard area ratio and elasticity score were similar, which did not result in significant heterogeneity. Subgroup analysis also indicated no significant difference in the sensitivity and specificity between studies using the hard area ratio or the elasticity score as qualitative measurements (Table 3). However, meta-regression analysis indicated that measurement was a potential (P < 0.01) source of heterogeneity (Table 3). We thought that the subgroup analysis result of measurement may have been affected by other confounding variables. In fact, the heterogeneity among the studies may have been caused by many factors, such as the search strategy, inclusion, and exclusion criteria, parameter measurement, statistical analysis, and characteristics of each study (29). There may be many explanations for the sources of heterogeneity. We hypothesized that interobserver differences in the naked-eye assessment of the hard area ratio, which may be affected by the experience of the operators, the examination process, the machine parameters, etc., may be one possible reason. Further studies to explore the impact of individual differences in the diagnostic performance of qualitative elastography may be helpful to explain the observed heterogeneity.
Our study had several limitations. First, studies published in languages other than English were not included in this meta-analysis. However, this did not seem to produce significant publication bias in either the quantitative or the qualitative elastography studies (Figure 4). Second, substantial heterogeneity was found among both the quantitative and qualitative elastography studies, as we clarified in the above discussion, which would limit recommending their integration into clinical practice. The above two issues must be interpreted carefully, paying attention to the small number of quantitative studies. Theoretically, the funnel plot was invalid because the accuracy is low when fewer than 10 studies are available for the quantitative summary (30). Thus, the number of quantitative studies (seven) is too small to carry out statistical evaluation such as publication bias and analysis for the heterogeneity. Besides, according to the results of quality assessment (Table 2 and Supplementary Figure 1), two studies with high risk of bias are low in quality (17, 22), which possibly reduced the accuracy of bias assessment. Third, the ultrasound machines of the included studies were not exactly the same. Technological improvements or system errors may lead to measurement bias. In addition, the assessment and diagnostic performance of ultrasound elastography rely on the experience and skills of the operators as well as the operating procedures. All elastography imaging techniques have a learning curve for implementation to daily practice. Therefore, particularly for beginner operators, the diagnostic performance of these imaging tools may not be satisfactory as concluded in this meta-analysis. All these limitations of ultrasound elastography serve as potential sources of heterogeneity.
In conclusion, the present meta-analysis suggests high diagnostic performance of ultrasound elastography for ALNM in breast cancer. Both quantitative and qualitative elastography were carried out with high and comparable sensitivity and specificity. However, because of the substantial heterogeneity among these studies, evidence of data reliability is still insufficient. The results must be interpreted carefully, paying particular attention to heterogeneity issues, especially for quantitative elastography studies. Adequate method for higher accuracy of ALNM is needed in the future. Prospective multicenter population-based trials are necessary to confirm the diagnostic value of ultrasound elastography for ALNM in breast cancer.
All datasets generated for this study are included in the article/Supplementary Material.
JL and WW conceived and designed the study strategy. XH and QH worked for study search. HH and MC worked for study selection. WT and MX extracted data from each included study and assessed the study quality. XH prepared the tables and all figures. WW worked as the supervisor and made arbitration for all possible disagreements. All authors have read and approved the content.
This work was supported by the Natural Science Foundation of China (Grant nos. 81701719 and 81701701), the Natural Science Foundation of Guangdong Province, China (Grant no. 2019A1515011051), and the Clinical Medical Research 2010 Program Cultivation Project of Sun Yat-sen University (Grant no. 2108020).
The authors declare that the research was conducted in the absence of any commercial or financial relationships that could be construed as a potential conflict of interest.
The Supplementary Material for this article can be found online at: https://www.frontiersin.org/articles/10.3389/fonc.2020.552177/full#supplementary-material
1. Fisher B, Bauer M, Wickerham DL, Redmond CK, Fisher ER, Cruz AB, et al. Relation of number of positive axillary nodes to the prognosis of patients with primary breast cancer. An NSABP update. Cancer. (1983) 52:1551–7. doi: 10.1002/1097-0142(19831101)52:9<1551::AID-CNCR2820520902>3.0.CO;2-3
2. Ivens D, Hoe AL, Podd TJ, Hamilton CR, Taylor I, Royle GT. Assessment of morbidity from complete axillary dissection. Br J Cancer. (1992) 66:136–8. doi: 10.1038/bjc.1992.230
3. Koelliker SL, Chung MA, Mainiero MB, Steinhoff MM, Cady B. Axillary lymph nodes: US-guided fine-needle aspiration for initial staging of breast cancer–correlation with primary tumor size. Radiology. (2008) 246:81–9. doi: 10.1148/radiol.2463061463
4. Veronesi U, Paganelli G, Galimberti V, Viale G, Zurrida S, Bedoni M, et al. Sentinel-node biopsy to avoid axillary dissection in breast cancer with clinically negative lymph-nodes. Lancet. (1997) 349:1864–7. doi: 10.1016/S0140-6736(97)01004-0
5. Bedrosian I, Bedi D, Kuerer HM, Fornage BD, Harker L, Ross MI, et al. Impact of clinicopathological factors on sensitivity of axillary ultrasonography in the detection of axillary nodal metastases in patients with breast cancer. Ann Surg Oncol. (2003) 10:1025–30. doi: 10.1245/ASO.2003.12.017
6. Dietrich CF, Bamber J, Berzigotti A, Bota S, Cantisani V, Castera L, et al. EFSUMB guidelines and recommendations on the clinical use of liver ultrasound elastography, update 2017 (long version). Ultraschall Med. (2017) 38:e16–47. doi: 10.1055/s-0043-103952
7. Shiina T, Nightingale KR, Palmeri ML, Hall TJ, Bamber JC, Barr RG, et al. WFUMB guidelines and recommendations for clinical use of ultrasound elastography: part 1: basic principles and terminology. Ultrasound Med Biol. (2015) 41:1126–47. doi: 10.1016/j.ultrasmedbio.2015.03.009
8. Luo S, Yao G, Hong Z, Zhang S, Wang W, Zhang J, et al. qualitative classification of shear wave elastography for differential diagnosis between benign and metastatic axillary lymph nodes in breast cancer. Front Oncol. (2019) 9:533. doi: 10.3389/fonc.2019.00533
9. Leong L, Upadhyaya V. Can ultrasound replace sentinel lymph node biopsy in breast cancer staging of the axilla? results from a single center retrospective review of axillary evaluation with conventional sonography and ultrasound elastography. Cancer Res. (2017) 77:Abstract P4-02-11. doi: 10.1158/1538-7445.SABCS16-P4-02-11
10. Tsai WC, Lin CKJ, Wei HK, Yu BL, Hung CF, Cheng SH, et al. sonographic elastography improves the sensitivity and specificity of axilla sampling in breast cancer: a prospective study. Ultrasound Med Biol. (2013) 39:941–9. doi: 10.1016/j.ultrasmedbio.2012.12.013
11. Kleditzsch P, Reimer T, Hartmann S, Stubert J, Gerber B, Stachs A. Real-time ultrasound elastography of axillary lymph nodes in clinically node negative breast cancer. Int J Gynecol Cancer. (2017) 27:366. doi: 10.26226/morressier599bdc7bd462b80296ca098b
12. Park YM, Fornage BD, Benveniste AP, Fox PS, Bassett RL, Yang WT. Strain elastography of abnormal axillary nodes in breast cancer patients does not improve diagnostic accuracy compared with conventional ultrasound alone. AJR Am J Roentgenol. (2014) 203:1371–8. doi: 10.2214/AJR.13.12349
13. Whiting PF, Rutjes AW, Westwood ME, Mallett S, Deeks JJ, Reitsma JB, et al. QUADAS-2: a revised tool for the quality assessment of diagnostic accuracy studies. Ann Intern Med. (2011) 155:529–36. doi: 10.7326/0003-4819-155-8-201110180-00009
14. Glas AS, Lijmer JG, Prins MH, Bonsel GJ, Bossuyt PM. The diagnostic odds ratio: a single indicator of test performance. J Clin Epidemiol. (2003) 56:1129–35. doi: 10.1016/S0895-4356(03)00177-X
15. Deeks JJ, Macaskill P, Irwig L. The performance of tests of publication bias and other sample size effects in systematic reviews of diagnostic test accuracy was assessed. J Clin Epidemiol. (2005) 58:882–93. doi: 10.1016/j.jclinepi.2005.01.016
16. Hellmich M, Lehmacher W. A ruler for interpreting diagnostic test results. Methods Inf Med. (2005) 44:124–6. doi: 10.1055/s-0038-1633930
17. Seo M, Sohn Y-M. Differentiation of benign and metastatic axillary lymph nodes in breast cancer: additive value of shear wave elastography to B-mode ultrasound. Clin Imaging. (2018) 50:258–63. doi: 10.1016/j.clinimag.2018.04.013
18. Bae SJ, Park JT, Park AY, Youk JH, Lim JW, Lee HW, et al. Ex vivo shear-wave elastography of axillary lymph nodes to predict nodal metastasis in patients with primary breast cancer. J Breast Cancer. (2018) 21:190–6. doi: 10.4048/jbc.2018.21.2.190
19. Youk JH, Son EJ, Kim J-A, Gweon HM. Pre-operative evaluation of axillary lymph node status in patients with suspected breast cancer using shear wave elastography. Ultrasound Med Biol. (2017) 43:1581–6. doi: 10.1016/j.ultrasmedbio.2017.03.016
20. Kilic F, Velidedeoglu M, Ozturk T, Kandemirli SG, Dikici AS, Er ME, et al. Ex vivo assessment of sentinel lymph nodes in breast cancer using shear wave elastography. J Ultrasound Med. (2016) 35:271–7. doi: 10.7863/ultra.15.03039
21. Tamaki K, Tamaki N, Kamada Y, Uehara K, Miyashita M, Sm Chan M, et al. Non-invasive evaluation of axillary lymph node status in breast cancer patients using shear wave elastography. Tohoku J Exp Med. (2013) 231:211–6. doi: 10.1620/tjem.231.211
22. Tourasse C, Denier JF, Awada A, Gratadour AC, Nessah-Bousquet K, Gay J. Elastography in the assessment of sentinel lymph nodes prior to dissection. Eur J Radiol. (2012) 81:3154–9. doi: 10.1016/j.ejrad.2012.04.031
23. Zhao QL, Xia XN, Zhang Y, He JJ, Sheng W, Ruan LT, et al. Elastosonography and two-dimensional ultrasonography in diagnosis of axillary lymph node metastasis in breast cancer. Clin Radiol. (2018) 73:312–8. doi: 10.1016/j.crad.2017.09.013
24. Xu Y, Bai X, Chen Y, Jiang L, Hu B, Hu B, et al. Application of real-time elastography ultrasound in the diagnosis of axillary lymph node metastasis in breast cancer patients. Sci Rep. (2018) 8:10234. doi: 10.1038/s41598-018-28474-y
25. Chang W, Jia W, Shi J, Yuan C, Zhang Y, Chen M. Role of elastography in axillary examination of patients with breast cancer. J Ultrasound Med. (2018) 37:699–707. doi: 10.1002/jum.14538
26. Zhang Q, Suo J, Chang W, Shi J, Chen M. Dual-modal computer-assisted evaluation of axillary lymph node metastasis in breast cancer patients on both real-time elastography and B-mode ultrasound. Eur J Radiol. (2017) 95:66–74. doi: 10.1016/j.ejrad.2017.07.027
27. Taylor K, O'Keeffe S, Britton PD, Wallis MG, Treece GM, Housden J, et al. Ultrasound elastography as an adjuvant to conventional ultrasound in the preoperative assessment of axillary lymph nodes in suspected breast cancer: a pilot study. Clin Radiol. (2011) 66:1064–71. doi: 10.1016/j.crad.2011.05.015
28. Choi JJ, Kang BJ, Kim SH, Lee JH, Jeong SH, Yim HW, et al. Role of sonographic elastography in the differential diagnosis of axillary lymph nodes in breast cancer. J Ultrasound Med. (2011) 30:429–36. doi: 10.7863/jum.2011.30.4.429
29. Genkinger JM, Terry MB. Commentary: towards a definite coherent heterogeneity in meta-analyses. Int J Epidemiol. (2014) 43:1236–9. doi: 10.1093/ije/dyu136
Keywords: elastography, breast cancer, axillary lymph node metastasis, diagnose, meta-analysis
Citation: Huang X-w, Huang Q-x, Huang H, Cheng M-q, Tong W-j, Xian M-f, Liang J-y and Wang W (2020) Diagnostic Performance of Quantitative and Qualitative Elastography for Axillary Lymph Node Metastasis in Breast Cancer: A Systematic Review and Meta-Analysis. Front. Oncol. 10:552177. doi: 10.3389/fonc.2020.552177
Received: 15 April 2020; Accepted: 09 September 2020;
Published: 15 October 2020.
Edited by:
Masakazu Toi, Kyoto University, JapanCopyright © 2020 Huang, Huang, Huang, Cheng, Tong, Xian, Liang and Wang. This is an open-access article distributed under the terms of the Creative Commons Attribution License (CC BY). The use, distribution or reproduction in other forums is permitted, provided the original author(s) and the copyright owner(s) are credited and that the original publication in this journal is cited, in accordance with accepted academic practice. No use, distribution or reproduction is permitted which does not comply with these terms.
*Correspondence: Wei Wang, d2FuZ3c3M0BtYWlsLnN5c3UuZWR1LmNu; Jin-yu Liang, bGp5dUBtYWlsLnN5c3UuZWR1LmNu
†These authors have contributed equally to this work
Disclaimer: All claims expressed in this article are solely those of the authors and do not necessarily represent those of their affiliated organizations, or those of the publisher, the editors and the reviewers. Any product that may be evaluated in this article or claim that may be made by its manufacturer is not guaranteed or endorsed by the publisher.
Research integrity at Frontiers
Learn more about the work of our research integrity team to safeguard the quality of each article we publish.