
94% of researchers rate our articles as excellent or good
Learn more about the work of our research integrity team to safeguard the quality of each article we publish.
Find out more
ORIGINAL RESEARCH article
Front. Oncol. , 21 October 2020
Sec. Head and Neck Cancer
Volume 10 - 2020 | https://doi.org/10.3389/fonc.2020.550171
 Cheng-Wan Xia1†
 Rong-lin Gan2†Jiong-ru Pan1Shi-qi Hu1Qun-zhi Zhou1Shen Chen3Lei Zhang3Qin-Gang Hu1*
 Yu-Xin Wang1*
Background: A positive surgical margin (PSM) following oral cancer resection results in local recurrence and poor prognosis. Mono-block tumor specimens, especially from the tumor base, are difficult to evaluate. This inaccurate sampling ultimately leads to a false pathological diagnosis. Lugol’s iodine (I2-IK)-enhanced micro-CT is an emerging method to image tumor specimens. This study explores the feasibility of I2-IK-enhanced micro-CT to evaluate the surgical margin for tongue squamous cell carcinoma (TSCC) specimens and to further seek optimal staining parameters.
Methods: Rabbit tongue tissues and human TSCC samples were imaged via I2-IK-enhanced micro-CT. The optimal I2-IK concentration and staining time were determined before clinical application using tissue shrinkage, micro-CT image quality, and effect on pathological diagnosis as assessment criteria. Next, 6 TSCC specimens were used to verify the process feasibility of surgical margin imaging with the optimal parameters. Finally, the possible reason by which I2-IK could enhance micro-CT imaging was validated in vitro.
Results: I2-IK staining influenced specimen shrinkage, micro-CT image quality, and pathological image quality in a concentration- and time-dependent manner. After comprehensively considering these indicators, 3% I2-IK staining for 48 and 12 h were found to be optimal for rabbit tongue tissues and TSCC samples, respectively. This method could provide a detailed 3-D structure of TSCC samples compared with H&E sections. Moreover, tumor and normal tissues could be differentiated by their glycogen content, which has high affinity with I2-IK.
Conclusions: I2-IK-enhanced micro-CT could, thus, indicate the tumor margin and assist pathological sampling in patients with TSCC postoperation.
Oral squamous cell carcinoma (OSCC) is one of the most common cancers worldwide, especially in developing countries (1). Surgical tumor resection remains as the first treatment for patients with OSCC, but the 5-year survival rates continue to be approximately 60% despite the combination of surgical treatment and adjuvant therapies in recent decades (2). Local recurrence is the main reason for treatment failure (3). Among OSCC cases, tongue squamous cell carcinomas (TSCC) has the highest local recurrence rate (29.6%) due to its high-grade malignancy and strong infiltration into the lingual muscle (4).
The principle of en-bloc resection has been standard in surgical oncology. Surgical margins on mono-block specimens after tumor resection need to be evaluated for solid organ cancers. In fact, the positive surgical margin (PSM) rate for oral cavity cancer has been reported to be 12.75%—the highest overall PSM rate among all-site tumors (5). Furthermore, the survival rate of patients with PSM is significantly lower than that of patients with a negative surgical margin (6). Therefore, accurate evaluation of surgical margin is important to improve the prognosis of patients with TSCC. At present, clinically and/or pathologically satisfactory margins are determined intraoperatively and postoperatively by surgeons or pathologists. However, the samples obtained from the glossectomy specimen or the tumor bed for surgical margin evaluation are subjective and/or arbitrary; therefore, the local recurrence rate remains 10%–30% even when the surgical margin is confirmed as satisfactory by pathology (7, 8). In other words, uncertain surgical margins are closely associated with difficulty in the examination of mono-block specimens.
Serial whole-mount sectioning is an effective way to examine mono-block specimens; it is also helpful to decide reasonable treatment options based on the NCCN guidelines. However, this is impractical for patients with TSCC and for clinicians because of its high cost and time consumption (9). Near-infrared fluorescent imaging using indocyanine green (ICG) can detect the surgical margin during surgery and has been applied in breast, colon, lung, and several cancer types to position the PSM successfully (10–14). However, for patients with OSCC, secondary inflammation caused by bacteria inhabiting the oral cavity may produce a false PSM due to enhanced permeability and retention effects (15). Moreover, the 1–3 mm penetration depth of ICG fluorescence is limited to the evaluated surgical margin on specimens (14).
With the development of medical imaging, spatial resolution of micro-CT has reached the micron level. Thanks to the significant density difference between the tumor and background tissues, micro-CT is feasible to locate the tumor and estimate the surgical margin on mono-block specimens of breast cancer (16). For TSCC specimens, micro-CT imaging has not been used to evaluate the surgical margin because the density of tumor tissues and the surrounding tissues is similar. Lugol’s iodine (I2-IK)-enhanced micro-CT is an emerging method to solve this dilemma as it can show the fine anatomic structure of various tissue samples in various animals (17). Furthermore, in surgical oncology, Apps et al. demonstrate that I2-IK-enhanced micro-CT imaging provides detailed 3-D structural information of adamantinomatous craniopharyngioma in volumes with isotropic voxel sizes of 4–6 microns, and these results match well with H&E and immunohistochemical (IHC) sections (18). Thus, owing to nondestructive rapid imaging (19, 20) and high resolution, I2-IK-enhanced micro-CT has become a promising method to detect surgical margins during operation.
In this study, I2-IK-enhanced micro-CT was used for the first time to examine TSCC samples. First, the parameters, including I2-IK concentration and staining time, were explored in rabbit tongue tissues and in human TSCC samples using tissue shrinkage, quality of micro-CT image, and subsequent effect on pathological examination as the evaluation indicators. Next, 6 human TSCC specimens were used to verify the feasibility of this process for surgical margin imaging based on the optimal parameters. Finally, cytological experiments were conducted to explain the possible reasons underlying I2-IK-enhanced micro-CT imaging.
Fifteen New Zealand white rabbits (male, 2.5 kg) were purchased from the Comparative Medical Center of Yang Zhou University. After the rabbits were euthanized, a total of 27 tissues from the front of the tongue were cut off; 15 of these were used for I2-IK-enhanced micro-CT imaging, and the remaining 12 tissue blocks were used to verify the consistency of volume measurement between the drainage method and the micro-CT 3-D reconstruction method.
For human TSCC sample acquisition, this study was first approved by the medical ethics committee of the Institute Affiliated Stomatology Hospital, the Nanjing University Medical School. Then, 21 samples were acquired from 3 patients with TSCC. The samples were acquired from the junction between the tumor and normal tissues. All 3 patients provided a signed informed consent form. Fifteen samples from the same patient were used to determine the optimal parameters for I2-IK-enhanced micro-CT imaging. The remaining 6 samples from 2 patients were used to further verify the feasibility of I2-IK enhanced micro-CT to evaluate the status of the surgical margin in TSCC.
I2-IK (W/V, the concentration of iodine was 15%) was purchased from Shandong lvying Chemical Technology Co. Ltd., China. Various concentrations including 1%, 3%, 5%, and 7% (w/v, iodine concentration) of I2-IK were prepared by diluting the I2-IK mother liquor with 4% formalin solution. All I2-IK solutions were preserved at room temperature away from light. After fixation with formalin for 12 h, both rabbit tongue tissues and human TSCC samples were stained with different concentrations of I2-IK for 72 and 48 h, respectively, in 10-ml brown bottles. During the staining period, these samples were scanned by micro-CT every 12 h.
A small animal micro-CT (Hiscan XM, Suzhou Heisfeld Information Technology Co. Ltd., China) was used for all CT imaging. The micro-CT scan parameters were as follows: power: 8 W, voltage: 60 V, electric current: 133.3 μA, detector mode: binging 2*2, slice thickness: 50 μm, and repetition time: 75 ms. All CT image data were processed using the SeProcessPro Version.1 software (Version 1.0, Suzhou Heisfeld Information Technology Co. Ltd., China). Contrast-to-noise ratio (CNR) (21), which refers to the relative difference of signal intensity between two kinds of tissues, was adopted to evaluate the quality of the CT image for rabbit tongue tissues and human TSCC samples as shown in Supplement Figure 1.
All rabbit tongue tissues and human TSCC samples were embedded in paraffin using the standard method after I2-IK-enhanced micro-CT imaging. Then, a series of 4-µm sections were prepared according to the CT image data. For H&E staining, all sections were stained using an automatic pathological section staining machine. For pan-CK IHC staining, paraffin sections were deparaffinized and dehydrated using a series of graded ethanol solutions. For antigen retrieval, the sections were heated in a microwave oven with a 10-mM citrate buffer solution (pH = 6) for 10 min. Endogenous peroxidase activity was quenched by incubating the sections in 0.3% H2O2 for 5 min. After blocking with 3% bovine serum albumin for 1 h at room temperature, the sections were incubated with anti-pan-CK (1:400, Cat. #ab80826, Abcam) primary antibodies overnight at 4°C and gently washed three times with PBS. Sample sections were then incubated with goat-antimouse secondary antibody (1:10,000, Cat. #ab205719, Abcam) for 2 h at room temperature. The signal was developed using the HRP substrate 3, 3’-diaminobenzidine (DAB). Nuclear counterstaining was performed using hematoxylin.
The quality of H&E sections was scored by two experienced pathologists in a blinded manner according to the Chinese standards for the quality control of pathological sections. The scoring criteria are shown in Supplement Table 1.
Before micro-CT imaging, the volume of tissue blocks was measured by drainage. During micro-CT imaging, their volume was measured by 3-D reconstruction with the SeProcessPro Version.1 software. To evaluate the consistency of volume measurement between the drainage and 3-D reconstruction methods, 12 rabbit tongue tissues were measured using both methods. The results showed consistency between the two methods (p = 0.829) (Supplement Figure 2).
For determining tissue shrinkage during the H&E staining process, we calculated the tissue area change using Image J (1.52a, National Institutes of Health, USA). Before H&E staining, the maximum area of the tissues was calculated. Then, the maximum tissue sections were cut and used for the subsequent staining process. After H&E staining, we calculated the area of the pathological section.
The human TSCC line SCC9 was purchased from Procell Life Science & Technology Co., Ltd. (Wuhan, China). Cells were cultured in DMEM/high-glucose medium and DMEM/low-glucose medium, respectively, supplemented with 10% (v/v) fetal bovine serum, 1% (v/v) penicillin, and 1% (v/v) streptomycin for 1 week. Then, 5×10⁵ SCC9high glucose and SCC9low glucose cells in 5 ml were seeded on 6-well plates and incubated overnight under a 5% CO2 atmosphere at 37°C. Next, the treated cells were washed twice with PBS and fixed in a formalin solution for 30 min. Then, the treated cells were incubated with various concentrations of I2-IK (0%, 2%, 4%, and 8%, w/v, the concentration of iodine) for 1 h. Finally, the treated cells were observed by optical microscopy. The staining intensity was calculated using Image J (1.52a, Wayne Rasband, National Institutes of Health, USA).
Six tumor tissues, muscle tissues, and mucosal tissues from patients with TSCC were acquired to determine the glycogen content using the liver/muscle glycogen assay kit (Nanjing Jiancheng Bioengineering Institute, China).
Statistical analysis was performed using the SPSS statistical software (version 23.0, IBM, Chicago, Illinois, USA). Values are presented as mean ± standard derivation (SD). Multivariate repeated-measures ANOVA was used to compare the CNR and volume shrinkage of tissue blocks with different concentrations of I2-IK. One-way ANOVA was used to compare the volume shrinkage and quality of pathological sections with different concentrations of I2-IK. Student’s t-test was used to compare the glycogen content between tumor tissues, muscle, and mucosa. P < 0.05 was considered statistically significant.
To investigate the volume change in rabbit tongue tissues during the entire staining procedure, 15 blocks of tongue tissues obtained from euthanized rabbits were divided into 5 groups according to I2-IK concentration (1%, 3%, 5%, 7%, and the formalin solution as the control). The mean volume of the fresh tissue blocks was 0.3867 cm3 ± 0.0284 cm3. Before I2-IK staining, all 15 blocks of tissues were fixed with formalin solution for 12 h, and the mean volume shrinkage was 22.3% ± 2.6% (Figure 1A). Then, during the 72 h of I2-IK staining, the tissue blocks in the 4 experimental groups were scanned every 12 h by micro-CT (Figure 1C) and the tissue volume change was determined. At sequential time points, the mean volume changes in the 1% group were 0.6% ± 1.7%, -1.5% ± 2.5%, -4.4% ± 2.2%, -15.2% ± 1.6%, -17.2% ± 2.2%, and -46.1% ± 0.9%, respectively; the mean volume changes in the 3% group were -8.8% ± 2.3%, -14.2% ± 2.2%, -17% ± 2.6%, -26.5% ± 2.6%, -27.4% ± 2.3%, and -56.1% ± 4.4%, respectively; the mean volume changes in the 5% group were -14.9% ± 1.9%, -19.4% ± 1.7%, -22.9% ± 1.3%, -42.2% ± 7.2%, -42.9% ± 6.2%, and -70.5% ± 1.3%, respectively; and the mean volume changes in the 7% group were -23.2% ± 3.2%, -32.2% ± 4.5%, -37.3% ± 3.0%, -58.1% ± 1.2%, -58.5% ± 0.7%, and -74.4% ± 0.2%, respectively (Figure 1A). Notably, the tissue blocks expanded in all groups in the first 12 h. In the following 60 h, the tissues began to shrink and showed a negative correlation between I2-IK concentrations and the shrinkage degree. Overall, low concentrations of I2-IK could reduce the shrinkage of tissue blocks and avoid the adverse effects of tissue shrinkage.
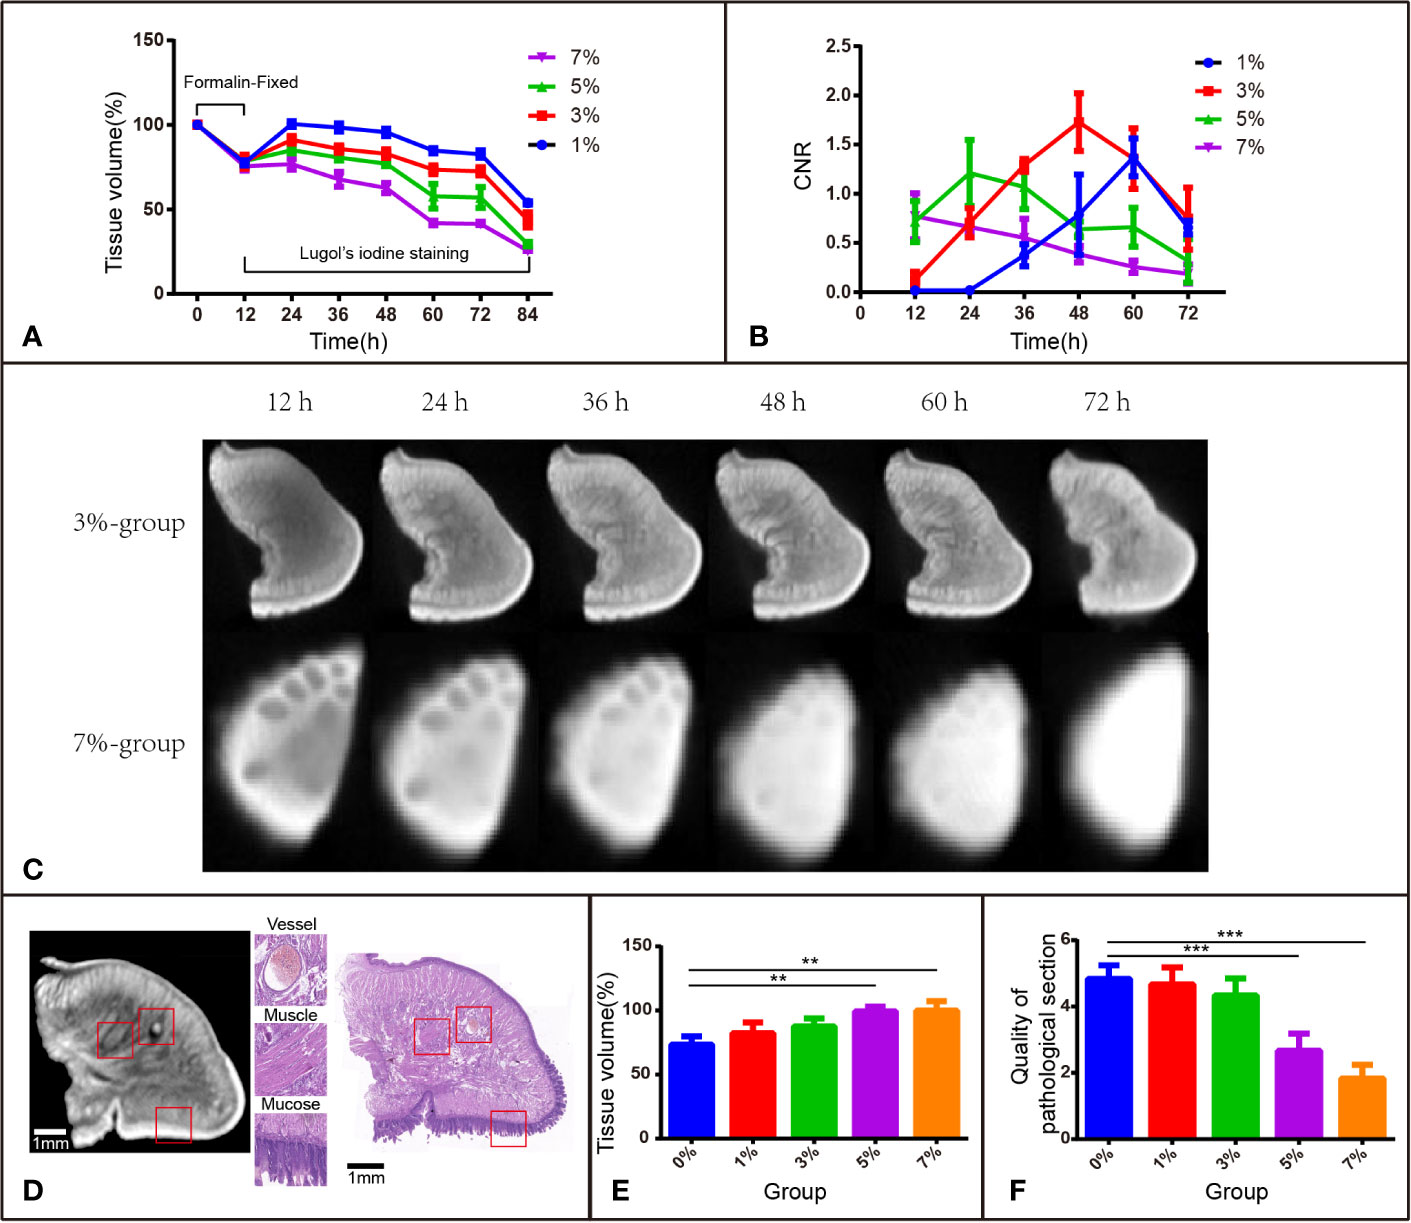
Figure 1 I2-IK-enhanced micro-CT image for rabbit tongue tissues. (A) Tissue shrinkage during formalin fixation and I2-IK staining (tissue volume normalized to 100%). (B) CNR value of micro-CT image at different times with different concentrations of I2-IK. (C) Micro-CT image data at different times with 3% and 7% I2-IK staining. (D) Micro-CT image and H&E image of the same sections (the structures in the red box indicate mucous, muscle fibers, and blood vessels). (E) Tissue shrinkage during H&E staining. (F) The quality of H&E images with different concentrations of I2-IK. (**P < 0.01, ***P < 0.001).
I2-IK concentration and staining time could affect micro-CT imaging quality; thus, it is very important to ensure that the two application parameters are optimal. CNR was used as the standard to evaluate image quality (Figures 1B, C). During the staining period, there was a better-to-worse tendency of micro-CT imaging quality based on the CNR. The highest CNR was presented at 60 h for the 1% group (1.371 ± 0.192), at 48 h for the 3% group (1.729 ± 0.292), at 24 h for the 5% group (1.213 ± 0.337), and at 12 h for the 7% group (0.772 ± 0.233). Obviously, a shorter staining time was used to obtain good imaging quality for a higher I2-IK concentration. However, it is also easy to overstain with a high concentration of I2-IK. In summary, the CNR results showed that the highest imaging quality was obtained with 3% I2-IK staining for 48 h.
All tissue blocks in the 4 experimental groups were subjected to the standard H&E staining protocol and were compared with the control group (formalin). The H&E imaging quality and the area alteration of tissue sections (4 μm) were analyzed to evaluate the influence of I2-IK staining in subsequent pathological staining (Figures 1E, F). After scoring by two pathologists in a blinded manner, the quality of H&E sections was found to worsen after 5% and 7% I2-IK staining for 72 h (P < 0.001), whereas 1% and 3% I2-IK staining for 72 h had little influence compared with that in the control group (P > 0.05) (Figure 1F). Moreover, comparing of the micro-CT and H&E staining images suggested that 3% I2-IK-enhanced micro-CT imaging could clearly distinguish the microscopic structure including the mucous, muscle fibers, and blood vessels (Figure 1D). The area alteration of tissue sections was evaluated by calculating the area of the maximum section of tissue blocks before and after H&E staining. Unlike tissue shrinkage during I2-IK staining, a higher I2-IK concentration caused less alteration of the tissue section area as shown in Figure 1E.
After comprehensive consideration of the above-mentioned evaluation indicators, we could take a preliminary view that 3% I2-IK for 48 h was the optimal staining parameter for micro-CT imaging of rabbit tongue tissues.
To observe the influence of I2-IK concentrations and staining time on the volume change of TSCC samples, 12 samples were acquired and fixed in formalin solution for 12 h. The mean volumes of fresh samples were 0.8966 ± 0.0628 cm3, and the tissue after formalin fixation shrinkage was 16.42% ± 2.93% (Figure 2A). Then, the samples were stained with various concentrations of I2-IK (1%, 3%, 5%, and 7%) for 48 h. During the staining period, the samples were scanned by micro-CT every 12 h, and the volumes were determined by 3-D reconstruction. In detail, the mean volume changes in the 1% group were -13.7% ± 2.0%, -16.9% ± 1.8%, -18.4% ± 1.8%, and -20.1% ± 1.8%, respectively; the mean volume changes in the 3% group were -13.5% ± 4.8%, -17.4% ± 4.8%, -19.4% ± 4.4%, and -20.8% ± 3.9%, respectively; the mean volume changes in the 5% group were -19.3% ± 2.0%, -24.5% ± 1.6%, -27.1% ± 1.9%, and -28.6% ± 1.7%, respectively; and the mean volume changes in the 7% group were -20.5% ± 3.5%, -26.3% ± 2.2%, -28.6% ± 2.4%, and -30.5% ± 2.4%, respectively (Figure 2A). Similar to the rabbit tongue tissues, the volume of TSCC samples was also increased in the first 12 h and decreased at the latter time points. Furthermore, with the increase in I2-IK concentrations, the volumes of the tumor tissue blocks decreased more rapidly, suggesting that selecting low concentrations of I2-IK may reduce its adverse effects.
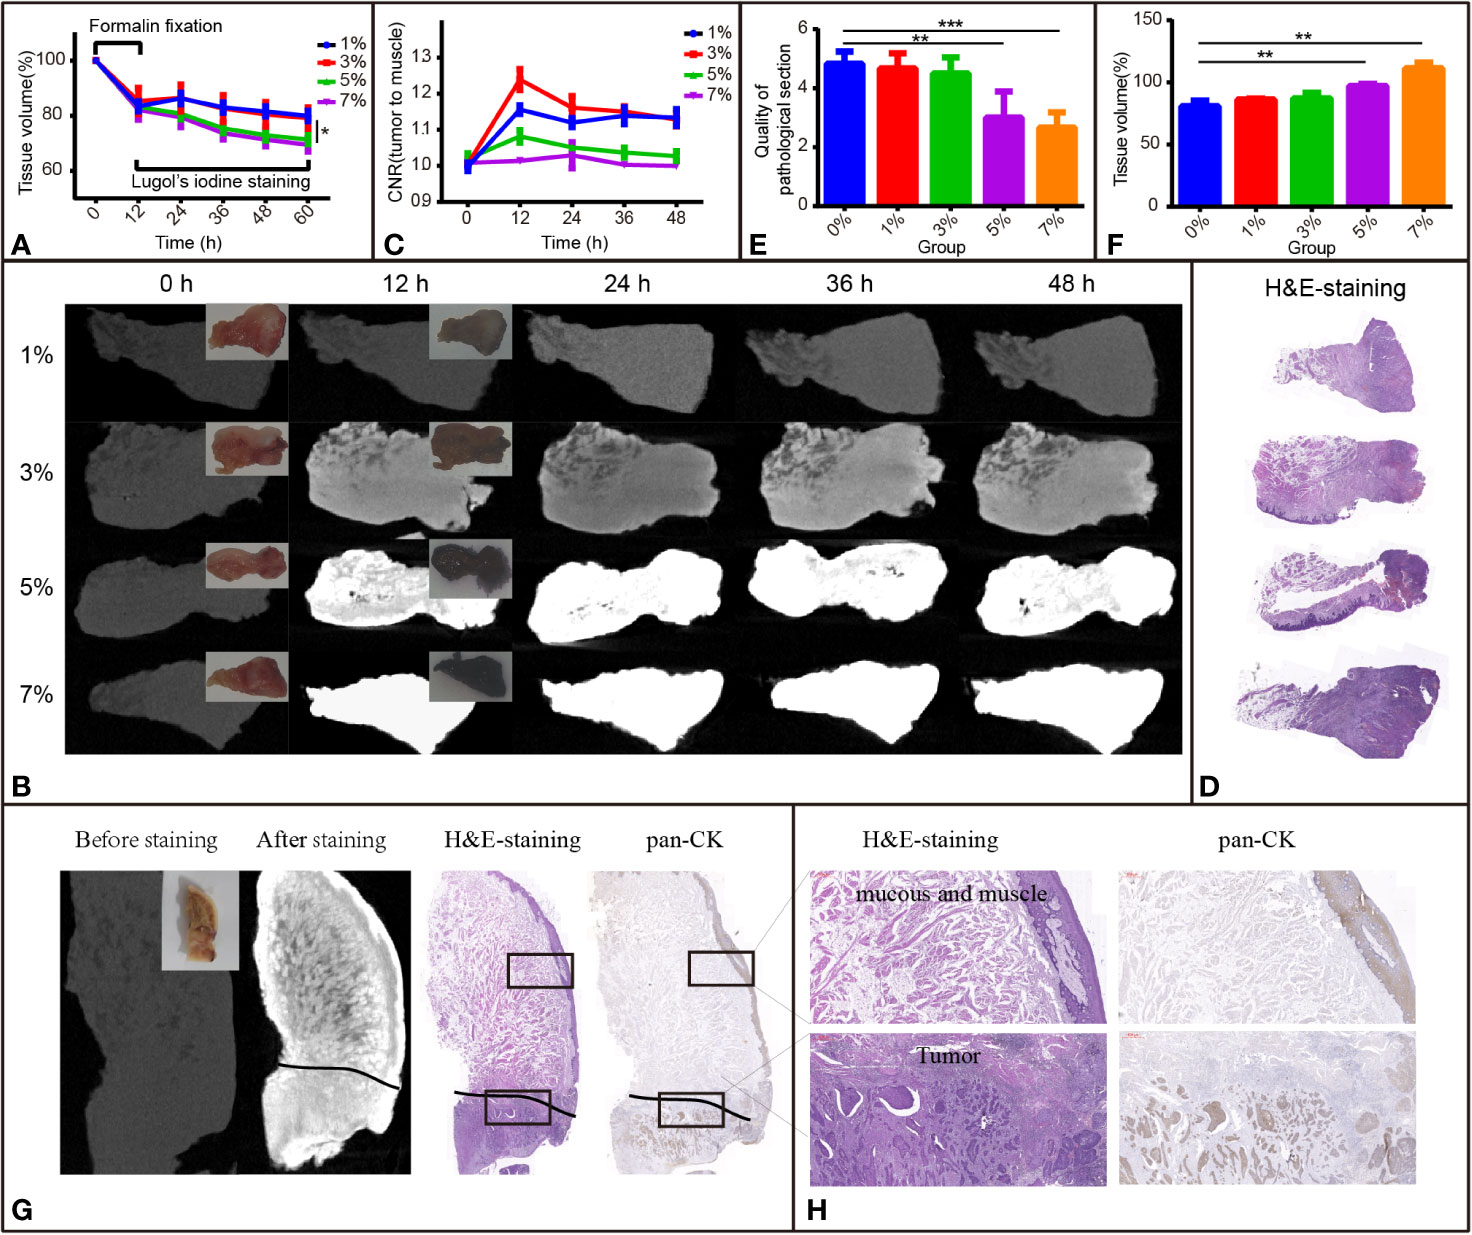
Figure 2 I2-IK-enhanced micro-CT images for TSCC samples. (A) Tissue shrinkage during formalin fixation and I2-IK staining time (tissue volume normalized to 100%). (B) Micro-CT image data at different times with different concentrations of I2-IK (insets indicate camera images of TSCC tumor tissue blocks). (C) CNR value of micro-CT images at different times with different concentrations of I2-IK. (D) H&E section of TSCC samples. (E, F) Tissue shrinkage and quality of pathological sections with different concentrations of I2-IK. (G) Micro-CT image before and after 3% I2-IK staining for 12 h and the H&E section, pan-CK section at the same level (black line indicates the tumor boundary). (H) Details of the H&E section and pan-CK section in the black boxes. (the above image shows mucous and muscle and the image below shows tumor tissues). **P < 0.01, ***P < 0.001.
To observe the effect of I2-IK concentration and staining time on the micro-CT imaging of TSCC samples, samples were scanned by micro-CT, and CNR values were calculated during I2-IK staining (Figure 2B). As shown in Figure 2C, the CNR value was first increased and then decreased at later times. Overall, the highest CNR was presented at 12 h for the 1% group (1.16 ± 0.01), at 12 h for the 3% group (1.24 ± 0.03), at 12 h for the 5% group (1.06 ± 0.02), and at 24 h for the 7% group (1.02 ± 0.04). Among these, 3% I2-IK staining for 12 h was the best condition to produce an optimal micro-CT image for TSCC samples.
After I2-IK staining and micro-CT imaging, TSCC samples were further sectioned and subjected to H&E staining (Figure 2D). The quality of pathological images and area alteration of tissue sections was evaluated. As shown in Figure 2E, 5% and 7% I2-IK could decrease the pathological image quality, whereas 1% and 3% I2-IK had little influence compared to the control group. Moreover, an increase in I2-IK concentration showed increasing tissue section shrinkage as shown in Figure 2F. Furthermore, by comparing the micro-CT images and pathological images, we found that micro-CT imaging could clearly distinguish the boundary between tumor tissues and muscle tissues with 3% I2-IK staining for 12 h.
Overall, staining with 3% I2-IK for 12 h may be the optimal staining parameter for micro-CT imaging of TSCC samples.
After confirming the best parameters for micro-CT imaging of TSCC samples, 6 other TSCC samples were acquired to further demonstrate the feasibility of I2-IK-enhanced micro-CT in order to evaluate the status of the surgical margin in TSCC. These tissue blocks were fixed with formalin for 12 h, followed by staining with 3% I2-IK for 12 h. The tumor tissue blocks were scanned by micro-CT imaging before and after I2-IK staining (Figure 2G). Next, all tissue blocks were subjected to H&E and pan-CK IHC staining (Figure 2G). Upon comparing the micro-CT image, I2-IK-enhanced micro-CT image, H&E staining, and pan-CK staining, micro-CT could clearly distinguish the tumor tissues from normal tissues after staining with 3% I2-IK for 12 h (Figures 2G, H). Further, it had little influence on the subsequent pathological examination, including H&E and IHC staining.
For further overall comparison between I2-IK-enhanced micro-CT imaging and subsequent pathological examination, the micro-CT 3-D regions of tumors were delineated by threshold segmentation using the SeProcessPro Version.1 software (Figure 3A), and semi-continuous paraffin sections were obtained at intervals of 50 µm and H&E staining was performed (Figure 3B). The results further verified that the I2-IK enhanced micro-CT image could clearly distinguish tumor tissues from normal tissues in a 3-D manner (Figures 3C–F).
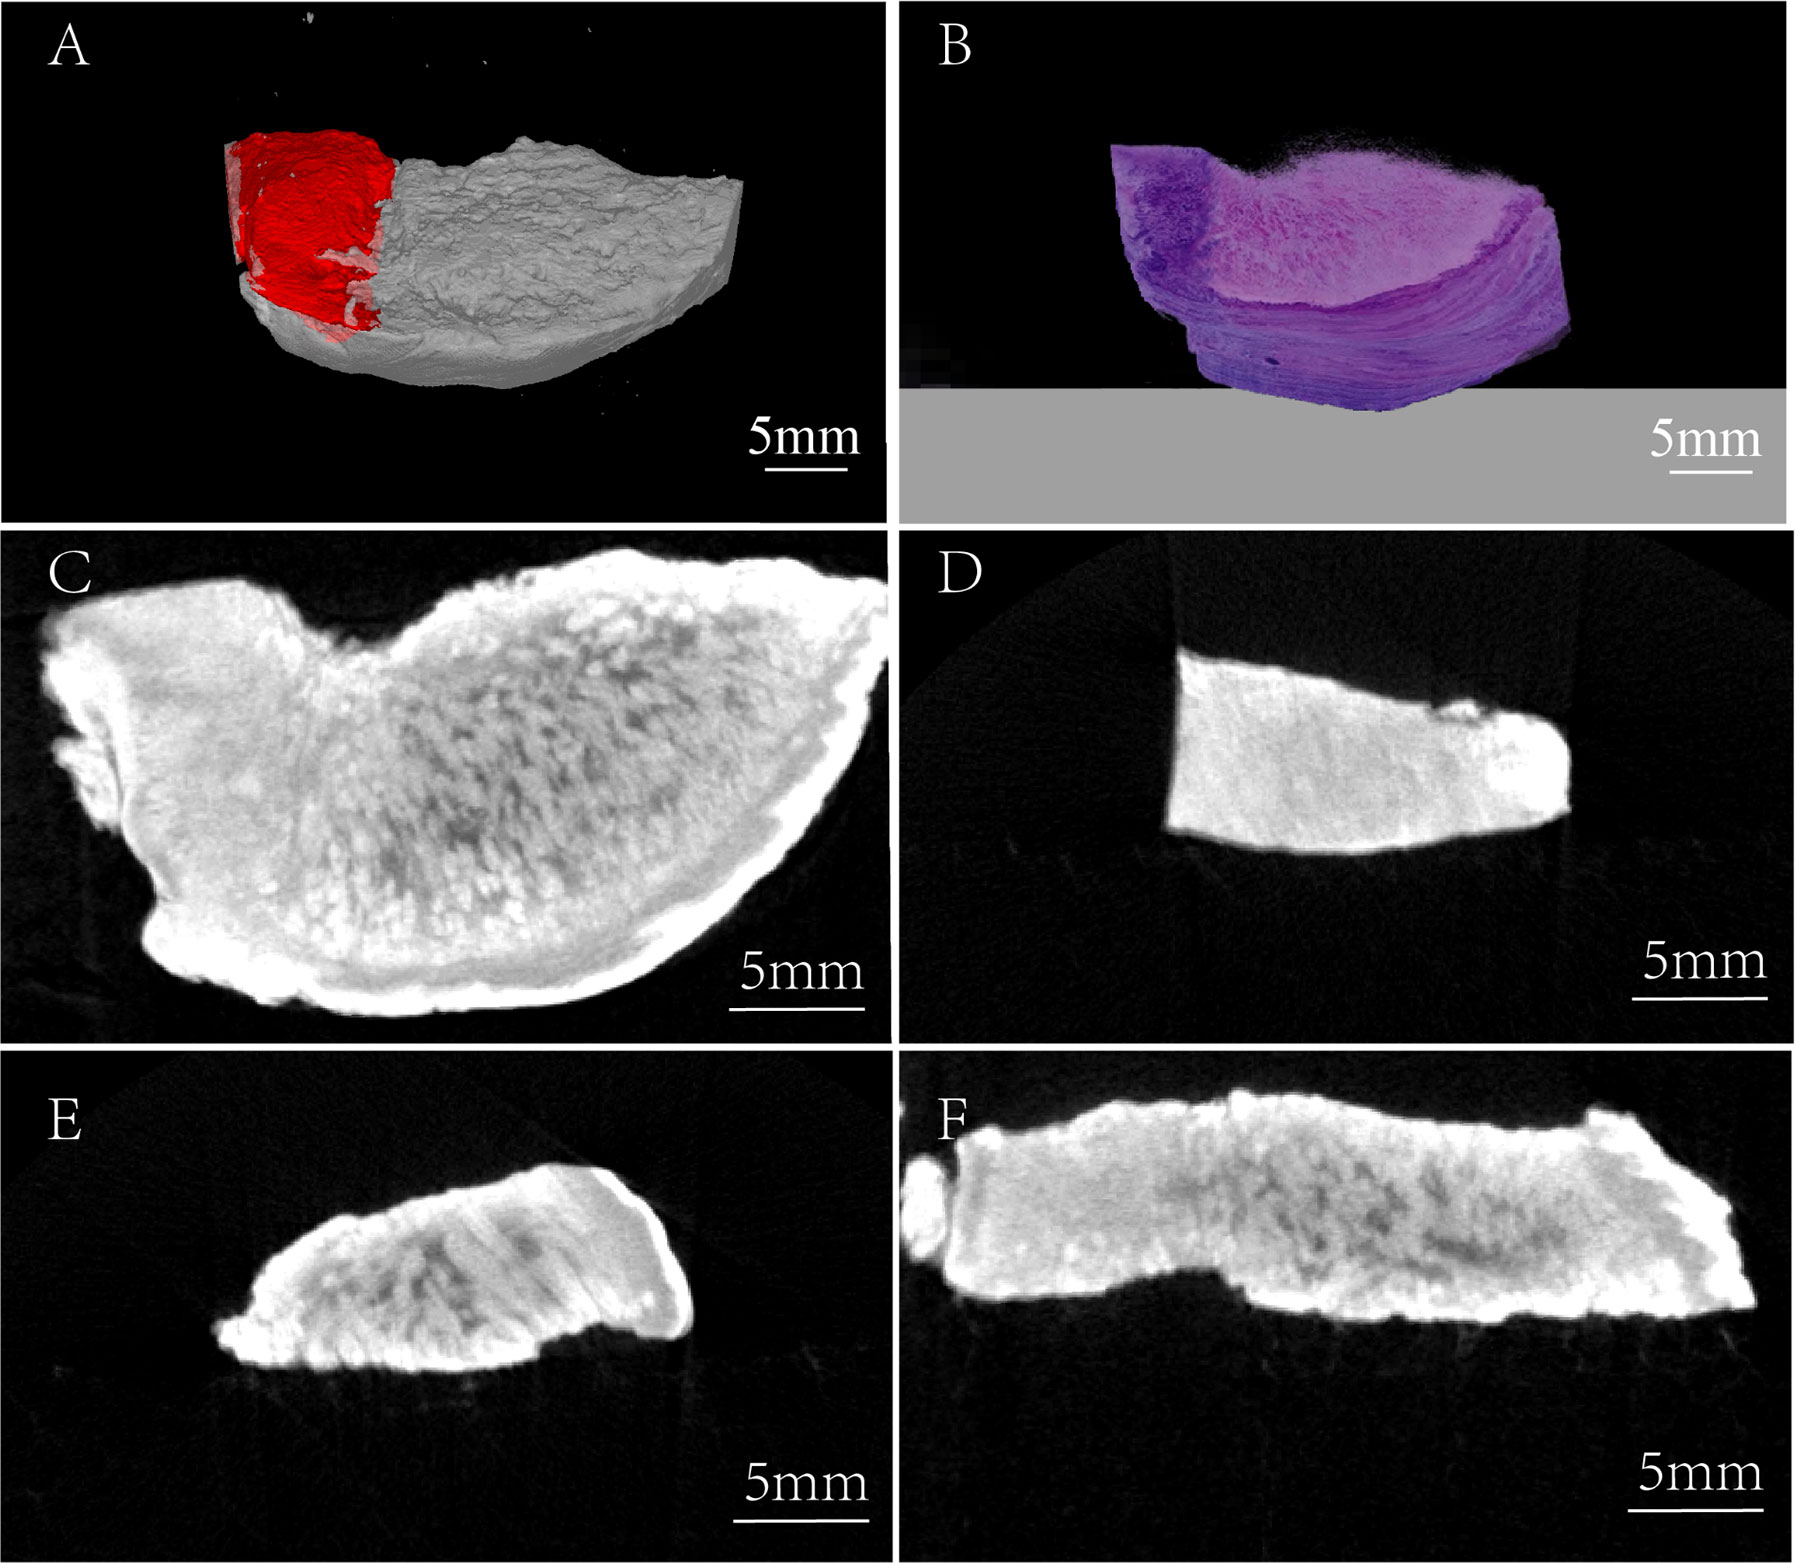
Figure 3 Three-dimensional comparison between the micro-CT image and H&E staining image. (A) Micro-CT 3-D reconstruction image, red region: tumor tissue. (B) 3-D H&E staining image. (C) Horizontal view of TSCC sample. (D) Frontal view of TSCC sample (the region of tumor tissue). (E) Frontal view of TSCC sample (the region of normal tissue). (F) Axial view of TSCC sample.
Previous studies (17) indicate that I2-IK has different affinities to different tissues, which may be related to glycogen. To verify the correctness of this hypothesis, SCC9 TSCC cells were cultured in DMEM-high and DMEM-low glucose medium, respectively. Then SCC9high glucose and SCC9low glucose were stained with different concentrations of I2-IK and observed by microscopy. The results show that I2-IK has more affinity with SCC9high glucose compared to that with SCC9low glucose (p < 0.001) (Figures 4A, B). Moreover, tumor tissues, muscle, and mucosa from a patient with OSCC were acquired to detect the glycogen content. The results show different contents of glycogen in tumor tissues, muscles, and mucosa (Figure 4C). This suggests that the mechanism underlying I2-IK-enhanced micro-CT is the different content of glucose in different tissues, resulting in different accumulation of I2-IK according to the tissue glucose content.
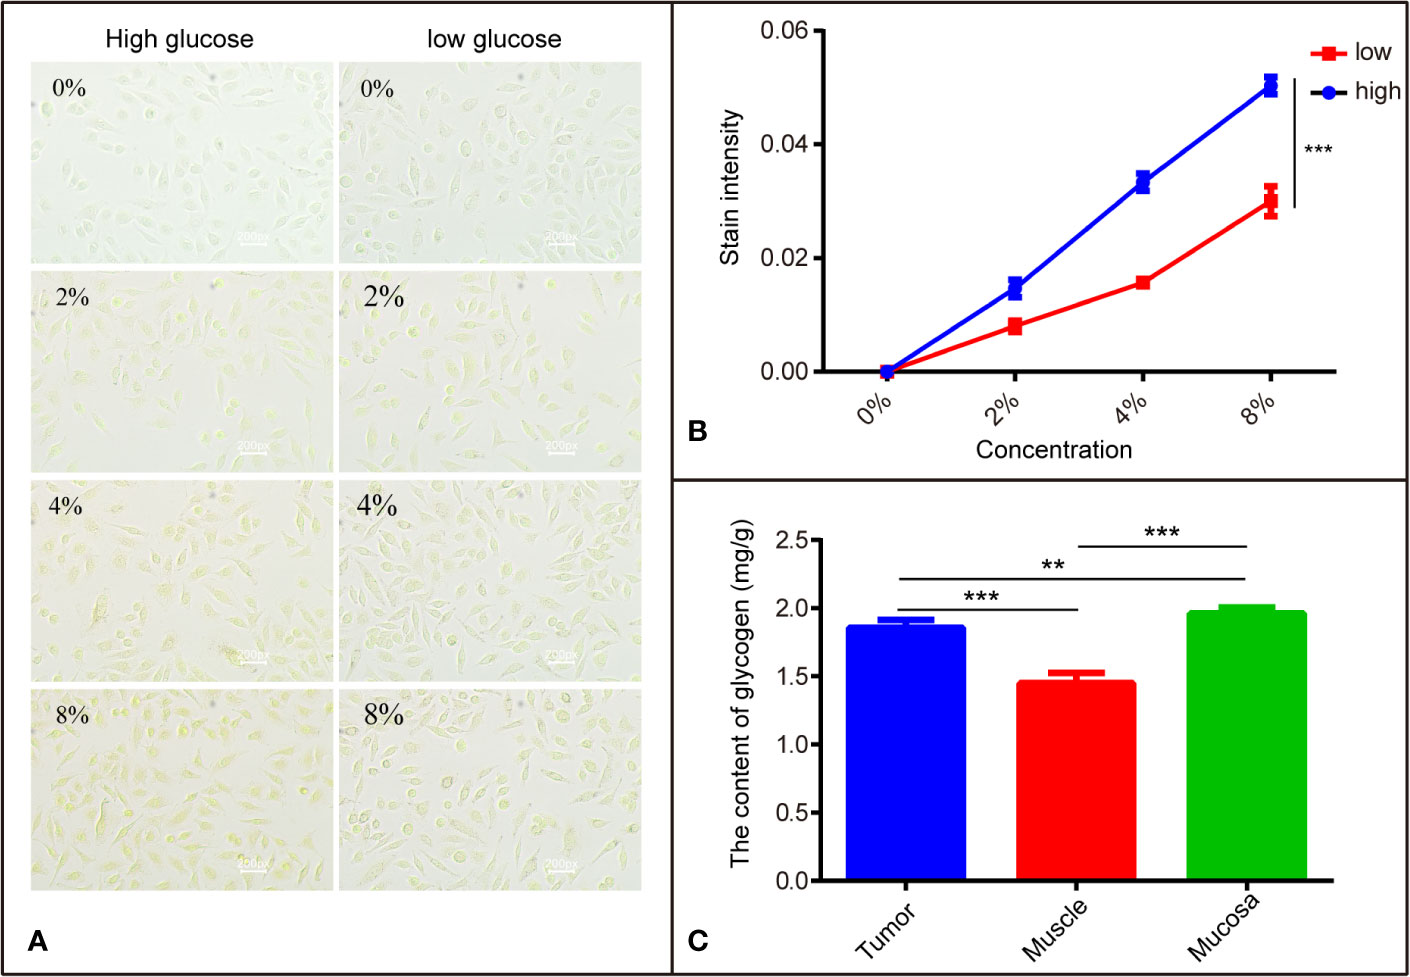
Figure 4 The different affinity of I2-IK with different tissues is related to glycogen. (A) The stained image of SCC9 cells with different concentrations of I2-IK. (B) Quantitative result of cells stained with I2-IK. (C) The content of glycogen in different tissues including tumor tissues, muscle, and mucosa. **P < 0.01, ***P < 0.001.
With spatial resolution reaching micron levels, micro-CT has been widely applied to various fields, including material science (22), archaeology (23), biomedicine (24–26), and so on. However, limited by density resolution, micro-CT is mainly used for hard tissue imaging, such as bone structure analysis in biomedicine. Notably, with the introduction of contrast agents such as I2-IK, the application scope of micro-CT has been further expanded to soft tissue imaging. Thompson et al. utilize I2-IK to stain the rat sciatic and pig vagus nerves for 24 and 120 h and show that the anatomy of peripheral nerves was clearly depicted by micro-CT imaging compared to the pathological sections (27). Jeffery et al. also illustrate micro-CT images in which contrast between muscle and connective tissues was achieved by means of staining with I2-IK (28). However, with the variety of stains gradually increasing, selection of proper stains is also vital for micro-CT imaging of TSCC samples. I2-IK, phosphomolybdic acid (PMA), phosphotungstic acid (PTA), and osmium tetroxide are the commonly used contrast agents at present. Among these, I2-IK is the most widely used for its advantages of low cost, convenient use, nontoxicity, and so on (24, 25). Compared to I2-IK, PMA- and PTA-enhanced micro-CT imaging yield similar imaging quality. However, application of PMA and PTA is limited by inevitable shortcomings, including irreversible tissue destruction, poor ability of tissue penetration, and exorbitant price. With osmium tetroxide, the image quality was relatively poorer and was mainly applicable to specimens embedded in resin blocks. Therefore, I2-IK has been adopted to enhance the contrast between OSCC tumors and normal tissues in this study. Compared to simple micro-CT imaging without staining, the fine anatomy in OSCC samples includes tumor, muscle, and mucosa tissues, which may be easier to distinguish after I2-IK staining.
Although I2-IK is an ideal contrast agent for micro-CT imaging of soft tissues, including tumor samples, overstaining or understaining may considerably affect the final image quality. The key to solving this problem is to explore the optimal staining parameters. I2-IK concentration and staining time are the two key parameters for micro-CT imaging quality. According to previous studies (29), different tissues have different optimal parameters for micro-CT. The optimal concentration of I2-IK ranged from <1% to 40%, whereas the staining time ranged from 30 min to 100 days for different kinds of tissues (24, 29, 30). To sum up, staining with low concentrations of I2-IK needs more time and produces little contrast between different tissues, whereas staining with high concentrations of I2-IK may lead to overstaining, which may reduce the contrast. Further, staining with a high concentration of I2-IK may further influence the quality of the pathological section/staining (31). In this study, the time- and concentration-dependent effects of I2-IK on the quality of micro-CT image and pathological section/staining were analyzed. We found that 3% I2-IK staining for 12 h was optimal for micro-CT imaging of OSCC primary tumor tissues.
At present, complete surgical excision of tumor lesions remains the first choice for patients with TSCC. However, due to the strong invasive characteristics of TSCC and the complex anatomical structure in the oral region, it is extremely difficult to remove TSCC tumor cells completely. The concept of a safe margin has, thus, been introduced and is continuously being improved. Currently, a safe margin is indicated by a distance of at least 5 mm away from the tumor tissues under microscopy, to indicate normal tissues (32). Intraoperative frozen sections and general paraffin-embedded sections have been used to evaluate the status of the surgical margin. However, due to the limitation of tumor tissue sampling, conventional pathological methods often produce false negatives, which lead to TSCC recurrence. In this study, we prove that I2-IK-enhanced micro-CT imaging could provide a complete and detailed 3-D anatomical structure of TSCC in vitro samples. Thus, with the help of I2-IK-enhanced micro-CT, conventional pathological examination of the status of the surgical margin will be more accurate. It is, thus, meaningful for clinicians to decide further treatment options for patients with OSCC after surgery.
Detection of residual tumor tissues intraoperatively and their timely resection may reduce the regional recurrence of TSCC (6). At present, there are two persistent key problems that need to be solved to promote the application of I2-IK-enhanced micro-CT image intraoperatively. First, the current definition of a safe margin is based on the distance of the pathological section. Owing to inevitable tissue shrinkage during the I2-IK staining process and pathological section preparation, it is important to accurately convert the distance between the pathological image and micro-CT image. In this study, tissue shrinkage during the I2-IK staining process and pathological section preparation process was calculated roughly to draw the following conclusions. The higher the I2-IK concentration, the more the tissue shrinkage during I2-IK staining process, whereas less tissue shrinkage occurred during pathological sectioning. However, these results are not sufficient for accurate distance conversion between a pathological image and micro-CT image. Nowadays, with the continued development of artificial intelligence (AI) technology, the combination of deep machine learning and a biomedical image processing algorithm like texture matching and nonrigid registration algorithms may provide a perfect solution (33–35). Second, in this study, OSCC tumor tissue blocks needed to be stained for 12 h, which hampers the application of I2-IK-enhanced micro-CT imaging during operation. Thus, accelerating the process of I2-IK staining is an important issue to resolve. Temperature is also an important factor affecting molecular motion and molecular diffusion. An increase in the staining temperature may improve the penetration rate of I2-IK into OSCC tumor samples. However, the structure and composition of OSCC tissues may also change as the temperature rises. Therefore, the optimal staining temperature remains to be explored. In addition to temperature, ultrasound also improves the motion and diffusion of molecules. Khosrawipour et al. found that, after 300 s of high-intensity ultrasound (HIUS) treatment, tissue penetration of doxorubicin into the peritoneal tissue improved by 3.8-fold (36). Further studies are thus needed to promote the application of I2-IK-enhanced micro-CT imaging intraoperatively.
I2-IK-enhanced micro-CT imaging could position the tumor accurately and illustrate the tumor margin in TSCC specimens. It may, thus, be a potential method to evaluate the surgical margin and assist in margin sampling for patients with TSCC during surgery.
The original contributions presented in the study are included in the article/Supplementary Material. Further inquiries can be directed to the corresponding authors.
The studies involving human participants were reviewed and approved by the medical ethics committee of the Institute Affiliated Stomatology Hospital, the Nanjing University Medical School. The patients/participants provided their written informed consent to participate in this study. The animal study was reviewed and approved by the Care Committee of the Nanjing University.
C-WX, R-lG, and Y-XW are responsible for the study concept and study design. C-WX, R-lG, J-rP, S-qH, and Q-zZ performed the data acquisition. C-WX, R-lG, SC, and LZ performed the quality control of data and algorithms, data analysis and interpretation, and statistical analysis. C-WX and R-lG prepared the manuscript. Y-XW and Q-GH edited and revised the manuscript. All authors contributed to the article and approved the submitted version.
This study was supported by grants from the State Commission of Science & Technology of China (2016YFC0104100), the Jiangsu Province Science & Technology Department (BE2018618), and the Nanjing Medical Science and Technique Development Foundation (QRX17174).
The authors declare that the research was conducted in the absence of any commercial or financial relationships that could be construed as a potential conflict of interest.
The Supplementary Material for this article can be found online at: https://www.frontiersin.org/articles/10.3389/fonc.2020.550171/full#supplementary-material
3D, Three-dimensional; AI, Artificial intelligence; CNR, Contrast to Noise Ratio; CT, Computed tomography; DAB, Diaminobenzidine; H&E, Hematoxylin and Eosin; HIUS, High-intensity ultrasound; I2-IK, Lugol’s iodine; ICG, Indocyanine green; IHC, Immunohistochemistry; OSCC, Oral squamous cell carcinomas; PMA, Phosphomolybdic acid; PSM, Positive surgical margin; PTA, Phosphotungstic acid; TSCC, Tongue squamous cell carcinomas.
1. Siegel RL, Miller KD, Jemal A. Cancer statistics, 2018. CA Cancer J Clin (2018) 68:7–30. doi: 10.3322/caac.21442
2. Taghavi N YI. Prognostic Factors of Survival Rate in Oral Squamous Cell Carcinoma: Clinical, Histologic, Genetic and Molecular Concepts. Arch Iranian Med (2015) 18:314–9. doi: 0151805/AIM.0010
3. Mes SW, Leemans CR, Brakenhoff RH. Applications of molecular diagnostics for personalized treatment of head and neck cancer: state of the art. Expert Rev Mol Diagn (2016) 16:205–21. doi: 10.1586/14737159.2016.1126512
4. Fein DA, Mendenhall WM, Parsons JT, Mccarty PJ, Stringer SP, Million RR, et al. Carcinoma of the oral tongue: A comparison of results and complications of treatment with radiotherapy and/or surgery. Head Neck J Sci Specialt Head Neck (1994) 16:358–65. doi: 10.1002/hed.2880160410
5. Orosco RK, Tapia VJ, Califano JA, Clary BM, Cohen EEW, Kane CJ, et al. Positive Surgical Margins in the 10 Most Common Solid Cancers. Sci Rep (2018) 8:5686. doi: 10.1038/s41598-018-23403-5
6. Pu Y, Wang Y, Huang X, Chen S, Wang Z, Sun G, et al. The influence of mild dysplasia at the surgical margin on the prognosis of oral squamous cell carcinoma. Int J Oral Maxillofac Surg (2016) 45:1372–7. doi: 10.1016/j.ijom.2016.08.019
7. Maxwell JH, Thompson LDR, Brandweingensler M, Weiss BG, Canis M, Purgina B, et al. Early Oral Tongue Squamous Cell Carcinoma: Sampling of Margins From Tumor Bed and Worse Local Control. Arch Otolaryngol Head Neck Surg (2015) 141:1104–10. doi: 10.1001/jamaoto.2015.1351
8. Dunne AA, Muller H, Eisele DW, Kesel K, Moll R, Werner JA. Meta-analysis of the prognostic significance of perinodal spread in head and neck squamous cell carcinomas (HNSCC) patients. Eur J Cancer (2006) 42:1863–8. doi: 10.1016/j.ejca.2006.01.062
9. Onozato ML, Hammond S, Merren M, Yagi Y. Evaluation of a completely automated tissue-sectioning machine for paraffin blocks. J Clin Pathol (2013) 66:151–4. doi: 10.1136/jclinpath-2011-200205
10. Okusanya OT, Holt DE, Heitjan DF, Deshpande C, Venegas O, Jiang J, et al. Intraoperative Near-Infrared Imaging Can Identify Pulmonary Nodules. Ann Thoracic Surg (2014) 98:1223–30. doi: 10.1016/j.athoracsur.2014.05.026
11. Ntziachristos V, Yodh AG, Schnall MD, Chance B. Concurrent MRI and diffuse optical tomography of breast after indocyanine green enhancement. Proc Natl Acad Sci U States America (2000) 97:2767–72. doi: 10.1073/pnas.040570597
12. Der Vorst JRV, Schaafsma BE, Hutteman M, Verbeek FPR, Liefers G, Hartgrink HH, et al. Near-infrared fluorescence-guided resection of colorectal liver metastases. Cancer (2013) 119:3411–8. doi: 10.1002/cncr.28203
13. Kim H, Quan YH, Choi BH, Park J, Han KN, Choi Y, et al. Intraoperative pulmonary neoplasm identification using near-infrared fluorescence imaging. Eur J Cardio Thoracic Surg (2016) 49:1497–502. doi: 10.1093/ejcts/ezv367
14. Wang Y, Xie D, Wang Z, Zhang X, Zhang Q, Wang Y, et al. Kinetics of indocyanine green: Optimizing tumor to normal tissue fluorescence in image-guided oral cancer surgery applications. Head Neck (2019) 41:1032–8. doi: 10.1002/hed.25541
15. Xie D, Wang Y, Wang Z, Wang J, Han H, Shi J, et al. Kinetics analysis of indocyanine green based on a novel mouse model to distinguish between tumor and inflammation. Analyt Methods (2019) 11:5704–10. doi: 10.1039/C9AY01906E
16. Tang R, Buckley JM, Fernandez L, Coopey S, Aftreth O, Michaelson J, et al. Micro-computed tomography (Micro-CT): a novel approach for intraoperative breast cancer specimen imaging. Breast Cancer Res Treat (2013) 139:311–6. doi: 10.1007/s10549-013-2554-6
17. Gignac PM, Kley NJ. Iodine-enhanced micro-CT imaging: Methodological refinements for the study of the soft-tissue anatomy of post-embryonic vertebrates. J Exp Zool (2014) 322:166–76. doi: 10.1002/jez.b.22561
18. Apps JR, Hutchinson JC, Arthurs OJ, Virasami A, Joshi A, Zeller-Plumhoff B, et al. Imaging Invasion: Micro-CT imaging of adamantinomatous craniopharyngioma highlights cell type specific spatial relationships of tissue invasion. Acta Neuropathol Commun (2016) 4:57. doi: 10.1186/s40478-016-0321-8
19. Troschel FM, Gottumukkala RV, Dicorpo D, Mario J, Ott HC, Wright CD, et al. Feasibility of Perioperative Micro–Computed Tomography of Human Lung Cancer Specimens: A Pilot Study. Arch Pathol Lab Med (2019) 143:319–25. doi: 10.5858/arpa.2018-0249-OA
20. Teplov A, Tabata K, Fu X, Uraoka N, Roehrl MHA, Ntiamoah P, et al. Development of Standard Operating Procedure (SOP) of Micro-computed tomography (micro-CT) in Pathology. Diagn Pathol (2019) 5. doi: 10.17629/www.diagnosticpathology.eu-2019-5:273
21. Maier J, Sawall S, Kachelries M. Assessment of dedicated low-dose cardiac micro-CT reconstruction algorithms using the left ventricular volume of small rodents as a performance measure. Med Phys (2014) 41:051908. doi: 10.1118/1.4870983
22. Maire E, Withers PJ. Quantitative X-ray tomography. Int Mater Rev (2014) 59:1–43. doi: 10.1179/1743280413Y.0000000023
23. Freeth T, Bitsakis Y, Moussas X, Seiradakis JH, Tselikas A, Mangou H, et al. Decoding the ancient Greek astronomical calculator known as the Antikythera Mechanism. Nature (2006) 444:587–91. doi: 10.1038/nature05357
24. Metscher BD. MicroCT for comparative morphology: simple staining methods allow high-contrast 3D imaging of diverse non-mineralized animal tissues. BMC Physiol (2009) 9:11. doi: 10.1186/1472-6793-9-11
25. Metscher BD. MicroCT for developmental biology: A versatile tool for high-contrast 3D imaging at histological resolutions. Dev Dynam (2009) 238:632–40. doi: 10.1002/dvdy.21857
26. Degenhardt K, Wright AC, Horng D, Padmanabhan A, Epstein JA. Rapid 3D phenotyping of cardiovascular development in mouse embryos by micro-CT with iodine staining. Circ Cardiovasc Imaging (2010) 3:314–22. doi: 10.1161/CIRCIMAGING.109.918482
27. Thompson N, Ravagli E, Mastitskaya S, Iacoviello F, Aristovich K, Perkins JD, et al. MicroCT optimisation for imaging fascicular anatomy in peripheral nerves. J Neurosci Methods (2019) 15:338. doi: 10.1101/818237
28. Jeffery N, Stephenson RS, Gallagher JA, Jarvis JC, Cox PG. Micro-computed tomography with iodine staining resolves the arrangement of muscle fibres. J Biomechanics (2011) 44:189–92. doi: 10.1016/j.jbiomech.2010.08.027
29. Gignac PM, Kley NJ, Clarke JA, Colbert MW, Morhardt AC, Cerio D, et al. Diffusible iodine-based contrast-enhanced computed tomography (diceCT): an emerging tool for rapid, high-resolution, 3-D imaging of metazoan soft tissues. J Anat (2016) 228:889–909. doi: 10.1111/joa.12449
30. Pauwels E, Van Loo D, Cornillie P, Brabant L, Van Hoorebeke L. An exploratory study of contrast agents for soft tissue visualization by means of high resolution X-ray computed tomography imaging. J Microscopy (2013) 250:21–31. doi: 10.1111/jmi.12013
31. Stephenson RS, Boyett MR, Hart G, Nikolaidou T, Cai X, Corno AF, et al. Contrast enhanced micro-computed tomography resolves the 3-dimensional morphology of the cardiac conduction system in mammalian hearts. PloS One (2012) 7:4. doi: 10.1371/annotation/1baecd19-92b6-4683-b7d7-39c13a3f2e15
32. Kurita H, Nakanishi Y, Nishizawa R, Xiao T, Kamata T, Koike T, et al. Impact of different surgical margin conditions on local recurrence of oral squamous cell carcinoma. Oral Oncol (2010) 46:814–7. doi: 10.1016/j.oraloncology.2010.08.014
33. Han T, Smith BD, Salehpour M, Gifford KA. SU-E-J-209: Verification of 3D Surface Registration Between Stereograms and CT Images. Med Phys (2014) 41:205–5. doi: 10.1118/1.4888262
34. Arivazhagan S, Ganesan L. Texture segmentation using wavelet transform. Pattern Recogn Lett (2003) 24:3197–203. doi: 10.1016/j.patrec.2003.08.005
35. Stanley RJ, Cheng B. Data fusion by using machine learning and computational intelligence techniques for medical image analysis and classification. (2012).
Keywords: I2-IK, micro-CT, pathological examination, surgical margin, TSCC specimens
Citation: Xia C-W, Gan R-l, Pan J-r, Hu S-q, Zhou Q-z, Chen S, Zhang L, Hu Q-G and Wang Y-X (2020) Lugol’s Iodine-Enhanced Micro-CT: A Potential 3-D Imaging Method for Detecting Tongue Squamous Cell Carcinoma Specimens in Surgery. Front. Oncol. 10:550171. doi: 10.3389/fonc.2020.550171
Received: 08 April 2020; Accepted: 19 August 2020;
Published: 21 October 2020.
Edited by:
Chenping Zhang, Shanghai Ninth People’s Hospital, ChinaCopyright © 2020 Xia, Gan, Pan, Hu, Zhou, Chen, Zhang, Hu and Wang. This is an open-access article distributed under the terms of the Creative Commons Attribution License (CC BY). The use, distribution or reproduction in other forums is permitted, provided the original author(s) and the copyright owner(s) are credited and that the original publication in this journal is cited, in accordance with accepted academic practice. No use, distribution or reproduction is permitted which does not comply with these terms.
*Correspondence: Yu-Xin Wang, d2FuZ3l1eGluMDIxMkAxMjYuY29t; Qin-Gang Hu, cWdodUBuanUuZWR1LmNu
†These authors have contributed equally to this work
Disclaimer: All claims expressed in this article are solely those of the authors and do not necessarily represent those of their affiliated organizations, or those of the publisher, the editors and the reviewers. Any product that may be evaluated in this article or claim that may be made by its manufacturer is not guaranteed or endorsed by the publisher.
Research integrity at Frontiers
Learn more about the work of our research integrity team to safeguard the quality of each article we publish.