
94% of researchers rate our articles as excellent or good
Learn more about the work of our research integrity team to safeguard the quality of each article we publish.
Find out more
ORIGINAL RESEARCH article
Front. Oncol., 19 June 2020
Sec. Cancer Imaging and Image-directed Interventions
Volume 10 - 2020 | https://doi.org/10.3389/fonc.2020.00918
This article is part of the Research TopicNovel Methods for Oncologic Imaging Analysis: Radiomics, Machine Learning, and Artificial IntelligenceView all 38 articles
 Guomin Li1,2†
 Guihua Jiang2†
 Yingjie Mei3†
 Peng Gao4
 Ruijian Liu4
 Min Jiang4
 Yue Zhao4
 Meng Li2
 Yunfan Wu2
 Shishun Fu1
 Mengchen Liu1
 Liming Li2
 Wuming Li2
 Jianhao Yan2*
Background: Amide proton transfer-weighted (ATPw) imaging is a novel MRI technique that has been used to identify benign and malignant tumors. The present study evaluated the role of APTw imaging in differentiating papillary thyroid carcinoma from predominantly solid adenomatous nodule.
Methods: This study included 24 cases of solitary papillary thyroid carcinoma, and 20 cases of solid adenomatous nodules. Normal thyroid tissues were examined in 12 healthy subjects. The healthy subjects, eight cases of adenomatous nodule with cystic degeneration, and 12 cases of thyroid goiter, were only considered in the descriptive analysis, not included in our statistical analysis. The mean APTw value and the apparent diffusion coefficients (ADCs) of papillary thyroid carcinoma and solid adenomatous nodule were compared via a Mann-Whitney U test and receiver operating characteristic (ROC)-curve analyses.
Results: The adenomatous nodule (3.3 ± 1.3%) exhibited significantly higher APTw value (p < 0.05) than that of the papillary thyroid carcinoma (1.8 ± 0.7%). The optimal cut-off value of the mean APTw value in differentiating papillary thyroid carcinoma from adenomatous nodule was 3.15%, with a sensitivity of 60% and a specificity of 100%. The mean ADC of papillary thyroid carcinoma (1.2 ± 0.2 × 10⁻³ mm2/s) was significantly lower than that of adenomatous nodule (2.0 ± 0.4 × 10⁻³ mm2/s). The optimal cut-off value of the mean ADC was 1.35 × 10⁻³ mm2/s, with a sensitivity of 100% and a specificity of 75%. Based on the ROC-curve analysis of APT and ADC, the ADC showed a higher area under the curve (AUC) than that of APT (AUCAPT = 0.84, AUCADC = 0.95).
Conclusion: APTw imaging may be as useful as DWI for the differentiation of papillary thyroid carcinoma from predominantly solid adenomatous nodule. Although the sensitivity of ADC was greater than that of APT, APT had greater specificity.
Thyroid nodules are becoming increasingly prevalent. Nodular goiters and adenomas are the most common benign thyroid nodules, and papillary thyroid carcinoma is the most common malignant thyroid tumors (1). Nodular goiters and adenomas are usually treated by clinical observation, especially in the elderly. In contrast, the optimal treatment for papillary thyroid carcinoma is surgical excision. Therefore, the precise preoperative differentiation of nodular goiter or adenoma and papillary thyroid carcinoma is of significant practical relevance. Adenomas can occur alone or in combination with nodular goiters. Their morphologies, signals, and enhancements are similar, often resulting in difficult differential diagnoses. In particular, solitary solid nodular goiters are challenging to identify with adenomas. As such, we used adenomatous nodules (2–4) to replace solitary solid nodular goiters or thyroid adenomas in the present study.
Amide proton transfer-weighted (ATPw) imaging is a novel magnetic resonance imaging (MRI) technique that can detect mobile proteins and peptides that contain abundant amide (-CO-NH-) chemical constituents (5, 6). The APTw values can reflect the concentrations of mobile macromolecules, such as proteins and peptides. Early reports of APTw imaging for cancer assessment have focused on the brain. According to the previous literature, high-grade gliomas show higher APTw values than low-grade gliomas (7, 8), and APTw imaging is useful for assessing tumor aggressiveness. Investigators in recent human studies have reported preliminary APT findings in the breast (9), prostate (10), cervix (11), rectum (12), and lung (13). APTw values were higher in cancers than in normal tissues or benign tumors, and APT levels varied between different malignant tumors groups or different histological grades. Furthermore, APT may provide additional information to improve the results of diffusion-weighted imaging (DWI) or other MRI techniques.
The head-neck regions are challenging for molecular MRI techniques because of magnetic field inhomogeneity, and motion and such tissues are prone to artifacts. In a preliminary study on the characterization of head and neck tumors which showed the feasibility of performing APTw imaging in the head and neck by using a technique adapted from the brain, the authors hypothesized that malignant tumors have higher APT levels than healthy tissues and benign tumors and that APT levels differ among malignant tumor groups. They studied the patients with nasopharyngeal undifferentiated carcinoma, squamous cell carcinoma, non-Hodgkin's lymphoma, and benign salivary gland tumors (14, 15).
We previously reported on a study about patients with thyroid tumors that showed the feasibility of performing APTw imaging in the neck. The results showed that the APTw values of malignant nodules of the thyroid are lower than that of benign nodules, which is different from other tumors (16). However, thyroid tumors are prone to cystic change (17), which have a significant influence on the measurement of APTw values. Our previous study samples were simply divided into benign groups and malignant groups. Both the two groups contained different pathological types, and cystic nodules were not excluded. We want to explore the diagnostic performance of APTw imaging in differentiating papillary thyroid carcinoma from predominantly solid adenomatous nodule. Now we need to further group and measure them accurately, calculate the threshold, sensitivity, and specificity of APT and ADC to distinguish solid papillary thyroid carcinoma and solid adenomatous nodule.
The local Institutional Review Board approved this study, and all subjects gave written, informed consent before participation in this study. Between 2018 and 2019, 24 biopsy-proven papillary thyroid carcinomas, 28 cases of adenomatous nodule, and 12 cases of thyroid goiter underwent MRI exam. This study included 12 healthy subjects. The healthy subjects, 8 cases of adenomatous nodules with cystic degeneration, and 12 cases of thyroid goiter were only considered in the descriptive analysis, not included in statistical analysis. Thus, 24 papillary carcinomas (15 females, 9 males; 41.16 ± 13.43 years old; range, 29–68 years old) and 20 adenomatous nodules (13 females, 7 males; 42.80 ± 10.20 years old; range, 22–72 years old) were included in the study.
MR imaging was performed with a Philips 3-Tesla (3T) scanner (Ingenia, 3.0 T; Philips Medical Systems, The Netherlands). A 16-channel head-neck coil was used for scanning. The patients underwent T1- [repetition time (TR)/echo time (TE), 570/18 ms] and T2-weighted MR imaging [TR (ms)/TE (ms), 2,500/100] with the section thickness of 4 mm, an intersection gap of 1 mm, field-of-views of 20–25 cm, and an acquisition matrix of 256 × 224. The scan time of T1WI is 85 s and the scan time of T2WI is 150 s. Images were obtained in axial and coronal planes, following scout images in the sagittal plane.
In addition to conventional MR imaging (T1-weighted imaging, T2-weighted imaging, and Gd-enhanced T1-weighted imaging), APTw sequences and reduced field-of-view (r-FOV) diffusion-weighted sequences with different b values (0, 800 mm2/s) were acquired. Other parameters of DWI were as follows: field-of-views of 116 × 51 mm2; voxel size of 1.81 × 1.81 mm2; slice thickness of 4 mm; TR (ms)/TE (ms) of 3,687/62; scan time of 221 s. APTw imaging was performed using a 3-dimensional (3D) turbo-spin-echo Dixon sequence with these parameters as follows: slice thickness of 4.4 mm, acquisition voxel size of 1.8 × 1.8 mm2, TR (ms)/TE (ms) of 4,108/5.9, scan time of 259 s, and turbo spin-echo factor of 158. APTw imaging was performed with seven saturation-frequency offsets (offsets = ± 2.7, ± 3.5, ± 4.3 ppm, and 1,540 ppm). The protocol was repeated three times at ±3.5 ppm to increase the signal-to-noise ratio within an appropriate time frame. Saturation radio-frequency pulses for APTw imaging were implemented with an amplitude of 2 μT and a duration of 2 s. B0 maps were obtained with three acquisitions at 3.5 ppm of different echo times. B0-corrected ATPw images were reconstructed online.
The two radiologists conducting the present study determined by consensus whether the APTw maps and ADC maps were acceptable for statistical analysis. All images were interpreted by two radiologists specializing in head and neck imaging. APTw and ADC imaging were automatically generated via a Philips post-processing workstation. We calculated the mean APTw value and ADC value by drawing a region of interest (ROI). The radiologists drew an ROI around the predominantly solid thyroid nodules or drew a ROI on the central of one leaf of the normal thyroid tissues on the APTw image and ADC map by using the T2WI for reference, and then the mean APTw value and mean ADC value was obtained from the ROI, as shown in Table 2. The ROI analysis was repeated by two observers to assess the inter-observer agreement. The two radiologists processed the MR images independently. They were blinded to the histopathologic data.
The APTw values and ADC values of the papillary thyroid carcinoma were compared with that of the thyroid adenomatous nodules using a Mann-Whitney U test. The diagnostic performances of significant APTw parameters for differentiating the papillary thyroid carcinoma from the adenomatous nodules were assessed by using ROC-curve analyses with the AUC. The APTw threshold was acquired by calculating the Youden index, which is the sum of the sensitivity and specificity −1, and the APTw value corresponding to the point where the Yoden index is the largest was considered the APTw threshold. Then the sensitivity, specificity of the optimal thresholds were calculated. Statistical analysis was performed using SPSS software 21.0. All statistical tests were two-sided, and a p-value of <0.05 was considered to indicate a statistically significant difference.
The characteristics of the patients are shown in Table 1 and the subjects selection flowchart is shown in Figure 1. We first assessed the radiographic features of some interesting cases and normal thyroids using several standards sequences (T1-weight images, T2-weight images, Gd- T1-weight images, DWI) and APTw sequences. Figure 2 shows the normal thyroid tissue and diffuse goiter. They appear homogenously isointense on APTWI, and their APTw values (normal thyroid, 2.15%; diffuse goiter, 2.36%) are similar, and neither is very high. Figure 3 shows two thyroid nodules with cystic changes. The A cyst rich in serous fluid and appeared hypointense on T1-weight images (T1WI), hyperintense on T2-weight images (T2WI), and hyperintense on APTWI (APTw values = 7.33%). The B cyst is rich in thyroid colloid and appears hyperintense on T1WI, hypointense on T2WI, hypointense on APTWI (APTw values = 1.53%). The solid portion appears isointense on T1WI and hyperintense on T2WI and APTWI (APTw values = 3.56%).
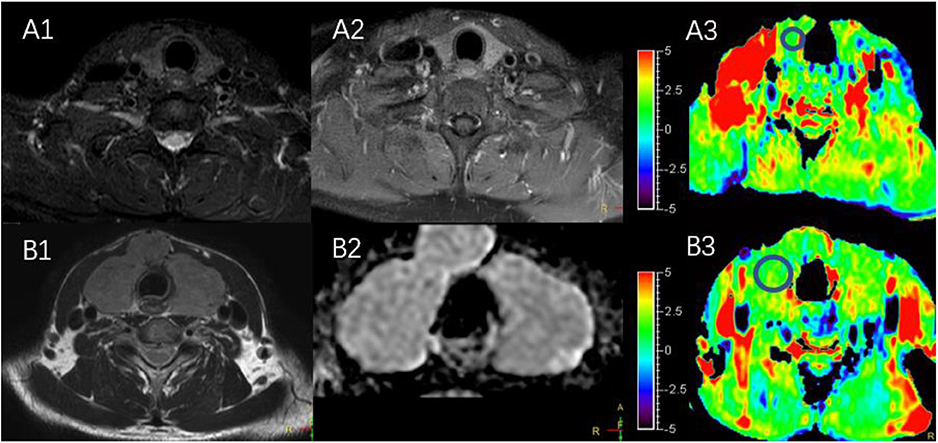
Figure 2. (A1–A3) MR images of a normal thyroid, including T2WI (A1), Gd-T1WI (A2), and APTWI (A3). (B1–B3) MR images of diffuse goiter, including T2WI (B1), ADC map (B2), and APTWI (B3).
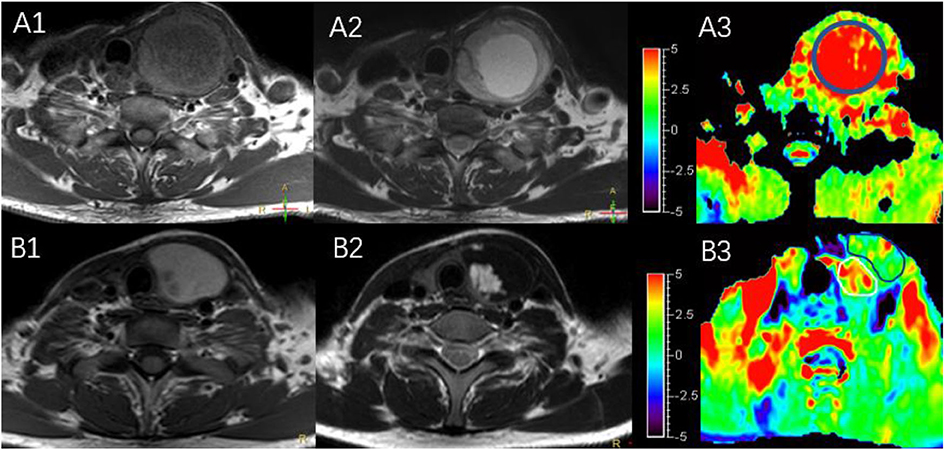
Figure 3. MR images of two predominantly cystic thyroid nodules, including T1WI (A1,B1), T2WI (A2,B2), and APTWI (A3,B3).
Figure 4 shows two predominantly solid adenomatous nodules. One is an atypical adenomatous nodule and appeared mild enhancement on Gd-T1WI, mild hyperintense on an ADC map, and isointense on APTWI (APTw values = 2.05%). The other is a typical adenomatous nodule and exhibited strong enhancement on Gd-T1WI and hyperintense on the ADC map and APTWI (APTw values = 5.21%).
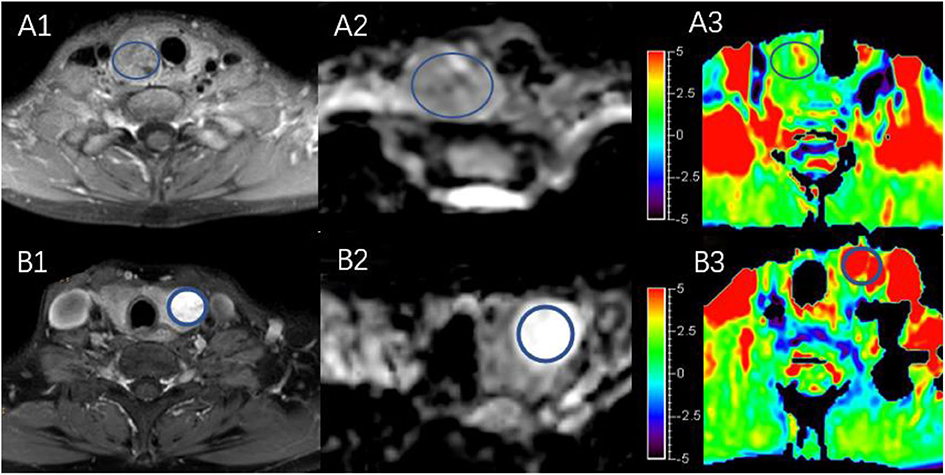
Figure 4. Both (A,B) are predominantly solid adenomatous nodules on Gd-T1WI (A1,B1), ADC map (A2,B2), and APTWI (A3,B3).
Figure 5 shows a typical solid adenomatous nodule and a papillary thyroid carcinoma. The adenomatous nodule appeared hyperintense on both the ADC map and T2WI, and the mean APTw value was 6.10%. The papillary thyroid carcinoma appeared hypointense on ADC map, heterogeneous iso-/hypo-intensity on APTWI, and the mean APTw value was 1.93%.
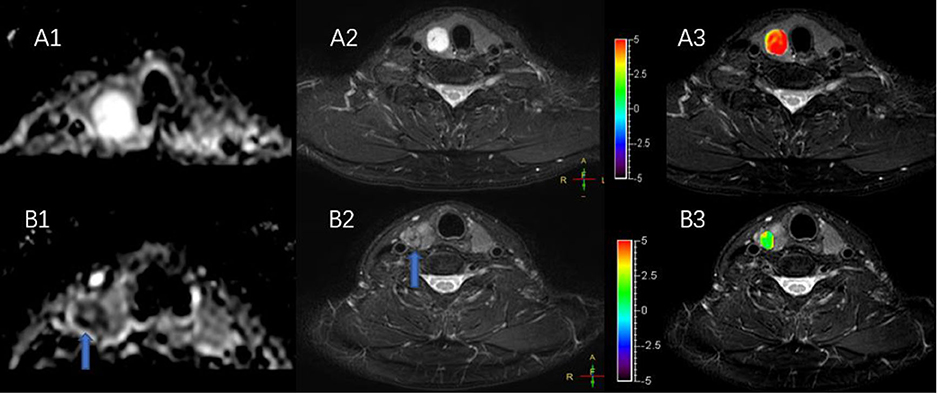
Figure 5. (A,B) Show a solid adenomatous nodule and a papillary thyroid carcinoma on the ADC map (A1,B1), T2WI (A2,B2), and the combination of T2WI and APTWI (A3,B3).
The intraclass correlation coefficients (ICC) showed excellent observer agreement (ICCAPT = 0.92, ICCADC = 0.96, p < 0.01). Table 2 and Figure 6 show the APTw values and ADC values of thyroid nodules in this study, and there was a significant difference in the APTw value and ADC of the papillary thyroid carcinoma and adenomatous nodule. The adenomatous nodule (3.3 ± 1.3%) exhibited higher APT-weighted signal intensities than that of papillary carcinoma (1.8 ± 0.7%; p < 0.01). The mean ADC of the papillary thyroid carcinoma (1.2 ± 0.2 × 10⁻³ mm2/s) was significantly lower than that of the adenomatous nodule (2.0 ± 0.4 × 10⁻³ mm2/s; p < 0.01). The optimal cut-off value of the mean APTw value in differentiating papillary thyroid carcinoma from the adenomatous nodule was 3.15%, with a sensitivity of 60% and a specificity of 100% (Figure 7). The mean ADC of the papillary thyroid carcinoma was significantly lower than that of the adenomatous nodule. The optimal cut-off value of the mean ADC in differentiating papillary carcinoma from adenomatous nodule was 1.35 × 10⁻³ mm2/s, with a sensitivity of 100% and specificity of 75%. The ROC curve analysis revealed that ADC exhibited a higher AUC value compared to that of APT (AUCAPT = 0.84, AUCADC = 0.95). The r-FOV DWI showed a better diagnostic performance than that of APTw imaging. Although the sensitivity of DWI (100%) was significantly higher than that of APT (60%), the specificity of APT (100%) was substantially higher than that of ADC (75%).
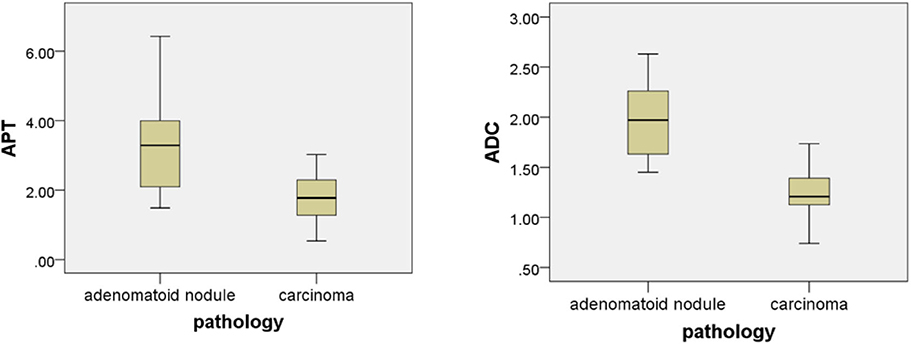
Figure 6. Box plot of the APT (%) and the ADC (mm2/s) of adenomatous nodule and papillary thyroid carcinoma.
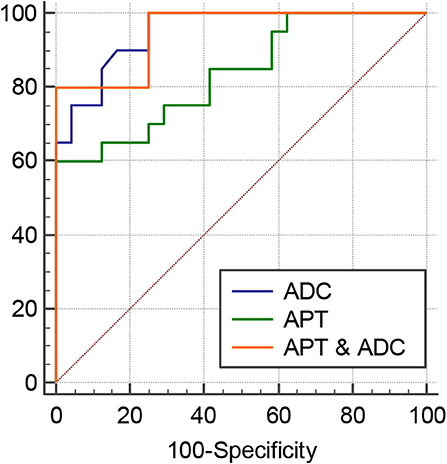
Figure 7. ROC curves of APT, ADC, and the combination of APT and ADC for differentiation between papillary thyroid carcinoma and adenomatous nodule: the AUC was 0.95 (ADC), 0.95 (APT and ADC), and 0.835 (APT).
In this study, we explored the diagnostic performance of using APTw imaging to differentiate papillary thyroid carcinoma from the solid adenomatous nodule. The aim was to differentiate papillary thyroid carcinoma from adenomatous nodule so that the patients with papillary thyroid carcinoma would be able to receive appropriate treatment at an earlier stage while avoiding unnecessary surgery in the patients with adenomatous nodules. The present study showed a significant difference between the ADC and APTw value of papillary thyroid carcinoma and adenomatous nodule, in which the most adenomatous nodules had higher mean ADC and APTw value than papillary thyroid carcinoma. It is not clear why adenomatous nodules have higher APTw value than papillary thyroid carcinoma, as opposed to other tumors.
Diffusion-weighted imaging provides a better characterization of tissues because it can reflect the random motion of water molecules, which is disturbed by intracellular macromolecules. Previous studies have evaluated the role of diffusion-weighted imaging in differentiating benign from malignant thyroid nodules (18–24). The APTw values can reflect the concentrations of mobile macromolecules, such as proteins and peptides. Our previous studies on the thyroid established a positive correlation between APTw values with ADC. Part of the reason for this may be because the APTWI detects free protein rather than solid proteins.
As shows in Figure 2, the APTw value of normal thyroid tissue and diffuse goiters are similar, and neither is very high despite relatively abundant colloid components in the diffuse goiter. The components of the cystic thyroid zone consist mainly of serous fluid, thyroid colloid (thyroglobulin), and blood from different periods, and they exhibit characteristic MR signals (25, 26). Serous fluid often appears hypointense on T1WI and hyperintense on T2WI, similar to that of water. Thyroid colloid contains macromolecular thyroglobulin, which shortens the T1 relaxation time and shows a homogenous high signal on T1WI. Blood fluid from different periods can display various heterogeneous signal intensities (27, 28). Figure 3 exhibits a thyroid nodule with the cystic change, and the components of the cystic thyroid zone consist mainly of thyroid colloid, but the APTw value is low. It is speculated that the thyroid colloid does not show a high signal intensity on APTWI, and the reasons why the APTw value of adenomatous nodule was higher than that of papillary thyroid carcinoma is not that adenomatous nodule contains abundant thyroid colloid.
In the present study, most solid adenomatous nodules showed significantly high APTw value, but some were similar to normal thyroid tissue. The typical adenomatous nodule that showed high signal on the APTw image exhibited isointense on T1WI, hyperintensity on T2WI, and strong enhancement on Gd-T1WI, indicating that there is abundant microvessel on the typical adenomatous nodule. The typical adenomatous nodule had a high ADC value, indicating active water-molecule movement. On the contrary, the atypical adenomatous nodule exhibited isointense on the ADC map and slight enhancement on Gd-T1WI, indicating the restricted water-molecule movement and the less microvessel compared with typical adenomatous nodule (29). The blood supply of papillary thyroid carcinoma is not as abundant as in typical adenomatous nodule, and papillary thyroid carcinoma has a high density of tumor cells, small extracellular space, and high cytoplasmic viscosity (21, 30–34). In conclusion, abundant blood supply may underlie why adenomatous nodule has higher APTw value than papillary thyroid carcinoma.
The present study had some limitations. First, the sample size was small. Second, the head and neck are challenging regions in which to perform functional MRIs because of field inhomogeneity, relatively low signal-to-noise ratio, movement artifacts, and difficulties with imaging fat suppression. Third, some thyroid microcarcinomas may occur in adenomatous nodules. In addition, there is some biases because the ROIs were drawn manually on the APTWI and ADC maps by using the anatomic images for reference. The APT value of adenomatous nodules is not absolutely higher than that of papillary thyroid carcinoma, but it is because most papillary carcinomas are relatively small when they are found. At this stage, the papillary carcinoma has incompletely developed blood vessels and relatively less blood vessels. If the supply of blood vessels to the papillary cancer in the late stage becomes rich, then like other malignant tumors, the APT value of papillary thyroid carcinoma will increase and close to the adenomatous nodule.
APTw imaging may be useful for the differentiation of papillary thyroid carcinoma from predominantly solid adenomatous nodule. DWI had higher accuracy and sensitivity but lower specificity than APTw imaging. From our present results, we hypothesize that plentiful blood supply may be the main reason why the APTw value of the typical adenomatous nodule is higher than that of papillary thyroid carcinoma.
The datasets generated for this study are available on request to the corresponding author.
The studies involving human participants were reviewed and approved by Ethics committee of Guangdong Second Provincial General Hospital. The patients/participants provided their written informed consent to participate in this study.
GJ designed the experiment. GL and RL carried out the experiment. LL, WL, PG, YZ, MJ, and MLi collected and sorted out the data. YW, SF, and MLiu helped on data management and processing. JY and GL wrote the manuscript. YM revised the manuscript.
This study was funded by the National Natural Science Foundation of China (Grant number: 81701111), the Science and Technology Planning Project of Guangdong Province, China (2017045), and Medical Science and Technology Foundation of Guangdong Province (A2016411).
YM was employed by the company Philips Healthcare.
The remaining authors declare that the research was conducted in the absence of any commercial or financial relationships that could be construed as a potential conflict of interest.
1. Schob S, Voigt P, Bure L, Meyer HJ, Wickenhauser C, Behrmann C, et al. Diffusion-weighted imaging using a readout-segmented, multishot EPI sequence at 3 T distinguishes between morphologically differentiated and undifferentiated subtypes of thyroid carcinoma–a preliminary study. Transl Oncol. (2016) 9:403–10. doi: 10.1016/j.tranon.2016.09.001
2. Derwahl M, Studer H. Hyperplasia versus adenoma in endocrine tissues: are they different? Trends Endocrinol Metab. (2002) 13:23–8. doi: 10.1016/S1043-2760(01)00519-7
3. Qi L, Xue K, Li C, He W, Mao D, Xiao L, et al. Analysis of CT morphologic features and attenuation for differentiating among transient lesions, atypical adenomatous hyperplasia, adenocarcinoma in situ, minimally invasive and invasive adenocarcinoma presenting as pure ground-glass nodules. Sci Rep. (2019) 9:14586. doi: 10.1038/s41598-019-50989-1
4. Schreiner AM, Yang GC. Adenomatoid nodules are the main cause for discrepant histology in 234 thyroid fine-needle aspirates reported as follicular neoplasm. Diagn Cytopathol. (2012) 40:375–9. doi: 10.1002/dc.21499
5. Zhou J, Lal B, Wilson DA, Laterra J, van Zijl PC. Amide proton transfer (APT) contrast for imaging of brain tumors. Magn Reson Med. (2003) 50:1120–6. doi: 10.1002/mrm.10651
6. Zhou J, Blakeley JO, Hua J, Kim M, Laterra J, Pomper MG, et al. Practical data acquisition method for human brain tumor amide proton transfer (APT) imaging. Magn Reson Med. (2008) 60:842–9. doi: 10.1002/mrm.21712
7. Zhou J, Zhu H, Lim M, Blair L, Quinones-Hinojosa A, Messina SA, et al. Three-dimensional amide proton transfer MR imaging of gliomas: Initial experience and comparison with gadolinium enhancement. J Magn Reson Imaging. (2013) 38:1119–28. doi: 10.1002/jmri.24067
8. Bai Y, Lin Y, Zhang W, Kong L, Wang L, Zuo P, et al. Noninvasive amide proton transfer magnetic resonance imaging in evaluating the grading and cellularity of gliomas. Oncotarget. (2017) 8:5834–42. doi: 10.18632/oncotarget.13970
9. Dula AN, Arlinghaus LR, Dortch RD, Dewey BE, Whisenant JG, Ayers GD, et al. Amide proton transfer imaging of the breast at 3 T: establishing reproducibility and possible feasibility assessing chemotherapy response. Magn Reson Med. (2013) 70:216–24. doi: 10.1002/mrm.24450
10. Takayama Y, Nishie A, Sugimoto M, Togao O, Asayama Y, Ishigami K, et al. Amide proton transfer (APT) magnetic resonance imaging of prostate cancer: comparison with Gleason scores. MAGMA. (2016) 29:671–9. doi: 10.1007/s10334-016-0537-4
11. Li B, Sun H, Zhang S, Wang X, Guo Q. Amide proton transfer imaging to evaluate the grading of squamous cell carcinoma of the cervix: a comparative study using (18) F FDG PET. J Magn Reson Imaging. (2019) 50:261–8. doi: 10.1002/jmri.26572
12. Nishie A, Takayama Y, Asayama Y, Ishigami K, Ushijima Y, Okamoto D, et al. Amide proton transfer imaging can predict tumor grade in rectal cancer. Magn Reson Imaging. (2018) 51:96–103. doi: 10.1016/j.mri.2018.04.017
13. Ohno Y, Kishida Y, Seki S, Yui M, Miyazaki M, Koyama H, et al. Amide proton transfer-weighted imaging to differentiate malignant from benign pulmonary lesions: comparison with diffusion-weighted imaging and FDG-PET/CT. J Magn Reson Imaging. (2018) 47:1013–21. doi: 10.1002/jmri.25832
14. Law B, King AD, Ai QY, Poon D, Chen W, Bhatia KS, et al. Head and neck tumors: amide proton transfer MRI. Radiology. (2018) 288:782–90. doi: 10.1148/radiol.2018171528
15. Yuan J, Chen S, King AD, Zhou J, Bhatia KS, Zhang Q, et al. Amide proton transfer-weighted imaging of the head and neck at 3 T: a feasibility study on healthy human subjects and patients with head and neck cancer. NMR Biomed. (2014) 27:1239–47. doi: 10.1002/nbm.3184
16. Liu R, Jiang G, Gao P, Li G, Nie L, Yan J, et al. Non-invasive amide proton transfer imaging and ZOOM diffusion-weighted imaging in differentiating benign and malignant thyroid micronodules. Front Endocrinol (Lausanne). (2018) 9:747. doi: 10.3389/fendo.2018.00747
17. Kim YJ, Baek JH, Ha EJ, Lim HK, Lee JH, Sung JY, et al. Cystic versus predominantly cystic thyroid nodules: efficacy of ethanol ablation and analysis of related factors. Eur Radiol. (2012) 22:1573–8. doi: 10.1007/s00330-012-2406-5
18. Wang Q, Guo Y, Zhang J, Shi L, Ning H, Zhang X, et al. Utility of high b-value (2000 sec/mm2) DWI with RESOLVE in differentiating papillary thyroid carcinomas and papillary thyroid microcarcinomas from benign thyroid nodules. PLoS ONE. (2018) 13:e0200270. doi: 10.1371/journal.pone.0200270
19. Razek AA, Sadek AG, Kombar OR, Elmahdy TE, Nada N. Role of apparent diffusion coefficient values in differentiation between malignant and benign solitary thyroid nodules. AJNR Am J Neuroradiol. (2008) 29:563–8. doi: 10.3174/ajnr.A0849
20. Noda Y, Kanematsu M, Goshima S, Kondo H, Watanabe H, Kawada H, et al. MRI of the thyroid for differential diagnosis of benign thyroid nodules and papillary carcinomas. AJR Am J Roentgenol. (2015) 204:W332–5. doi: 10.2214/AJR.14.13344
21. Ekinci O, Boluk SE, Eren T, Ozemir IA, Boluk S, Salmaslioglu A, et al. Diffusion-weighted magnetic resonance imaging for the detection of thyroid cancer. Cir Esp. (2018) 96:620–6. doi: 10.1016/j.cireng.2018.10.002
22. Abdel RA, Sadek AG, Gaballa G. Diffusion-weighed MR of the thyroid gland in Graves' disease: assessment of disease activity and prediction of outcome. Acad Radiol. (2010) 17:779–83. doi: 10.1016/j.acra.2010.01.014
23. Abdel RA, Abd AS, El-Said A. Role of diffusion-weighted magnetic resonance (MR) imaging in differentiation between Graves' disease and painless thyroiditis. Pol J Radiol. (2017) 82:536–41. doi: 10.12659/PJR.902416
24. Abdel RA. Routine and advanced diffusion imaging modules of the salivary glands. Neuroimaging Clin N Am. (2018) 28:245–54. doi: 10.1016/j.nic.2018.01.010
25. Tennvall J, Olsson M, Moller T, Akerman M, Ranstam J, Biorklund A, et al. Thyroid tissue characterization by proton magnetic resonance relaxation time determination. Acta Oncol. (1987) 26:27–32. doi: 10.3109/02841868709092973
26. Noma S, Kanaoka M, Minami S, Sagoh T, Yamashita K, Nishimura K, et al. Thyroid masses: MR imaging and pathologic correlation. Radiology. (1988) 168:759–64. doi: 10.1148/radiology.168.3.3406406
27. Beomonte ZB, Cardone G, Tella S, Innacoli M, Cisternino S, Calvisi G, et al. Magnetic resonance in the diagnosis of thyroid diseases. Radiol Med. (1992) 84:36–42.
28. Kusunoki T, Murata K, Nishida S, Tomura T, Inoue M. Histopathological findings of human thyroid tumors and signal intensities of magnetic resonance imaging (MRI). Nihon Jibiinkoka Gakkai Kaiho. (1994) 97:1406–11. doi: 10.3950/jibiinkoka.97.1406
29. Nachiappan AC, Metwalli ZA, Hailey BS, Patel RA, Ostrowski ML, Wynne DM. The thyroid: review of imaging features and biopsy techniques with radiologic-pathologic correlation. Radiographics. (2014) 34:276–93. doi: 10.1148/rg.342135067
30. Vermoolen MA, Kwee TC, Nievelstein RA. Apparent diffusion coefficient measurements in the differentiation between benign and malignant lesions: a systematic review. Insights Imaging. (2012) 3:395–409. doi: 10.1007/s13244-012-0175-y
31. Hao Y, Pan C, Chen W, Li T, Zhu W, Qi J. Differentiation between malignant and benign thyroid nodules and stratification of papillary thyroid cancer with aggressive histological features: whole-lesion diffusion-weighted imaging histogram analysis. J Magn Reson Imaging. (2016) 44:1546–55. doi: 10.1002/jmri.25290
32. Schmidt H, Schwenzer NF, Gatidis S, Kustner T, Nikolaou K, Schick F, et al. Systematic evaluation of amide proton chemical exchange saturation transfer at 3 T: effects of protein concentration, pH, and acquisition parameters. Invest Radiol. (2016) 51:635–46. doi: 10.1097/RLI.0000000000000292
33. Gupta N, Norbu C, Goswami B, Chowdhury V, Ravishankar L, Gulati P, et al. Role of dynamic MRI in differentiating benign from malignant follicular thyroid nodule. Auris Nasus Larynx. (2011) 38:718–23. doi: 10.1016/j.anl.2011.02.002
Keywords: papillary thyroid carcinoma, predominantly solid thyroid adenomatous nodule, amide proton transfer (APT), diffusion-weighted imaging (DWI), differentiation
Citation: Li G, Jiang G, Mei Y, Gao P, Liu R, Jiang M, Zhao Y, Li M, Wu Y, Fu S, Liu M, Li L, Li W and Yan J (2020) Applying Amide Proton Transfer-Weighted Imaging (APTWI) to Distinguish Papillary Thyroid Carcinomas and Predominantly Solid Adenomatous Nodules: Comparison With Diffusion-Weighted Imaging. Front. Oncol. 10:918. doi: 10.3389/fonc.2020.00918
Received: 23 October 2019; Accepted: 11 May 2020;
Published: 19 June 2020.
Edited by:
Xuelei Ma, Sichuan University, ChinaReviewed by:
Ahmed Abdel Razek, Mansoura University, EgyptCopyright © 2020 Li, Jiang, Mei, Gao, Liu, Jiang, Zhao, Li, Wu, Fu, Liu, Li, Li and Yan. This is an open-access article distributed under the terms of the Creative Commons Attribution License (CC BY). The use, distribution or reproduction in other forums is permitted, provided the original author(s) and the copyright owner(s) are credited and that the original publication in this journal is cited, in accordance with accepted academic practice. No use, distribution or reproduction is permitted which does not comply with these terms.
*Correspondence: Jianhao Yan, eWFuamlhbmhhb0AxNjMuY29t
†These authors have contributed equally to this work
Disclaimer: All claims expressed in this article are solely those of the authors and do not necessarily represent those of their affiliated organizations, or those of the publisher, the editors and the reviewers. Any product that may be evaluated in this article or claim that may be made by its manufacturer is not guaranteed or endorsed by the publisher.
Research integrity at Frontiers

Learn more about the work of our research integrity team to safeguard the quality of each article we publish.