
95% of researchers rate our articles as excellent or good
Learn more about the work of our research integrity team to safeguard the quality of each article we publish.
Find out more
ORIGINAL RESEARCH article
Front. Oncol. , 11 June 2020
Sec. Cancer Molecular Targets and Therapeutics
Volume 10 - 2020 | https://doi.org/10.3389/fonc.2020.00875
Nasopharyngeal carcinoma (NPC) is a malignant tumor with a high rate of local invasion and early distant metastasis. Accumulating studies suggest that N6-methyladenosine methylation (m6A) is closely related to tumorigenesis. However, the relationship between m6A-related genes and prognosis of NPC is poorly understood. Our research aims to discover the prognostic value of m6A RNA methylation genes in NPC. In this study, we analyzed the differentially expressed m6A-related genes between NPC samples and normal control samples and found that two upregulated genes (YTHDF3 and IGF2BP2) and one downregulated gene (METTL3) were overlapped in GSE68799 and GSE53819. Next, we found that high expression of IGF2BP1 and low expression of METTL3 and YTHDF3 in NPC patients showed poor progression-free survival (PFS). Subsequently, the four m6A genes were selected for consensus cluster analysis, and risk models were established. The risk signature, using three genes (GF2BP1 + IGF2BP2 + METTL3), was an independent prognostic factor and predicts the clinicopathological features of NPC. Additionally, the GO, KEGG analysis, and CIBERSORT algorithm revealed that the risk signature was closely associated to immune infiltration in NPC. Finally, the expression and clinical significance of METTL3 were successfully validated in NPC tissues using immunohistochemical techniques. In conclusion, our finding revealed the potential role of m6A modification in NPC, providing novel insight into NPC prognosis and therapeutic strategies.
Nasopharyngeal carcinoma (NPC), which occurs in squamous epithelial cells of the nasopharyngeal mucosa (1), has a particularly high prevalence (2) in central and southern coastal areas of China and Southeast Asian countries (3, 4). Early symptoms of NPC are difficult to identify (5, 6). Most patients with NPC are in the middle and advanced stages at the time of diagnosis, and even lymph nodes and distant organ metastases have occurred (7, 8), with the 5-year survival rate <20% (9, 10). Therefore, it is urgent to identify reliable prognostic molecular markers and accurately predict the prognosis of NPC.
N6-methyladenosine methylation (m6A) is a post-transcriptional modification of RNA that occurs on the N atom at position 6 of RNA adenine (A) (11). To date, more than 170 post-transcriptional modifications of RNA have been discovered (12), and m6A is the most common and plentiful modification (13) and is ubiquitous in eukaryotes (14). The m6A modification is deposited by “writer” (methyltransferase), demethylated by “erase” (demethylase), and executed by “reader” (binding protein or recognition protein) process (12, 15). Methyltransferase catalyzes m6A methylation of RNA, and its core members are METTL3, METTL14, WTAP, etc. (16). Demethylase mediates m6A demethylation modification, with core members FTO and ALKBH5 (17). Binding proteins recognize RNA methylation modifications, including the YTHDF family (YTHDF1/2/3), nuclear heterogeneous riboprotein family (HNRNPA2B1, HNRNPC), and eukaryotic initiation factor (eIF) (15, 16). m6A methylation is involved in RNA metabolism-related processes such as RNA transcription, processing, splicing, degradation, and translation (18, 19). A recent study revealed that the dysregulated m6A-related genes are involved in the progression of various cancers (20). METTL3/METTL14 play a vital role in the progression of glioblastoma (21), breast (22), and liver cancer (23); FTO, notorious fat mass and obesity-associated protein, is related to the occurrence of leukemia (24), thyroid cancer (25), breast cancer, and gastric cancer (26); YTHDF2 promotes the proliferation and migration of pancreatic (27) and prostate cancer cells (25).
However, the effect of m6A methylation modification on NPC remains unclear.
In this study, GSE68799, GSE53819, and GSE103611 datasets were downloaded from the Gene Expression Omnibus Database (GEO) to analyze the expression and prognosis of m6A-related genes on NPC. Immunohistochemical analysis (IHC) was used to detect the expression of m6A-related genes in NPC tissues to determine the prognostic biomarkers of NPC.
The raw data and corresponding clinical information were downloaded from the Gene Expression Omnibus Database (GEO) (https://www.ncbi.nlm.nih.gov/geo/). The expression array data (GSE53819) containing 18 NPC tissues and 18 control tissues, the throughput sequencing data (GSE68799) containing 42 NPC tissues and 4 control tissues, and the GSE102349 dataset containing 113 NPC tissues were used for subsequent analysis.
EdgeR package was used for screening the differentially expressed genes (DEGs) between NPC tissue and control tissue with the adjusted p < 0.05 and |log2FC| > 1 from GSE53819 and GSE68799.
To determine whether the expression levels of m6A-related genes were associated with prognosis. Four m6A genes (METTL3, YTHDF3, IGF2BP1, and IGF2BP2) were selected for a Consensus Clustering analysis using the Consensus Cluster Plus package, and k = 4 seemed to be the most appropriated selection in the GSE102349 datasets. The K–M method and log-rank test was employed to calculate the progression-free survival (PFS) difference between different clusters.
To determine independent prognostic factors in NPC, the relationship between PFS of NPC patients in the GSE102349 dataset and four m6A genes (METTL3, YTHDF3, IGF2BP1, and IGF2BP2) was analyzed using univariate Cox regression. The hazard ratio (HR) of gene larger than 1 is considered a poor prognosis for high expression, while those <1 is considered a poor prognosis for low expression. According to the minimum standard (p < 0.05), determine three genes (GF2BP1, IGF2BP2, and METTL3) to establish a risk model, and use the LASSO regression coefficient to calculate the risk score. Univariate and multivariate PFS analyses were applied to assess the prognostic value of clinical stage, subtype, clustering, and risk score. Receiver operating characteristic (ROC) curve was constructed to evaluate the prediction accuracy of the prognostic model. The nomogram is further used to integrate risk scores, staging, EB subtype, and differentiation to predict the probability of survival at 1 and 3 years.
In order to further reveal the relationship between risk score and immune infiltration, we first obtained DEGs with |logFC (fold change)| ≥ 1 and adj. p < 0.05, and revealed the immune correlation of DEGs by GO analysis and KEGG analysis. The CIBERSORT (https://cibersort.stanford.edu), an approach to quantify the relative abundance of immune cell types based on specific gene expression profiles, was used to assess the distribution (normalized to 1) of 22 immune cell types in NPC patients from GSE102349. The z-score was used to normalize the proportion of immune cells and then univariate Cox analysis was used to analyze the relationship between different immune cells and PFS.
Fifty-five formalin-fixed, paraffin-embedded NPC tissue specimens and 20 normal nasopharyngeal mucosa (NNM) were collected from Xiangya Hospital of Central South University from December 2011 to January 2013. The patients' clinical stage was classified and reclassified according to the AJCC criteria (28, 29). The patients were newly diagnosed patients without radiotherapy and chemotherapy with an informed consent and were used for immunohistochemical staining. All patients received conventional radiotherapy and chemotherapy and were followed up after treatment. The follow-up period at the time of analysis was 10.33–91.67 months (median, 44.56 ± 17.56). Overall survival (OS) is the date from the first treatment to cancer-related death or, if the patient is alive, the latest examination. Disease-free survival (DFS) is calculated as the time from the completion of the initial radiotherapy to the date of pathological diagnosis or clinical evidence of local failure and/or distant metastasis. This study was approved by the ethics committee of Xiangya hospital, Central South University. The clinical and pathological characteristics of the NPC cases used in this study are shown in Table 1.
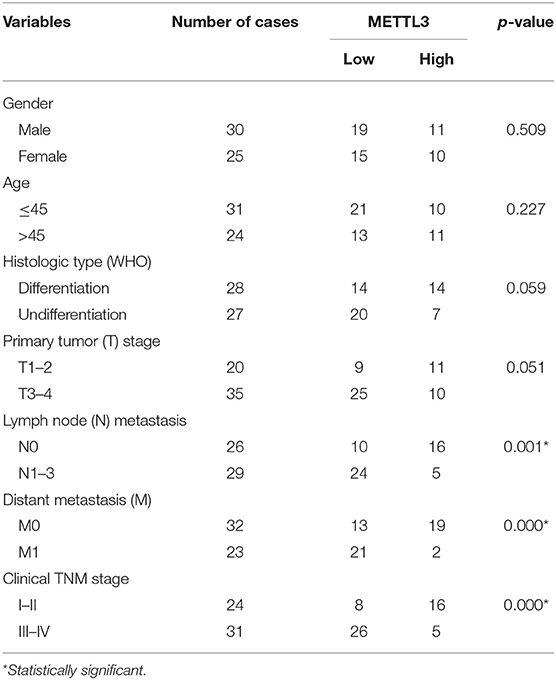
Table 1. Correlation between METTL3 expression and clinicopathological characteristics in nasopharyngeal carcinomas (number = 55, χ2-test).
IHC of formalin-fixed and paraffin-embedded tissue sections according to the universal SP kit (mouse/rabbit streptavidin–biotin detection system, SP-9000, ZSBIO). Briefly, tissue sections were dewaxed and then antigen-repaired, and endogenous peroxidase blockers were added to block endogenous peroxidase activity. After blocking the antigen, the tissue sections were incubated with Anti-METTL3 antibody (ab195352, abcam) at 4°C overnight and then incubated with biotin-labeled goat anti-mouse/rabbit IgG polymer for 15 min at room temperature. Subsequently, horseradish enzyme-labeled streptavidin working solution was added to promote antigen–antibody binding. Finally, staining was performed using DAB Chromogenic Kit (ZLI-9018, ZSBIO) and hematoxylin staining solution (BA-4097, Baso) to detect immunoreactive cells. Two independent pathologists who were unaware of the clinical parameters scored the intensity of staining and the proportion of positive cells. After negotiation, the scores were as follows: Dyeing intensity: 0 for non-staining, 1 (weak) for light yellow, 2 (medium) for brown, and 3 (strong) for tan. The coloration ratio (positive cell ratio) is classified as 0 without coloring, <30% coloring as 1, 30–60% coloring as 2, and >60% coloring as 3. By adding the two scores of staining intensity and coloring ratio (range, 0–6), a score of ≤ 3 is considered as METTL3 low expression, and >3 is considered as METTL3 high expression.
High metastatic 5–8F (6, 30) and well-differentiated HK1 (31) NPC cell lines were established and kindly gifted by Dr. HM Wang of the Cancer Center, Sun Yat-sen University, China. Both cell lines were cultured in RPMI-1640 medium containing 10% FBS at 37°C in 5% CO2.
The total proteins and total RNA were extracted from NPC cells, and then Western blots and RT-PCR were used to detect the protein and mRNA levels of METTL3 in NPC cells as previous described (5, 6, 32).
All data were analyzed statistically using SPSS software package ver20.0 (SPSS, Inc., Chicago, IL, USA) and GraphPad Prism 7.0 (GraphPad Software, La Jolla, CA, USA). p < 0.05 was considered statistically significant.
To reveal the dysregulation of m6A-related in NPC, we downloaded an expression array data (GSE53819, containing 18 NPC tissue and 18 control tissue) and a throughput sequencing data (GSE68799, containing 42 NPC tissue and 4 control tissue) from GEO. The expression levels of m6A-related genes including 10 “writers” (METTL3, METTL5, METTL14, METTL16, KIAA1429, VIRMA, WTAP, RBM15, RBM15B, and ZC3H13), 12 “readers” (YTHDC1, YTHDC2, YTHDF1, YTHDF2, YTHDF3, HNRNPC, FMR1, eIF3, IGF2BP1, IGF2BP2, IGF2BP3, and RBMX), and 2 “erasers” (FTO and ALKBH5) were analyzed. As shown in Figure 1A, four genes (METTL3, RBM15, HNRNPC, and YTHDC2) were downregulated and two genes (IGF2BP2 and YTHDF3) were upregulated in NPC tissue compared to normal tissue in GSE68799. Moreover, two genes (METTL3 and YTHDC1) were downregulated and seven genes (YTHDF1, YTHDF2, METTL5, YTHDF3, IGF2BP2, IGF2BP3, and IGF2BP1) were upregulated in NPC tissue compared to normal tissue in GSE53819. Two upregulated genes (YTHDF3 and IGF2BP2) and a downregulated gene (METTL3) are overlapped in GSE68799 and GSE53819 (Figure 1B). We next analyzed the relationship between the 22 m6A genes' expression and PFS of patients with NPC in GSE102349. The results showed that high expression of IGF2BP1 and low expression of METTL3 and YTHDF3 showed poor PFS in NPC patients (Figures 1C–E and Figure S1).
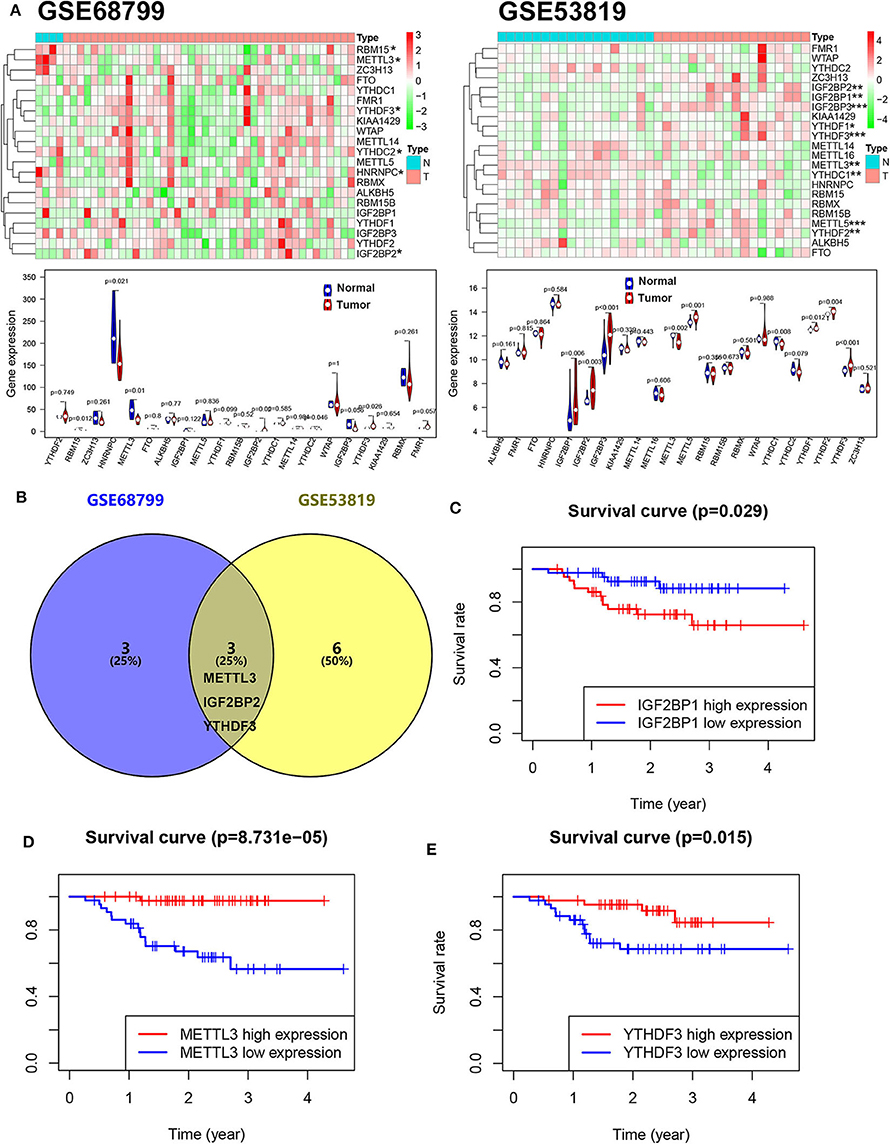
Figure 1. The m6A gene expression is associated with the PFS in NPC. (A) The expression levels of m6A-related genes in GSE53819 and GSE68799. (B) The overlapped differentially expressed m6A genes between GSE53819 and GSE68799. Kaplan–Meier curves of PFS for high- and low-expression IGF2BP1 (C), METTL3 (D), and YTHDF3 (E) in GSE102349.
Next, differentially expressed or prognostic m6A genes (METTL3, YTHDF3, IGF2BP1, and IGF2BP2) were selected for a Consensus Clustering analysis using the Consensus Cluster Plus package, and k = 4 seemed to be the most appropriated selection in the GSE102349 datasets (Figures 2A,B). The PCA results showed that four clusters could be better distinguished (Figure 2C). A significant difference of PFS was observed among four clusters (Figure 2D). Moreover, METTL3 and YTHDF3 were high expression in the cluster 1 subgroup, IGF2BP1 was highly expressed in the cluster 2 and 3 subgroup, and IGF2BP2 was highly expressed in the cluster 3 subgroup. The cluster subgroup is significantly correlated with living state, but not associated with the clinical stage, differentiation, and expression-based subtype (Figure 2E).
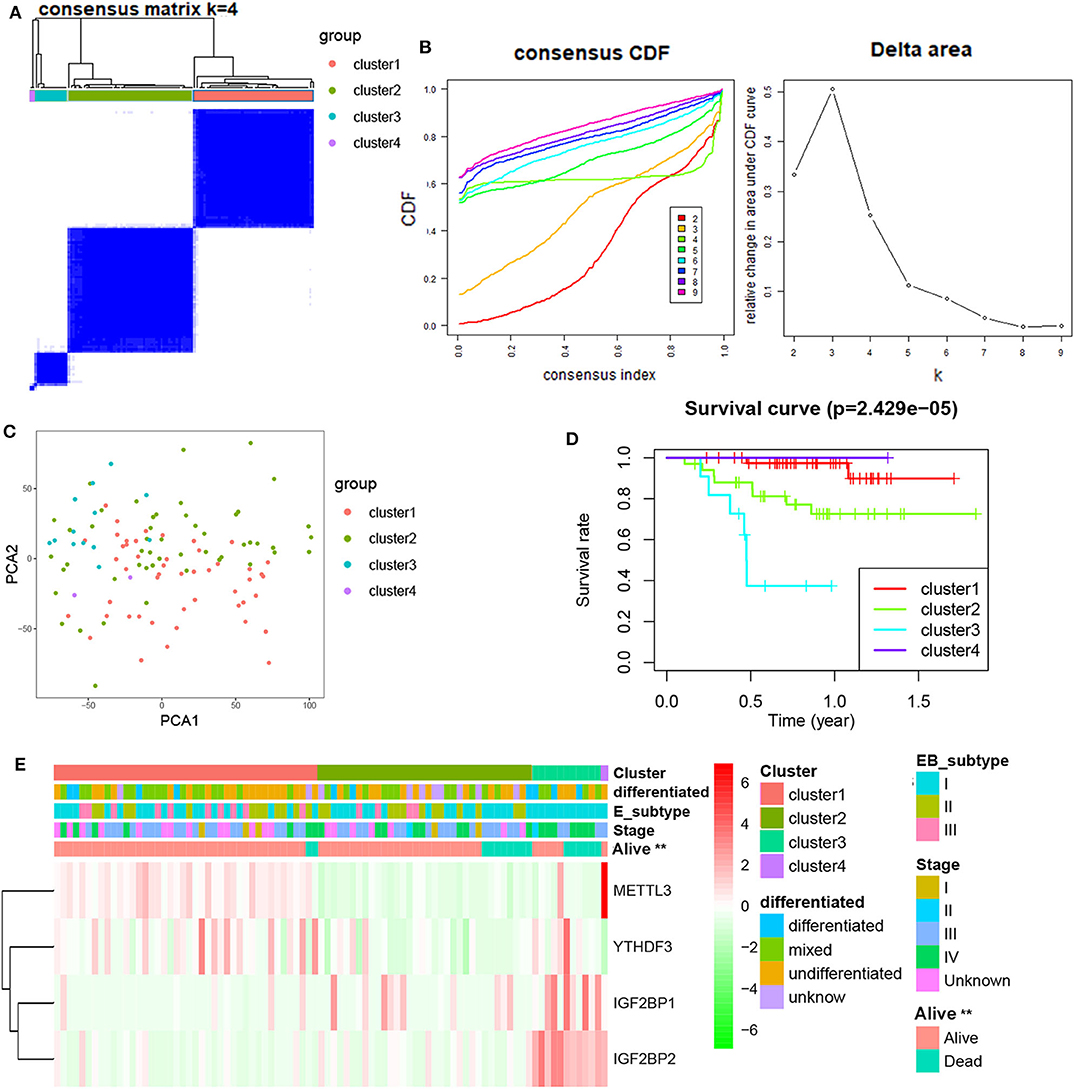
Figure 2. Consensus Clustering of m6A-related genes in NPC. (A) Consensus clustering matrix for k = 4; (B) consensus clustering cumulative distribution function for k = 2–9; (C) PCA analysis of four clusters in NPC; (D) Kaplan–Meier curves of PFS for four clusters in NPC; (E) the heatmap of and clinicopathologic features of four clusters of m6A-related genes.
To develop an m6A-related gene signature for prognosis prediction of NPC, the univariate Cox regression analysis was used to reveal the relationship between four m6A genes (METTL3, YTHDF3, IGF2BP1, and IGF2BP2) and the PFS of NPC patients in the GSE102349 datasets. As shown in Figure 3A, the NPC patients with high expression of IGF2BP1 (HR = 1.307, 95% CI = 1.119–1.526) and IGF2BP2 (HR = 1.061, 95% CI = 1.002–1.124) and low expression of METTL3 (HR = 0.854, 95% CI = 0.726–0.957) have a poor prognosis. Next, based on the minimum criteria, three genes (GF2BP1 + IGF2BP2 + METTL3) were used to build the risk model, and the coefficients were used to calculate the risk score using LASSO regression (Figure 3B). The risk score = IGF2BP1 × 0.161557 + IGF2BP2 × 0.01313 + METTL3 × (−0.0624). The risk score distribution, survival status, and expression profile of the four prognostic MDEGs are shown in Figure 3C. The patients with high risk have a poorer PFS in NPC (Figure 3D).
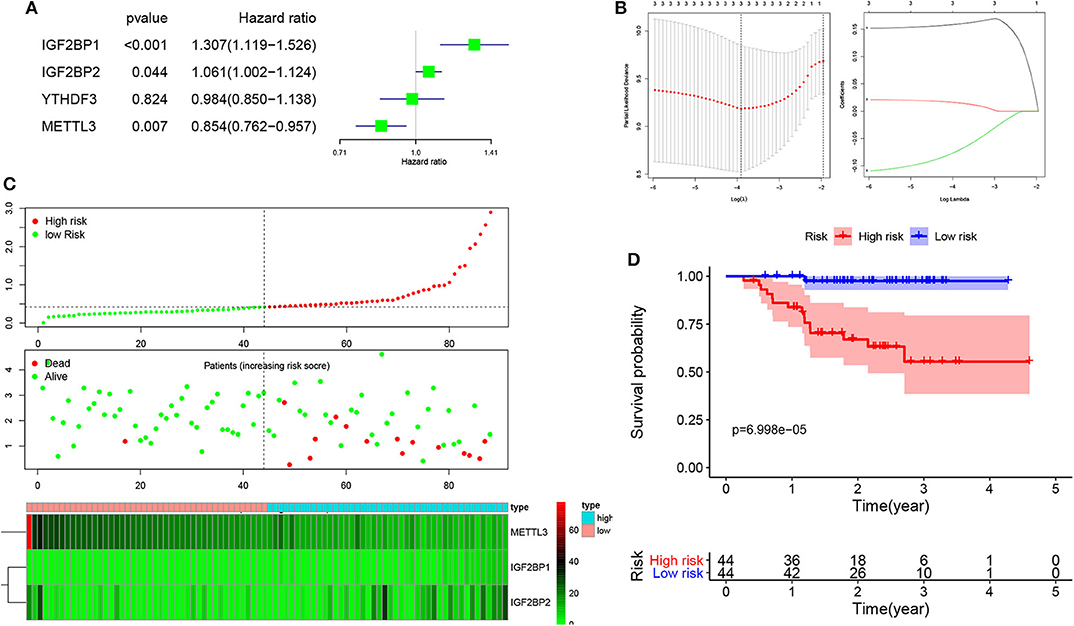
Figure 3. Risk model from three m6A-related genes. (A) Univariate Cox analysis revealed the relationship between four m6A genes and PFS of NPC patients. (B) The risk model calculated by LASSO. (C) The distributions of risk scores, alive/dead status, and expression of three m6A-related genes. (D) Kaplan–Meier PFS curves for patients in high/low risk.
To determine the independent prognostic factor in NPC, univariate, and multivariate PFS analysis were used to evaluate the prognostic value of clinical stage, subtype, cluster, and risk score. The univariate analysis showed that the subtype (p = 0.044, HR = 0.333, 95% CI = 0.155–0.969) and risk score (p < 0.001, HR = 2.718, 95% CI = 1.558–4.741) were significantly correlated with the PFS. The multivariate Cox analysis revealed the risk score (p < 0.001, HR = 2.274, 95% CI = 1.280–4.039), EB subtype (p = 0.014, HR = 0.171, 95% CI = 0.0042–0.701), and differentiation (p = 0.005, HR = 3.013, 95% CI = 1.402–6.479) as the independent prognostic factor (Figure 4A). The relationship between risk score and clinicopathologic factors is also observed in Figure S2. The ROC curve analysis showed that the risk score model had a better efficiency in predicting 1-, 2-, and 3-year OS, with the AUC value being 0.84, 0.81, and 0.77, respectively (Figure 4B). Next, nomogram was used for integrating risk score, stage, EB subtype, and differentiation to predict the probability of survival at 1 and 3 years (Figure 4C). The calibration curves revealed that predictive curves were close to the ideal curve (Figure 4C).
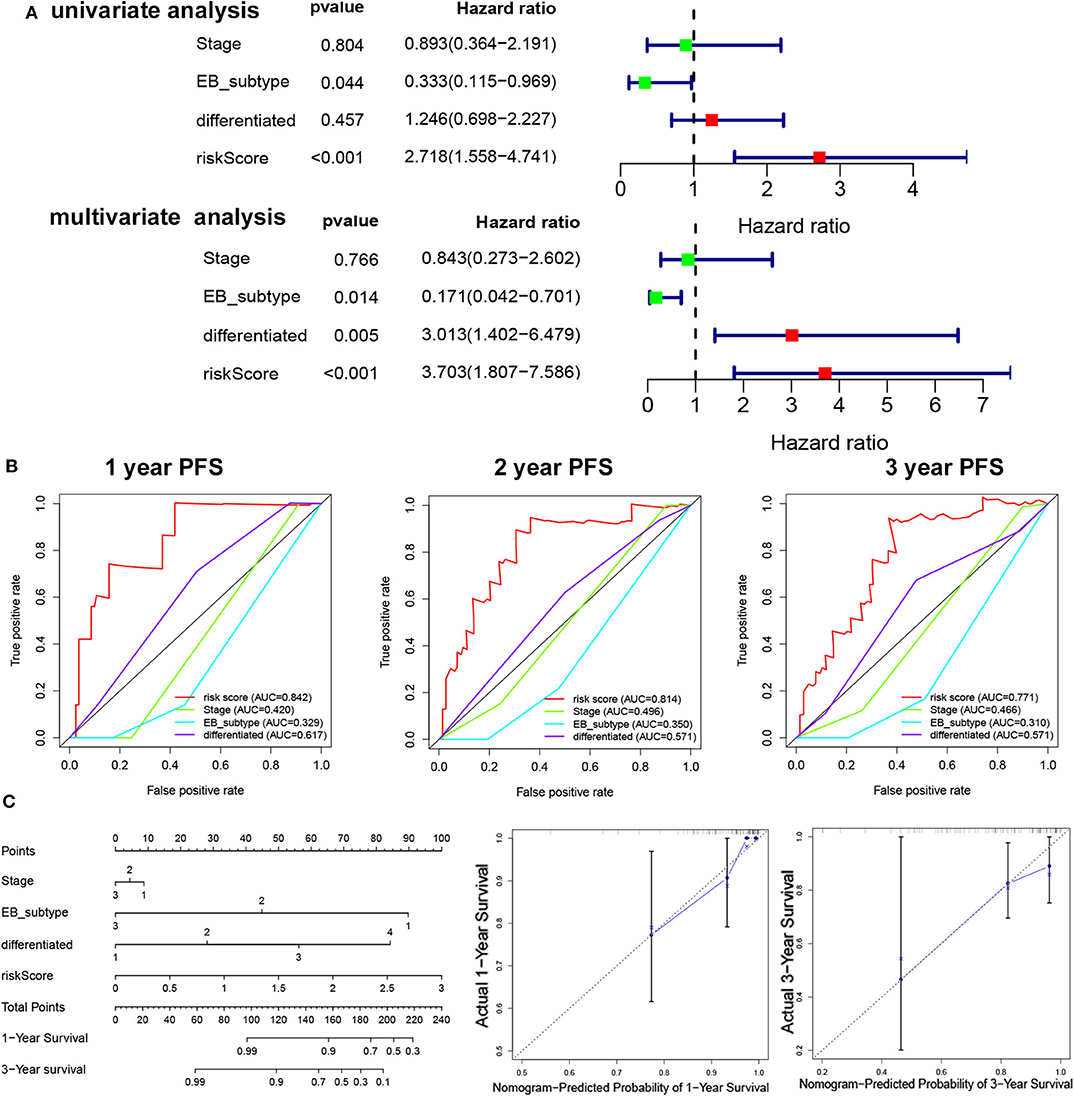
Figure 4. The independent prognostic factor in NPC. (A) Univariate/multivariate COX regression analyses of clinicopathologic factors associated with NPC. (B) The ROC curve of clinicopathologic factors. (C) Establishment of the PFS nomogram for NPC patients.
To reveal the function regulated by high/low risk, we obtained the DEGs with the |logFC (fold change)| ≥ 1 and adj. p < 0.05. There are 72 upregulated DEGs and 47 downregulated DEGs in the high-risk group compared to the low-risk group (Figure 5A). The heatmap of 119 DEGs was visualized in Figure 5B. The GO analysis showed that the DEGs are enriched in immune response including B cell activation, lymphocyte differentiation, B cell proliferation, leukocyte differentiation, leukocyte migration, and so on (Figure 5C). The KEGG analysis showed that the DEGs are enriched in primary immunodeficiency, PI3K-Akt signaling pathway, B cell receptor signaling pathway, and so on (Figure 5D).
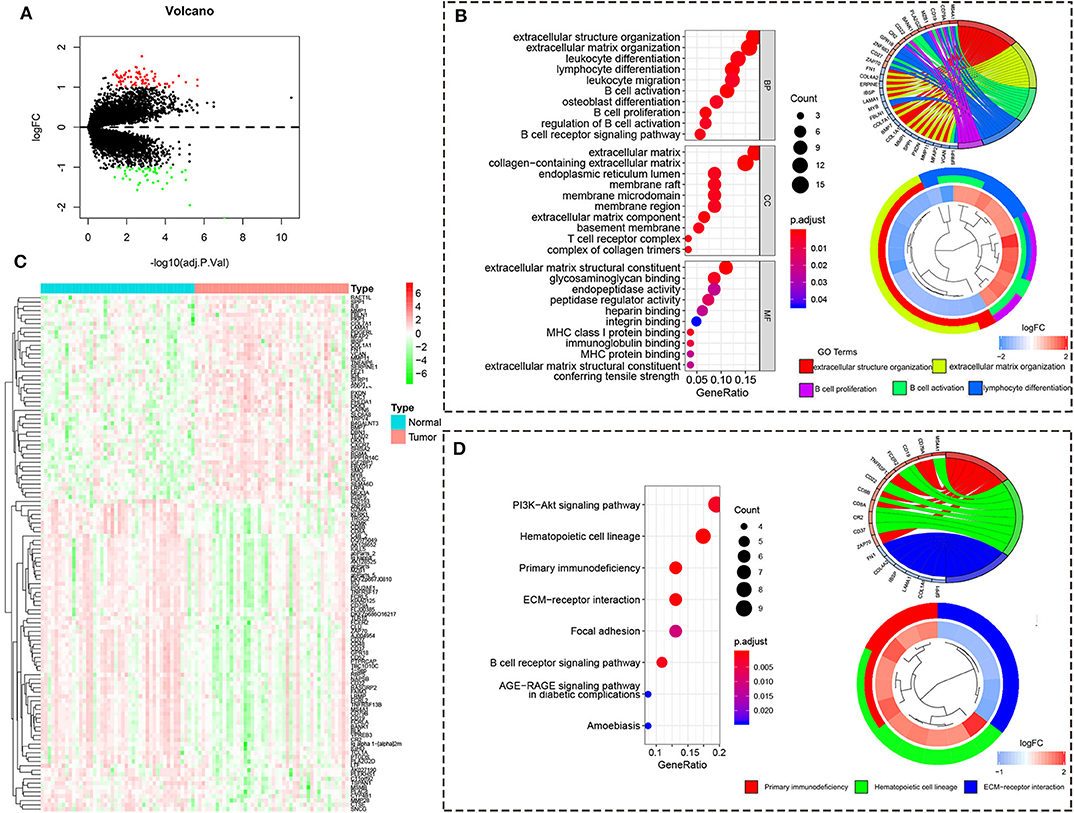
Figure 5. The differentially expressed gene from the high/low-risk group. (A) The volcano map of DEGs from the high/low-risk group. Red means upregulated genes, and blue means downregulated genes. (B) The heatmap of DEGs from the high/low-risk group. (C) The GO analysis of DEGs. (D) The KEGG analysis of DEGs.
To further reveal the relationship between risk score and immune infiltration, the immune cells in NPC patients were estimated using the CIBERSORT method. The proportion of immune cells in NPC patients were observed in Figure S3. The proportion of immune cells were normalized using z-score, and then univariable Cox analysis was used for the relationship between immune cells and PFS. We found that NK-activated cell (p = 0.027, HR = 1.7, 95% CI = 1.06–2.73) and Macrophages M0 (p = 0.046, HR = 1.7, 95% CI = 1.01–2.89) were significantly correlated with the PFS (Figure 6A). The infiltration of immune cells (B naïve cells, B memory cells, CD8 T, CD4 memory T activated, T gamma delta, Mast cells resting, and activated Mast cells) was significantly increased and the infiltration of immune cells (CD4 memory T resting, Macrophages M0, and Macrophages M2) was significantly decreased in the high risk score group compared to low risk score group (Figure 6B). Moreover, correction analysis showed that METTL3 expression was correlated with infiltration of various immune cells, including B naïve cells, B memory cells, CD8 T cells, Macrophages M0, activated Mast cell, and resting CD4 memory T cell (p < 0.05; Figure S4).
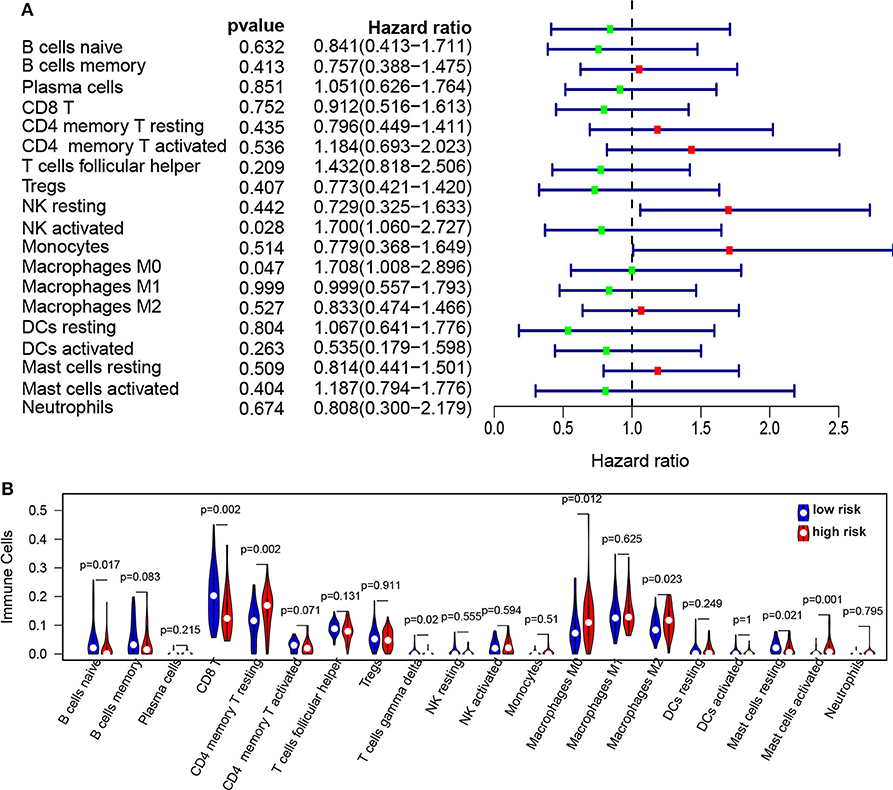
Figure 6. The infiltration of immune cells in the high/low-risk groups in NPC. (A) Forest plots revealed the relationship between immune infiltration and PFS in NPC. (B) The immune cell infiltration in high-risk groups compared to low-risk groups.
Given the key role of METTL3 in the m6A modification process and potential role of METTL3 in NPC (Figure S5). We detected the expression of METTL3 in NPC tissue using IHC. Compared with the NNM tissue, METTL3 expression was downregulated in NPC tissues (p < 0.01), and METTL3 expression was lower in metastatic NPC tissues than in non-metastatic NPC tissues (p < 0.01), indicating that METTL3 expression is downregulated during the occurrence and metastasis of NPC (Figure 7A, Figure S6, and Table 2). The analysis of the correlation between METTL3 expression level and clinical pathological characteristics of NPC showed that METTL3 expression level was negatively correlated with TNM stage (p = 0.000) and metastasis (p = 0.000; Table 1). K–M analysis showed that METTL3 expression level was negatively correlated with the OS (p = 0.001) and DFS of NPC patients (p < 0.05; Figure 7B). Subsequently, univariate and multivariate OS analysis evaluated the prognostic value of age, gender, differentiation, TNM stage, and METTL3. The univariate analysis showed that the differentiation (p = 0.012, HR = 4.134, 95% CI = 1.369–12.488), TNM stage (p = 0.004, HR = 6.228, 95% CI = 1.766–21.957), and METTL3 (p = 0.048, HR = 0.358, 95% CI = 0.129–0.990) were significantly correlated with the OS. The multivariate Cox analysis revealed the differentiation (p = 0.002, HR = 7.942, 95% CI = 2.165–29.127), TNM stage (p = 0.047, HR = 3.956, 95% CI = 1.018–15.372), and METTL3 (p = 0.042, HR = 0.255, 95% CI = 0.068–0.950) as the independent prognostic factor (Figure 7C). The ROC curve analysis showed that METTL3 showed a better efficiency in predicting 1-, 2-, and 3-year OS, with the AUC value being 0.306, 0.302, and 0.344, respectively (Figure 7D). The above results indicate that low METTL3 expression is associated with poor prognosis of NPC.
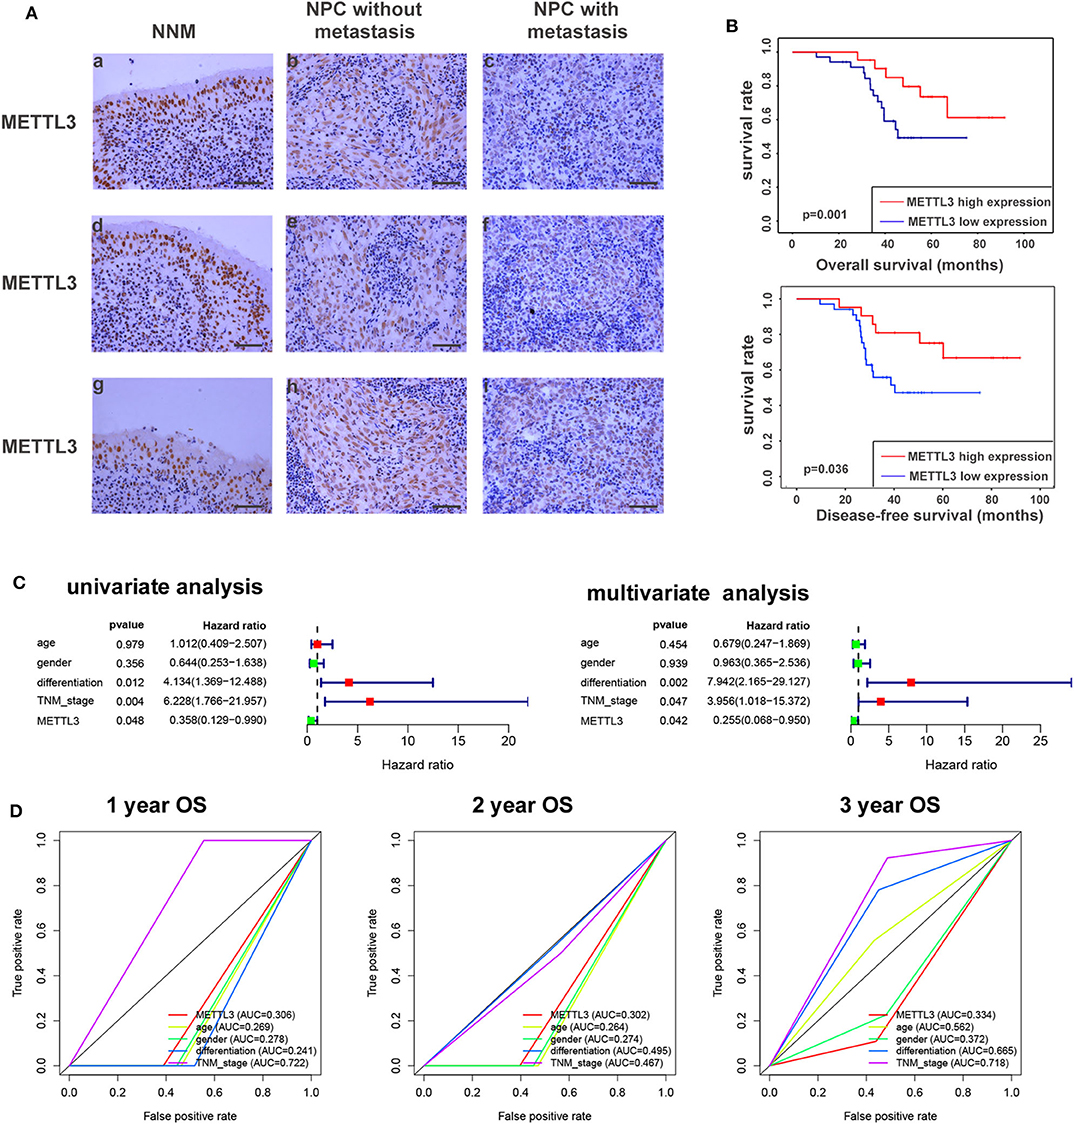
Figure 7. METTL3 expression in nasopharyngeal carcinoma tissue. (A) Immunohistochemistry showed the expression level of METTL3 in NNM (A,D,G), non-metastatic NPCs (B,E,H), and metastatic NPCs (C,F,I). The figure shows three replicate results. (B) Kaplan–Meier OS curves (up) and DFS curves (below) for patients in METTL3 high/low expression. (C) Univariate/multivariate COX regression analyses of clinicopathologic factors associated with NPC. (D) The ROC curve of clinicopathologic factors.
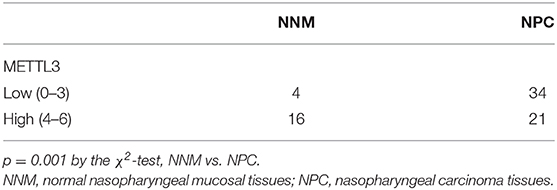
Table 2. The expression of METTL3 in the normal nasopharyngeal mucosa and nasopharygeal carcinoma tissues.
NPC is one of the head and neck malignancies with geographical distribution. Previous studies have shown that the progression of NPC is regulated by epitranscriptomics (33, 34). m6A is the most common and plentiful modification in post-transcriptional modification of RNA, but so far, little is known about the role of m6A in NPC. Based on the genomic analysis dataset (GSE68799, GSE53819, and GSE102349), YTHDF3, IGF2BP2, and METTL3 were dysregulated in NPC. Subsequently, prognostic analysis showed that IGF2BP1 correlate inversely and METTL3 and YTHDF3 correlate positively with poor PFS in NPC patients. Consensus Clustering analysis revealed four subgroups with significant differences for PFS. Subsequently, the risk signature using three genes (GF2BP1 + IGF2BP2 + METTL3) was shown to be an independent prognostic marker of NPC.
Accumulating studies showed that the tumor immune microenvironment plays a vital role in the progression and prognosis of various cancers (35). NPC is characterized as a highly immunogenic tumor characterized by high rates of tumor-infiltrating lymphocytes (TILs) (36, 37). Programmed death ligand 1 (PD-L1) expression was also reported to be correlated with poor outcomes of NPC (38, 39). Targeting the immune checkpoint pathway was an immunotherapeutic strategy for NPC (40). In this study, GO and KEGG analysis revealed that the risk model was significantly associated with immune-related signal pathway. The infiltration of immune cells (B naïve cells, B memory cells, CD8 T, CD4 memory T activated, T gamma delta, Mast cells resting, and activated Mast cells) was significantly increased and the infiltration of immune cells (CD4 memory T resting, Macrophages M0, and Macrophages M2) was significantly decreased in the high risk score group compared to the low risk score group. These results indicated that m6A genes are involved in NPC progression partly via regulating immune microenvironment.
Our risk signature proves that METTL3 is low-expressed in NPC, negatively correlated with OS, and related to the infiltration of various immune cells. METTL3 is one of the most important m6A methyltransferases (41), and its abnormal expression can change the fate of m6A transcripts, thereby affecting the proliferation, differentiation, and metastasis of various tumor cells. METTL3 was reported to be overexpressed in glioblastoma (42, 43), and with METTL3 as a tumor suppressor, overexpression of METTL3 can inhibit the growth and self-renewal of glioblastoma stem cells (GCS) (21). At present, the relationship between METTL3 and NPC is unclear. Although Zhang et al. (44) concluded that METTL3 is highly expressed in NPC, they detected the METTL3 expression in head and neck squamous cell carcinoma (HNSC) from the Cancer Genome Atlas (TCGA) data set incorrectly, and used quantitative RT-PCR technology to prove that METTL3 mRNA was highly expressed in NPC cell lines. There are no data to prove the protein levels of METTL3 in NPC tissue and cells. Our study found that in the genomic analysis datasets (GSE68799, GSE53819, and GSE102349), METTL3 was low-expressed in NPC and correlated with the prognosis of NPC patients. Immunohistochemical analysis revealed that METTL3 protein was low-expressed in NPC tissues. Meanwhile, we also detected the expression level of METTL3 in metastatic and non-metastatic NPC tissues. The mRNA and protein levels of METTL3 were also detected in high metastatic 5–8F cells and well-differentiated HK1 cells (Figure S7). The protein levels of METTL3 were higher in HK1 cells than 5–8F cells. No difference of METTL3 mRNA was observed between HK1 cells than 5–8F cells. The results showed that METTL3 expression was negatively correlated with metastasis. Survival analysis showed significant differences in survival between patients with low and high METTL3 expression, showing a negative correlation. These results indicate that METTL3 is a risk factor for NPC metastasis and m6A mRNA methylation machinery may be as a promising therapeutic target for NPC (21).
Moreover, we found that IGF2BP1 and YTHDF3 (two readers of the m6A modification) have inverse correlation with patients' survival rate in CHOL. A recent study showed that IGF2BP1 strengthens m6A recognition on RNAs, such as c-Myc mRNA, to increase the mRNA stability and expression of c-Myc, thereby promoting tumorigenesis (45). So, we speculated that IGF2BP1 may affect the progression of CHOL via increasing the mRNA stability of some oncogene genes. Zheng et al. (46) showed that YTHDF3 as an m1A reader decreased invasion and migration of trophoblast by inhibiting IGF1R expression. IGF1R was also reported as an oncogene in cancers (47). So, we speculated that YTHDF3 may regulate the expression of some oncogenes in CHOL. However, these speculations need to be confirmed by further experiments.
In summary, our study has demonstrated dysregulation, prognosis, and potential function of m6A gene in NPC, and verified the low expression and clinical significance of METTL3 in NPC using immunohistochemical techniques. Our results indicate m6A genes as a promising prognostic biomarker for NPC and provide novels insight for NPC therapeutic strategies.
Publicly available datasets were analyzed in this study. This data can be found here: The raw data and corresponding clinical information were downloaded from Gene Expression Omnibus Database (GEO; https://www.ncbi.nlm.nih.gov/geo/). The expression array data (GSE53819) containing 18 NPC tissue and 18 control tissue and the throughput sequencing data (GSE68799) containing 42 NPC tissue and 4 control tissue and the GSE102349 dataset containing 113 NPC tissue were used for subsequent analysis.
The studies involving human participants were reviewed and approved by the ethics committee of Xiangya School of Medicine, Central South University. The patients/participants provided their written informed consent to participate in this study.
SL and YZ conceived and designed the experiments. SL and ZY performed the experiments. ZX, SL, and ZY analyzed the data. YZ prepared the figures and/or tables.
The present study was supported by the National Natural Science Foundation of China (grant nos. 81703149, 81672687, and 81472801).
The authors declare that the research was conducted in the absence of any commercial or financial relationships that could be construed as a potential conflict of interest.
The Supplementary Material for this article can be found online at: https://www.frontiersin.org/articles/10.3389/fonc.2020.00875/full#supplementary-material
1. Li J-Y, Xiao T, Yi H-M, Yi H, Feng J, Zhu J-F, et al. S897 phosphorylation of EphA2 is indispensable for EphA2-dependent nasopharyngeal carcinoma cell invasion, metastasis and stem properties. Cancer Lett. (2019) 444:162–74. doi: 10.1016/j.canlet.2018.12.011
2. Zhu J-F, Huang W, Yi H-M, Xiao T, Li J-Y, Feng J, et al. Annexin A1-suppressed autophagy promotes nasopharyngeal carcinoma cell invasion and metastasis by PI3K/AKT signaling activation. Cell Death Dis. (2018) 9:1154. doi: 10.1038/s41419-018-1204-7
3. Xiao L, Xiao T, Wang Z-M, Cho WC, Xiao Z-Q. Biomarker discovery of nasopharyngeal carcinoma by proteomics. Expert Rev Proteomics. (2014) 11:215–225. doi: 10.1586/14789450.2014.897613
4. Zeng G-Q, Cheng A-L, Tang J, Li G-Q, Li M-X, Qu J-Q, et al. Annexin A1: a new biomarker for predicting nasopharyngeal carcinoma response to radiotherapy. Medical Hypotheses. (2013) 81:68–70. doi: 10.1016/j.mehy.2013.04.019
5. Feng X-P, Yi H, Li M-Y, Li X-H, Yi B, Zhang P-F, et al. Identification of biomarkers for predicting nasopharyngeal carcinoma response to radiotherapy by proteomics. Cancer Res. (2010) 70:3450–62. doi: 10.1158/0008-5472.CAN-09-4099
6. He Q-Y, Yi H-M, Yi H, Xiao T, Qu J-Q, Yuan L, et al. Reduction of RKIP expression promotes nasopharyngeal carcinoma invasion and metastasis by activating Stat3 signaling. Oncotarget. (2015) 6:16422–36. doi: 10.18632/oncotarget.3847
7. Zeng G-Q, Yi H, Li X-H, Shi H-Y, Li C, Li M-Y, et al. Identification of the proteins related to p53-mediated radioresponse in nasopharyngeal carcinoma by proteomic analysis. J Proteomics. (2011) 74:2723–33. doi: 10.1016/j.jprot.2011.02.012
8. Zheng Z. MiR-125b regulates proliferation and apoptosis of nasopharyngeal carcinoma by targeting A20/NF-κB signaling pathway. Cell Death Dis. (2017) 8:e2855. doi: 10.1038/cddis.2017.211
9. Lee AWM, Lin JC, Ng WT. Current management of nasopharyngeal cancer. Semin Radiat Oncol. (2012) 22:233–44. doi: 10.1016/j.semradonc.2012.03.008
10. Lee AWM, Ma BBY, Ng WT, Chan ATC. Management of nasopharyngeal carcinoma: current practice and future perspective. J Clin Oncol. (2015) 33:3356–64. doi: 10.1200/JCO.2015.60.9347
11. Huisman B, Manske G, Carney S, Kalantry S. Functional dissection of the m6A RNA modification. Trends Biochem Sci. (2017) 42:85–6. doi: 10.1016/j.tibs.2016.12.004
12. Zhang C, Fu J, Zhou Y. A review in research progress concerning m6A methylation and immunoregulation. Front Immunol. (2019) 10:922. doi: 10.3389/fimmu.2019.00922
13. Meyer KD, Saletore Y, Zumbo P, Elemento O, Mason CE, Jaffrey SR. Comprehensive analysis of mRNA methylation reveals enrichment in 3' UTRs and near stop codons. Cell. (2012) 149:1635–46. doi: 10.1016/j.cell.2012.05.003
14. Niu Y, Zhao X, Wu Y-S, Li M-M, Wang X-J, Yang Y-G. N6-methyl-adenosine (m6A) in RNA: an old modification with a novel epigenetic function. Genomics Proteomics Bioinform. (2013) 11:8–17. doi: 10.1016/j.gpb.2012.12.002
15. Ye F. RNA N6-adenosine methylation (m6A) steers epitranscriptomic control of herpesvirus replication. Inflamm Cell Signal. (2017) 4:e1604. doi: 10.14800/ics.1604
16. Meyer KD, Jaffrey SR. Rethinking m6A readers, writers, and erasers. Annu Rev Cell Dev Biol. (2017) 33:319–42. doi: 10.1146/annurev-cellbio-100616-060758
17. Zaccara S, Ries RJ, Jaffrey SR. Reading, writing and erasing mRNA methylation. Nat Rev Mol Cell Biol. (2019) 20:608–24. doi: 10.1038/s41580-019-0168-5
18. Zhao X, Cui L. Development and validation of a m6A RNA methylation regulators-based signature for predicting the prognosis of head and neck squamous cell carcinoma. Am J Cancer Res. (2019) 9:2156–69.
19. Liu L, Liu X, Dong Z, Li J, Yu Y, Chen X, et al. N6-methyladenosine-related genomic targets are altered in breast cancer tissue and associated with poor survival. J Cancer. (2019) 10:5447–59. doi: 10.7150/jca.35053
20. Li Y, Xiao J, Bai J, Tian Y, Qu Y, Chen X, et al. Molecular characterization and clinical relevance of m6A regulators across 33 cancer types. Mol Cancer. (2019) 18:137. doi: 10.1186/s12943-019-1066-3
21. Cui Q, Shi H, Ye P, Li L, Qu Q, Sun G, et al. m6A RNA methylation regulates the self-renewal and tumorigenesis of glioblastoma stem cells. Cell Rep. (2017) 18:2622–34. doi: 10.1016/j.celrep.2017.02.059
22. Cai X, Wang X, Cao C, Gao Y, Zhang S, Yang Z, et al. HBXIP-elevated methyltransferase METTL3 promotes the progression of breast cancer via inhibiting tumor suppressor let-7g. Cancer Lett. (2018) 415:11–9. doi: 10.1016/j.canlet.2017.11.018
23. Li Q, Li X, Tang H, Jiang B, Dou Y, Gorospe M, et al. NSUN2-mediated m5C methylation and METTL3/METTL14-mediated m6A methylation cooperatively enhance p21 translation. J Cell Biochem. (2017) 118:2587–98. doi: 10.1002/jcb.25957
24. Wang S, Sun C, Li J, Zhang E, Ma Z, Xu W, et al. Roles of RNA methylation by means of N6-methyladenosine (m6A) in human cancers. Cancer Lett. (2017) 408:112–20. doi: 10.1016/j.canlet.2017.08.030
25. Pan Y, Ma P, Liu Y, Li W, Shu Y. Multiple functions of m6A RNA methylation in cancer. J Hematol Oncol. (2018) 11:48. doi: 10.1186/s13045-018-0590-8
26. Chen B, Li Y, Song R, Xue C, Xu F. Functions of RNA N6-methyladenosine modification in cancer progression. Mol Biol Rep. (2019) 46:1383–91. doi: 10.1007/s11033-018-4471-6
27. Du H, Zhao Y, He J, Zhang Y, Xi H, Liu M, et al. YTHDF2 destabilizes m6A-containing RNA through direct recruitment of the CCR4-NOT deadenylase complex. Nat Commun. (2016) 7:12626. doi: 10.1038/ncomms12626
28. Shanmugaratnam K, Sobin LH. The World Health Organization histological classification of tumours of the upper respiratory tract and ear. A commentary on the second edition. Cancer. (1993) 71:2689–97. doi: 10.1002/1097-0142(19930415)71:8<2689::AID-CNCR2820710843>3.0.CO;2-H
29. Pan J, Xu Y, Qiu S, Zong J, Guo Q, Zhang Y, et al. A comparison between the Chinese 2008 and the 7th edition AJCC staging systems for nasopharyngeal carcinoma. Am J Clin Oncol. (2015) 38:189–96. doi: 10.1097/COC.0b013e31828f5c96
30. Yang X-Y, Ren C-P, Wang L, Li H, Jiang C-J, Zhang H-B, et al. Identification of differentially expressed genes in metastatic and non-metastatic nasopharyngeal carcinoma cells by suppression subtractive hybridization. Cell Oncol. (2005) 27:215–23. doi: 10.1155/2005/108490
31. Huang DP, Ho JHC, Poon YF, Chew EC, Saw D, Lui M, et al. Establishment of a cell line (NPC/HK1) from a differentiated squamous carcinoma of the nasopharynx. Int J Cancer. (1980) 26:127–32. doi: 10.1002/ijc.2910260202
32. Qu J-Q, Yi H-M, Ye X, Zhu J-F, Yi H, Li L-N, et al. MiRNA-203 reduces nasopharyngeal carcinoma radioresistance by targeting IL8/AKT signaling. Mol Cancer Ther. (2015) 14:2653–64. doi: 10.1158/1535-7163.MCT-15-0461
33. Li L-L, Shu X-S, Wang Z-H, Cao Y, Tao Q. Epigenetic disruption of cell signaling in nasopharyngeal carcinoma. Chin J Cancer. (2011) 30:231–9. doi: 10.5732/cjc.011.10080
34. Kwong J, Lo K-W, To K-F, Teo PML, Johnson PJ, Huang DP. Promoter hypermethylation of multiple genes in nasopharyngeal carcinoma. Clin Cancer Res. (2002) 8:131–7.
35. Zhao X, Liu J, Liu S, Yang F, Chen E. Construction and validation of an immune-related prognostic model based on TP53 status in colorectal cancer. Cancers (Basel). (2019) 11:1722. doi: 10.3390/cancers11111722
36. Pai S, O'Sullivan B, Abdul-Jabbar I, Peng J, Connoly G, Khanna R, et al. Nasopharyngeal carcinoma-associated Epstein-Barr virus-encoded oncogene latent membrane protein 1 potentiates regulatory T-cell function. Immunol Cell Biol. (2007) 85:370–7. doi: 10.1038/sj.icb.7100046
37. Saeed MEM, Mertens R, Handgretinger R, Efferth T. Identification of fatal outcome in a childhood nasopharyngeal carcinoma patient by protein expression profiling. Int J Oncol. (2018) 53:1721–31. doi: 10.3892/ijo.2018.4491
38. Minichsdorfer C, Oberndorfer F, Krall C, Kornek G, Müllauer L, Wagner C, et al. PD-L1 expression on tumor cells is associated with a poor outcome in a cohort of caucasian nasopharyngeal carcinoma patients. Front Oncol. (2019) 9:1334. doi: 10.3389/fonc.2019.01334
39. Larbcharoensub N, Mahaprom K, Jiarpinitnun C, Trachu N, Tubthong N, Pattaranutaporn P, et al. Characterization of PD-L1 and PD-1 expression and CD8+ tumor-infiltrating lymphocyte in Epstein-Barr virus-associated nasopharyngeal carcinoma. Am J Clin Oncol. (2018) 41:1204–10. doi: 10.1097/COC.0000000000000449
40. Chow JC, Ngan RK, Cheung KM, Cho WC. Immunotherapeutic approaches in nasopharyngeal carcinoma. Expert Opin Biol Ther. (2019) 19:1165–72. doi: 10.1080/14712598.2019.1650910
41. Barbieri I, Tzelepis K, Pandolfini L, Shi J, Millán-Zambrano G, Robson SC, et al. Promoter-bound METTL3 maintains myeloid leukaemia by m6A-dependent translation control. Nature. (2017) 552:126–31. doi: 10.1038/nature24678
42. Visvanathan A, Patil V, Arora A, Hegde AS, Arivazhagan A, Santosh V, et al. Essential role of METTL3-mediated m6A modification in glioma stem-like cells maintenance and radioresistance. Oncogene. (2018) 37:522–33. doi: 10.1038/onc.2017.351
43. Hua W, Zhao Y, Jin X, Yu D, He J, Xie D, et al. METTL3 promotes ovarian carcinoma growth and invasion through the regulation of AXL translation and epithelial to mesenchymal transition. Gynecol Oncol. (2018) 151:356–65. doi: 10.1016/j.ygyno.2018.09.015
44. Zhang P, He Q, Lei Y, Li Y, Wen X, Hong M, et al. m6A-mediated ZNF750 repression facilitates nasopharyngeal carcinoma progression. Cell Death Dis. (2018) 9:1169. doi: 10.1038/s41419-018-1224-3
45. Zhu S, Wang J-Z, Chen D, He Y-T, Meng N, Chen M, et al. An oncopeptide regulates m6A recognition by the m6A reader IGF2BP1 and tumorigenesis. Nat Commun. (2020) 11:1685. doi: 10.1038/s41467-020-15403-9
46. Zheng Q, Gan H, Yang F, Yao Y, Hao F, Hong L, et al. Cytoplasmic m1A reader YTHDF3 inhibits trophoblast invasion by downregulation of m1A-methylated IGF1R. Cell Dis. (2020) 6:12. doi: 10.1038/s41421-020-0144-4
Keywords: nasopharyngeal carcinoma, prognostic factors, m6A, METTL3, immune infiltration
Citation: Lu S, Yu Z, Xiao Z and Zhang Y (2020) Gene Signatures and Prognostic Values of m6A Genes in Nasopharyngeal Carcinoma. Front. Oncol. 10:875. doi: 10.3389/fonc.2020.00875
Received: 23 January 2020; Accepted: 04 May 2020;
Published: 11 June 2020.
Edited by:
Erica Golemis, Fox Chase Cancer Center, United StatesReviewed by:
Bojan Bujisic, Massachusetts General Hospital and Harvard Medical School, United StatesCopyright © 2020 Lu, Yu, Xiao and Zhang. This is an open-access article distributed under the terms of the Creative Commons Attribution License (CC BY). The use, distribution or reproduction in other forums is permitted, provided the original author(s) and the copyright owner(s) are credited and that the original publication in this journal is cited, in accordance with accepted academic practice. No use, distribution or reproduction is permitted which does not comply with these terms.
*Correspondence: Yiya Zhang, eWl5YTAxMDhAY3N1LmVkdS5jbg==
Disclaimer: All claims expressed in this article are solely those of the authors and do not necessarily represent those of their affiliated organizations, or those of the publisher, the editors and the reviewers. Any product that may be evaluated in this article or claim that may be made by its manufacturer is not guaranteed or endorsed by the publisher.
Research integrity at Frontiers

Learn more about the work of our research integrity team to safeguard the quality of each article we publish.