 Hesong Shen1,2†
 Yu Wang1,2†
 Daihong Liu1,2Rongfei Lv3Yuanying Huang4Chao Peng3Shixi Jiang1Ying Wang5Yongpeng He6Xiaosong Lan1
 Hong Huang3Jianqing Sun7
 Jiuquan Zhang1,2*
- 1Department of Radiology, Chongqing University Cancer Hospital and Chongqing Cancer Institute and Chongqing Cancer Hospital, Chongqing, China
- 2Key Laboratory for Biorheological Science and Technology of Ministry of Education (Chongqing University), Chongqing University Cancer Hospital and Chongqing Cancer Institute and Chongqing Cancer Hospital, Chongqing, China
- 3Key Laboratory of Optoelectronic Technology and Systems of the Education Ministry of China, Chongqing University, Chongqing, China
- 4Department of Oncology and Hematology, Chongqing General Hospital, Chongqing, China
- 5Department of Radiotherapy, Chongqing University Cancer Hospital and Chongqing Cancer Institute and Chongqing Cancer Hospital, Chongqing, China
- 6Chongqing Key Laboratory of Translational Research for Cancer Metastasis and Individualized Treatment, Chongqing University Cancer Hospital and Chongqing Cancer Institute and Chongqing Cancer Hospital, Chongqing, China
- 7Clinical Science, Philips Healthcare, Shanghai, China
Objectives: This study aimed to explore the predictive value of MRI-based radiomic model for progression-free survival (PFS) in nonmetastatic nasopharyngeal carcinoma (NPC).
Methods: A total of 327 nonmetastatic NPC patients [training cohort (n = 230) and validation cohort (n = 97)] were enrolled. The clinical and MRI data were collected. The least absolute shrinkage selection operator (LASSO) and recursive feature elimination (RFE) were used to select radiomic features. Five models [Model 1: clinical data, Model 2: overall stage, Model 3: radiomics, Model 4: radiomics + overall stage, Model 5: radiomics + overall stage + Epstein–Barr virus (EBV) DNA] were constructed. The prognostic performances of these models were evaluated by Harrell's concordance index (C-index). The Kaplan–Meier method was applied for the survival analysis.
Results: Model 5 incorporating radiomics, overall stage, and EBV DNA yielded the highest C-indices for predicting PFS in comparison with Model 1, Model 2, Model 3, and Model 4 (training cohorts: 0.805 vs. 0.766 vs. 0.749 vs. 0.641 vs. 0.563, validation cohorts: 0.874 vs. 0.839 vs. 836 vs. 0.689 vs. 0.456). The survival curve showed that the high-risk group yielded a lower PFS than the low-risk group.
Conclusions: The model incorporating radiomics, overall stage, and EBV DNA showed better performance for predicting PFS in nonmetastatic NPC patients.
Introduction
Nasopharyngeal carcinoma (NPC) has obvious geographical distribution characteristics, especially in the south of China (1). Unfortunately, only 72.9% of patients with locoregionally advanced NPC have a 2-year progression-free survival (PFS) (2). Therefore, it is very important to improve the outcome of those patients. Individualized treatment based on precise stratification of PFS can improve the prognosis of NPC patients. This has led to a search for PFS prognostic factors, including clinical and image biomarkers.
To date, the American Joint Committee on Cancer/Union for International Cancer Control TNM staging system has been widely used to predict PFS for patients with NPC. Only the anatomy information including tumor size, lymph node status, and metastasis status were reflected by the TNM staging system (3). However, the latest eighth edition failed to accurately differentiate the PFS of stage II and III NPCs (4).
Plasma Epstein–Barr virus (EBV) DNA before treatment reflected the spread of tumor, and it has been used as a prognostic marker for PFS in patients with NPC (5–7). However, the accuracy of plasma EBV DNA is affected by a number of factors including DNA extraction, purification and stabilization methods, instruments, primers, and probes (8, 9).
Radiomics characterizes tissue heterogeneity by extracting and analyzing a large number of advanced CT, MRI, and PET imaging features (10). The radiomic features extracted from medical images can be used to predict the prognosis of tumors (11–14). In terms of NPC, a recent study showed that MR radiomics can significantly improve the efficacy of traditional TNM staging and clinical data in predicting PFS of patients with advanced NPC (15). Since the NPC is an EBV-related disease, the EBV DNA status is also taken into consideration in a study to develop multidimensional nomogram for predicting PFS in patients with advanced NPC (2). These studies indicated that MRI-based radiomic features and clinical characteristics may be valuable factors for predicting the PFS in advanced NPC patients. However, the MRI-based radiomic features including low-stage NPC patients for predicting the PFS were unknown.
Therefore, in the present study, we developed and validated MRI-based radiomics for predicting PFS in nonmetastatic NPC (stages I–IVA). In addition, we explored the predictive performance of the MRI-based radiomics in patients with different pretreatment EBV DNA levels.
Materials and Methods
Patients
Ethical approval and written informed consent were obtained for this retrospective study.
A total of 327 consecutive nonmetastatic NPC patients at our institute were enrolled between June 2013 and June 2017. The inclusion criteria were as follows: (a) pathologically confirmed NPC; (b) no treatments before registration; (c) no MR examination contraindications; (d) no distant metastasis; (e) no other primary tumor; and (f) complete clinical and MRI data.
All patients (n = 327) were randomly assigned to a training cohort (n = 230) and a validation cohort (n = 97). The demographic and clinical data (age, sex, hemoglobin level, and platelet count) were collected. Tumor was restaged according to the 8th Edition American Joint Committee on Cancer TNM Staging System.
In general, patients with stage I tumors were treated with curative radiotherapy (RT) alone, while those with stage II–IVA tumors were treated with radical concurrent chemoradiotherapy (CCRT), with/without induction chemotherapy (IC) or adjuvant chemotherapy (AC). The CCRT consisted of cisplatin for three to six cycles. IC and AC were cisplatin-based regimens every 3 weeks for 2–4 cycles. Patients who could not tolerate or refused chemotherapy did not receive chemotherapy. All patients were treated with intensity-modulated RT (30–33 fractions with five daily fractions per week for 6–7 weeks), and the total radiation doses were 60–72.6 Gy.
Plasma EBV DNA
Plasma EBV DNA concentrations before treatment were routinely measured using a commercial extraction kit (Shanghai ZJ Bio-Tech Co. Ltd, China). The real-time polymerase chain reaction (PCR) analysis was performed on the Hongshi SLAN-9GP Real-Time PCR system. All tests were performed using our usual standard operating procedures according to the reagent operation instructions.
Patients with EBV DNA values of ≥500 copies/ml were assigned to the EBV DNA (+) group, and patients with EBV DNA values of <500 copies/ml were assigned to the EBV DNA (–) group.
MRI Acquisition
All the patients were examined on a 1.5-T MRI scanner (Achieva, Philips Healthcare). T2-weighted (T2-w), T1-weighted (T1-w), and contrast-enhanced T1-weighted (CET1-w) MR images were acquired. The acquisition parameters were as follows: axial T2-w spin-echo images (FSE, TR = 5,013 ms, and TE = 100 ms), axial T1-w spin-echo images (FSE, TR = 456 ms, and TE = 15 ms), and axial CET1-w spin-echo images (FSE, TR = 450 ms, and TE = 15 ms). The slice thickness and interslice gap were 5 and 0.5 mm, respectively.
Lesion Segmentation and Reproducibility Evaluation
Feature selection used the T2-w and CET1-w MR images. Regions of interest (ROIs) were first manually drawn slice by slice by one radiologist (observer 1) with 10 years of experience in head-and-neck MRI interpretation by using the in-house software developed by Philips. The ROIs covered the whole tumor.
We selected randomly 50 patients for reproducibility evaluation, and then we selected 100 radiomic features from each selected patient (50 features were randomly selected from T2-w-based radiomic features, and 50 features were randomly selected from CET1 image-based radiomic features) to evaluate the interobserver and intraobserver ICC. ROI segmentation was analyzed 1 month later by the same (observer 1) and one other radiologist (observer 2, 15 years of experience in head-and-neck MRI interpretation). The differences between the features extracted by observer 1 (first time) and those by observer 2, as well as the twice-extracted features by observer 1, were assessed by an independent Kruskal–Wallis H test.
Radiomic Signature Building
Radiomic features were extracted from T2-w and CET1-w images using the Philips Radiomics Tool.
For feature selection, removing features with low variance was first performed to identify the significant features with threshold <0.01, and the least absolute shrinkage selection operator (LASSO) was explored to reduce the dimensionality of features. After that, the recursive feature elimination (RFE) based on support vector machine (SVM) was used to further choose the most valuable predictive features from the above features, and the dimensionality of features was further reduced. Finally, 20 key features were selected in the training cohort. After feature selection, a Cox model was built and used to construct a radiomic score (Rad-score).
Prognostic Validation of the Radiomics
The potential correlations between PFS and radiomics were first assessed in the training group and then confirmed in the validation group. Kaplan–Meier survival was performed in both groups. The patients were assigned to high-risk and low-risk groups based on median Rad-score. Stratified analysis was used to determine the PFS in various subgroups, and high-risk and low-risk patients were compared. The C-index of the radiomics based on the T2-w and CET1-w images were calculated by the univariate Cox proportional hazards models.
The C-index was used to evaluate the prognostic performance of the five models (Model 1: clinical data, Model 2: radiomics, Model 3: overall stage, Model 4: radiomics + overall stage, Model 5: radiomics + overall stage + EBV DNA).
Clinical Endpoints and Follow-Up
All patients were followed up every 3 months in the first 2 years, 6 months in years 3–5, and 12 months thereafter or until death. The follow-up time was defined from therapy initiation to the day of last examination or death. We set PFS as the endpoint (16, 17). PFS was defined from the 1st day of treatment to the date of disease progression (local recurrence or distant metastasis), death for any cause, or the last follow-up (censored). Disease progression was confirmed by biopsy pathology and/or imaging methods such as CT, MRI, or PET-CT (15).
Statistical Analysis
The Mann–Whitney U-test was used to analyze quantitative variables of the training group and the validation group, and the chi-square test was used to analyze the qualitative variables. Those differences of the C-indexes in five models were compared by one-way ANOVA. Bonferroni post-hoc test was used for comparing the differences of the C-indexes between any two models. The statistical analysis was performed with SPSS software version 22.0 (SPSS IBM). LASSO in the “glmnet” package of R(version 3.6.2) and RFE based on SVR in Python(3.7) were used to select radiomic features to fit the Cox proportion model. The Kaplan–Meier survival and Cox proportional hazards regression analyses were respectively performed with the “survival” package and “rms” package in R (version 3.6.2). In Bonferroni post-hoc test, a two-sided P < 0.05/5 was considered statistically significant, and in all other tests, a two-sided P < 0.05 was considered statistically significant.
Results
Clinical Data
The clinical data of all patients are summarized in Table 1. There were no significant differences between the training and validation cohorts in clinical characteristics (P = 0.298–0.985). The median follow-up time was 38 months (range, 24–72 months), and the median PFS was 24 months (range, 3–60 months); 84 patients had progression (14 recurrences and 70 metastases), and 19 patients had died by the last follow-up.
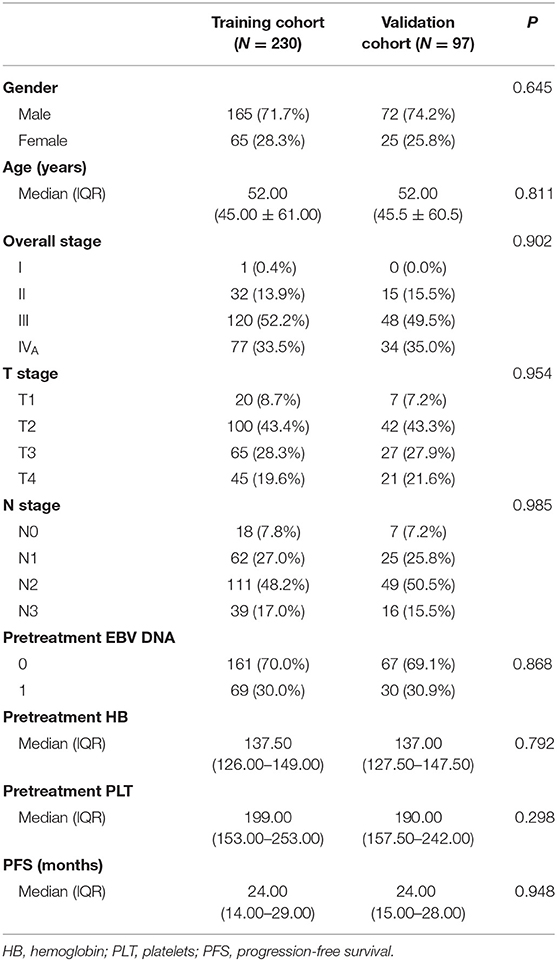
Table 1. Characteristics of the patients in the training and validation cohorts.
Radiomic Signature Building
Extracted from T2-w images and CET1-w images are 1,227 features, adding up to 2,454 features. Twenty radiomic features were selected using the Rad-score prognostic model (Table 2).
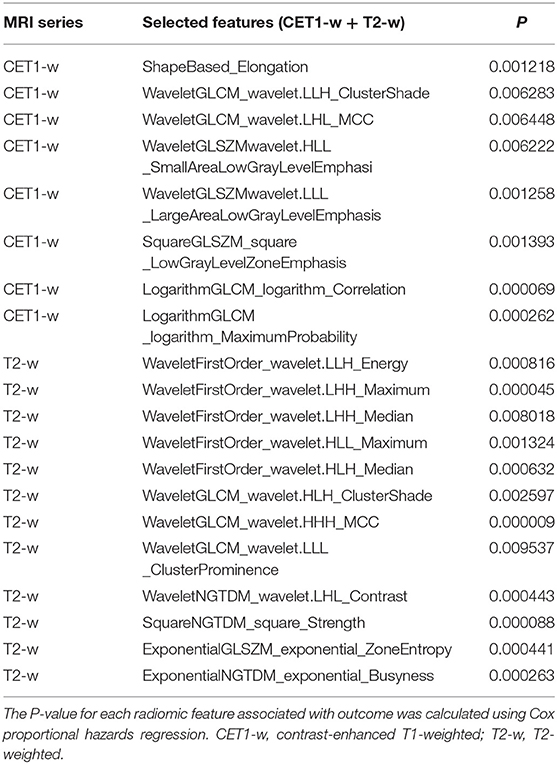
Table 2. Radiomic feature selection result.
The Rad-scores for each patient are shown in Figure 1. The Rad-scores between the training and validation cohorts were significantly different (P < 0.05).
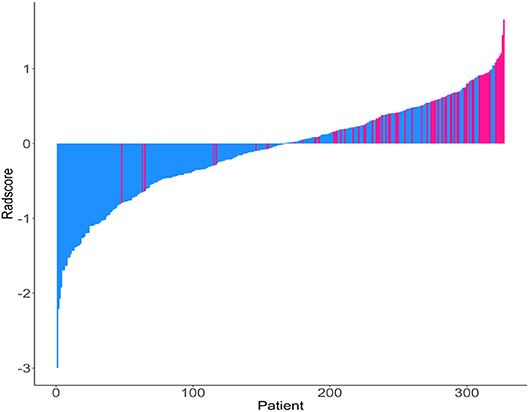
Figure 1. Rad-score for each patient. Dodger blue bars show scores for patients who survived without disease progression or were censored, while deep pink bars show scores for those who experienced progression or died.
Reproducibility Evaluation of ROI Segmentation
There were no significant differences between the features of the two observers nor between first-extracted features and second-extracted features of observer 1's (p-values ranged from 0.576 to 0.784). The intraobserver ICC calculated based on observer 1's twice feature extraction ranged from 0.758 to 0.908, and the interobserver ICCs ranged from 0.752 to 0.889. Therefore, all outcomes were based on the features extracted by the observer.
Prediction Performance of Models
The C-index of each model was shown in Table 3. The model of clinical data gained the lowest C-index in the training cohort [0.563 (95% CI: 0.493–0.634)] and validation cohort [0.456 (95% CI: 0.443–0.470)].
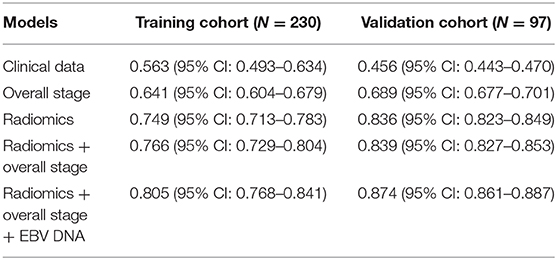
Table 3. C-index of the five models.
The C-index of radiomics was higher than that of the overall stage in the training cohort [0.749 (95% CI: 0.713–0.783) vs. 0.641 (95% CI: 0.604–0.679)] and validation cohort [0.836 (95% CI: 0.823–0.849) vs. 0.689 (95% CI: 0.677–0.701)].
Model 4 integrating radiomics and overall stage gained a C-index of 0.766 (95% CI: 0.729–0.804) in the training cohort and 0.839 (95% CI: 0.827–0.853) in the validation cohort, which were higher than those of radiomics or overall stage alone. This nomogram without EBV DNA was shown in Figure 2A. The nomogram also showed good calibration (Figure 2B).
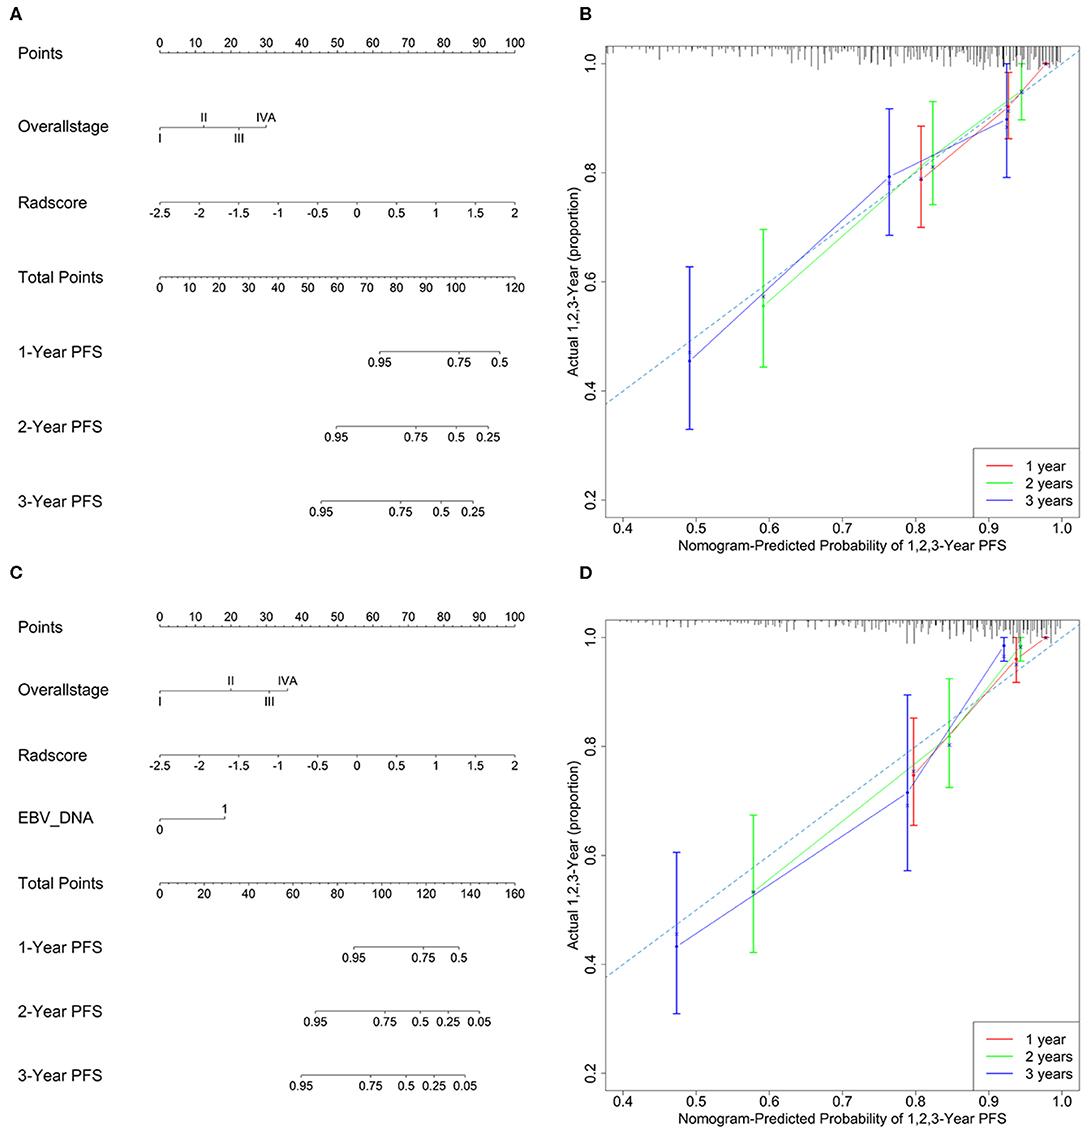
Figure 2. (A) A radiomic nomogram without EBV DNA integrating the radiomic signature with the TNM staging system. (B) Calibration curve of the radiomic nomogram without EBV DNA. (C) A radiomic nomogram with EBV DNA integrating the radiomic signature, TNM staging system, and EBV DNA. (D) Calibration curve of the radiomic nomogram with EBV DNA.
The number of EBV DNA (+) patients and EBV DNA (−) patients were 228 and 99, respectively. Model 5 integrating radiomics, overall stage, and EBV DNA gained the highest C-index of 0.805 (95% CI: 0.768–0.841) in the training cohort and 0.874 (95% CI: 0.861–0.887) in the validation cohort. The nomogram with EBV DNA and calibration curve integrating the three factors was shown in Figures 2C,D.
For low-stage NPC patients (n = 48), those C-indices of clinical data, radiomics, and EBV DNA were 0.533 (95% CI: 0.687–0.517), 0.759 (95% CI: 0.718–0.814), and 0.687 (95% CI: 0.633–0.718), respectively. The combined model (radiomics combined with EBV DNA) improved the predictive performance of PFS, its C-index was 0.772 (95% CI: 0.718–0.827).
Kaplan–Meier Survival Analysis
The Kaplan–Meier survival curves (Figure 3) were drawn based on the model of the radiomics combined with the overall stage. In the training cohort and validation cohort, the high-risk group yielded a lower PFS than the low-risk group (P < 0.05).
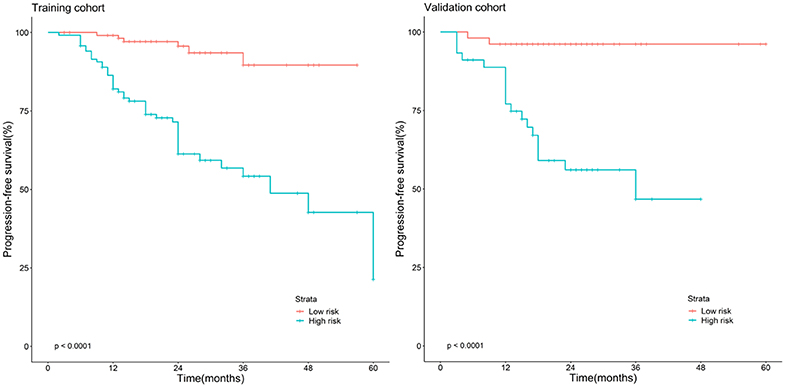
Figure 3. Stratified analyses were performed to estimate progression-free survival in the training cohort and validation cohort; high-risk patients show lower progression-free survival rate than low-risk patients, P < 0.05.
Discussion
In our study, we developed an optimal model based on radiomics, overall stage, and EBV DNA to predict PFS in patients with stage I–IVA NPC. The nomogram with EBV DNA improved the prediction performance of the nomogram without EBV DNA. We used the Rad-scores derived from the optimal model to stratify patients into high- and low-risk groups
The radiomics successfully translates medical imaging into mineable, quantitative, and high-dimensional imaging features, which offers an easy, effective, and reliable method of stratifying patients into risk groups and aids in decision making (18, 19). The radiomics may be an effective approach to predict PFS in patients with NPC via visualizing and quantifying intratumor heterogeneity. The study showed that the predictive performance of radiomics for PFS was higher than that for the traditional TNM overall stage, and the predictive performance of radiomics combined with overall stage was higher than that of radiomics or overall stage alone, which are consistent with previous studies (2, 15, 20).
The C-index of the radiomics combined with the overall stage in the study was slightly lower than that reported by the previous studies on advanced or T4 NPC (15, 21). The possible explanation may be that the present study included 327 patients with T1–T4 NPC, which may improve the generalizability of the prediction models.
Recent evidence indicates that plasma EBV DNA may not only reflect tumor burden but also be an index of other tumor features, such as accessibility to angiogenesis, circulation, metabolic activity, tumor cell kinetics, and metastatic potential (22). Moreover, several studies demonstrated that pretreatment EBV DNA is relevant to PFS of patients with NPC (9, 23). On the basis of the above studies, we performed two nomograms with or without pretreatment EBV DNA on NPC patients. Our result indicates that the nomograms with pretreatment EBV DNA improved the prediction performance of those without pretreatment EBV DNA; this finding with a larger sample size was consistent with a previous one (2).
The Kaplan–Meier survival curves based on the radiomics combined with overall stage model can commendably stratify the PFS of NPC patients, which may contribute to the accurate stratification of patients for individual treatment strategies in clinical practice and the improvement of the clinical outcomes of patients with NPC. The PFS of the high-risk group was lower than that of the low-risk group, which was similar to previous studies (18, 20, 21, 24), and it is helpful for administering individualized treatment plans.
Our study has some limitations. First, this study was conducted in a single center. The results should be interpreted cautiously and verified by a large-sample-size, multicenter study. Second, the mean follow-up time was relatively short; a longer follow-up time is required to predict the 5-year PFS rates. Third, radiomics always attempts to find the most valuable feature in various data, while we only analyze T2-w and CET1-w images. The analysis of multiparameter data may help improve the quality of the model.
In conclusion, our study showed that the model incorporating radiomics, overall stage, and EBV DNA showed optimal performance for predicting PFS in nonmetastatic NPC patients. The combined model can stratify patients into low- and high-risk groups; it may provide additional information to personalized treatment decision in nonmetastatic NPC.
Data Availability Statement
The datasets generated for this study are available on request to the corresponding author.
Ethics Statement
The studies involving human participants were reviewed and approved by the ethics committee of Chongqing University Cancer Hospital. The patients provided written informed consent to participate in this study.
Author Contributions
HS, YuW, and DL: conception and design. JZ, YiW, and HH: administrative support. RL, YyH, CP, and YpH: provision of study materials or patients. XL and SJ: data collection and collation. XL and JS: data processing and analysis. All authors manuscript writing and final approval of manuscript.
Funding
This study has received funding by the achievement encourage specific projects for Chongqing Research Institutes (grant No. cstc2018jxjl130072), combination projects of medicine and engineering of the Fundamental Research Funds for the Central Universities in 2019 (project No. 2019CDYGYB008), the Chongqing key medical research project of combination of science and medicine (grant No. 2019ZDXM007), and the 2019 SKY Imaging Research Fund of the Chinese International Medical Foundation (project No. Z-2014-07-1912-10).
Conflict of Interest
JS was employed by the company Philips Healthcare.
The remaining authors declare that the research was conducted in the absence of any commercial or financial relationships that could be construed as a potential conflict of interest.
Abbreviations
EBV, Epstein–Barr virus; PFS, Progression-free survival; LASSO, Least absolute shrinkage and selection operator; PCR, Polymerase chain reaction; CE-T1WI, Contrast-enhanced T1-weighted image; T2WI, T2-weighted image; CI, Confidence interval; NPC, Nasopharyngeal carcinoma.
References
1. Chen YP, Chan ATC, Le QT, Blanchard P, Sun Y, Ma J. Nasopharyngeal carcinoma. Lancet. (2019) 394:64–80. doi: 10.1016/S0140-6736(19)30956-0
2. Yang K, Tian J, Zhang B, Li M, Xie W, Zou Y, et al. A multidimensional nomogram combining overall stage, dose volume histogram parameters and radiomics to predict progression-free survival in patients with locoregionally advanced nasopharyngeal carcinoma. Oral Oncol. (2019) 98:85–91. doi: 10.1016/j.oraloncology.2019.09.022
3. Guo Q, Lu T, Hui Huang S, O'Sullivan B, Zong J, Xiao Y, et al. Depicting distant metastatic risk by refined subgroups derived from the 8th edition nasopharyngeal carcinoma TNM. Oral Oncol. (2019) 91:113–20. doi: 10.1016/j.oraloncology.2019.02.021
4. Tang LL, Chen YP, Mao YP, Wang ZX, Guo R, Chen L, et al. Validation of the 8th edition of the UICC/AJCC staging system for nasopharyngeal carcinoma from endemic areas in the intensity-modulated radiotherapy era. J Natl Compr Canc Netw. (2017) 15:913–9. doi: 10.6004/jnccn.2017.0121
5. Chen M, Yin L, Wu J, Gu JJ, Jiang XS, Wang DJ, et al. Impact of plasma Epstein-Barr virus-DNA and tumor volume on prognosis of locally advanced nasopharyngeal carcinoma. Biomed Res Int. (2015) 2015:617949. doi: 10.1155/2015/617949
6. Jin YN, Yao JJ, Zhang F, Wang SY, Zhang WJ, Zhou GQ, et al. Is pretreatment Epstein-Barr virus DNA still associated with 6-year survival outcomes in locoregionally advanced nasopharyngeal carcinoma? J Cancer. (2017) 8:976–82. doi: 10.7150/jca.18124
7. You R, Liu YP, Lin M, Huang PY, Tang LQ, Zhang YN, et al. Relationship of circulating tumor cells and Epstein-Barr virus DNA to progression-free survival and overall survival in metastatic nasopharyngeal carcinoma patients. Int J Cancer. (2019) 145:2873–83. doi: 10.1002/ijc.32380
8. Leung SF, Chan KC, Ma BB, Hui EP, Mo F, Chow KC, et al. Plasma Epstein-Barr viral DNA load at midpoint of radiotherapy course predicts outcome in advanced-stage nasopharyngeal carcinoma. Ann Oncol. (2014) 25:1204–8. doi: 10.1093/annonc/mdu117
9. Lee VH, Kwong DL, Leung TW, Choi CW, O'Sullivan B, Lam KO, et al. The addition of pretreatment plasma Epstein-Barr virus DNA into the eighth edition of nasopharyngeal cancer TNM stage classification. Int J Cancer. (2019) 144:1713–22. doi: 10.1002/ijc.31856
10. Gillies RJ, Kinahan PE, Hricak H. Radiomics: Images are more than pictures, they are data. Radiology. (2016) 278:563–77. doi: 10.1148/radiol.2015151169
11. Huang Y, Liu Z, He L, Chen X, Pan D, Ma Z, et al. Radiomics signature: a potential biomarker for the prediction of disease-free survival in early-stage (I or II) non-small cell lung cancer. Radiology. (2016) 281:947–57. doi: 10.1148/radiol.2016152234
12. Larue R, Klaassen R, Jochems A, Leijenaar RTH, Hulshof M, van Berge Henegouwen MI, et al. Pre-treatment CT radiomics to predict 3-year overall survival following chemoradiotherapy of esophageal cancer. Acta Oncol. (2018) 57:1475–81. doi: 10.1080/0284186X.2018.1486039
13. Park H, Lim Y, Ko ES, Cho HH, Lee JE, Han BK, et al. Radiomics signature on magnetic resonance imaging: association with disease-free survival in patients with invasive breast cancer. Clin Cancer Res. (2018) 24:4705–14. doi: 10.1158/1078-0432.CCR-17-3783
14. Mo X, Wu X, Dong D, Guo B, Liang C, Luo X, et al. Prognostic value of the radiomics-based model in progression-free survival of hypopharyngeal cancer treated with chemoradiation. Eur Radiol. (2020) 30:833–43. doi: 10.1007/s00330-019-06452-w
15. Zhang B, Tian J, Dong D, Gu D, Dong Y, Zhang L, et al. Radiomics features of multiparametric MRI as novel prognostic factors in advanced nasopharyngeal carcinoma. Clin Cancer Res. (2017) 23:4259–69. doi: 10.1158/1078-0432.CCR-16-2910
16. Di Maio M, Bria E, Rossi A, Perrone F. Progression-free survival as primary end point in advanced non-small-cell lung cancer: does the size matter? Ann Oncol. (2008) 19:402–3. doi: 10.1093/annonc/mdm586
17. Markman M. Progression-free survival versus overall survival as the primary end point in anticancer drug trials: increasingly relevant impact of therapy following progression. Curr Oncol Rep. (2009) 11:1–2. doi: 10.1007/s11912-009-0001-y
18. Peng H, Dong D, Fang MJ, Li L, Tang LL, Chen L, et al. Prognostic value of deep learning PET/CT-based radiomics: potential role for future individual induction chemotherapy in advanced nasopharyngeal carcinoma. Clin Cancer Res. (2019) 25:4271–9. doi: 10.1158/1078-0432.CCR-18-3065
19. Steiger P, Sood R. How can radiomics be consistently applied across imagers and institutions? Radiology. (2019) 291:60–1. doi: 10.1148/radiol.2019190051
20. Zhao L, Gong J, Xi Y, Xu M, Li C, Kang X, et al. MRI-based radiomics nomogram may predict the response to induction chemotherapy and survival in locally advanced nasopharyngeal carcinoma. Eur Radiol. (2020) 30:537–46. doi: 10.1007/s00330-019-06211-x
21. Zhang LL, Huang MY, Li Y, Liang JH, Gao TS, Deng B, et al. Pretreatment MRI radiomics analysis allows for reliable prediction of local recurrence in non-metastatic T4 nasopharyngeal carcinoma. EBioMedicine. (2019) 42:270–80. doi: 10.1016/j.ebiom.2019.03.050
22. Peng L, Yang Y, Guo R, Mao YP, Xu C, Chen YP, et al. Relationship between pretreatment concentration of plasma Epstein-Barr virus DNA and tumor burden in nasopharyngeal carcinoma: an updated interpretation. Cancer Med. (2018) 7:5988–98. doi: 10.1002/cam4.1858
23. Guo R, Tang LL, Mao YP, Du XJ, Chen L, Zhang ZC, et al. Proposed modifications and incorporation of plasma Epstein-Barr virus DNA improve the TNM staging system for Epstein-Barr virus-related nasopharyngeal carcinoma. Cancer. (2019) 125:79–89. doi: 10.1002/cncr.31741
24. Du D, Feng H, Lv W, Ashrafinia S, Yuan Q, Wang Q, et al. Machine learning methods for optimal radiomics-based differentiation between recurrence and inflammation: application to nasopharyngeal carcinoma post-therapy PET/CT images. Mol Imaging Biol. (2019). doi: 10.1007/s11307-019-01411-9. [Epub ahead of print].
Keywords: radiomics, prediction, progression-free survival, nasopharyngeal carcinoma, magnetic resonance imaging
Citation: Shen H, Wang Y, Liu D, Lv R, Huang Y, Peng C, Jiang S, Wang Y, He Y, Lan X, Huang H, Sun J and Zhang J (2020) Predicting Progression-Free Survival Using MRI-Based Radiomics for Patients With Nonmetastatic Nasopharyngeal Carcinoma. Front. Oncol. 10:618. doi: 10.3389/fonc.2020.00618
Received: 04 January 2020; Accepted: 03 April 2020;
Published: 12 May 2020.
Edited by:
Aviram Mizrachi, Rabin Medical Center, IsraelReviewed by:
Mu-Sheng Zeng, Sun Yat-sen University, ChinaFan Zhang, Fifth Affiliated Hospital of Sun Yat-sen University, China
Copyright © 2020 Shen, Wang, Liu, Lv, Huang, Peng, Jiang, Wang, He, Lan, Huang, Sun and Zhang. This is an open-access article distributed under the terms of the Creative Commons Attribution License (CC BY). The use, distribution or reproduction in other forums is permitted, provided the original author(s) and the copyright owner(s) are credited and that the original publication in this journal is cited, in accordance with accepted academic practice. No use, distribution or reproduction is permitted which does not comply with these terms.
*Correspondence: Jiuquan Zhang, emhhbmdqcV9yYWRpb2xAZm94bWFpbC5jb20=
†These authors have contributed equally to this work