
95% of researchers rate our articles as excellent or good
Learn more about the work of our research integrity team to safeguard the quality of each article we publish.
Find out more
ORIGINAL RESEARCH article
Front. Oncol. , 24 April 2020
Sec. Gastrointestinal Cancers
Volume 10 - 2020 | https://doi.org/10.3389/fonc.2020.00610
This article is part of the Research Topic Predictive Biomarkers In Metastatic Gastroesophageal Cancer Patients View all 22 articles
 Hao Chen1†
 Ling-Yu Chu2†Xiao-Hui Li1†Yu-Hui Peng3,4†Can-Tong Liu1,3Li-Ru Tian5
 Jian-Jun Xie2
 Yi-Wei Xu3,4*
Background and Aim: Primary small cell carcinoma of the esophagus (SCCE) is a rarely aggressive disease characterized by rapid progression, widespread metastasis, and poor prognosis. This study was aimed to evaluate the prognostic significance of serum lipids for overall survival (OS) in SCCE patients.
Methods: We retrospectively analyzed SCCE patients in a training cohort (61 patients) and validated them in a validation cohort (27 patients). These cases were collected from Sun Yat-sen University Cancer Center from 2006 to 2017. Univariate and multivariate Cox survival analyses were performed to determine serum lipids as prognostic factors associated with the patient's OS. Time-dependent receiver operating characteristics (ROC) were used to compare predictive power of independent prognostic factors. The predictive accuracy and discriminative ability of the prognostic factors were measured by the concordance index (C-index) and decision curve, and were compared with the TNM stage system.
Results: On multivariate analysis of the training cohort, independent factors for survival were gender, BAR (ApoB/ApoA-1) and TNM stage. The area under the curve (AUC) of BAR+TNM stage in the training cohort was higher than that of TNM stage for OS, and similar result was observed in the validation cohort. The c-index of BAR+TNM stage for predicting the OS was 0.655 (95% CI = 0.571–0.740), which was higher than that of TNM stage [0.614 (95% CI = 0.530–0.698)] in the training cohort. In the validation cohort, the C-index of the BAR+TNM stage for predicting OS was also higher than that of the TNM stage [0.688 (95% CI: 0.570~0.806) vs. (0.512; 95% CI: 0.392~0.632)]. In addition, decision curve analysis also showed that the predictive accuracy of BAR+TNM stage for OS was higher than TNM stage both in the training and the validation cohorts.
Conclusions: BAR represents a promising prognostic indicator that might complement TNM stage in the prognosis of SCCE, and that warrant further assessment in large SCCE patient cohort.
Esophageal cancer is one of the most common malignant tumors in China, and its histological type is most common in squamous cell carcinoma (1). Primary small cell carcinoma of the esophagus (SCCE) is a relatively rare histopathological type, accounting for only 0.8–3.1% of all malignant tumors of the esophagus (2, 3). Since the British scholar Mckeown reported the first SCCE in 1952 (4), the United States estimates that the number of new cases of SCCE is about 130–395 per year, and the incidence is increasing year by year (5). As a high incidence country of esophageal cancer, increasing studies were focused on SCCE in China (1, 6). SCCE is a highly aggressive disease characterized by rapid progression, extensive metastasis and poor prognosis, with a higher incidence of males than females (7–10). At present, some studies have found a number of clinicopathological indicators that can assess the prognosis of SCCE, including lesions, TNM stage, VALSG stage, tumor inflammatory cell infiltration and treatment, but the results from some of these literatures are controversial (11–15). Therefore, it is necessary to explore new indicators that can evaluate the prognosis in order to improve the existing prognostic model and achieve a more accurate and comprehensive assessment of SCCE.
Lipid levels can reflect the state of lipid metabolism in the body, and many diseases are associated with disorders of dyslipidemia. Studies have shown that when tumors occur, serum lipids also change accordingly, and the changes in serum lipids in patients with different tumors are also diverse (16). Lipids are important components of cell membranes and metabolites of organisms, and play an important role in energy storage, structural composition and signal transduction (17, 18). Recently, a number of studies have demonstrated that serum lipid, such as total cholesterol (TC), triglyceride (TG), high-density lipoprotein cholesterol (HDL-C), low-density lipoprotein cholesterol (LDL-C), apolipoprotein A-1 (ApoA-1) and apolipoprotein B (ApoB) were associated with several types of cancer risk (18–21). Therefore, determining their content and ratio have important implications for the diagnosis and prognosis of cancer patients.
Although various studies have discussed the close relationship between serum lipids and cancers, studies of serum lipids and SCCE are very limited. The relationship between serum lipids and survival prognosis in patients with SCCE is also unclear. Therefore, in this study, we performed a retrospective study to assess the association of serum lipids with clinicopathological features and to predict the overall survival (OS) of SCCE in combination with TNM stage and serum lipids.
In this study, we conducted a retrospective observational study. A total of 61 patients with SCCE were recruited as training cohort, which were obtained from the Sun Yat-sen University Cancer Center, from January 2006 to December 2016. A validation cohort was comprised of 27 patients with SCCE from the same center, from November 2010 to October 2017. We reviewed the detailed medical records of these patients who were diagnosed as SCCE based on barium swallow examination, spiral computed-tomography (CT) and endoscopic examination followed by histopathology. The histological criteria of small cell carcinoma of 2010 “WHO Pathology and Genetics of the Gastrointestinal System of the World Health Organization” was adopted. The pathological diagnosis of SCCE was determined in biopsy or resected specimens, and retrospective analysis was performed. Immunohistochemical staining was performed to determine the presence of common neuroendocrine markers including synaptophysin (Syn), neuron-specific enolase (NSE), chromogranin A (CgA), cytokeratin (CK), and lymphocyte antigen 56 (CD56). There were 55 and 26 patients underwent immunohistochemical examination in the training cohort and the validation cohort, respectively. The positive rate of each neuroendocrine markers is shown in Table S1.
Patients included in the analysis met the following criteria: (1) they were diagnosed as SCCE with histopathological examination; (2) they did not suffer from any cancer disease before SCCE diagnosis or receive any anti-cancer treatment; (3) they underwent chest CT examination, and the lung metastatic lesions could be ruled out; (4) they had complete follow-up data. The OS was defined as the interval between the initial diagnosis and either death of cancer or the last follow-up. The last follow-up was performed in November 2019. In this study, all serum results were obtained before treatment began. This study was approved by the Hospital Ethics Committee in Sun Yat-sen University Cancer Center in China and informed consents were obtained from all included participants. All work was complied with the principles of the Helsinki Declaration.
We collected clinicopathologic parameters of each patient as follows: gender, age, family history, tumor size, tumor location, treatment and pathologic TNM stage. The clinical stage of the disease was determined according to 8th edition of the AJCC TNM stage manual (22). The potential prognostic factors included APOA-1, APOB, HDL-C, LDL-C, TC, TG, BAR (BAR = ApoB/ApoA-1), BMI and PNI. PNI was calculated by the formula Alb (g/L) + 5 × lymphocyte count (×109/L). In this study, continuous variables were transformed into categorical variables. The best cut-off values for all variables were determined by X-tile (23) and were as follows: age (54 years), ApoA-1 (1.47 g/L), ApoB (0.97 g/L), HDL-C (0.97 mmol/L), LDL-C (2.81 mmol/L), TC (4.86 mmol/L), TG (1.10 g/L), BAR (0.72), BMI (20), and PNI (54).
Statistical analyses were performed using SPSS software, version 19.0 (SPSS Inc., Chicago, IL, USA) and R (version 3.4.4) for Windows. The Kaplan-Meier curves were used to calculate the survival rate, and the Log-rank test was used to compare them. Univariate analysis was performed to assess the importance of clinical and pathological features. Variables with a significant level of P ≤ 0.1 in univariate analysis were analyzed using multivariate Cox regression. A dynamic predictive nomogram model is built using all variables with a P-value of less than 0.05 in a multivariate model. The prognostic factors of the 1-, 3-, and 5-year OS were calibrated by comparing predicted survival with observed survival. The predictive accuracy and discriminative ability of the prognostic factors were measured by C-index and decision curve, and were compared with the TNM stage system. Hazard ratios (HR) and 95% confidence intervals (CI) were calculated using univariate and multivariate Cox proportional hazards regression models to assess the impacts of prognostic variable' OS. All statistical tests were two-sided, and P < 0.05 was considered statistically significant.
In training cohort, 61 patients met all criteria were enrolled in this study. The median age for these patients was 56 years (range 24–80 years), of which 44 (72.1%) were males and 17 (27.9%) were females. The numbers of patients of I-II, III and IV stage were 24 (39.3%), 22 (36.1%), and 15 (24.6%), respectively. At the time of the last follow-up, the median OS was 18 months. Similar results were observed in the validation cohort. Patient demographic and clinical characteristics are summarized in Table 1. In addition, there was no difference of BAR levels among patients undergoing surgery, surgery plus radiotherapy/chemotherapy, or radiotherapy plus chemoradiotherapy (Figure S1).
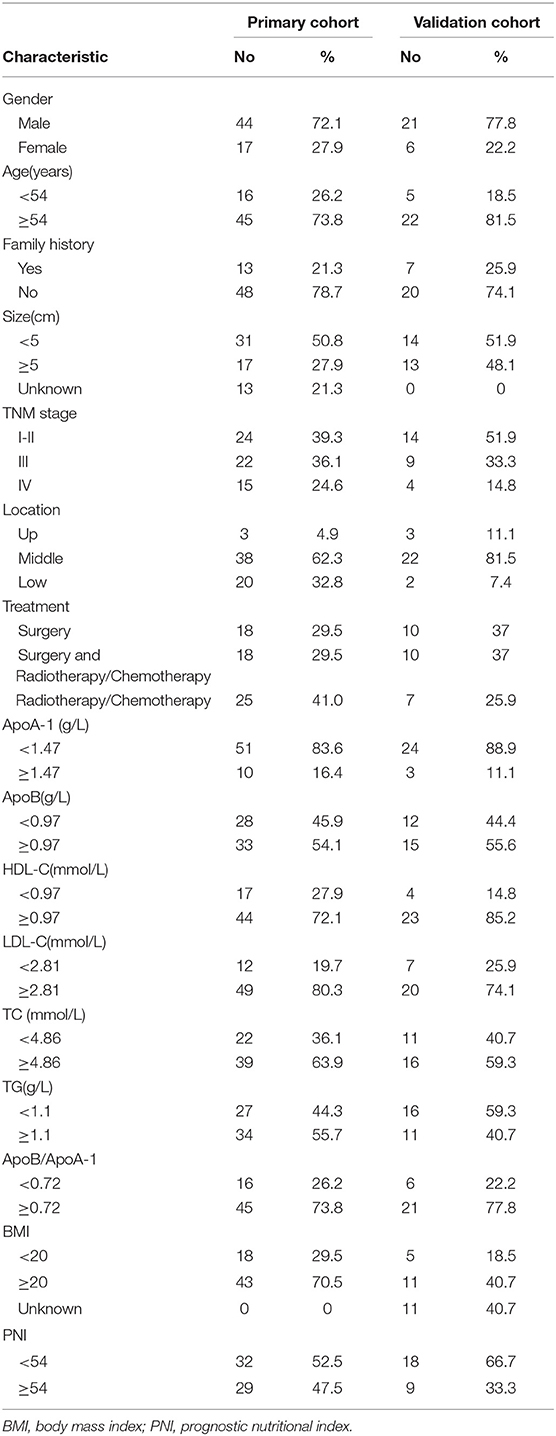
Table 1. Patient demographics and clinical characteristics.
Univariate analysis indicated that gender (P = 0.068), Tumor size (P = 0.026), TNM stage (P = 0.070), APOB (P = 0.077), LDL-C (P = 0.077), and BAR (P = 0.021) were associated with OS of SCCE patients. Then the prognostic factors significantly related to OS in univariate analysis were included in the multivariate Cox proportional risk regression analysis of OS. In multivariate analysis for OS with Cox regression, the results showed that the following variables remained independently prognostic: gender (P = 0.019, HR = 2.213; 95% CI: 1.14–4.29), TNM stage (P = 0.019, HR =1.605; 95% CI: 1.08–2.39) and BAR (P = 0.02, HR =2.701; 95% CI: 1.17–6.22). The detailed results of univariate and multivariate analyses are presented in Table 2. According to Cox proportional hazards regression analysis, the forest plot shows the hazard ratios and 95% confidence intervals for OS (Figure 1). The Kaplan-Meier curves for OS according to gender, TNM stage and BAR levels were significantly different, as confirmed by the log-rank test. As expected, we observed similar result for patients in the validation cohort with those in the training cohort (Figure 2). Moreover, the results of time-dependent ROC curve for OS showed that area under the curve (AUC) of BAR + TNM stage was higher than that of TNM stage, whether in the training cohort or the validation cohort (Figure 3).
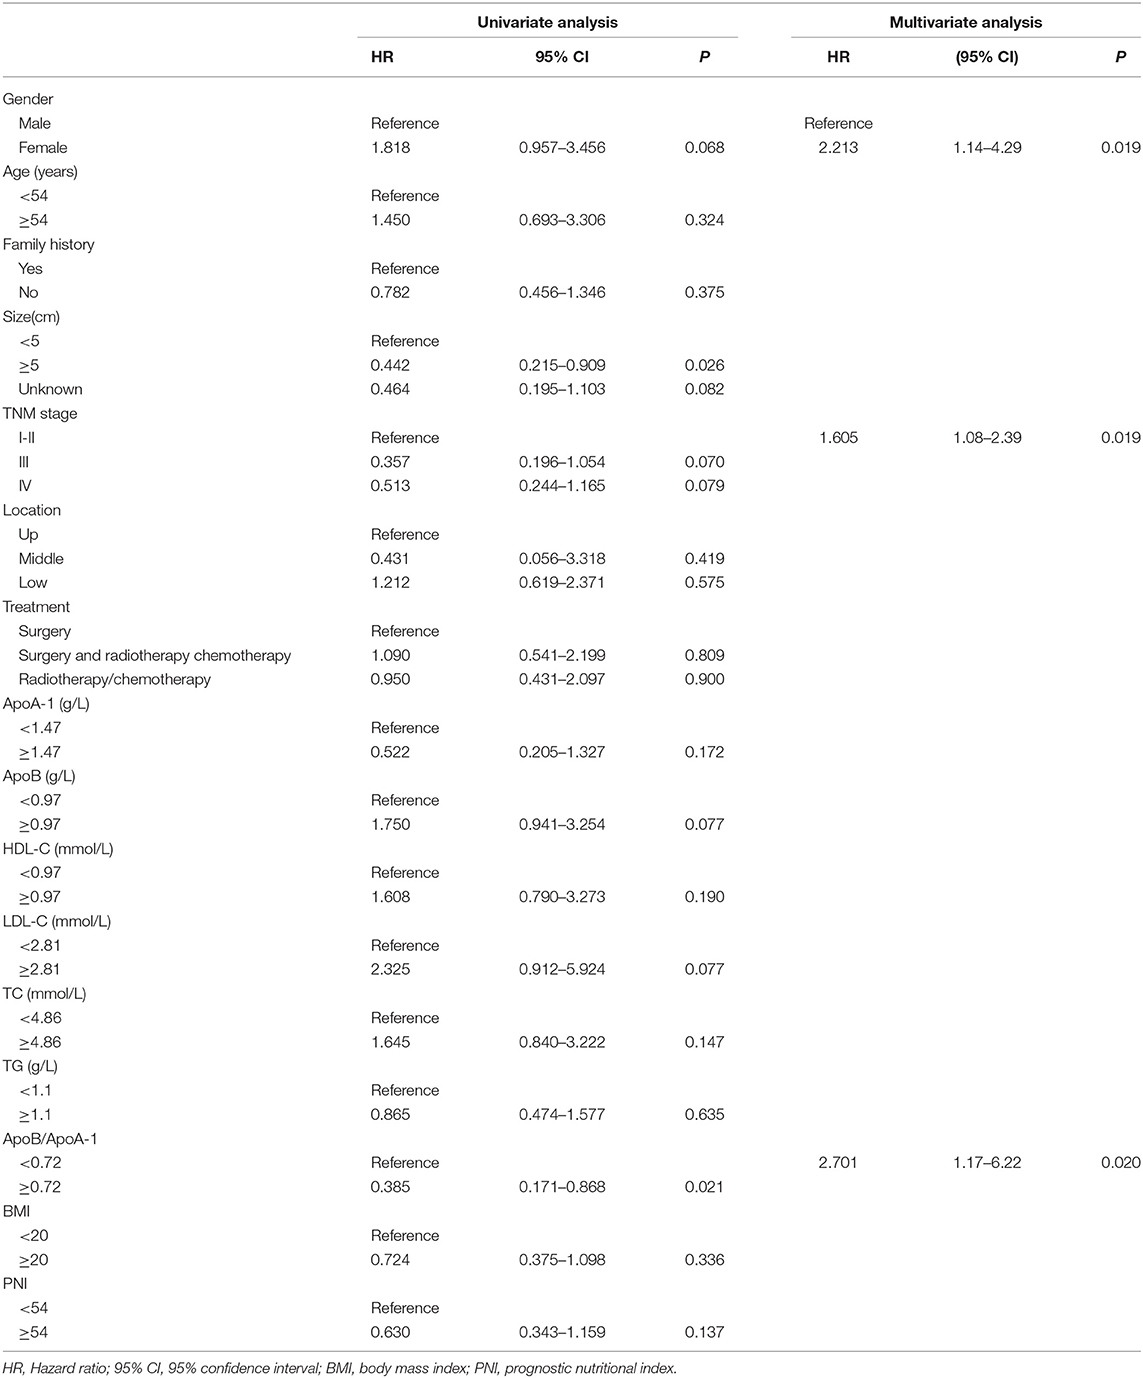
Table 2. Univariate and multivariate Cox proportional hazards regression analysis for OS.
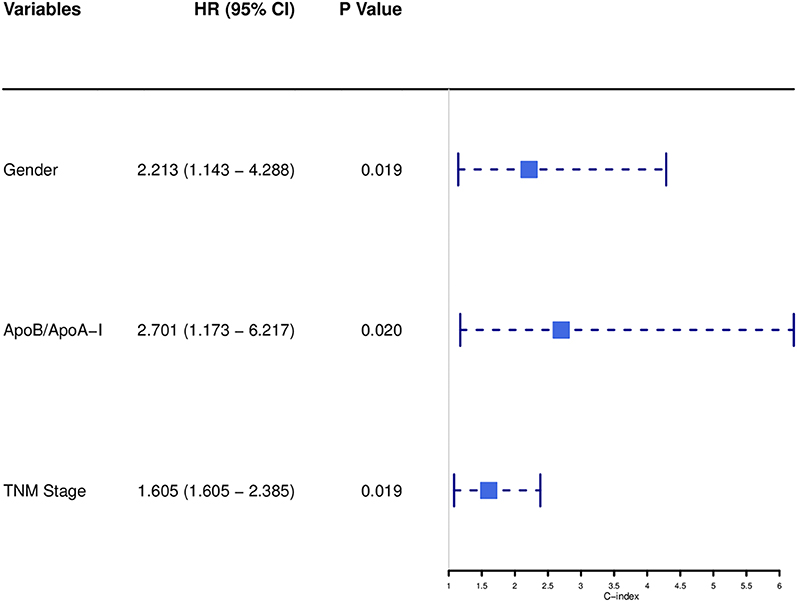
Figure 1. Forest plot showed the hazard ratio and 95% confidence interval for OS according to the Cox proportional hazards regression analysis in SCCE patients.
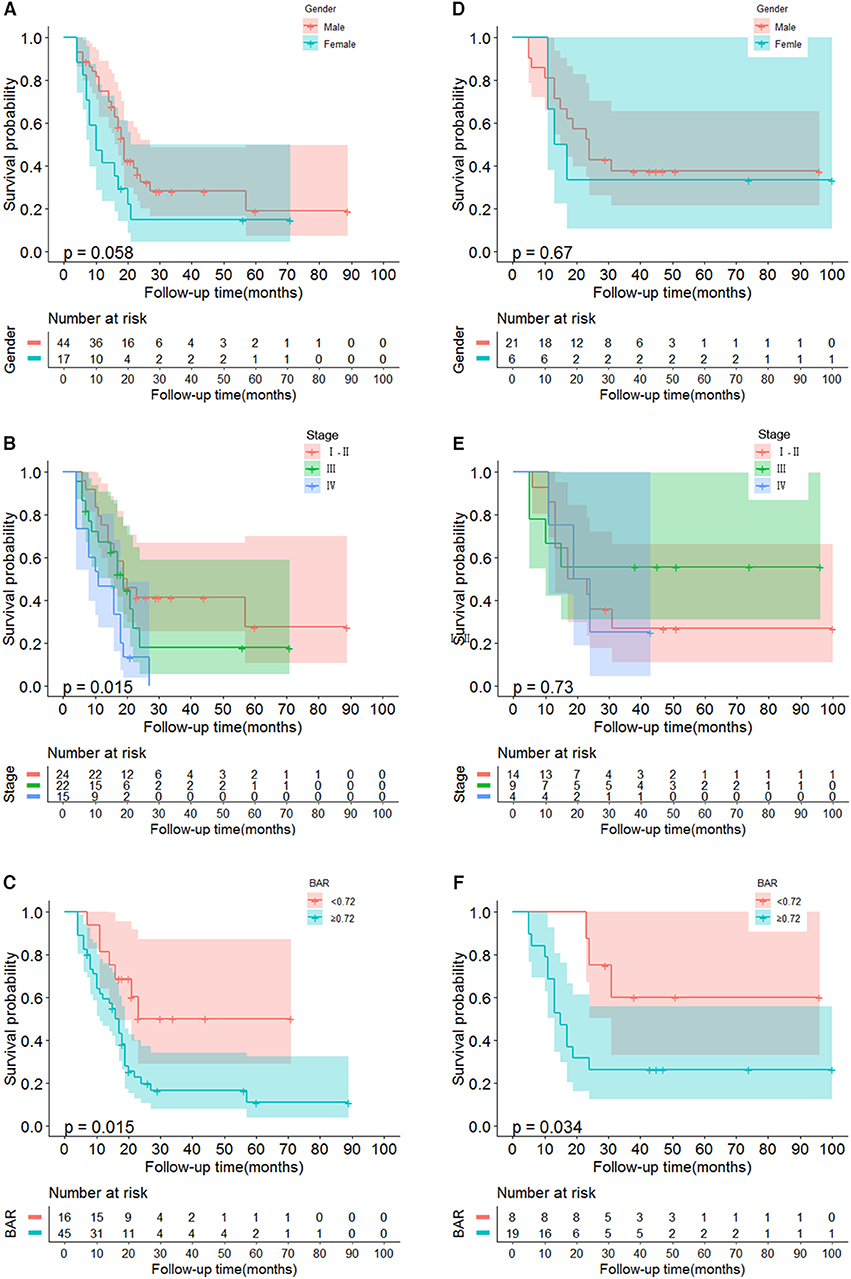
Figure 2. Kaplan-Meier curves for OS in SCCE patients. (A–C) The gender, TNM, BAR in SCCE patients in training cohort are plotted as a distribution. (D–F) The gender, TNM, BAR in SCCE patients in validation cohort are plotted as a distribution. BAR, ApoB/ApoA-1.
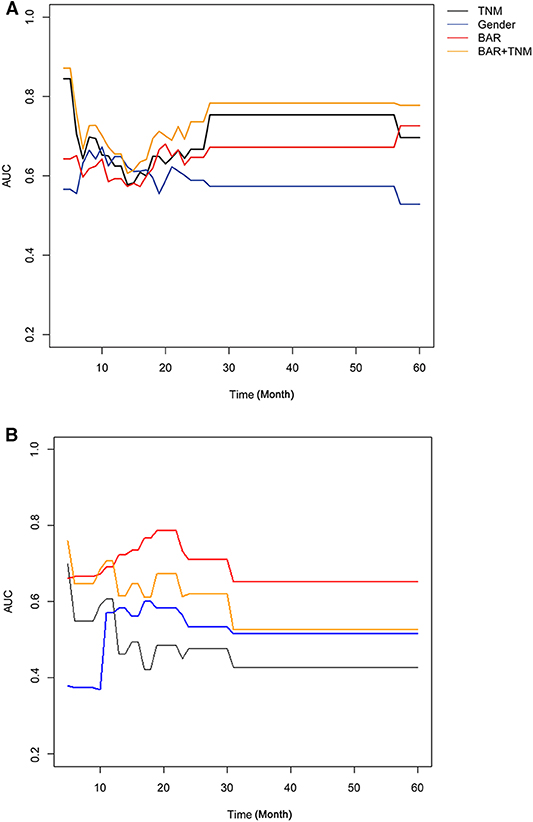
Figure 3. Time-dependent ROC curve for OS in SCCE patients in the training cohort (A) and validation cohort (B). BAR, ApoB/ApoA-1.
To assess whether the BAR had an effect on the prognosis of different treatments, including surgery, surgery plus radiotherapy/chemotherapy, and radiotherapy plus chemoradiotherapy, we applied the same cutoff values mentioned above in all patients (total 88 samples both in the training and validation cohorts owing to the small sample size). They were divided into high- and low-expression groups. As shown in the Figure S2, the significant correlation between BAR expression and prognosis was only observed in patients receiving surgery plus radiotherapy/chemotherapy (P = 0.0041). Moreover, in the surgery plus radiotherapy/chemotherapy group, the high expression of BAR has a poor prognosis.
To predict OS, a nomogram was established by multivariate Cox regression model according to significantly independent factors for OS. The models include gender, TNM stage and BAR (Figure 4). Each prognostic factor has a number of risk points, which can be obtained by drawing a vertical line directly upward from the corresponding value of the prognostic factor to an axis with a “point.” In order to determine the 1-, 3-, and 5-year OS probability of a specific patient from the “Total Points” which is the sum of the risk points, a vertical line can be drawn to the axis marked “1-, 3-, and 5-Year Overall Survival Probability.”
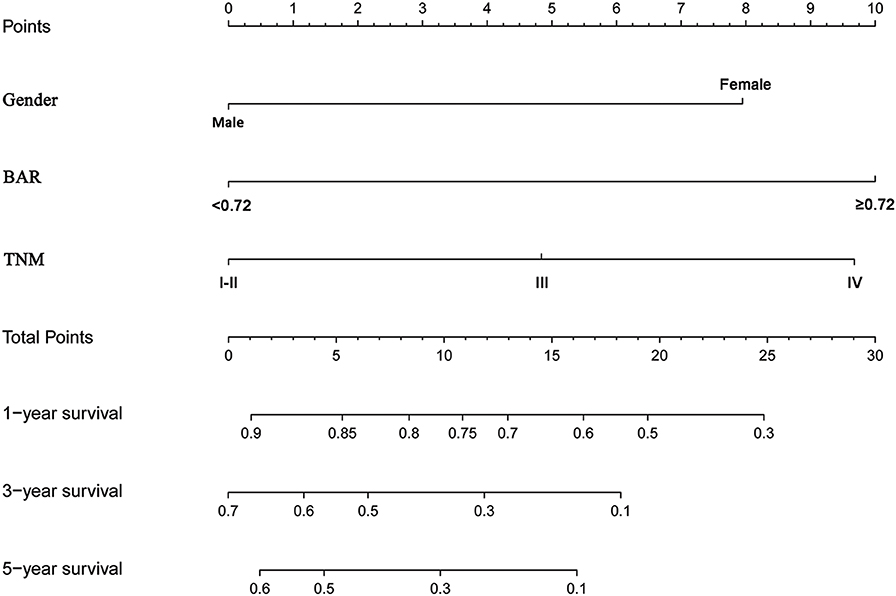
Figure 4. Nomogram model based on gender, BAR and TNM stage in the prediction of 1-, 3-, and 5- year OS in SCCE patients. The nomogram was used by summing the points identified on the points scale for each variable. The total points projected on the bottom scales indicate the probability of 1-, 3-, and 5-year survival. BAR, ApoB/ApoA-1.
Comparison of the predictive accuracy of prognostic factors and conventional staging systems were done using C-index and decision curve analysis for 1-, 3-, and 5-year survival. As shown in Table 3, although in the training cohort, there was no significant difference between gender, BAR, BAR+TNM stage and TNM stage systems (P > 0.05), the C-index of the BAR + TNM stage was better than that of the TNM stage systems alone [0.655 (95% CI = 0.571–0.740) vs. 0.614 (95% CI = 0.530–0.698)]. In the validation cohort, the C-index of the BAR+TNM stage in predicting OS was 0.688 (95% CI: 0.570~0.806), which was higher than that of the TNM system (0.512; 95% CI: 0.392~0.632). In addition, the analysis of the decision curves for 1-, 3-, and 5-year survival rates shows that the current BAR+TNM stage systems seems to have higher prediction accuracy than the TNM stage systems in training cohort. This result was verified in the validation cohort (Figure 5). Due to the small sample size in this study, we combined training and validation cohorts and used net reclassification improvement (IDI) and integrated discrimination improvement (NRI) to evaluate the accuracy of BAR + TNM stage prediction of survival. In Table 4, the NRI suggested that the predictive accuracy of BAR+TNM stage was better than that of the TNM stage system. Furthermore, compared to the TNM stage, IDI shows that the accuracy of the BAR + TNM stage for predicting 1-, 3-, and 5-year OS was improved. To conclude, BAR + TNM stage had better net benefit and predictive accuracy than those of the TNM stage alone.
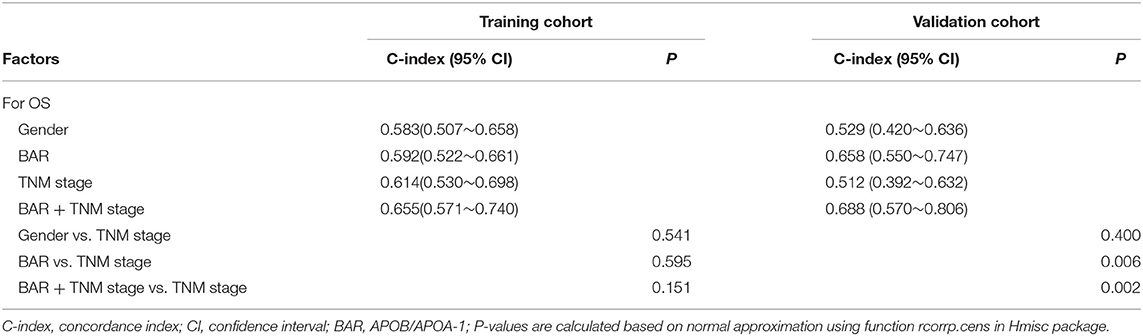
Table 3. The C-index of gender, BAR, TNM stage and BAR+TNM stage for prediction of OS in the SCCE.
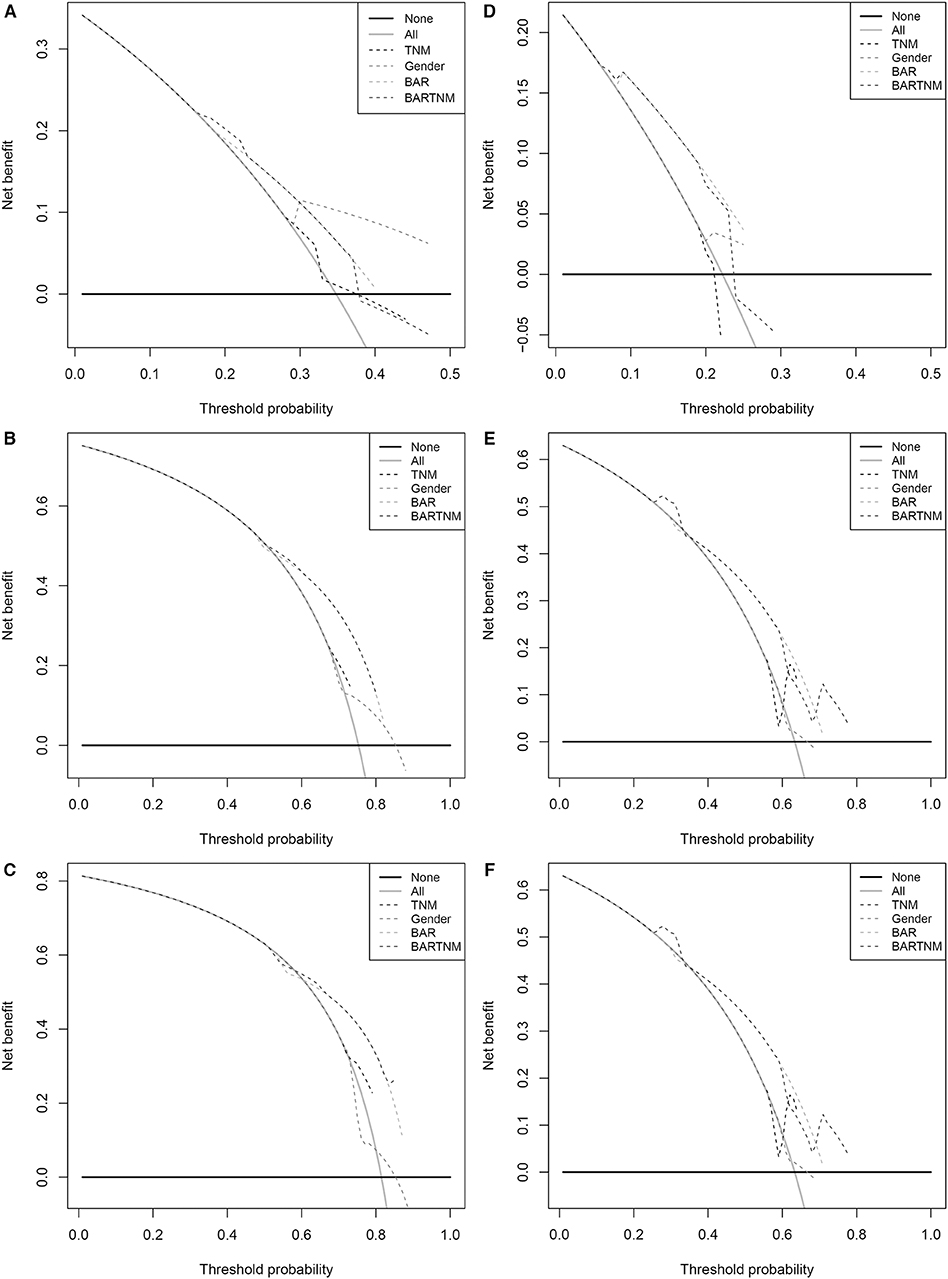
Figure 5. Decision curve analysis the predictive accuracy of BAR for OS in SCCE patients. (A–C) The decision curve of 1- (A), 3- (B), and 5- (C) year OS in training cohort; (D–F) The decision curve of 1-(D), 3- (E), and 5- (F) year OS in validation cohort. BAR, ApoB/ApoA-1.
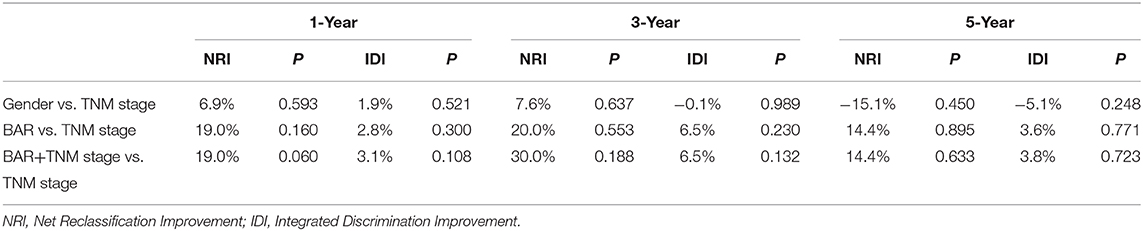
Table 4. A comparison of discriminatory ability of gender, BAR and BAR +TNM stage with TNM stage using NRI and IDI.
In recent years, with the rising incidence of SCCE, increasing studies have focused on SCCE (1, 5, 6). Although tumor stage based on the American Joint Committee on Esophageal Cancer (AJCC) is the primary basis for judging the prognosis of SCCE (24), even at the same stage of SCCE, there is a large difference in OS. The current stage system is based entirely on the anatomical extent of the disease. However, stage systems do not fully reflect the biological heterogeneity of SCCE patients, and other risk factors are not considered in current stage systems. Thus, the current TNM stage system is not sufficient for prognosis of SCCE. It is necessary to find effective and reliable prognostic factors to predict SCCE prognosis and identify individuals with poor prognosis.
In this study, we used univariate analysis and subsequent multivariate analysis to determine gender, BAR, and TNM stage as independent prognostic factors for SCCE patients. In line with the previous studies, TNM stage was significant prognostic markers for resected SCCE patients (24). The age factor does not reflect the impact on survival, which may be related to the high degree of malignancy of SCCE. Next, a nomogram for predicting survival was developed and these three variables were incorporated into the nomogram. There was no statistically significant difference in P-values between the nomogram and the TNM stage, which may be the reason for the limited samples of SCCE. But the C-index of the BAR+TNM stage predicted OS with an accuracy of 0.655, which showed better prediction of OS than the TNM stage system (0.614). Similar results were observed in the validation cohort. At the same time, the decision curve analysis of 1-, 3-, and 5-year survival rates showed that the BAR+TNM stage prediction model had greater clinical application potential than the TNM stage system. Therefore, BAR+TNM stage seems to be more suitable as a prognostic factor for SCEE than TNM stage alone. To our knowledge, this study is the first retrospective analysis of the prognostic role of pretreatment of serum lipids in SCCE. Here, SCCE patients were divided into two risk groups by BAR ratio, and the results showed that when BAR ≥ 0.72 the prognosis was poor. Previous literature has also reported that ApoB/ApoA-1 is an independent prognostic factor for gastric cancer (25). In addition, the BAR assay is relatively inexpensive and routinely performed during preoperative examinations. Therefore, the BAR+TNM stage may be a reliable tool for predicting survival in patients with SCCE and contribute to individualized treatment decisions.
Apolipoprotein is a protein part of plasma lipoprotein, a protein that binds and transports serum lipids to various tissues of the body for metabolism and utilization. ApoA-1-encoded apolipoprotein A-1 (ApoA-1) is a major protein component of high-density lipoprotein (HDL) and plays an important role in the neutralization and clearance of lipopolysaccharide (26), reversible transport of cholesterol (27), inhibition Inflammatory response caused by toxins (28). ApoB is a ligand for low-density lipoprotein (LDL) receptors, which cleans up low-density lipoproteins in the body, participates in the synthesis and secretion of very low-density lipoprotein (VLDL), transports fat and cholesterol (29). Considering the imbalance of lipid metabolism in cancer patients, indicators containing multiple lipids can more accurately and comprehensively reflect changes in serum lipids. A study reports that LDL-C and HDL-C ratios (LHR) are prognostic factors for colorectal cancer patients, providing more prognostic information than single LDL-C or HDL-C (30). In addition, Mazidi et al. studies indicated that the ApoB/ApoA-I ratio might be a useful predictor of the risk for cancer mortality (31). It was also shown that this ratio may even better predict cancer risk than inflammatory markers and lipid biomarkers (31). Therefore, we explored the relationship between ApoB / ApoA-1(BAR) and SCCE prognosis in our study and found that BAR is an independent prognostic factor for SCCE. These findings suggest that the measurement of Apos may have important clinical significance in identifying at-risk populations with fatal cancer disease. And in our study, the prognosis was poor when the BAR ratio was increased. This may be related to a decrease in ApoA-1 levels, as low concentrations of ApoA-1 are closely associated with the development, progression, and prognosis of multiple malignancies (18–21, 31). While ApoB's research focuses on cardiac metabolic disorders, the study found that individuals with higher ApoB levels might have a greater cancer mortality risk (31, 32). Several possible mechanisms can be used to explain the prognostic value of ApoB/ApoA-1 for SCCE. First, studies have shown that low ApoA-1 concentrations inhibit tumor progression through its anti-inflammatory effects (33). ApoA-1 may play an anti-inflammatory role mainly through the binding ability between macrophages and cell phospholipids (33, 34). Lysophosphatidylcholines, such as lysophosphatidic acid (LPA), are the proliferation activators of many tumors, and ApoA-1 can bind with LPA to inhibit the formation of tumors induced by LPA (35). In addition, there is an interaction between ApoA-1 and the body's inflammatory response, which reduces the rate of liver synthesis and secretion of ApoA-1, and serum low ApoA-1 concentration can indirectly lead to increased cytokine release and strong inflammatory response against tumor cells (20, 34, 36). Second, serum lipids inhibit the growth and metastasis of tumor cells by stabilizing the stability of prostaglandin 2 (PGI2) (37). Third, ApoA-1, a potential immunomodulator, converts the tumor-associated macrophage phenotype from a tumor-promoting phenotype (M2 type) to an anti-tumor phenotype (M1 type) (38, 39). Fourth, ApoA-1 inhibits tumor angiogenesis by other means to inhibit tumor growth, but its specific mechanism is not fully understood (40, 41). Fifth, ApoA-1 may participate in the development of tumors by regulating the cholesterol level of cells and participating in the lipid metabolism of cells (42, 43).
Although BAR+TNM stage might be used as a useful tool for clinicians to select and plan treatment strategies for SCCE patients, our research has several limitations. First, our study is a retrospective study with possible bias in the retrospective data collection process. However, because of the extremely low incidence of SCCE, one could envision that it is really hard to conduct a prospective study to evaluate the prognostic value of BAR+TNM stage. What needs to be pointed out is that our results were verified in an independent cohort. Thus, we believe our retrospective study still offers potential application value. Second, since the database used to generate the prognostic factors just consists of patient data from a single cancer center, it is necessary to obtain larger samples from other research institutions to validate the results.
In summary, our findings indicate that convenient serological indicator (i.e., BAR) combined with TNM stage seems to be more accurate in predicting OS than the traditional TNM stage system. It is appealing to imagine that in the SCCE setting, this serum lipid marker could be utilized for disease monitoring and prognostic prediction. In the near future, a large-scale, multicenter validation study is warranted to address the relationship between BAR and SCCE prognosis, and whether this serum markers BAR for the prognosis of SCCE could achieve real clinical benefit needs further verification.
All datasets generated for this study are included in the article/Supplementary Material.
The studies involving human participants were reviewed and approved by Hospital Ethics Committee in Sun Yat-sen University Cancer Center. The patients/participants provided their written informed consent to participate in this study.
HC, L-YC, and X-HL designed the study, searched the literature, collected patient samples and clinical data, analyzed and interpreted the data, and wrote the manuscript. Y-HP, C-TL, and L-RT analyzed and interpreted the data. J-JX designed the study and revised the paper. Y-WX conceptualized and designed the study, supervised the project, and revised the paper. All authors read and approved the final manuscript.
This work was supported by funding from the Natural Science Foundation of China (81972801 to Y-HP), the Natural Science Foundation of Guangdong Province (2018A030307079 to Y-HP and 2019A1515011873 to Y-WX), the Innovative and Strong School Project of Guangdong (2018KTSCX068 to Y-WX) and the Grant for Key Disciplinary Project of Clinical Medicine under the Guangdong High-level University Development Program.
The authors declare that the research was conducted in the absence of any commercial or financial relationships that could be construed as a potential conflict of interest.
We thank the reviewers for critical comments.
The Supplementary Material for this article can be found online at: https://www.frontiersin.org/articles/10.3389/fonc.2020.00610/full#supplementary-material
SCCE, primary small cell carcinoma of the esophagus; OS, overall survival; ROC, receiver operating characteristics; C-index, concordance index; ApoA-1, apolipoprotein A-1; ApoB, apolipoprotein B; BAR, ApoB/ApoA-1 ratios; AUC, area under curves; TC, total cholesterol; TG, triglyceride; HDL-C, high-density lipoprotein cholesterol; LDL-C, low-density lipoprotein cholesterol; CT, computed-tomography; Syn, synaptophysin; NSE, neuron-specific enolase; CgA, chromogranin A; CK, cytokeratin; CD56, lymphocyte antigen 56; BMI, body mass index; PNI, prognostic nutritional index; HR, hazard ratios; CI, 95% confidence intervals; NRI, net reclassification improvement; IDI, integrated discrimination improvement; HDL, high-density lipoprotein; LDL, low-density lipoprotein; VLDL, very low-density lipoprotein; LHR, LDL-C/HDL-C ratios; LPA, lysophosphatidic acid; PGI2, prostaglandin 2.
1. Bray F, Ferlay J, Soerjomataram I, Siegel RL, Torre LA, Jemal A. Global cancer statistics 2018: GLOBOCAN estimates of incidence and mortality worldwide for 36 cancers in 185 countries. CA Cancer J Clin. (2018) 68:394–424. doi: 10.3322/caac.21492
2. Xu X, Yang Y, Cao L, Li F, Zhao J, Guo B, et al. Lymph node metastasis and recurrence in primary small cell Carcinoma of the esophagus: a retrospective study of 125 cases. Cancer Biother Radiopharm. (2019) 34:459–63. doi: 10.1089/cbr.2019.2800
3. Chen WW, Wang F, Zhang DS, Luo HY, Wang ZQ, Wang FH, et al. Primary small cell carcinoma of the esophagus: clinicopathological study of 44 cases. BMC Cancer. (2014) 14:222. doi: 10.1186/1471-2407-14-222
4. McKeown F. Oat-cell carcinoma of the oesophagus. J Pathol Bacteriol. (1952) 64:889–91. doi: 10.1002/path.1700640420
5. Walenkamp AM, Sonke GS, Sleijfer DT. Clinical and therapeutic aspects of extrapulmonary small cell carcinoma. Cancer Treat Rev. (2009) 35:228–36. doi: 10.1016/j.ctrv.2008.10.007
6. Yekeler E, Koca T, Vural S. A rare cause of the cough: primary small cell carcinoma of esophagus-case report. Case Rep Med. (2012) 2012:870783. doi: 10.1155/2012/870783
7. Pantvaidya GH, Pramesh CS, Deshpande MS, Jambhekar NA, Sharma S, Deshpande RK. Small cell carcinoma of the esophagus: the Tata Memorial Hospital experience. Ann Thorac Surg. (2002) 74:1924–7. doi: 10.1016/S0003-4975(02)04061-4
8. Nishimaki T, Suzuki T, Nakagawa S, Watanabe K, Aizawa K, Hatakeyama K. Tumor spread and outcome of treatment in primary esophageal small cell carcinoma. J Surg Oncol. (1997) 64:130–4. doi: 10.1002/(sici)1096-9098(199702)64:2<130::aid-jso8>3.0.co;2-c
9. Hosokawa A, Shimada Y, Matsumura Y, Yamada Y, Muro K, Hamaguchi T, et al. Small cell carcinoma of the esophagus. Analysis of 14 cases and literature review. Hepatogastroenterology. (2005) 52:1738–41.
10. Nayal B, Vasudevan G, Rao AC, Kudva R, Valliathan M, Mathew M, et al. Primary small cell Carcinoma of the esophagus - an eight year retrospective study. J Clin Diagn Res. (2015) 9:EC04–6. doi: 10.7860/JCDR/2015/12464.5927
11. Deng HY, Ni PZ, Wang YC, Wang WP, Chen LQ. Neuroendocrine carcinoma of the esophagus: clinical characteristics and prognostic evaluation of 49 cases with surgical resection. J Thorac Dis. (2016) 8:1250–6. doi: 10.21037/jtd.2016.04.21
12. Rice TW, Rusch VW, Ishwaran H, Blackstone EH, Worldwide Esophageal Cancer C. Cancer of the esophagus and esophagogastric junction: data-driven stage for the seventh edition of the American Joint Committee on Cancer/International Union against Cancer stage manuals. Cancer. (2010) 116:3763–73. doi: 10.1002/cncr.25146
13. Lu JM, Liang J, Wang JW, He J, Xiao ZF, Zhang HX, et al. [Clinical analysis of 126 patients with primary small cell carcinoma of the esophagus]. Zhonghua Zhong Liu Za Zhi. (2009) 31:121–5. doi: 10.3760/cma.j.issn.0253-3766.2009.02.010
14. Zhang Y, Ren H, Wang L, Ning Z, Zhuang Y, Gan J, et al. Clinical impact of tumor-infiltrating inflammatory cells in primary small cell esophageal carcinoma. Int J Mol Sci. (2014) 15:9718–34. doi: 10.3390/ijms15069718
15. Chen WW, Wang F, Chen S, Wang L, Ren C, Luo HY, et al. Detailed analysis of prognostic factors in primary esophageal small cell carcinoma. Ann Thorac Surg. (2014) 97:1975–81. doi: 10.1016/j.athoracsur.2014.02.037
16. Ganjali S, Ricciuti B, Pirro M, Butler AE, Atkin SL, Banach M, et al. High-density lipoprotein components and functionality in cancer: state-of-the-Art. Trends Endocrinol Metab. (2019) 30:12–24. doi: 10.1016/j.tem.2018.10.004
17. Luo X, Cheng C, Tan Z, Li N, Tang M, Yang L, et al. Emerging roles of lipid metabolism in cancer metastasis. Mol Cancer. (2017) 16:76. doi: 10.1186/s12943-017-0646-3
18. Beloribi-Djefaflia S, Vasseur S, Guillaumond F. Lipid metabolic reprogramming in cancer cells. Oncogenesis. (2016) 5:e189. doi: 10.1038/oncsis.2015.49
19. Ceres K, Fitzgerald H, Quiznon KS, McDonough S, Behling-Kelly E. Immunohistochemical labeling of low-density lipoprotein receptor and scavenger receptor Class B type 1 are increased in Canine lymphoma. Front Vet Sci. (2018) 5:340. doi: 10.3389/fvets.2018.00340
20. Georgila K, Vyrla D, Drakos E. Apolipoprotein A-I (ApoA-I), immunity, inflammation and cancer. Cancers. (2019) 11:1097. doi: 10.3390/cancers11081097
21. Lee G, Jeong YS, Kim DW, Kwak MJ, Koh J, Joo EW, et al. Clinical significance of APOB inactivation in hepatocellular carcinoma. Exp Mol Med. (2018) 50:1–12. doi: 10.1038/s12276-018-0174-2
22. Edge SB, Compton CC. The American Joint Committee on Cancer: the 7th edition of the AJCC cancer stage manual and the future of TNM. Ann Surg Oncol. (2010) 17:1471–4. doi: 10.1245/s10434-010-0985-4
23. Camp RL, Dolled-Filhart M, Rimm DL. X-tile: a new bio-informatics tool for biomarker assessment and outcome-based cut-point optimization. Clin Cancer Res. (2004) 10:7252–9. doi: 10.1158/1078-0432.CCR-04-0713
24. Wang SY, Mao WM, Du XH, Xu YP, Zhang SZ. The 2002 AJCC TNM classification is a better predictor of primary small cell esophageal carcinoma outcome than the VALSG stage system. Chin J Cancer. (2013) 32:342–52. doi: 10.5732/cjc.012.10161
25. Ma MZ, Yuan SQ, Chen YM, Zhou ZW. Preoperative apolipoprotein B/apolipoprotein A1 ratio: a novel prognostic factor for gastric cancer. Onco Targets Ther. (2018) 11:2169–76. doi: 10.2147/OTT.S156690
26. Guo L, Ai J, Zheng Z, Howatt DA, Daugherty A, Huang B, et al. High density lipoprotein protects against polymicrobe-induced sepsis in mice. J Biol Chem. (2013) 288:17947–53. doi: 10.1074/jbc.M112.442699
27. van der Vorst EPC. High-density Lipoproteins and Apolipoprotein A1. Subcell Biochem. (2020) 94:399–420. doi: 10.1007/978-3-030-41769-7_16
28. Ahmed HM, Miller M, Nasir K, McEvoy JW, Herrington D, Blumenthal RS, et al. Primary low level of high-density lipoprotein cholesterol and risks of coronary heart disease, Cardiovascular disease, and death: results from the multi-ethnic study of Atherosclerosis. Am J Epidemiol. (2016) 183:875–83. doi: 10.1093/aje/kwv305
29. Morita SY. Metabolism and modification of Apolipoprotein B-containing lipoproteins involved in Dyslipidemia and Atherosclerosis. Biol Pharm Bull. (2016) 39:1–24. doi: 10.1248/bpb.b15-00716
30. Liao F, He W, Jiang C, Yin C, Guo G, Chen X, et al. A high LDL-C to HDL-C ratio predicts poor prognosis for initially metastatic colorectal cancer patients with elevations in LDL-C. Onco Targets Ther. (2015) 8:3135–42. doi: 10.2147/OTT.S90479
31. Mazidi M, Katsiki N, Mikhailidis DP, Radenkovic D, Pella D, Banach M. Apolipoprotein B/Apolipoprotein A-I ratio is a better predictor of cancer mortality compared with C-reactive protein: results from two multi-ethnic US populations. J Clin Med. (2020) 9:E170. doi: 10.3390/jcm9010170
32. Atchison EA, Gridley G, Carreon JD, Leitzmann MF, McGlynn KA. Risk of cancer in a large cohort of US veterans with diabetes. Int J Cancer. (2011) 128:635–43. doi: 10.1002/ijc.25362
33. Penson PE, Long DL, Howard G, Toth PP, Muntner P, Howard VJ, et al. Associations between very low concentrations of low density lipoprotein cholesterol, high sensitivity C-reactive protein, and health outcomes in the reasons for geographical and racial differences in stroke (REGARDS) study. Eur Heart J. (2018) 39:3641–53. doi: 10.1093/eurheartj/ehy533
34. Sathiyakumar V, Kapoor K, Jones SR, Banach M, Martin SS, Toth PP. Novel therapeutic targets for managing Dyslipidemia. Trends Pharmacol Sci. (2018) 39:733–47. doi: 10.1016/j.tips.2018.06.001
35. Su F, Kozak KR, Imaizumi S, Gao F, Amneus MW, Grijalva V, et al. Apolipoprotein A-I (apoA-I) and apoA-I mimetic peptides inhibit tumor development in a mouse model of ovarian cancer. Proc Natl Acad Sci USA. (2010) 107:1997–2002. doi: 10.1073/pnas.1009010107
36. Camont L, Chapman MJ, Kontush A. Biological activities of HDL subpopulations and their relevance to cardiovascular disease. Trends Mol Med. (2011) 17:594–603. doi: 10.1016/j.molmed.2011.05.013
37. Feng W, Gao X, McClung G, Zhu S, Ishihara K, Brash JL. Methacrylate polymer layers bearing poly(ethylene oxide) and phosphorylcholine side chains as non-fouling surfaces: in vitro interactions with plasma proteins and platelets. Acta Biomater. (2011) 7:3692–9. doi: 10.1016/j.actbio.2011.06.007
38. Zamanian-Daryoush M, Lindner D, Tallant TC, Wang Z, Buffa J, Klipfell E, et al. The cardioprotective protein apolipoprotein A1 promotes potent anti-tumorigenic effects. J Biol Chem. (2013) 288:21237–52. doi: 10.1074/jbc.M113.468967
39. Zamanian-Daryoush M, DiDonato JA. Apolipoprotein A-I and cancer. Front Pharmacol. (2015) 6:265. doi: 10.3389/fphar.2015.00265
40. Tan JT, Ng MK, Bursill CA. The role of high-density lipoproteins in the regulation of angiogenesis. Cardiovasc Res. (2015) 106:184–93. doi: 10.1093/cvr/cvv104
41. Gao F, Vasquez SX, Su F, Roberts S, Shah N, Grijalva V, et al. L-5F, an apolipoprotein A-I mimetic, inhibits tumor angiogenesis by suppressing VEGF/basic FGF signaling pathways. Integr Biol (Camb). (2011) 3:479–89. doi: 10.1039/c0ib00147c
42. Smith B, Land H. Anticancer activity of the cholesterol exporter ABCA1 gene. Cell Rep. (2012) 2:580–90. doi: 10.1016/j.celrep.2012.08.011
Keywords: ApoB/ApoA-1, Primary small cell carcinoma of the esophagus, prognosis, predictor, serum lipid
Citation: Chen H, Chu L-Y, Li X-H, Peng Y-H, Liu C-T, Tian L-R, Xie J-J and Xu Y-W (2020) ApoB/ApoA-1 Ratio as a Novel Prognostic Predictor in Patients With Primary Small Cell Carcinoma of the Esophagus. Front. Oncol. 10:610. doi: 10.3389/fonc.2020.00610
Received: 01 February 2020; Accepted: 03 April 2020;
Published: 24 April 2020.
Edited by:
Samuel J. Klempner, Massachusetts General Hospital Cancer Center, United StatesReviewed by:
Joseph Willis, Case Western Reserve University, United StatesCopyright © 2020 Chen, Chu, Li, Peng, Liu, Tian, Xie and Xu. This is an open-access article distributed under the terms of the Creative Commons Attribution License (CC BY). The use, distribution or reproduction in other forums is permitted, provided the original author(s) and the copyright owner(s) are credited and that the original publication in this journal is cited, in accordance with accepted academic practice. No use, distribution or reproduction is permitted which does not comply with these terms.
*Correspondence: Yi-Wei Xu, eWl3ZWk1MTJAMTI2LmNvbQ==
†These authors have contributed equally to this work
Disclaimer: All claims expressed in this article are solely those of the authors and do not necessarily represent those of their affiliated organizations, or those of the publisher, the editors and the reviewers. Any product that may be evaluated in this article or claim that may be made by its manufacturer is not guaranteed or endorsed by the publisher.
Research integrity at Frontiers
Learn more about the work of our research integrity team to safeguard the quality of each article we publish.