
95% of researchers rate our articles as excellent or good
Learn more about the work of our research integrity team to safeguard the quality of each article we publish.
Find out more
ORIGINAL RESEARCH article
Front. Oncol. , 13 May 2020
Sec. Radiation Oncology
Volume 10 - 2020 | https://doi.org/10.3389/fonc.2020.00609
 Sang-Won Kang1,2
 Jin-Beom Chung3*Kyeong-Hyeon Kim1,2Ji-Yeon Park4Hae-Jin Park5Woong Cho6Sven Olberg7,8
 Tae Suk Suh1,2*Justin C. Park7,8
Purpose: This study aimed to develop a volumetric independent dose calculation (vIDC) system for verification of the treatment plan in image-guided adaptive brachytherapy (IGABT) and to evaluate the feasibility of the vIDC in clinical practice with simulated cases.
Methods: The vIDC is based on the formalism of TG-43. Four simulated cases of cervical cancer were selected to retrospectively evaluate the dose distributions in IGABT. Some reference point doses, such as points A and B and rectal points, were calculated by vIDC using absolute coordinate. The 3D dose volume was also calculated to acquire dose-volume histograms (DVHs) with grid resolutions of 1.0 × 1.0 (G1.0), 2.5 × 2.5 (G2.5), and 0.5 × 0.5 mm2 (G0.5). Dosimetric parameters such as D90% and D2cc doses covering 90% of the high-risk critical target volume (HR-CTV) and 2 cc of the organs at risk (OARs) were obtained from DVHs. D90% also converted to equivalent dose in 2-Gy fractions (EQD2) to produce the same radiobiological effect as external beam radiotherapy. In addition, D90% was obtained in two types with or without the applicator volume to confirm the effect of the applicator itself. Validation of the vIDC was also performed using gamma evaluation by comparison with Monte Carlo simulation.
Results: The average percentage difference of point doses was <2.28%. The DVHs for the HR-CTV and OARs showed no significant differences between the vIDC and the treatment planning system (TPS). Without considering the applicator volume, the D90% of the HR-CTV calculated by the vIDC decreases with a decreasing calculated dose-grid size (32.4, 5.65, and −2.20 cGy in G2.5, G1.0, and G0.5, respectively). The overall D90% is higher when considering the applicator volume. The converted D90% by EQD2 ranged from −1.29 to 1.00%. The D2cc of the OARs showed that the averaged dose deviation is <10 cGy regardless of the dose-grid size. Based on gamma analysis, the passing rate was 98.81% for 3%/3-mm criteria.
Conclusion: The vIDC was developed as an independent dose verification system for verification of the treatment plan in IGABT. We confirmed that the vIDC is suitable for second-check dose validation of the TPS under various conditions.
Image-guided adaptive brachytherapy (IGABT) based on magnetic resonance images (MRIs) has been introduced as a new standard technique to improve the treatment outcome in cervical cancer (1–6). IGABT delivers a high dose with a small number of fractions after external beam radiotherapy (EBRT). The treatment plan of IGABT is optimized by using dosimetric parameters to meet dose constraints for the organs at risk (OARs) and high-risk clinical target volume (HR-CTV). The dose constraints are normalized to the equivalent dose in 2-Gy fractions (EQD2) to produce the same radiobiological effect as in EBRT. Furthermore, IGABT based on MRIs is more advantageous in the delineation of a region of interest (ROI) such as the HR-CTV and OARs than is high-dose-rate brachytherapy (BTHDR) based on computed tomography (CT) images (7, 8). Because compensation of IGABT for treatment outcomes is difficult, it is more important to generate the correct treatment plan and to deliver accurate doses than with other conventional treatments (9). Thus, at each fraction, IGABT requires re-optimization of the treatment plan and re-defining of the ROIs. Furthermore, the re-optimized treatment plan should be validated for safe and accurate delivery (10).
In general, verification of treatment plan in brachytherapy is performed by comparing the point doses calculated using the treatment planning system (TPS) and an independent dose calculation (IDC) system (11, 12). In the previous studies, various IDC systems were reported (13–16). Formalism of the American Association of Physicists in Medicine Task Group 43 (AAPM TG-43) is usually used to calculate the point doses via templates or were spreadsheet based in these systems. However, these point-dose comparisons alone were not sufficient for the verification of IGABT.
For better validation in IGABT, dosimetric parameters should be calculated using an IDC system. Some commercialized IDC systems, such as BrachyCheck (ROS, California, USA) and DIAMOND for Brachytherapy (PTW, Freiburg, Germany), were recently introduced. BrachyCheck can only calculate a dose-volume histogram (DVH). In addition, DIAMOND calculates point dose and 3D dose distributions, but in order to perform 3D analysis, the dose file must be exported to other analysis software. To solve inconveniences in these commercialized IDC systems, Xianliang et al. reported dose verification software (DVS) that can calculate the point dose and the dosimetric parameters (17). The DVS also utilizes the gamma evaluation, but there are some limitations. In the DVS, the calculation method for the direction of the source is inaccurate in the ring applicator because they defined the source vectors by connecting the existing source dwell-position and next source dwell-position. Moreover, it can use only fixed dose-grid size (1.0 × 1.0 mm2). Therefore, we aimed to develop a volumetric IDC (vIDC) tool suitable for IGABT verification. In the vIDC, the method of determining the direction of the source will be improved, and various dose-grid sizes will be available for selection. We will also add some functions to the vIDC. Firstly, the dosimetric parameters of the HR-CTV will allow the calculation of two types (HR-CTVW or HR-CTVW/O) with or without applicator volume, and secondly, the calculated 3D dose volumes will be able to be convert to EQD2 to account for the radiobiological effect caused by EBRT.
In brachytherapy, it is important to accurately calculate the source position and orientation to improve the accuracy of dose calculations for tandem-and-ring applicators. The vIDC can calculate the appropriate direction of sources in the ring applicator, as shown in Figure 1. To calculate the source direction for the ring applicator, the vIDC obtains various plane vectors of the ring by using three sources' positions. Then, the vIDC selects an appropriate plane vector with analysis of the root mean square error (RMSE) between each source's position and the calculated plane vector. The ring equation of the sphere is obtained using the source positions and the selected plane vector (step 1). The vector direction of each source is calculated by using the tangent between the obtained ring equation and source position (step 2).
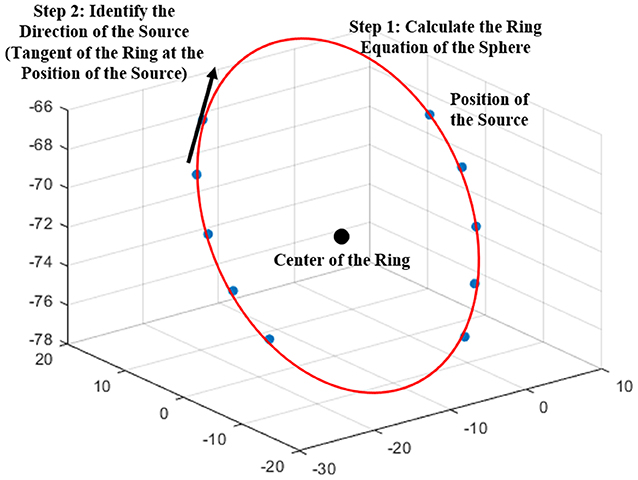
Figure 1. Coordinate system for determining the source direction.
The dose calculation for the vIDC was based on the AAPM TG-43U1 formalism. The formalism is classified as a point and line source model, according to the method of source modeling. The line source model was used in the vIDC, and the equation of the model was as follows:
where r is the distance from the center of an active source to a point of interest and θ is the polar angle between the source longitudinal axis and the line that connects the center of the active source and the point of interest. The r0 and the θ0 denote the reference distance (1 cm) and angle (90°), respectively. The air kerma strength (unit: cGy·cm2·h−1, 1 U = 1 cGy·cm2·h−1), dose-rate constant (unit: cGy·h−1·U−1), geometry factor, radial-dose function, and anisotropy function are represented as SK, Λ, G(r, θ), g(r), and F(r, θ), respectively. Each value of SK and Λ is defined in the TPS, while g(r) and F(r, θ) are provided by the manufacturer of the source. The default grid size of the vIDC was 1.0 × 1.0 mm2 grid (G1.0). It is also possible to select various grid sizes, such as 2.5 × 2.5 (G2.5) and 0.5 × 0.5 (G0.5) mm2 grids.
The calculated dosimetric parameters are converted to EQD2 parameters for evaluating the radiobiological effect of the treatment plan in conjunction with EBRT. EQD2 is calculated as follows:
A biologically effective dose (BED) is obtained for calculating EQD2. The BED is used for isoeffective dose calculations, which means that the true biological dose delivered is measured. Each n and d is presented as the number of fractions and dose per fraction, respectively. The α/β ratio means the ratio of “intrinsic radiosensitivity” to “repair capability” of a specified tissue, and it was presented in this paper as the tumor (α/β ratio = 10) and OARs (α/β ratio = 3).
In order to examine the efficiency of the functions and the clinical feasibility for the vIDC, we retrospectively evaluated with simulated cases treated using IGABT. Four simulated cases with squamous cell carcinoma of the cervix were treated with IGABT using an 192Ir HDR source and adapted a tandem-and-ring technique. These cases were approved by the Institutional Review Board (IRB). Treatment plans were generated with the Oncentra Brachy (Elekta, Stockholm, Sweden) TPS, and the 3D dose volume was calculated with a grid size of 1.0 × 1.0 mm2.
As in EBRT, the dosimetric parameters are used as criteria of the treatment plan (Table 1). The criteria are defined as the doses covering 90% of the HR-CTV and 2-cc volumes of each OAR (D90% and D2cc, respectively). All plans were re-optimized with appropriate dose criteria according to the variation in anatomy and applicator location before treatment.
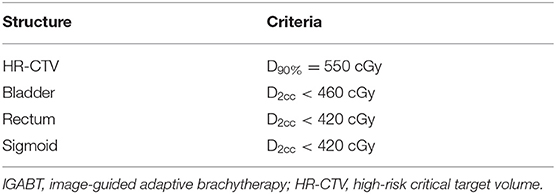
Table 1. The dose criteria used in the simulated IGABT cases.
The point doses at points A and B and the rectum were also calculated to verify the accuracy of dose calculation using the vIDC by comparison with results calculated by the TPS. Point A is defined as 2.0 cm superior to the lateral vaginal fornix and 2.0 cm lateral to the cervical canal. Point B indicates a position 2.0 cm superior to the ring surface and 5.0 cm lateral to the midline. Point A represents dose limits that are delivered to the uterine cervix, whereas point B is used to evaluate the lateral spread of the effective doses, such as nearby doses in the pelvic wall and obturator node. The rectal point dose represents a delivered dose in the rectum. The reference point dose of the TPS was compared with that of the vIDC by using the percentage difference (%diff).
Validation of vIDC was performed with Monte Carlo (MC) simulations using GATE (Geant4 Application for Tomographic Emission, Version 8.1). The grid size in MC was 1.0 × 1.0 mm2, and the 192Ir source (HDR 192Ir mHDR-v2) has been modeled, as described by Granero et al. (18). A virtual treatment plan that included a tandem-and-ring technique was established within the simulated water phantom. The plan was imported into the TPS and the vIDC, and the respective calculation engine was used to obtain the dose distribution in the axis plane of the ring applicator's center. With gamma evaluation, dose distributions calculated by the TPS and the vIDC were compared with the MC results.
Figure 2 shows all dose distributions calculated by MC, TPS, and vIDC. These distributions were normalized with the maximum dose. With gamma analysis, the passing rates of TPS and vIDC were 98.25% and 98.81% for 3%/3-mm criteria, respectively, through comparison with the calculated dose distribution by MC.
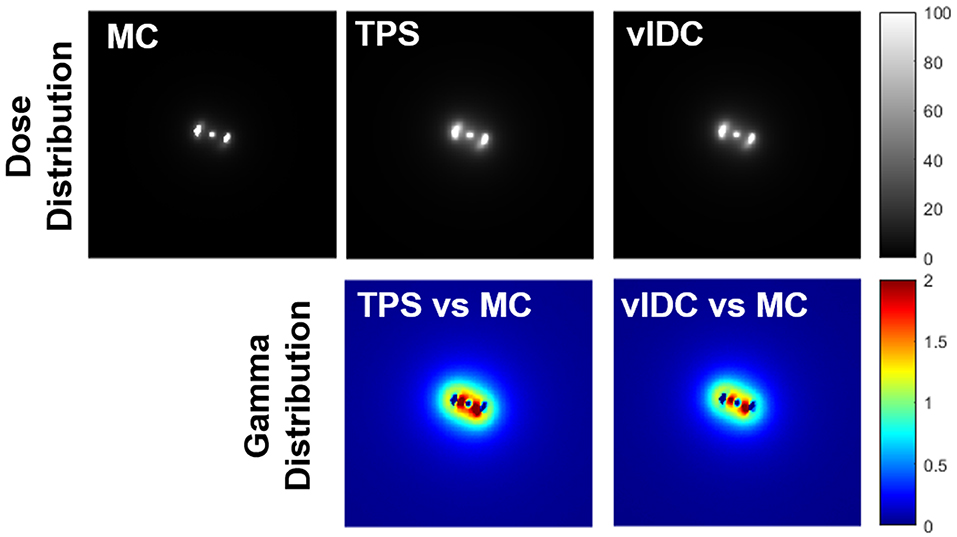
Figure 2. All dose distributions calculated by Monte Carlo (MC), treatment planning system (TPS), and volumetric independent dose calculation (vIDC) system. These dose distributions were analyzed with gamma evaluation using 3%/3-mm criteria.
Table 2 shows the percentage differences in the calculated point doses between TPS and vIDC at the reference points to evaluate the accuracy of the developed vIDC. All average percentage differences of vIDC were < -2.28% at reference points of the same absolute coordinates, compared with the clinical TPS.
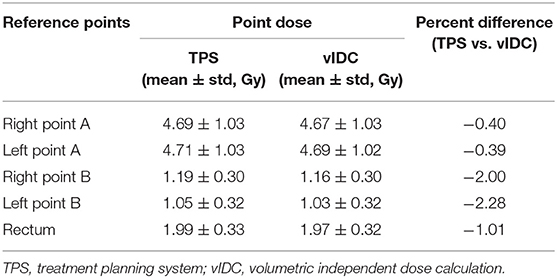
Table 2. The calculated point doses and percentage differences by using TPS and vIDC for five reference points.
The vIDC facilitated comprehensive 3D dose evaluations for clinical use, even when the G1.0 was used. Figure 3 shows averaged DVHs from the calculated 3D dose volumes by the vIDC and TPS using the same dose-grid size of 1.0 mm (G1.0). As shown in Figure 3, no dose differences were observed for the HR-CTVW/O, bladder, and sigmoid in the DVHs. However, a dose difference with a high-dose range exceeding 1,000 cGy occurred in HR-CTVW. In addition, a dose difference of <10 cGy was observed at the same volume in the intermediate dose range for the rectum.
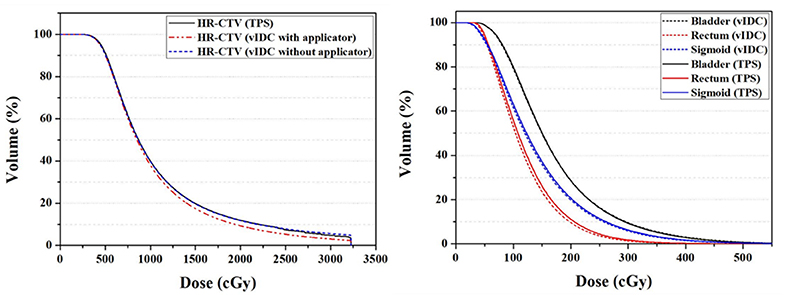
Figure 3. Averaged DVHs of HR-CTV (left) and OARs (right) from vIDC and TPS using 1.0-mm dose-grid size (G1.0). DVHs, dose-volume histograms; HR-CTV, high-risk critical target volume; OARs, organs at risk; vIDC, volumetric independent dose calculation; TPS, treatment planning system.
Table 3 shows the dosimetric parameters between the vIDC and TPS for the HR-CTV with or without the applicator volume for various dose-grid sizes. The volumes of the HR-CTV calculated by the vIDC were decreased by decreasing the dose-grid size, as shown in Table 3. The target volume calculated with G2.5 was larger in the vIDC than TPS. The minimum absolute percentage difference for the target volume was 1.43% in HR-CTVW/O calculated with G1.0. The percentage difference for the dosimetric parameter also decreases by decreasing the dose-grid size. For the G2.5, the differences of D100% and D90% were more than −6%. The differences decreased to −3.42 and −0.44% when G0.5 was used. The standard deviations for both evaluated dosimetric parameters were within 40 cGy for D100% and 23 cGy for D90%. Overall, the standard deviations were similar for the vIDC and TPS regardless of grid sizes. In addition, the D100% values of vIDC were the same in HR-CTVW and HR-CTVW/O. However, all standard deviations of D90% used the same grid size were higher in HR-CTVW/O than HR-CTVW. The differences of D90% were also greater in HR-CTVW/O.
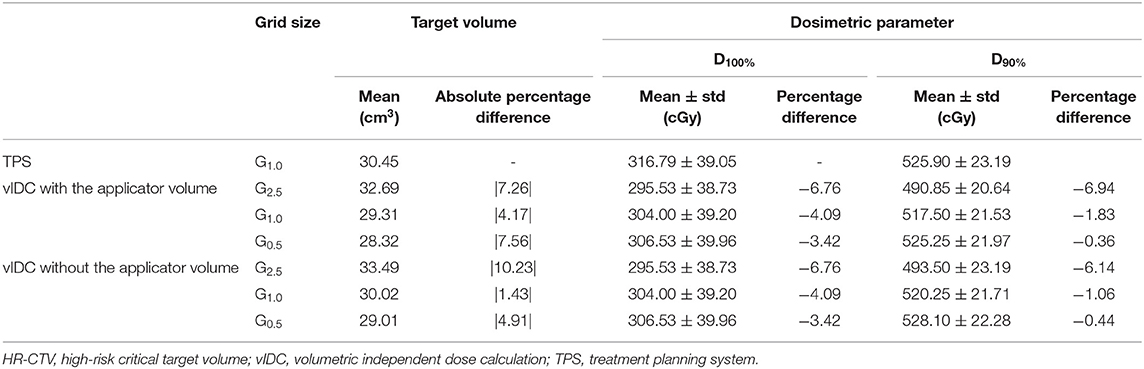
Table 3. The percentage difference of dose and volume for the HR-CTV between vIDC using three dose grid sizes with or without the applicator volume and TPS using G1.0.
Table 4 indicates the dosimetric parameters and volumes calculated with the TPS and vIDC for all OARs such as the bladder, rectum, and sigmoid under the condition of various dose-grid sizes. All OARs were acceptable for the D2cc dose criterion shown in Table 1. For the calculated volumes for all OARs, the smallest difference (<1.82%) compared with that in vIDC and TPS was observed in the G1.0 used in TPS. The volume differences for all OARs in the other grid were more than 4% for G0.5 and 8% for G2.5. Compared with the dosimetric parameters of TPS using G1.0, all evaluated parameters of vIDC for the bladder and sigmoid have dose differences within ~-3% for G0.5 and G1.0, but there was a difference of more than −4% for G2.5. On the contrary, there was a dose difference for the rectum of < -3% for G2.5 and more than −4% for G0.5 and G1.0.
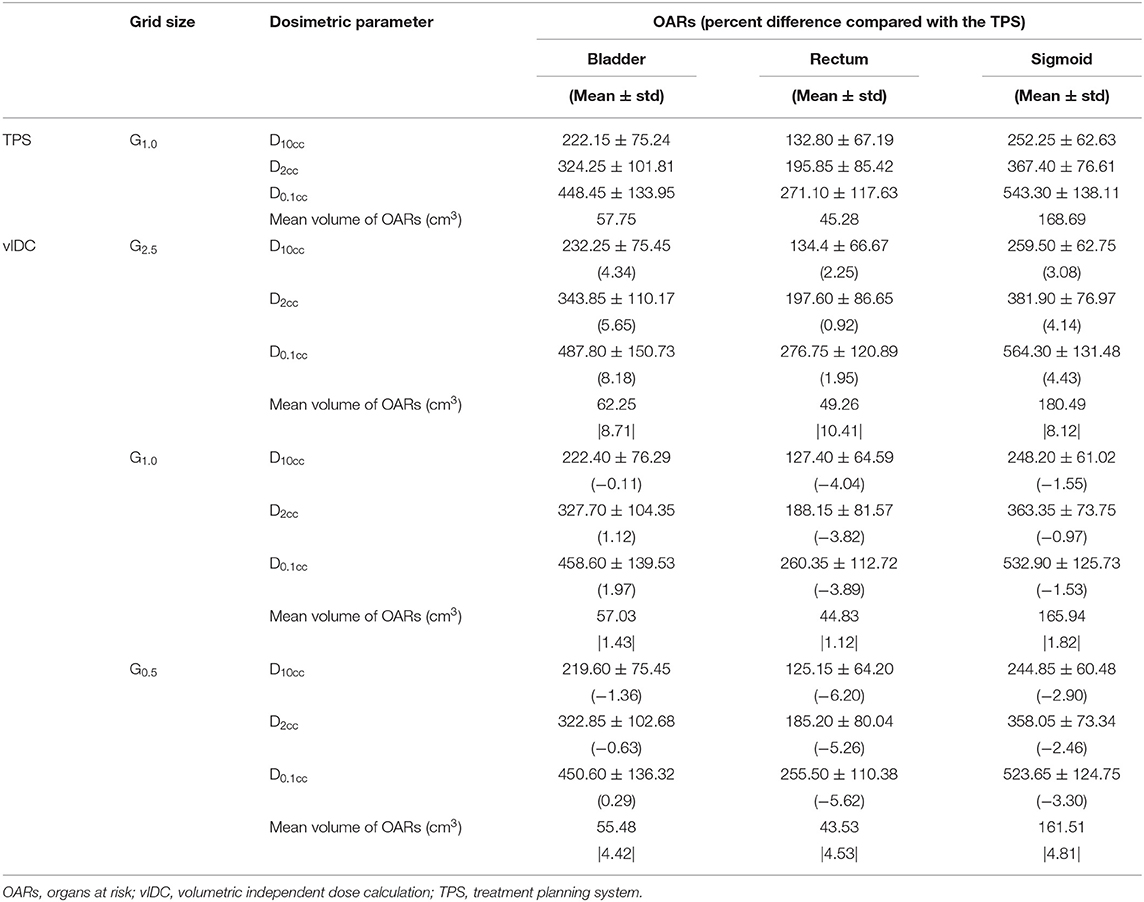
Table 4. The percentage differences of doses and volumes for the OARs between vIDC using three dose grid sizes and TPS using G1.0.
In order to evaluate the radiobiological effect, the EQD2 of dosimetric parameters for the HR-CTV and OARs was analyzed in each faction. Table 5 shows the EQD2 for the HR-CTV and OARs in each fraction for one simulated case. For HR-CTVW/O, EQD2 differences in D90% calculated using the vIDC and TPS ranged from −1.00 to 1.29%. For each fraction, the differences of EQD2 for dosimetric parameters were higher in OARs than HR-CTVW/O. The maximum difference of EQD2 was −9.15% in the sigmoid and was observed in D0.1cc of the first fraction.
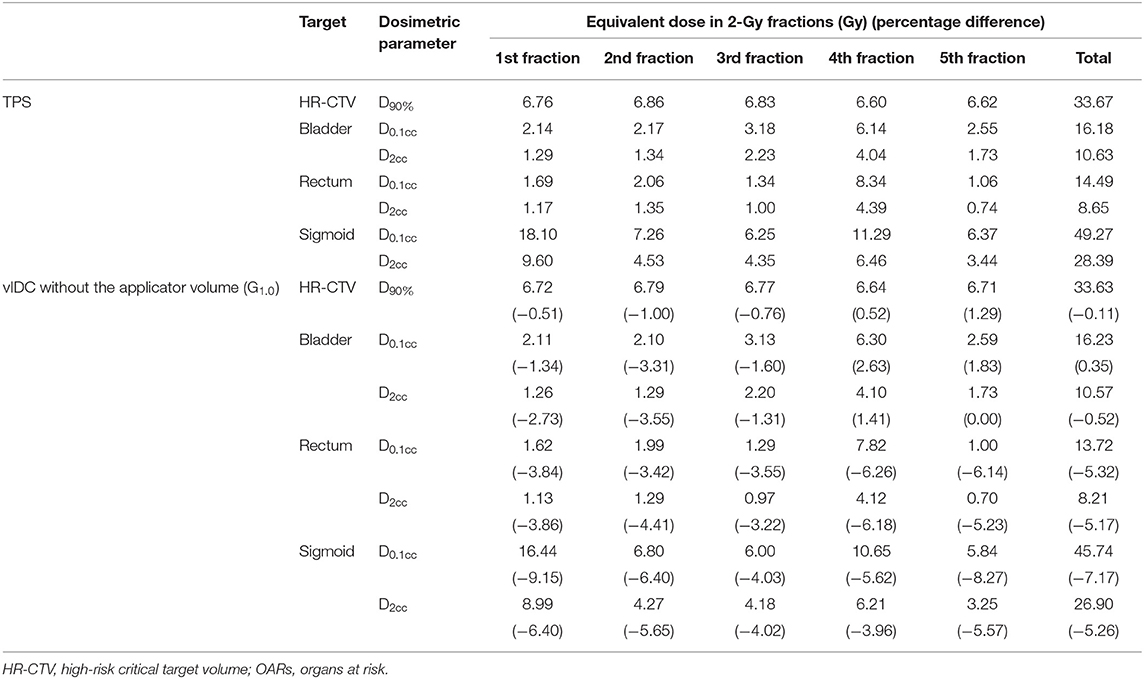
Table 5. Equivalent dose in 2-Gy fractions (EQD2) in dosimetric parameters for HR-CTV and OARs in each fraction.
The source direction determined by Xianliang et al. (17) was obtained by connecting each source's position. This method is not suitable for obtaining accurate source direction, especially in using ring applicators. Therefore, we initially calculated the sphere's ring equation, and then we calculated the source direction using the tangent of the sphere equation at each source position. We showed the point doses in reference points and the doses in dosimetric parameters calculated by Xianliang's method in Tables 6, 7. For five reference points, the point doses using the vIDC were similar with those obtained with by Xianliang's method. In addition, the doses of dosimetric parameters calculated by Xianliang's method and the vIDC using G1.0 show significant differences, as shown in Table 7. Overall, the dose percentage differences of dosimetric parameters are higher in Xianliang's method than vIDC. In particular, the percentage difference in D90% increased ~3 times (1.83% for the vIDC and to 5.55% for Xianliang's method) compared with the dose calculated with TPS. The percentage differences also increased with the other dosimetric parameters for OARs. However, the percentage difference compared with TPS was found to be smaller in vIDC than Xianliang's method. Thus, we can conclude that the tangential method used in this study is more accurate than Xianliang's method. Maybe this method can be applied to conventional brachytherapy.
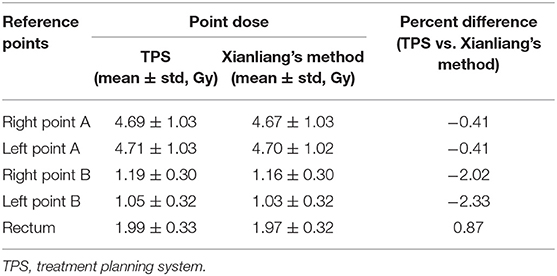
Table 6. The calculated point doses and percentage differences by using TPS and Xianliang's method for five reference points.
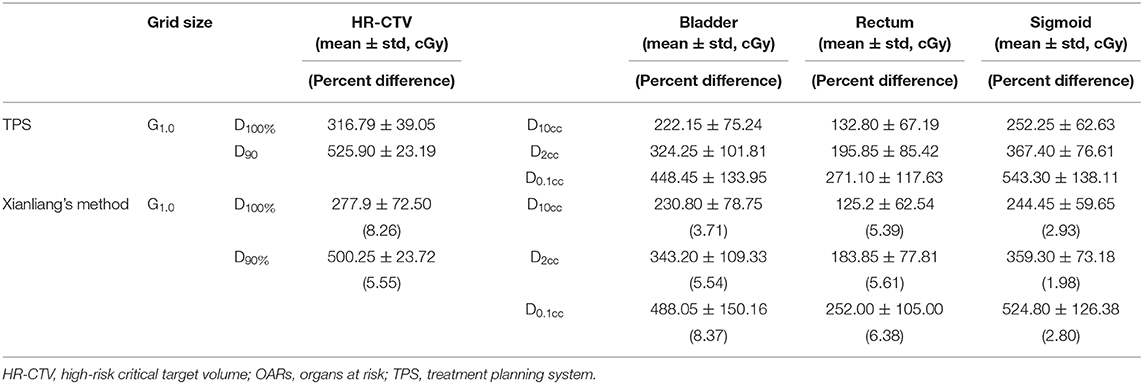
Table 7. The dose and percentage differences in dosimetric parameters for HR-CTV and OARs by using Xianliang's method and TPS.
Compared with the calculated point dose with TPS, the calculated point doses with vIDC at the right and left point B were the dose percentage difference of more than −1%. However, these differences cannot be defined as the inaccuracy of dose calculation by vIDC, because there was a small difference in the calculated doses between the vIDC and TPS. The average dose differences between vIDC and TPS for all reference points were <0.03 Gy. Therefore, it is indicated that the dose calculations obtained with the vIDC are accurate on the basis of the dose differences.
For the effect of grid size, the percentage difference in doses of all dosimetric parameters for OARs was the smallest in G1.0 used in TPS. On the other hand, D100% and D90% for the target volume had the smallest percentage difference with G0.5 regardless of whether applicator volume was used. The difference is probably influenced by the dose gradient of the contoured ROI. As the dose-grid size decreases, accurate dose verification is possible, especially in regions with steep dose gradients. However, the dose difference between G1.0 and G0.5 is relatively small (<10 cGy) and can be neglected. Moreover, when the dose-grid size becomes two times smaller, the time required for dose calculation increases four times. Therefore, we recommend determining the dose-grid size, taking into account the desired dose calculation accuracy and existing time constraints.
In this study, we noted the dosimetric difference due to the applicator volume. Potter et al. (19) reported that the applicator volume does not affect the dosimetric parameters if the target volume is sufficiently larger than the applicator volume. However, the authors also mentioned that this dosimetric effect of the applicator volume needs to be investigated because it has not been clearly established. Thus, we demonstrated the dosimetric effect with and without applicator volume using the vIDC, and there was almost no the dosimetric effect, as shown in Table 3. The dose differences were <4 cGy in all D90. On the basis of our results, we confirmed that the dosimetric effect does not need to be considered when the volume of the HR-CTV is sufficiently large, such as cervical cancer cases.
IGABT is known to improve treatment efficiency by delivering additional dose to local lesion control after EBRT. The IGABT is usually used at high doses (D90% of HR-CTV > 550 cGy) in low fractions (<5 fractions) using the 192Ir source with an average energy of 0.38 MeV. In contrast, the EBRT delivers normally the total dose of 45 Gy in 1.8 Gy per fraction delivered using a high-energy photon beam (20, 21). Because of the characteristic difference of these delivery doses, it is difficult to accurately determine the same radiobiological effect between IGABT and EBRT for treatment dose. Therefore, the prescribed doses in each treatment were determined by conversion to EQD2 to enable accurate optimization of the delivered doses. In our study, radiobiological evaluation was performed by calculating EQD2, and this evaluation will enable safer and more accurate treatment.
Gamma evaluation analyzed with MC simulation results was able to verify the vIDC. The gamma passing rate has no difference, although slightly better in vIDC than TPS. The point dose and dosimetric parameters of the vIDC indicated similarities with the TPS. In view of these results, we confirmed that the vIDC has almost the same performance as TPS. Thus, our vIDC can be used to validate the treatment plan as a second dose check that re-calculates the treatment plan and detects errors in the TPS. In this study, however, the vIDC was only evaluated in the tandem-and-ring cases. We will validate this vIDC in other treatment cases for clinical application in a future study.
The vIDC was developed for use as a second dose check to verify the clinical IGABT treatment plans. This study revealed that vIDC has the potential to verify the dose volumes calculated by TPS. In addition, we have been found that the doses in the dosimetric parameters are more affected by the dose grid size, not the applicator volume. Finally, the vIDC can improve the safety of IGABT by verifying the treatment plans with a variety of conditions.
All datasets generated for this study are included in the article/supplementary material.
J-BC, TS, and JP supervised the project. S-WK and JP conceived and designed the experiments. J-YP, H-JP, and J-BC contributed the simulated cases. S-WK, K-HK, and WC built the in-house software. S-WK, SO, and JP wrote the manuscript.
This work was supported by the National Research Foundation of Korea (NRF) grant funded by the Korea Government (Ministry of Science, ICT & Future Planning) (Nos. 2018R1D1A1B07049159 and 2019017069) and Mid-career Researcher Program (No. 2018R1A2B2005343).
The authors declare that the research was conducted in the absence of any commercial or financial relationships that could be construed as a potential conflict of interest.
1. Pötter R, Fidarova E, Kirisits C, Dimopoulos J. Image-guided adaptive brachytherapy for cervix carcinoma. Clin Oncol. (2008) 20:426–32. doi: 10.1016/j.clon.2008.04.011
2. Rijkmansa EC, Nouta RA, Ruttena IHHM, Ketelaarsa M, Neelisa KJ, Lamana MS, et al. Improved survival of patients with cervical cancer treated with image-guided brachytherapy compared with conventional brachytherapy. Gynecol Oncol. (2014) 135:231–8. doi: 10.1016/j.ygyno.2014.08.027
3. Pötter R, Georg P, Dimopoulos JCA, Grimm M, Berger D, Nesvacil N, et al. Clinical outcome of protocol based image (MRI) guided adaptive brachytherapy combined with 3D conformal radiotherapy with or without chemotherapy in patients with locally advanced cervical cancer. Radiother Oncol. (2011) 100:116–23. doi: 10.1016/j.radonc.2011.07.012
4. Charra-Brunaud C, Harter V, Delannes M, Haie-Meder C, Quetin P, Kerr C, et al. Impact of 3D image-based PDR brachytherapy on outcome of patients treated for cervix carcinoma in France: results of the French STIC prospective study. Radiother Oncol. (2012) 103:305–13. doi: 10.1016/j.radonc.2012.04.007
5. Tanderup K, Georg D, Pötter R, Kirisits C, Grau C, Lindegaard JC. Adaptive management of cervical cancer radiotherapy. Semin Radiat Oncol. (2010) 20:121–9. doi: 10.1016/j.semradonc.2009.11.006
6. Nomden CN, de Leeuw AA, Roesink JM, Tersteeg RJ, Moerland MA, Witteveen PO, et al. Clinical outcome and dosimetric parameters of chemo-radiation including MRI guided adaptive brachytherapy with tandem-ovoid applicators for cervical cancer patients: a single institution experience. Radiother Oncol. (2013) 107:69–74. doi: 10.1016/j.radonc.2013.04.006
7. Tanderup K, Nielsen SK, Nyvang GB, Pedersen EM, Rohl L, Aagaard T, et al. From point A to the sculpted pear: MR image guidance significantly improves tumour dose and sparing of organs at risk in brachytherapy of cervical cancer. Radiother Oncol. (2010) 94:173–80. doi: 10.1016/j.radonc.2010.01.001
8. Lindegaard JC, Tanderup K, Nielsen SK, Haack S, Gelineck J. MRI-guided 3D optimization significantly improves DVH parameters of pulsed-dose-rate brachytherapy in locally advanced cervical cancer. Int J Radiat Oncol Biol Phys. (2008) 71:756–64. doi: 10.1016/j.ijrobp.2007.10.032
9. Tanderup K, Menard C, Polgar C, Lindegaard JC, Kirisits C, Pötter R. Advancements in brachytherapy. Adv Drug Deliver Rev. (2017) 109:15–25. doi: 10.1016/j.addr.2016.09.002
10. Kutcher GJ, Coja L, Gillin M, Hanson WF, Leibel S, Morton RJ, et al. Comprehensive QA for radiation oncology: report of AAPM radiation therapy committee task group no. 40. Med Phys. (1994) 21:581–618. doi: 10.1118/1.597316
11. Kubo HD, Glasgow GP, Pethel TD, Thomadsen BR, Williamson JF. High dose-rate brachytherapy treatment delivery: report of AAPM radiation therapy committee task group no. 59. Med Phys. (1998) 25:375–403. doi: 10.1118/1.598232
12. Saw CB, Korb LJ, Darnell B, Krishna KV, Ulewicz D. Independent technique of verifying high-dose rate (HDR) brachytherapy treatment plans. Int J Radiat Oncol Biol Phys. (1998) 40:747–50. doi: 10.1016/S0360-3016(97)00851-1
13. Cohen GN, Amols HI, Zaider M. An independent dose-to point calculation program for the verification of high-dose-rate brachytherapy treatment planning. Int J Radiat Oncol Biol Phys. (2000) 48:1251–8. doi: 10.1016/S0360-3016(00)00725-2
14. Lachaine ME, Gorman JC, Palisca MG. A fast, independent dose check of HDR plans. J Appl Clin Med Phys. (2003) 4:149–55. doi: 10.1120/jacmp.v4i2.2530
15. Carmona V, Perez-Calatayud J, Lliso F, Richart J, Ballester F, Pujades-Claumarchirant MC, et al. A program for the independent verification of brachytherapy planning system calculations. J Contemp Brachytherapy. (2010) 2:129–33. doi: 10.5114/jcb.2010.16924
16. Safian NAM, Abdullah NH, Abdullah R, Chiang CS. Verification of oncentra brachytherapy planning using independent calculation. J Phys Conf Ser. (2016) 694:012003. doi: 10.1088/1742-6596/694/1/012003
17. Xianliang W, Pei W, Churong L, Zhangwen W, Chengjun G, Jie L, et al. An automated dose verification software for brachytherapy. J Contemp Brachytherapy. (2018) 10:5478–82. doi: 10.5114/jcb.2018.79396
18. Granero D, Vijande J, Ballester F, Rivard MJ. Dosimetry revisited for the HDR 192Ir brachytherapy source model mHDR-v2. Med Phys. (2010) 38:487–94. doi: 10.1118/1.3531973
19. Potter R, Haie-Meder C, Limbergen EV, Barillot I, Brabandere MD, Dimopoulos J, et al. Recommendations from gynaecological (GYN) GEC ESTRO working group (II): concepts and terms in 3D image-based treatment planning in cervix cancer brachytherapy−3D dose volume parameters and aspects of 3D image-based anatomy, radiation physics, radiobiology. Radiother Oncol. (2006) 78:67–77. doi: 10.1016/j.radonc.2005.11.014
20. Nag S, Erickson B, Thomadsen B, Orton C, Demanes JD, Petereit D. The American brachytherapy society recommendations for high-dose-rate brachytherapy for carcinoma of the cervix. Int J Radiat Oncol Biol Phys. (2000) 48:201–11. doi: 10.1016/S0360-3016(00)00497-1
21. Tharavichitkul E, Wanwilairat S, Chakrabandhu S, Klunklin S, Onchan W, Tippanya D, et al. Image-guided brachytherapy (IGBT) combined with whole pelvic intensity-modulated radiotherapy (WP-IMRT) for locally advanced cervical cancer: a prospective study from Chiang Mai university hospital, Thailand. J Contemp Brachytherapy. (2013) 5:10–16. doi: 10.5114/jcb.2013.34338
Keywords: independent dose calculation system, image-guided adaptive brachytherapy, American Association of Physicists in Medicine Task Group 43, dose grid, equivalent dose in 2-Gy fractions
Citation: Kang S-W, Chung J-B, Kim K-H, Park J-Y, Park H-J, Cho W, Olberg S, Suh TS and Park JC (2020) Development of Volumetric Independent Dose Calculation System for Verification of the Treatment Plan in Image-Guided Adaptive Brachytherapy. Front. Oncol. 10:609. doi: 10.3389/fonc.2020.00609
Received: 24 December 2019; Accepted: 03 April 2020;
Published: 13 May 2020.
Edited by:
Valdir Carlos Colussi, University Hospitals Cleveland Medical Center, United StatesReviewed by:
Michelle Lynn Schwer, Brown University, United StatesCopyright © 2020 Kang, Chung, Kim, Park, Park, Cho, Olberg, Suh and Park. This is an open-access article distributed under the terms of the Creative Commons Attribution License (CC BY). The use, distribution or reproduction in other forums is permitted, provided the original author(s) and the copyright owner(s) are credited and that the original publication in this journal is cited, in accordance with accepted academic practice. No use, distribution or reproduction is permitted which does not comply with these terms.
*Correspondence: Jin-Beom Chung, amJjaHVuZzEyMTNAZ21haWwuY29t; Tae Suk Suh, c3Voc2FudGFAY2F0aG9saWMuYWMua3I=
Disclaimer: All claims expressed in this article are solely those of the authors and do not necessarily represent those of their affiliated organizations, or those of the publisher, the editors and the reviewers. Any product that may be evaluated in this article or claim that may be made by its manufacturer is not guaranteed or endorsed by the publisher.
Research integrity at Frontiers
Learn more about the work of our research integrity team to safeguard the quality of each article we publish.