 Szymon Zmorzyński1*
 Sylwia Popek-Marciniec1Aneta Szudy-Szczyrek2Magdalena Wojcierowska-Litwin1Iwona Korszeń-Pilecka1Sylwia Chocholska2
 Wojciech Styk1Marek Hus2Agata A. Filip1
- 1Department of Cancer Genetics With Cytogenetic Laboratory, Medical University of Lublin, Lublin, Poland
- 2Chair and Department of Hematooncology and Bone Marrow Transplantation, Medical University of Lublin, Lublin, Poland
Oxidative stress and systemic inflammation are closely linked with increased risk of cancer development. Tumor necrosis factor alpha (TNF-α) is one of the pro-inflammatory cytokines. Glutathione S-transferases (GSTs) are enzymes involved in oxidative stress handling. Polymorphisms of genes encoding mentioned molecules may potentially influence the risk and the outcome in neoplastic diseases. Multiple myeloma (MM) is a hematological malignancy characterized by clonal, atypical plasma cell proliferation. In the present study we investigated the association of deletion polymorphisms in GSTT1/GSTM1 genes and single nucleotide polymorphisms (SNPs) in the TNF-α gene at positions −308/−238 with the risk and outcome in MM and sensitivity to bortezomib under in vitro conditions. One hundred newly diagnosed MM patients and 100 healthy blood donors were genotyped by means of multiplex PCR (for GSTs) and PCR-RFLP (for TNF-α). In a subgroup of 50 MM patients, bone marrow cells were treated with bortezomib in vitro. Patients with −238GA+AA or GSTT1-null genotypes had 2.0 (p = 0.002) or 2.29 (p = 0.013) fold increased risk of MM. The interaction effects and risk of MM were observed in GSTT1/GSTM1-null (OR = 2.82, p = 0.018), −308/−238GA+AA (OR = 5.63, p < 0.001), as well as in all combinations of −308 with GSTs. The −308/−238GA+AA genotypes in comparison to GG were associated with earlier MM onset−61.14 vs. 66.86 years (p = 0.009) and 61.72 vs. 66.52 years (p = 0.035), respectively. Patients with GSTM1-present had shorter progression-free-survival (15.17 vs. 26.81 months, p = 0.003) and overall-survival (22.79 vs. 34.81 months, p = 0.039) compared with GSTM1-null. We did not observe relationship between response rate and studied polymorphisms. The in vitro study revealed significantly higher number of apoptotic cells at 12 nM of bortezomib in GSTT1-present, GSTM1-null/present, −308GG and −238GG/GA+AA genotypes. Our findings comprise large analysis of studied polymorphisms in MM.
Introduction
Multiple myeloma (MM) is a malignant clonal expansion of plasma cells in the bone marrow (1). Some genetic, biochemical, and environmental factors are involved in the etiology and pathogenesis of this disease (2). DNA damage is one of the crucial causes of MM development and may be caused by free radicals (3, 4).
The reactive oxygen species (ROS) neutralization and cellular oxidative stress handling involves glutathione (GSH) system, which consists, among others, of glutathione-S-transferases (GSTs) (5, 6). GSTs are involved in the elimination of several chemical carcinogens and protect cellular DNA against ROS-induced damage. This enables genomic maintenance (7). The ability to metabolize carcinogens varies between individuals. These differences depend on polymorphisms of genes coding GST theta-1 and GST mu-1 enzymes – GSTT1 (locus 22q11.2) and GSTM1 (locus 1p13.3), respectively (4, 6). The polymorphisms of GSTT1 and GSTM1 genes are present in the form of null genotypes, which are caused by deletion of both alleles at a single locus. The GSTT1 and GSTM1 null polymorphisms are located in coding region. GSTM1 null polymorphism means that all exons (count = 6) and introns are removed (6 kbp deletion), but promoter and other non-coding regions (5′UTR, 3′UTR) are present. Larger deletion (9 kbp) is observed in GSTT1 gene (exon count = 8), and it causes loss of structural gene and some regions of flanking sequences. Null genotype results in a complete lack of corresponding enzyme activity (8).
ROS are involved in inflammation development and tumor necrosis factor alpha (TNF-α) secretion (9, 10). TNF-α is a macrophage-derived pro-inflammatory cytokine which may have either an apoptotic or survival activity in MM (11). TNF-α gene (locus 6p21.33) contains single nucleotide polymorphisms (SNPs) at positions −308 (rs1800629) and −238 (rs361525) in the 5′ promoter region. Both SNPs are characterized by the substitution of guanine (G) by adenine (A). In the case of both −308G>A or −238 G>A polymorphisms the presence of A-allele is associated with higher transcription rate and TNF-α production (12). Enhanced expression of TNF-α correlates with an increased aggressiveness of MM (13).
The introduction of proteasome inhibitors and new immunomodulatory drugs (IMiDs) in the treatment of MM resulted in improvement of overall survival (OS) relative to previous observations (14, 15). Bortezomib, as a proteasome inhibitor, induces an apoptotic cascade, which is preceded by ROS generation (16). Thalidomide can induce a formation of ROS and inhibits TNF-α expression (17). The correlations between response to treatment and studied genotypes have been not thoroughly researched in MM.
In the current study, we investigated the influence of polymorphisms in GSTT1, GSTM1, and TNF-α genes as genetic indicators of risk and progression of MM. A few similar studies have assessed the significance of GSTT1 and GSTM1 polymorphisms in MM (18, 19). However, these reports did not examine the relationship between the efficacy of bortezomib treatment (in vivo and in vitro) and combination with −308 G>A and −238G>A TNF-α polymorphisms. It is very important to define the role of both TNF-α polymorphisms in MM.
In this paper we present analysis for studied genetic variants individually and in different combinations to evaluate the role of these genes in modifying the susceptibility toward MM, as well as survival and response to treatment with thalidomide and/or bortezomib. Furthermore, we have analyzed whether these polymorphisms predict sensitivity to bortezomib in cell cultures derived from studied patients. To our knowledge the presented results were not previously published by other authors.
Patients and Methods
Patients and Samples
Bone marrow aspirates and peripheral blood samples were collected from 100 newly-diagnosed patients with MM, who were hospitalized at the Chair and Department of Hematooncology and Bone Marrow Transplantation, Medical University of Lublin in years 2013–2019. The study obtained a positive opinion from the Bioethics Committee (no. KE-0254/165/2013 and no. KE-0254/337/2016), according with the ethical standards established by the Helsinki Declaration. The patients and healthy blood donors provided written informed consent.
The characteristics of MM patients is shown in Supplementary Table 1.
Therapeutic induction regimens consisted of thalidomide and/or bortezomib combined with steroids and/or cyclophosphamide. 37 MM patients underwent autologous hematopoietic stem cell transplantation (auto-HSCT). Response to treatment was evaluated using the International Myeloma Working Group guidelines, and classified as stringent complete remission (sCR), complete response (CR), very good partial response (VGPR), partial response (PR), minimal response (MR), stable disease (SD) or progressive disease (PD) as described elsewhere (20, 21). Overall survival (OS) encompassed time from diagnosis until relapse, progression, death due to tumor effect or last follow-up, and time from diagnosis until death by any cause or last follow-up, respectively. The median follow-up time of MM patients enrolled in the study was 18 months. Progression free survival (PFS) was estimated as the time elapsed between treatment initiation and tumor progression or death from any cause (22).
Peripheral blood was used for DNA isolation and to determine polymorphisms. Cell cultures were established from bone marrow aspirates to carry out the research associated with cIg-FISH (n = 100) and bortezomib treatment (n = 50). MM patients without chromosomal aberrations were included in the in vitro bortezomib study.
Control samples were made of peripheral blood obtained from 100 healthy blood donors (50 males and 50 females) attending the Regional Blood Donation and Blood Treatment Center in Kielce. The mean age of blood donors was 34.4 years (range 18–61 years). The inclusion and exclusion criteria for MM patients and control group are shown in Supplementary Table 2.
DNA Isolation
DNA isolation from peripheral blood was performed using a commercial kit (Qiagen, Germany) according to manufacturer's procedure. The concentration and quality of DNA was checked using the NanoDrop device (Thermo Fisher Scientific, USA).
Genotyping
For analysis of GSTT1 and GSTM1 polymorphisms, the multiplex PCR method was applied. The −308 (rs1800620) and −238 (rs361525) polymorphisms of TNF-α gene were assessed by PCR restriction fragment length polymorphisms (PCR-RFLP). The primers, enzymes used and band sizes obtained in multiplex PCR and PCR-RFLP methods are shown in Table 1. The PCR products were analyzed on 3% agarose gel and stained with SimplySafe (Eurx, Poland) and visualized in G:Box (Syngene, Great Britain) (Figure 1). An independent PCR analysis was carried out for each sample.
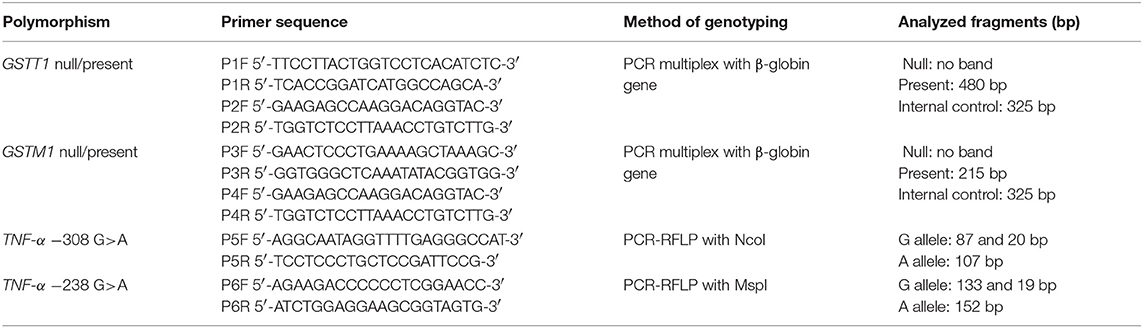
Table 1. Characteristics of PCR primers and analyzed fragments.
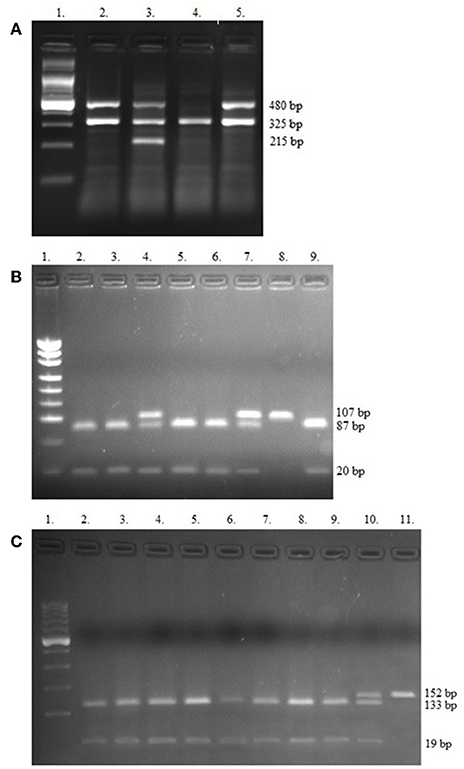
Figure 1. Electropherograms of studied polymorphisms. (A) Multiplex PCR of GSTT1, GSTM1, and internal control beta-globin genes, Lane 1—Ladder (100 bp); Lanes 2, 3, and 5 contain 480 bp band (GSTT1present); Lane 3 shows 215 bp (GSTM1present); Lane 4—only 325 bp for internal control (GSTT1null/GSTM1null); (B) PCR-RFLP of −308 TNF-α SNPs, Lane 1—Ladder (consists of 34, 67, 110, 147, 190, 242, 331, 404, 489 bp bands); Lanes 2, 3, 5, 6, and 9 contain 87 and 20 bp (GG genotypes); Lanes 4 and 7 show GA genotypes (107, 87, and 20 bp bands), Lane 8 contains 107 bp band (AA genotype); (C) PCR-RFLP of −238 TNF-α SNPs. Lane 1—Ladder (100 bp), Lanes 2–9 show GG genotypes (133 and 19 bp bands); Lane 10 contains 152, 133, and 19 bp band (GA genotype) and Lane 11 shows one band (152 bp)—AA genotype.
GSTT1 and GSTM1 Genotyping
For the multiplex PCR each reaction mixture (25 μl) contained 100 ng genomic DNA and PCR buffer (Clontech Laboratories, USA), dNTPs mixture (0,25 mM), HD polymerase (Clontech Laboratories, USA) and primers (10 μM of each). The method used was by Abdel-Rahman et al. with minor modifications (23). The mixture was heated in 94°C for 5 min and underwent 35 cycles of amplification: denaturation 94°C for 2 min, annealing 59°C for 1 min, and elongation 72°C for 1 min. The final elongation took 10 min at 72°C. The PCR reaction was performed in an Applied Biosystems 9700 Thermal Cycler.
TNF-α Genotyping
The −308 TNF-α polymorphism was analyzed according to the Wilson's protocol with modifications (24). PCR mixture (25 μl) contained 100 ng genomic DNA and PCR buffer (ADS Biotec, USA), dNTPs mixture (0.25 mM), Optimase polymerase (ADS Biotec, USA), and primers (10 μM of each). The mixture underwent touchdown PCR including 95°C for 2 min and 7 cycles of amplification: denaturation 95°C for 30 s, annealing 66°C for 30 (−1°C per cycle), elongation 72°C for 20 s; followed by 30 cycles with denaturation 95°C for 30 s, annealing 59°C for 30, elongation 72°C for 20 s. The final elongation took 3 min at 72°C. The PCR reaction was performed in an Eppendorf Mastercycler.
The −238 TNF-α polymorphism was characterized by PCR-RFLP (25). Each PCR mixture (25 μl) contained 100 ng genomic DNA and PCR buffer (Clontech Laboratories, USA), dNTPs mixture (0,25 mM), HD polymerase (Clontech Laboratories, USA) and primers (10 μM of each). The mixture was heated in 94°C for 4 min and underwent 35 cycles of amplification: denaturation 98°C for 20 s, annealing 61°C for 20 s, elongation 72°C for 25 s. The final elongation took 3 min at 72°C. The PCR reaction was performed in an Applied Biosystems 9700 Thermal Cycler.
Cytogenetic Analyses
Abnormalities essential for MM, such as del(17p13.1) and IgHV gene rearrangements—t(4;14), t(14;16) were tested by cIg-FISH according to Ross et al. recommendations (26). Cultured bone marrow malignant plasma cells from 100 patients were identified using simultaneous staining of cytoplasmic immunoglobulin and FISH (cIg-FISH) according to the previously described protocol with modifications (27, 28). The following probes, all from Abbott Molecular (Abbott Park, IL, USA), were used: Vysis TP53/CEP 17 FISH Probe Kit for detection of del(17p13.1), Vysis IGH/FGFR3 DF FISH Probe Kit for detection of t(4;14)(p16;q32), and Vysis IGH/MAF DF FISH Probe Kit for detection of t(14;16)(q32;q23). Fluorescent microscopic analysis was performed by scoring 100 AMCA-positive plasma cells to determine the frequency of each aberration. Cut off level were 20% for deletion probes and 10% for dual fusion probes, according to the recommendations of the European Myeloma Network (26).
Cell Cultures, Apoptosis, and Necrosis Detection
Bone marrow aspirates (n = 50) (mean number of plasma cells was 31.31% ± 20.69) were stratified on Lymphoprep (Axis-Shield PoC As, Norway) and lymphocyte fraction was used to established cell cultures, which were grown in 15 ml of culture medium—RPMI 1640 with L-glutamine (Biomed, Poland); 10% inactivated fetal calf serum (Biomed, Poland), 1% antibiotic antimycotic (A&E Scientific, Belgium), and different doses of bortezomib (LC Laboratories, USA, 200 mg/ml)−1 nM/2 nM/4 nM/8 nM/12 nM. Bortezomib was dissolved in DMSO and stored at −80°C. The final DMSO concentration in culture medium was <0.1%. As a control, cell cultures without bortezomib (with 0.1% DMSO) were used. The amount of 1–1.5 ml of lymphocyte fraction (from each patient) was added, respectively, to the 15 ml of culture medium. The cultures were grown at 37°C in the atmosphere of 5% CO2 for 24 h (without granulocyte colony-stimulating factor). The cell cultures were routinely terminated and cell suspensions were prepared to determine the number of apoptotic, necrotic, and viable cells by means of Annexin V-Cy3 Apoptosis Detection Kit according to manufacturer's protocol (Sigma-Aldrich, USA). For fluorescence microscopy, viable cells were stained with 6-CF (6-carboxyfluorescein)—green, necrotic cells were stained only with AnnCy3 (Annexin V Cy3.18). Cells starting apoptotic process were stained both with AnnCy3 (red) and 6-CF (green) (Figure 2). Plasma cells (with diameter 9–12 μm) were analyzed using fluorescence microscope according to Carter's et al. (29).
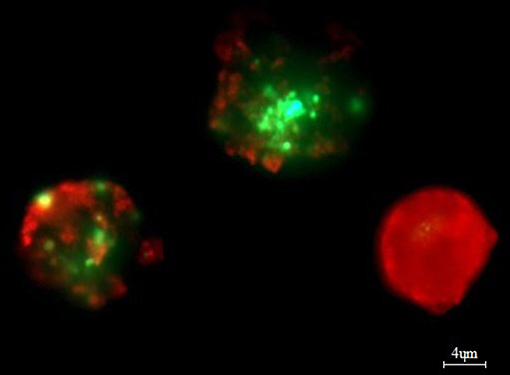
Figure 2. Example of in vitro bortezomib activity (at 4 nM). Note two apoptotic cells, which are stained both AnnCy3 (red) and 6-CF (green) and one necrotic cell (red). For analysis plasmocytes with diameter 9–12 μm were counted. Cells were stained by immunofluorescent technique as described in Material and methods. Total magnification of 1.500×.
Statistical Analysis
Laboratory values of MM patients with polymorphisms were compared using an independent t-test for continuous variables and Chi-square test for categorical variables. The association of studied polymorphisms with prognostic factors was evaluated using Chi-square test or Fischer's exact test (when one expected value was <5). The quantitative data was shown as a frequency or percentage. Deviation of genotype frequencies in controls and cases from Hardy-Weinberg equilibrium (HWE) was assessed by Chi-squared test with Yates's correction for the groups with <5 patients (30). For the 95% confidence interval (CI), we assumed p = 0.05 and χ2 = 3.84; therefore, if the χ2 ≤ 3.84 and the corresponding p ≥ 0.05 then the population is in HWE. The CubeX software was used to analyze linkage disequilibrium of the studied TNF polymorphisms (31). Logistic regression was used to evaluate the fold risk of MM. The Cox proportional hazard model was used for univariate and multivariate analysis of OS and PFS. Variables of the International Staging System (ISS), auto-HSCT, and genotypes (without combinations) were included in the multivariate analysis. The Kaplan-Meier method and the log-rank test were used for survival analysis. We assumed a 5% error of inference and the related level of significance p < 0.05 would point to the existence of statistically significant differences. Statistical analysis was performed using the Statistica ver. 12.5 (StatSoft) software.
Results
The presented study included 100 MM patients, 53 males and 47 females, with a median age of 65.32 years. Detailed clinical characteristics of the MM patients is shown in Supplementary Table 1. Genotyping was successful in all the individuals investigated within the study. The HWE test confirmed that the allelic frequencies (of TNF-α) for healthy individuals (controls) and MM patients were balanced (Table 2). Linkage disequilibrium between −308 G>A and −238 G>A of TNF-α polymorphisms were seen in the study (D' = 1, r2 = 1). The allelic frequencies of both TNF-α polymorphisms between study and control groups were statistically insignificant (Table 3). The GA and AA genotypes [of TNF-α −308 G>A and −238 G>A polymorphisms] were analyzed together, because the number of AA cases was low. The patients with GA+AA genotypes of TNF-α −238 G>A had a 2.0-fold increased risk of MM (p = 0.024) compared with GG genotypes (−238 G>A). Similar findings were observed in patients with the GSTT1 null genotype (OR = 2.29, p = 0.013) (Table 4). The effects of GST and TNF polymorphisms loci on the risk of MM were showed in Table 5. Individuals with GSTT1 null and GSTM1 null or TNF-α −308 GA+AA and −208 GA+AA genotypes showed an increased risk of MM when compared with those with GSTT1 present and GSTM1 present or −308 GG and −238 GG genotypes, with OR of 2.82 (p = 0.018) and 5.63 (p < 0.001), respectively (Table 5). Similar effects were observed in all combinations of GSTT1, GSTM1, and −308G>A, and in some combinations of GSTT1, GSTM1, and −238G>A (Table 5).
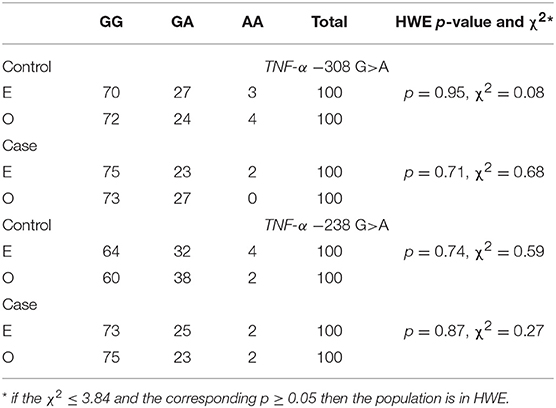
Table 2. Hardy-Weinberg equilibrium for TNF-α polymorphisms in case and control groups according to expected (E) and observed (O) values.
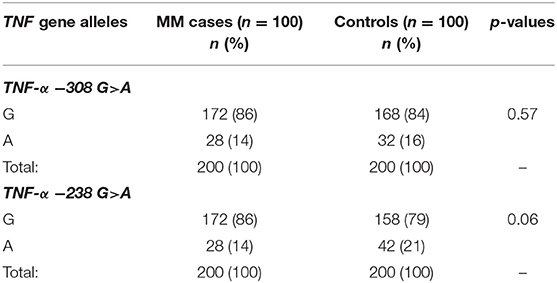
Table 3. The comparison of TNF-α allele frequencies among MM patients and controls.
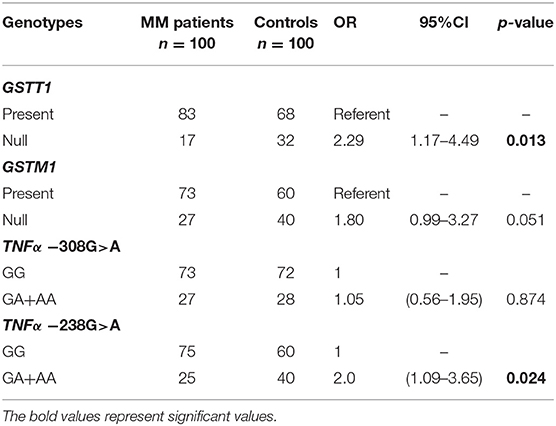
Table 4. Comparison of the impact of GST and TNF-α polymorphisms on the risk of MM.
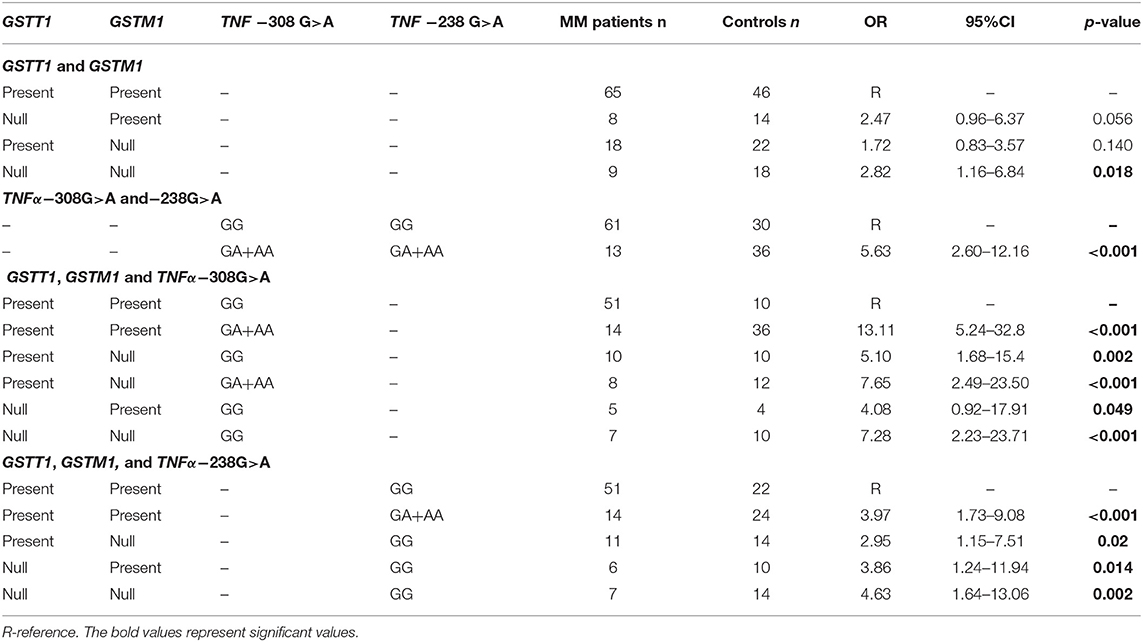
Table 5. Combination effect of GST and TNF-α polymorphisms on the risk of MM.
A univariate Cox analysis revealed that patients at stage III according to ISS or those who did not receive auto-HSCT had a 2.92 (p = 0.002) and 5.0 (p < 0.001) times increased risk of death, respectively (Table 6). Similar findings were observed in the case of disease relapse or progression in MM patients at stage III (HR = 2.62, p < 0.001) and without auto-HSCT (HR = 2.66, p = 0.001) (Table 6). The multivariate regression analysis also confirmed, that patients without auto-HSCT had a 5.07 times increased risk of death (Table 7). Patients, who did not receive auto-HSCT had 2.13 more chances of disease relapse or progression (Table 7). In contrast, MM patients at stage III or with GSTM1 present genotype had lower chances (HR = 0.44, p = 0.009 or HR = 0.46, p = 0.029, respectively) of disease relapse or progression (Table 7).
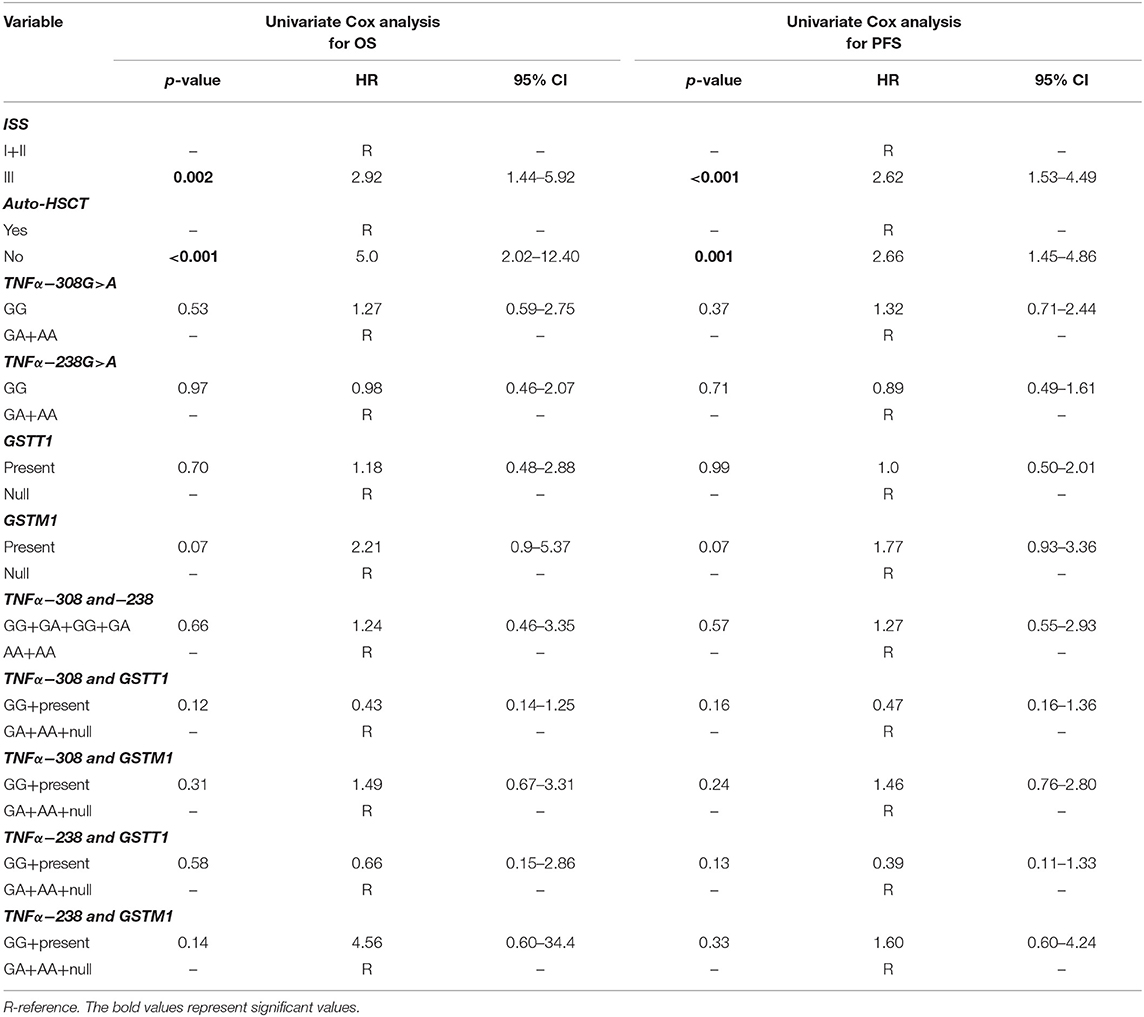
Table 6. Univariate Cox analysis in survival of MM patients.
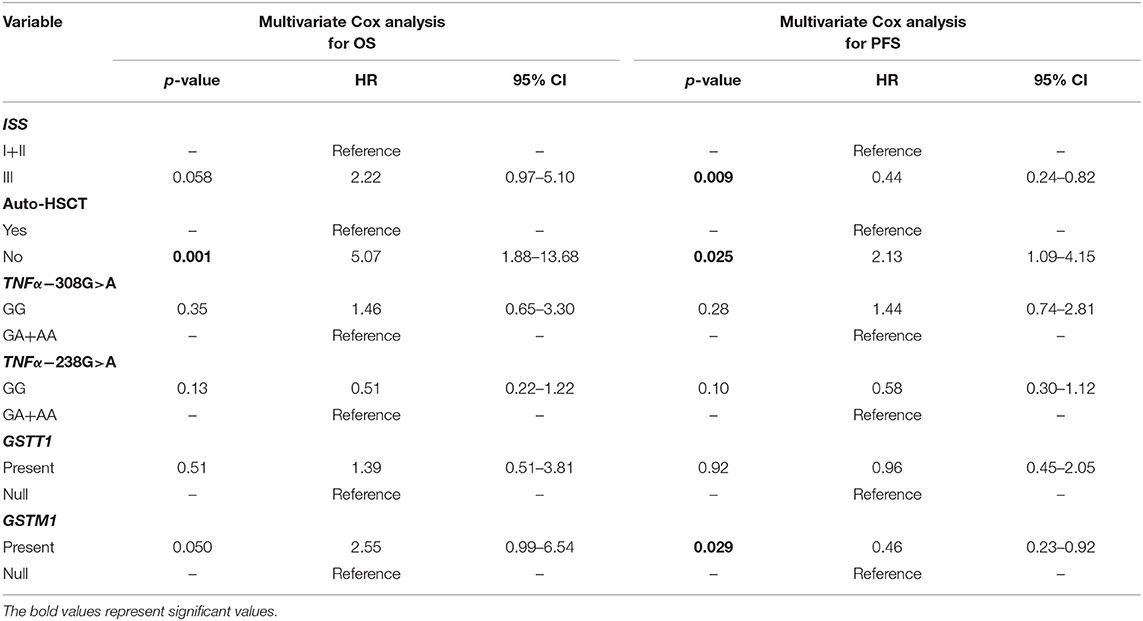
Table 7. Multivariate Cox analysis in survival of MM patients.
The analysis of response rate in MM showed that patients at stage III or without auto-HSCT had an increased chance of progressive disease (PD) (Table 8). We did not observe the association of studied polymorphisms with response rate of MM patients (Table 8).
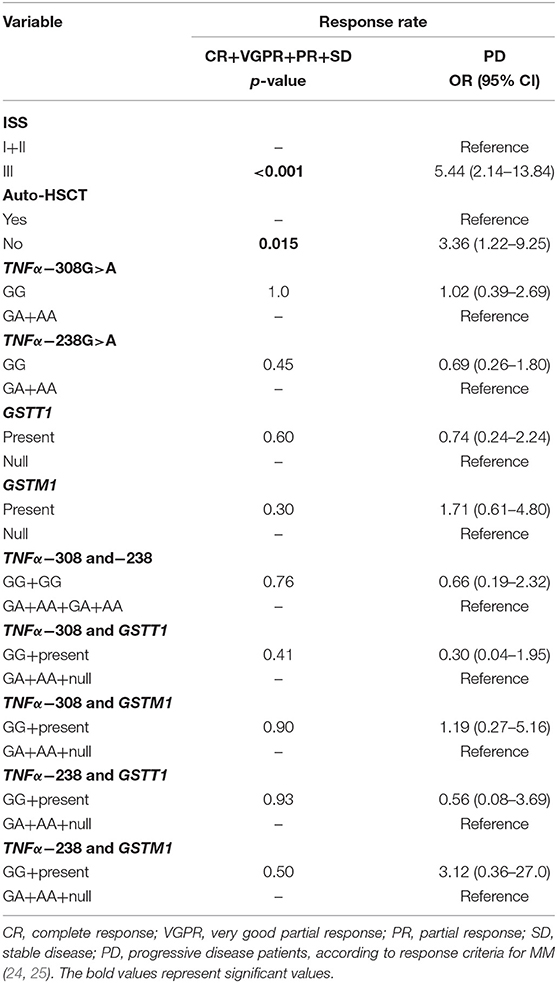
Table 8. TNF-α and GSTs polymorphisms in response rate of MM patients.
Furthermore, we analyzed potential relationships between clinical and laboratory results and selected genotypes. The −308/−238 GA+AA genotypes were associated with development of MM at an earlier age in comparison to −308/−238 GG−61.14 vs. 66.86 years (p = 0.009) and 61.72 vs. 66.52 years (p = 0.035), respectively (Table 9). Moreover, higher rates of plasma cells were observed in −308 GG than in GA+AA genotypes (33.2 vs. 23.7%, p = 0.038). In MM patients with −238 GG, we observed higher concentration of β2-microglobulin in comparison to −238 GA+AA genotype carriers (6.49 vs. 4.30, p = 0.02). In the case of other analyzes, we did not confirm any significant correlations among studied polymorphisms regarding such parameters as free light chain ratio, baseline hemoglobin concentration, levels of albumin, calcium, creatinine, C-reactive protein and estimated glomerular filtration rate (Table 9). Odds ratio was used to analyze the relationship of polymorphisms with chromosomal aberrations in MM patients. The results were statistically insignificant - GSTT1 null (p = 0.19), GSTM1 null (p = 0.20), −308 GA+AA (p = 0.80), and −238 GA+AA (p = 1.0).
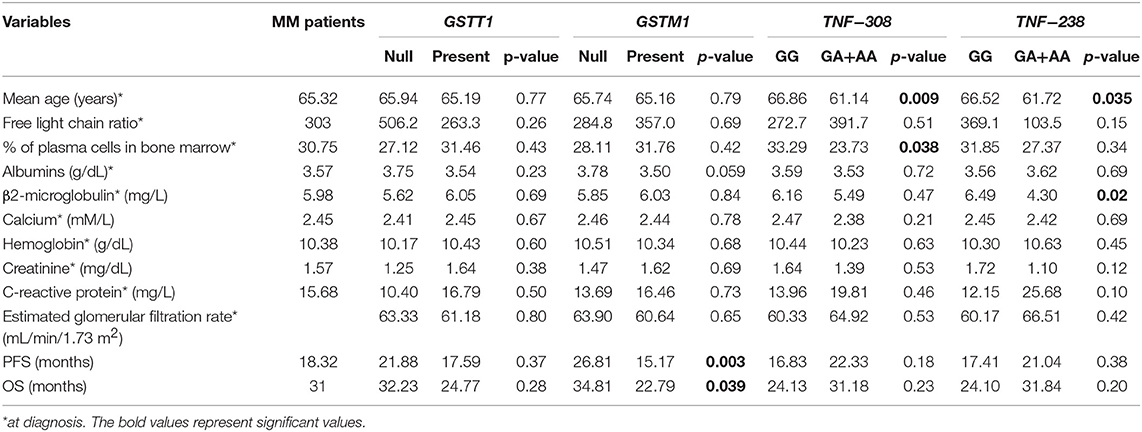
Table 9. The clinical values of MM patients included to the study taking into account studied polymorphisms.
A log rank analysis was performed and did not show any statistical associations between OS, as well as PFS for studied genotypes and the types of treatment (thalidomide vs. bortezomib vs. both—thalidomide and bortezomib). In the log rank test was observed the tendency for shorter OS and PFS in patients with GSTM1 present genotype (Figures 3, 4). Furthermore, we analyzed (by ANOVA) the association between the studied genotypes and survival of MM patients. Without taking into account the treatment, we found statistically shorter OS and PFS in patients with GSTM1 present in comparison to those with GSTM1 null genotype (Table 9).
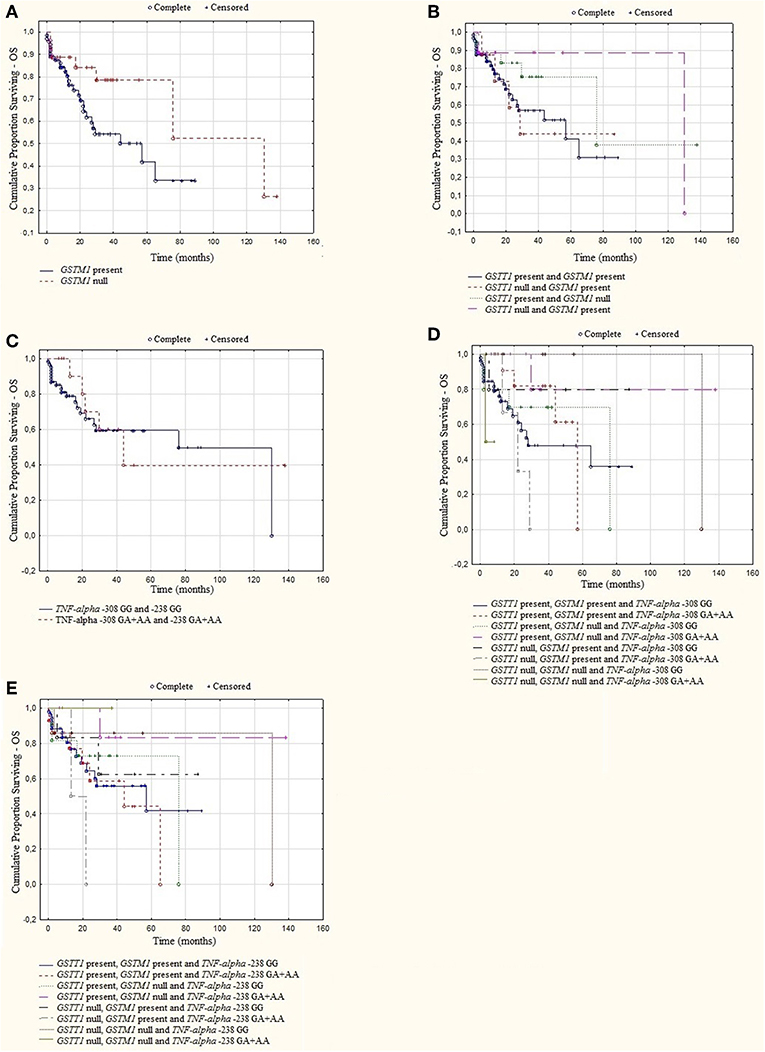
Figure 3. Kaplan-Meier analysis of OS in group of MM patients with (A) GSTM1 genotypes, log-rank test p = 0.052; (B) GSTT1 and GSTM1 genotypes, log-rank test p = 0.393; (C) TNF genotypes, log-rank test p = 0.794; (D) GSTT1, GSTM1, and TNF-α−308 genotypes, log-rank test p = 0.430; (E) GSTT1, GSTM1, and TNF-α −238 genotypes, log-rank test p = 0.659.
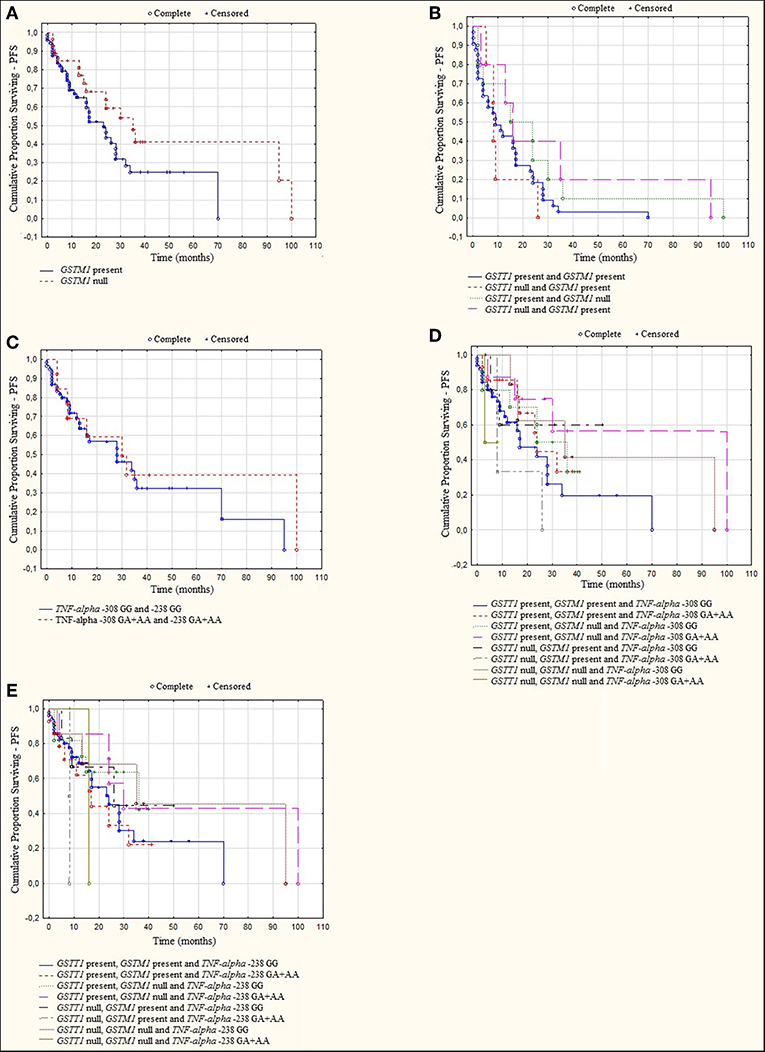
Figure 4. Kaplan-Meier analysis of PFS in group of MM patients with (A) GSTM1 genotypes, log-rank test p = 0.056; (B) GSTT1 and GSTM1 genotypes, log-rank test p = 0.501; (C) TNF genotypes, log-rank test p = 0.284; (D) GSTT1, GSTM1, and TNF-α −308 genotypes, log-rank test p = 0.102; (E) GSTT1, GSTM1, and TNF-α−238 genotypes, log-rank test p = 0.655.
In in vitro studies, bortezomib increased the number of apoptotic and necrotic cells in all studied genotypes. The only statistically significant differences were observed in the number of apoptotic cells at concentration of 12 nM between the genotypes as follows—TNF-α −308 GA+AA vs. GSTT1 present (39.24 vs. 47.46%, respectively), p = 0.026; TNF-α −308 GA+AA vs. GSTM1 null (39.24 vs. 49.57%, respectively), p = 0.020; TNF-α −308 GA+AA vs. GSTM1 present (39.24 vs. 46.82%, respectively), p = 0.046; TNF-α −308 GA+AA vs. TNF-α −308 GG (39.24 vs. 51.15%, respectively), p = 0.001; TNF-α −308 GA+AA vs. TNF-α −238 GG (39.24 vs. 50.41%, respectively), p = 0.004; TNF-α −308 GA+AA vs. TNF-α −238 GA+AA (39.24 vs. 42.71%, respectively), p = 0.017 and TNF-α −238 GG vs. TNF-α −238 GA+AA (50.41 vs. 42.71%, respectively), p = 0.032 (Supplementary Table 3). The lowest number of apoptotic cells was noted at concentration of 12 nM in the TNF-α −308 GA+AA genotype.
Discussion
Genetic polymorphisms in the carcinogen-metabolizing genes are very common and may be associated with the risk of developing different cancers, including hematological malignancies. Among these genes, GSTs play a critical role in protecting DNA and cell structures against the ROS (6). Moreover, deletion polymorphisms affect GST activities by detoxifying the metabolites of chemotherapeutic agents and may also affect the treatment of MM (32). Increased production of ROS leads to the accumulation of DNA mutations and activates a positive feedback loop via TNF-α, which promotes the synthesis of inflammatory cytokines. Both the ROS production and activation of TNF-α signaling pathway cause malignant transformation (10, 33). TNF-α is a proinflammatory cytokine that is involved in the stimulation of plasma cell growth and the pathogenesis of MM (34). It is one of particular relevance to MM, where it acts as a growth and survival factor for myeloma cells (35). The functional SNPs in the TNF-α gene affect its expression. This may be associated with malignant development and the aggressive course of the disease. The oncogenic transformation of plasma cells stimulates transcription and translation, which results in increased synthesis of immunoglobulins, β2-microglobulin and exacerbation of oxidative stress (36) Malignant cells produce higher amounts of ROS in comparison to normal cells as a result of oncogene activation and/or increased metabolic activity (37, 38). Higher ROS levels may promote cell proliferation and metastasis (39). Considering the above, we hypothesize that polymorphisms of GSTs and TNF-α genes, individually or combined, may increase the susceptibility to MM and influence the response to treatment of MM patients.
To our knowledge, this is the first study elucidating the correlation of GSTT1, GSTM1, and TNF-polymorphisms with the risk and the outcome of MM, as well as with response to bortezomib under in vitro conditions. Our findings suggest that GSTT1 null or TNF-α −238 GA+AA genotypes are significantly associated with susceptibility to MM. Similar findings were observed in both null genotypes of GSTT1 and GSTM1, as well as in GA+AA genotypes of TNF-α −308 and −238 SNPs.
The AA genotypes of TNF-α −308 G>A and −238 G>A are associated with increased constitutive and inducible expression of TNF-α (11, 21, 22, 34). The studies of −308 and −238 SNPs of the TNF-α gene in MM have shown controversial results (40–42). Davies et al. found that AA genotypes of TNF-α −308 SNP increased the risk of MM (43). In contrast, Morgan et al. in 181 MM patients revealed that A variant at position −308 of the TNF-α reduced risk of MM (41). In the case of TNF-α −238 G>A, some studies showed no association of this polymorphism with MM susceptibility (40–42, 44). Although Li et al. in a meta-analysis described lack of −308 and −238 SNPs association with MM risk in both the overall population and sub-group analysis, our results in Polish, Caucasian MM patients showed a significant correlation of TNF-α −238 GA+AA alone or −238 GG in most combinations with higher risk of MM development (45). This may be due to higher TNF-α gene expression due to the role of A alleles (increasing transcription rate) or as a result of linkage disequilibrium of G alleles with other functional SNPs involved in the development of MM (40). However, in our study the number of patients with AA genotypes was very low and they were analyzed with heterozygotes, which does not thoroughly show the role of the A allele.
A meta-analysis of TNF-α promoter polymorphisms association with MM risk validated a relationship of −308G>A and −238G>A with MM susceptibility, but not with survival and response to bortezomib/thalidomide treatment of MM patients (45). These features were analyzed in our research. However, we did not observe effects of TNF-α −308 GG/GA+AA or −238 GG/GA+AA genotypes on treatment with bortezomib and/or thalidomide in MM patients. This finding is consistent with results obtained by Du et al. in 210 MM patients (40). Moreover, they revealed that patients with TNF-α −238 GG genotypes have significantly longer OS (40). We found that TNF-α −308 GA+AA and −238 GA+AA genotypes were associated with earlier onset of MM development, which may be caused by higher expression of TNF-α. However, these genotypes did not affect OS and PFS. In TNF-α −308 GG and −238 GG genotype analysis, we observed a statistical significant relationship with higher levels of plasma cells and β2-microglobulin, respectively. These clinical values are negative prognostic factors for MM patients. In our research, −308/−238 GG genotypes increased the MM risk in combination with the null genotypes GSTT1 and/or GSTM1. It is possible that genotypes of TNF-α exert only a minor effect and are linked to other SNPs.
In the case of GST genotypes and their impact on the MM risk, our results are compatible with other studies in hematological malignancies including MM (18, 46, 47). For example, Chen and co-authors described that GSTM1 null genotype combined with CYP1A1 and CYP2D6 heterozygous mutant genotypes were correlated with an elevated risk of acute non-lymphoblastic leukemia (ANLL) (8). Yuille and co-workers studied the relationship between genotypes of GSTM1, GSTT1, GSTP1, and chronic lymphocytic leukemia (CLL) (48). They found that the risk of CLL was increased with the GSTM1 null and GSTT1 null genotypes (48). In our study individuals with the GSTT1 null or with both the GSTT1 null and GSTM1 null genotypes showed a higher risk of MM compared to patients carrying non-deleted GSTT1/GSTM1 genotypes. Moreover, the GSTM1 null genotype was alone associated with increased risk of MM development (at the level of tendency). Deletion of GSTs alleles resulted in lack of enzyme activity. This may increase the level of carcinogens and mutation rates in genes regulating cell cycle progression, which result in higher cell proliferation rates, including proliferation of plasma cells.
Both MM and CLL are derived from B cells, which points to the role of GSTT1 and GSTM1 polymorphisms in the pathogenesis of B-cell malignancies. Few studies are focused on GSTT1 and GSTM1 polymorphisms in MM (18, 19). In our research, we observed the association of the GSTM1 present genotype with shorter OS (at the level of tendency) and PFS of MM patients. Multivariate Cox analysis showed that patients with GSTM1 present genotype had lower chances for longer PFS, which is consistent with the research of Lopes-Aguiar et al. (19). They noted shorter OS and event-free survival (EFS) in patients with GSTM1 present genotype who did not receive ASCT after chemotherapy (19). It is possible that the presence of the GSTM1 gene and activity of the respective GST enzyme affects the treatment of MM patients. GSTs are involved in the elimination of chemical carcinogens and may neutralize the effect of bortezomib and thalidomide.
In this paper we analyzed, for the first time, the GSTT1, GSTM1, and TNF-α SNPs in the survival and response to therapy of MM patients. TNF-α −308 GG/GA+AA or −238 GG in combination with GSTT1 and GSTM1 polymorphisms increased the risk of MM. Interestingly, the presence of −238 GA+AA with the null genotypes of GSTT1 and/or GSTM1 did not influence disease risk. It may indicate a possible protective role of the −238 GA+AA genotype. These combined associations have not been previously reported.
Bortezomib causes an accumulation of unfolded proteins, followed by endoplasmatic reticulum stress and cell death via multiple pathways, including overproduction of ROS (49). ROS generation precedes the initiation of bortezomib-induced apoptosis (16). Taking this into account, we have evaluated the relationship between studied polymorphisms and the response to bortezomib under in vitro conditions. This association was not previously studied. We hypothesized that GSTT1, GSTM1, and TNF-α polymorphisms may interact with the response to bortezomib treatment. We observed statistically significant differences between studied polymorphisms in the number of apoptotic cells at 12 nM concentration of bortezomib. The lowest number of apoptotic cells was found in the TNF-α −308 GA+AA genotype. In the human study, higher levels of plasma cells were observed in MM patients with the −308 GG, not with the −308 GA+AA genotype. Moreover, low number of apoptotic cells was found in −238 GA+AA, which was associated alone and in most combinations with a higher risk of MM development. The inconsistent results of the in vitro and human study may be due to a low sample size. Furthermore, we found spontaneous apoptosis and necrosis in cell cultures without bortezomib, which may be due to laboratory conditions. Alternatively, myeloma cell lines could be used. However, in the case of studied polymorphisms, reference cell lines with all studied genotypes are not available, which may be used in the presented in vitro study.
A limitation of our study is the relatively small sample size, in part due to the low incidence of the disease. Further analysis on a larger cohort can help better understand the significance of GSTT1, GSTM1, TNF-α −308 G>A and −238 G>A polymorphisms in the pathobiology of MM, especially in the case of disease outcome.
In conclusion, these data underscore the relationship of TNF-α −238 GA+AA and GSTT1 null genotypes with increased risk of MM. TNF-α −308 genotypes in combinations with GSTT1/GSTM1 genotypes were associated with increased susceptibility to MM. The TNF-α −238 GG was associated with higher MM risk, but only in the absence of the GSTT1 and/or GSTM1 genotypes. The GSTM1 genotypes affected the outcome of MM patients. However, we found no association of the studied polymorphisms with the response rate and treatment of thalidomide and/or bortezomib. Under in vitro conditions, bortezomib significantly increased the number of apoptotic cells at 12 nM in GSTT1 present, TNF-α −308 GG and all genotypes of GSTM1 and TNF-α −238. Further analysis on a larger cohort is necessary to better understand the influence of GSTT1, GSTM1, and TNF-α polymorphisms on the MM development and progression.
Data Availability Statement
This manuscript contains previously unpublished data. The name of the repository and accession number are not available.
Ethics Statement
The positive opinion was obtained from the Bioethics Committee (no. KE-0254/165/2013 and no. KE-0254/337/2016), according with the ethical standards established by Helsinki Declaration.
Author Contributions
SZ, SP-M, MW-L, SC, and IK-P carried out the experiment. SZ, SP-M, MW-L, and IK-P performed the molecular analysis of GSTs and TNF-alpha polymorphisms. SC performed cytogenetic analysis. SZ and SP-M performed in vitro study with bortezomib. MH and AF were involved in planning and supervised the work. SZ, AS-S, and WS processed the experimental data and performed the analysis. SZ, SP-M, and WS designed the figures. SZ, AS-S, and WS wrote the manuscript with support from MH and AF. All authors discussed the results and commented on the manuscript.
Funding
This project was supported by the Medical University in Lublin grant MNmb232. The equipment used was purchased with funds from the equipment of Innovative laboratories doing research on new medicines used in the therapy of civilization and neoplastic diseases Project, part of the Development of Eastern Poland Operational Program 2007–2013, Priority Axis and Modern Economy, Operations I.3 Innovation Promotion.
Conflict of Interest
The authors declare that the research was conducted in the absence of any commercial or financial relationships that could be construed as a potential conflict of interest.
Acknowledgments
Special thanks are due to Candace Wilson for proofreading and editing assistance, as well as substantive verification.
Supplementary Material
The Supplementary Material for this article can be found online at: https://www.frontiersin.org/articles/10.3389/fonc.2019.01056/full#supplementary-material
References
1. Shapiro-Shelef M, Calame K. Plasma cell differentiation and multiple myeloma. Curr Opin Immunol. (2004) 16:226–34. doi: 10.1016/j.coi.2004.02.001
2. Corre J, Munshi N, Avet-Loiseau H. Genetics of multiple myeloma: another heterogeneity level? Blood. (2015) 125:1870–6. doi: 10.1182/blood-2014-10-567370
3. Herrero AB, Gutierrez NC. Targeting ongoing dna damage in multiple myeloma: effects of dna damage response inhibitors on plasma cell survival. Front Oncol. (2017) 7:98. doi: 10.3389/fonc.2017.00098
4. Curtin NJ. DNA repair, dysregulation from cancer driver to therapeutic target. Nat Rev Cancer. (2012) 12:801–17. doi: 10.1038/nrc3399
5. Allocati N, Masulli M, Di Ilio C, Federici L. Glutathione transferases: substrates, inihibitors and pro-drugs in cancer and neurodegenerative diseases. Oncogenesis. (2018) 7:8. doi: 10.1038/S41389-017-0025-3
6. Singh MS, Michael M. Role of xenobiotic metabolic enzymes in cancer epidemiology. Methods Mol Biol. (2009) 472:243–64. doi: 10.1007/978-1-60327-492-0_10
7. Lin YS, Hung SC, Wei YH, Tarng DC. GST M1 polymorphism associates with DNA oxidative damage and mortality among hemodialysis patients. J Am Soc Nephrol. (2009) 20:405–15. doi: 10.1681/Asn.2008020227
8. Chen HC, Hu WX, Liu QX, Li WK, Chen FZ, Rao ZZ, et al. Genetic polymorphisms of metabolic enzymes CYP1A1, CYP2D6, GSTM1 and GSTT1 and leukemia susceptibility. Eur J Cancer Prev. (2008) 17:251–8. doi: 10.1097/Cej.0b013e3282b72093
9. Bulua AC, Simon A, Maddipati R, Pelletier M, Park H, Kim KY, et al. Mitochondrial reactive oxygen species promote production of proinflammatory cytokines and are elevated in TNFR1-associated periodic syndrome (Traps). J Exp Med. (2011) 208:519–33. doi: 10.1084/Jem.20102049
10. El-Kenawi A, Ruffell B. Inflammation, ROS, and mutagenesis. Cancer Cell. (2017) 32:727–9. doi: 10.1016/J.Ccell.2017.11.015
11. Kadar K, Kovacs M, Karadi I, Melegh B, Pocsai Z, Mikala G, et al. Polymorphisms of TNF-alpha and LT-alpha genes in multiple myeloma. Leuk Res. (2008) 32:1499–504. doi: 10.1016/J.Leukres.2008.03.001
12. Wilson CS, Seatter SC, Rodriguez JL, Bellingham J, Clair L, West MA. In vivo endotoxin tolerance: impaired LPS-stimulated TNF release of monocytes from patients with sepsis, but not SIRS. J Surg Res. (1997) 69:101–6. doi: 10.1006/Jsre.1997.5040
13. Jurisic V, Colovic M. Correlation of sera TNF-alpha with percentage of bone marrow plasma cells, LDH, Beta2-microglobulin, and clinical stage in multiple myeloma. Med Oncol. (2002) 19:133–9. doi: 10.1385/Mo:19:3:133
14. Palumbo A, Anderson K. Multiple myeloma. N Engl J Med. (2011) 364:1046–60. doi: 10.1056/Nejmra1011442
15. Kumar SK, Dispenzieri A, Lacy MQ, Gertz MA, Buadi FK, Pandey S, et al. Continued improvement in survival in multiple myeloma: changes in early mortality and outcomes in older patients. Leukemia. (2014) 28:1122–8. doi: 10.1038/Leu.2013.313
16. Perez-Galan P, Roue G, Villamor N, Montserrat E, Campo E, Colomer D. The proteasome inhibitor bortezomib induces apoptosis in mantle-cell lymphoma through generation of ROS and Noxa activation independent of P53 status. Blood. (2006) 107:257–64. doi: 10.1182/Blood-2005-05-2091
17. Hansen JM, Harris C. A novel hypothesis for thalidomide-induced limb teratogenesis: redox misregulation of the Nf-κb pathway. Antioxid Redox Signal. (2004) 6:1–14. doi: 10.1089/152308604771978291
18. Faber EW, Lourenco GJ, Ortega MM, Lorand-Metze I, De Souza CA, Lima CS. Polymorphisms of VEGF, GSTM1 and GSTT1 genes in multiple myeloma risk. Hematol Oncol. (2012) 30:105–7. doi: 10.1002/Hon.1009
19. Lopes-Aguiar L, Delamain MT, Brito ABC, Lourenço GJ, Costa EFD, Oliveira GB, et al. VEGF, VEGFR2 and GSTM1 polymorphisms in outcome of multiple myeloma patients treated with thalidomide-based regimens. Blood Cancer J. (2017) 7:E580. doi: 10.1038/Bcj.2017.58
20. Palumbo A, Rajkumar SV, San Miguel JF, Larocca A, Niesvizky R, Morgan G, et al. International myeloma working group consensus statement for the management, treatment, and supportive care of patients with myeloma not eligible for standard autologous stem-cell transplantation. J Clin Oncol. (2014) 32:587–600. doi: 10.1200/Jco.2013.48.7934
21. Durie BG, Harousseau JL, Miguel JS, Blade J, Barlogie B, Anderson K, et al. International uniform response criteria for multiple myeloma. Leukemia. (2006) 20:1467–73. doi: 10.1038/Sj.Leu.2404284
22. Federal Drug Administration. Guidance for industry: clinical trial endpoints for the approval of non-small cell lung cancer drugs and biologics (2011). Available online at: https://www.fda.gov/downloads/drugs/guidances/ucm071590.pdf (accessed December 30, 2018).
23. Abdel-Rahman SZ, El-Zein RA, Anwar WA, Au WW. A multiplex PCR procedure for polymorphic analysis of GSTM1 and GSTT1 genes in population studies. Cancer Lett. (1996) 107:229–33. doi: 10.1016/0304-3835(96)04832-X
24. Wilson AG, Di Giovine FS, Blakemore AI, Duff GW. Single base polymorphism in the human tumour necrosis factor alpha (TNF alpha) gene detectable by NcoI restriction of PCR product. Hum Mol Genet. (1992) 1:353. doi: 10.1093/Hmg/1.5.353
25. Hedayati M, Sharifi K, Rostami F, Daneshpour MS, Zarif Yeganeh M, Azizi F. Association between TNF-α promoter G-308a and G-238a polymorphisms and obesity. Mol Biol Rep. (2012) 39:825–9. doi: 10.1007/S11033-011-0804-4
26. Ross F, Avet-Loiseau H, Ameye G, Gutierrez NC, Liebisch P, O'connor S, et al. Report from the european myeloma network on interphase fish in multiple myeloma and related disorders. Haematologica. (2012) 1272–7. doi: 10.3324/Haematol.2011.056176
27. Ahmann GJ, Jalalsm SM, Juneau AL, Christensen ER, Hanson CA, Dewald GW, et al. A novel three-color, clonespecific fluorescence in situ hybridization procedure for monoclonal gammopathies. Cancer Genet Cytogenet. (1998) 101:7–11. doi: 10.1016/S0165-4608(97)00058-7
28. Dmoszynska A, Chocholska S. “Molecular biology methods in the diagnosis of multiple myeloma,” In: Witt M, Dawidowska M, Szczepanski T, editors. Molecular Aspects of Hematologic Malignancies: Diagnostic Tools and Clinical Applications. Berlin Heidelberg: Springer-Verlag (2012). p. 443–9. doi: 10.1007/978-3-642-29467-9_27
29. Carter A, Hocherman I, Linn S, Cohen Y, Tatarsky I. Prognostic significance of plasma cell morphology in multiple myeloma. Cancer. (1987) 60:1060–5. doi: 10.1002/1097-0142(19870901)60:5<1060::aid-cncr2820600522>3.0.co;2-3
30. Preacher KJ. Calculation for the Chi-Square Test: An Interactive Calculation Tool for Chi-Square Tests of Goodness of Fit and Independence [Computer Software] (2001). Available online at: http://www.quantpsy.org/chisq/chisq.htm (accessed March, 2019).
31. Gaunt TR, Rodriguez S, Day INM. Cubic exact solutions for the estimation of pairwise haplotype frequencies: implications for linkage disequilibrium analyses and a web tool 'cubex'. BMC Bioinformatics. (2007) 8:428. doi: 10.1186/1471-2105-8-428
32. Takanashi M, Morimoto A, Yagi T, Kuriyama K, Kano G, Imamura T, et al. Impact of glutathione S-transferase gene deletion on early relapse in childhood B-precursor acute lymphoblastic leukemia. Haematologica. (2003) 88:1238–44.
33. Canli O, Nicolas AM, Gupta J, Finkelmeier F, Goncharova O, Pesic M, et al. Myeloid cell-derived reactive oxygen species induce epithelial mutagenesis. Cancer Cell. (2017) 32:869–83.E5. doi: 10.1016/J.Ccell.2017.11.004
34. Hideshima T, Chauhan D, Schlossman R, Richardson P, Anderson KC. The role of tumor necrosis factor alpha in the pathophysiology of human multiple myeloma: therapeutic applications. Oncogene. (2001) 20:4519–27. doi: 10.1038/Sj.Onc.1204623
35. Carter A, Merchav S, Silvian-Draxler I, Tatarsky I. The role of interleukin-1 and tumour necrosis factor-alpha in human multiple myeloma. Br J Haematol. (1990) 74:424–31. doi: 10.1111/J.1365-2141.1990.Tb06330.X
36. White-Gilbertson S, Hua Y, Liu B. The role of endoplasmic reticulum stress in maintaining and targeting multiple myeloma: a double-edged sword of adaptation and apoptosis. Front Genet. (2013) 4:109. doi: 10.3389/Fgene.2013.00109
37. Burdon RH, Alliangana D, Gill V. Hydrogen peroxide and the proliferation of BHK-21 cells. Free Radic Res. (1995) 23:471–86. doi: 10.3109/10715769509065268
38. Burdon RH. Superoxide and hydrogen peroxide in relation to mammalian cell proliferation. Free Radic Biol Med. (1995) 18:775–94. doi: 10.1016/0891-5849(94)00198-S
39. Hamanaka RB, Chandel NS. Mitochondrial reactive oxygen species regulate cellular signaling and dictate biological outcomes. Trends Biochem Sci. (2010) 35:505–13. doi: 10.1016/J.Tibs.2010.04.002
40. Du J, Yuan Z, Zhang C, Fu W, Jiang H, Chen B, et al. Role of the TNF-A promoter polymorphisms for development of multiple myeloma and clinical outcome in thalidomide plus dexamethasone. Leuk Res. (2010) 34:1453–8. doi: 10.1016/J.Leukres.2010.01.011
41. Morgan Gj, Adamson Pj, Mensah Fk, Spink Cf, Law Gr, Keen Lj, et al. Haplotypes in the tumor necrosis factor region and myeloma. Br J Haematol. (2005) 129:358–65. doi: 10.1111/J.1365-2141.2005.05467.X
42. Neben K, Mytilineos J, Moehler TM, Preiss A, Kraemer A, Ho AD, et al. Polymorphisms of the tumor necrosis factor-gene promoter predict for outcome after thalidomide therapy in relapsed and refractory multiple myeloma. Blood. (2002) 100:2263–5.
43. Davies FE, Rollinson SJ, Rawstron AC, Roman E, Richards S, Drayson M, et al. High-producer haplotypes of tumor necrosis factor alpha and lymphotoxin alpha are associated with an increased risk of myeloma and have an improved progression-free survival after treatment. J Clin Oncol. (2016) 18:2843–51. doi: 10.1200/Jco.2000.18.15.2843
44. Brown EE, Lan Q, Zheng T, Zhang Y, Wang SS, Hoar-Zahm S, et al. Common variants in genes that mediate immunity and risk of multiple myeloma. Int J Cancer. (2007) 120:2715–22. doi: 10.1002/Ijc.22618
45. Li B, Wang XD, Sun X, Ma J, Yang Y, Ma X. Lack of association between TNF-A promoter polymorphisms and multiple myeloma: a meta-analysis. Leuk Res. (2013) 37:50–7. doi: 10.1016/J.Leukres.2012.08.027
46. Zhou L, Zhu YY, Zhang XD, Li Y, Liu ZG. Risk effects of GST gene polymorphisms in patients with acute myeloid leukemia: a prospective study. Asian Pac J Cancer Prev. (2013) 14:3861–4. doi: 10.7314/Apjcp.2013.14.6.3861
47. Kim HN, Kim NY, Yu L, Tran HT, Kim YK, Lee IK, et al. Association of GSTT1 polymorphism with acute myeloid leukemia risk is dependent on smoking status. Leuk Lymphoma. (2012) 53:681–7. doi: 10.3109/10428194.2011.625576
48. Yuille M, Condie A, Hudson C, Kote-Jarai Z, Stone E, Eeles R, et al. Relationship between glutathione S-transferase M1, T1, and P1 polymorphisms and chronic lymphocytic leukemia. Blood. (2002) 99:4216–8. doi: 10.1182/Blood.V99.11.4216
Keywords: GSTT1, GSTM1, TNF-alpha, rs1800629, rs361525, polymorphism, bortezomib, apoptosis
Citation: Zmorzyński S, Popek-Marciniec S, Szudy-Szczyrek A, Wojcierowska-Litwin M, Korszeń-Pilecka I, Chocholska S, Styk W, Hus M and Filip AA (2019) The Association of GSTT1, GSTM1, and TNF-α Polymorphisms With the Risk and Outcome in Multiple Myeloma. Front. Oncol. 9:1056. doi: 10.3389/fonc.2019.01056
Received: 03 April 2019; Accepted: 27 September 2019;
Published: 11 October 2019.
Edited by:
Alessandro Isidori, AORMN Hospital, ItalyReviewed by:
Guru Prasad Maiti, Oklahoma Medical Research Foundation, United StatesVesna Coric, University of Belgrade, Serbia
Mahmood A. Kayani, COMSATS Institute of Information Technology, Pakistan
Rong Xiao, Capital Medical University, China
Copyright © 2019 Zmorzyński, Popek-Marciniec, Szudy-Szczyrek, Wojcierowska-Litwin, Korszeń-Pilecka, Chocholska, Styk, Hus and Filip. This is an open-access article distributed under the terms of the Creative Commons Attribution License (CC BY). The use, distribution or reproduction in other forums is permitted, provided the original author(s) and the copyright owner(s) are credited and that the original publication in this journal is cited, in accordance with accepted academic practice. No use, distribution or reproduction is permitted which does not comply with these terms.
*Correspondence: Szymon Zmorzyński, cy56bW9yenluc2tpQGdtYWlsLmNvbQ==