
94% of researchers rate our articles as excellent or good
Learn more about the work of our research integrity team to safeguard the quality of each article we publish.
Find out more
ORIGINAL RESEARCH article
Front. Oncol. , 07 June 2019
Sec. Neuro-Oncology and Neurosurgical Oncology
Volume 9 - 2019 | https://doi.org/10.3389/fonc.2019.00482
 Prospero Civita1†
 Sara Franceschi1*†
 Paolo Aretini1
 Valerio Ortenzi2Michele Menicagli1
 Francesca Lessi1Francesco Pasqualetti3
 Antonio Giuseppe Naccarato2‡
 Chiara Maria Mazzanti1‡
Laser capture microdissection (LCM) coupled with RNA-seq is a powerful tool to identify genes that are differentially expressed in specific histological tumor subtypes. To better understand the role of single tumor cell populations in the complex heterogeneity of glioblastoma, we paired microdissection and NGS technology to study intra-tumoral differences into specific histological regions and cells of human GBM FFPE tumors. We here isolated astrocytes, neurons and endothelial cells in 6 different histological contexts: tumor core astrocytes, pseudopalisading astrocytes, perineuronal astrocytes in satellitosis, neurons with satellitosis, tumor blood vessels, and normal blood vessels. A customized protocol was developed for RNA amplification, library construction, and whole transcriptome analysis of each single portion. We first validated our protocol comparing the obtained RNA expression pattern with the gene expression levels of RNA-seq raw data experiments from the BioProject NCBI database, using Spearman's correlation coefficients calculation. We found a good concordance for pseudopalisading and tumor core astrocytes compartments (0.5 Spearman correlation) and a high concordance for perineuronal astrocytes, neurons, normal, and tumor endothelial cells compartments (0.7 Spearman correlation). Then, Principal Component Analysis and differential expression analysis were employed to find differences between tumor compartments and control tissue and between same cell types into distinct tumor contexts. Data consistent with the literature emerged, in which multiple therapeutic targets significant for glioblastoma (such as Integrins, Extracellular Matrix, transmembrane transport, and metabolic processes) play a fundamental role in the disease progression. Moreover, specific cellular processes have been associated with certain cellular subtypes within the tumor. Our results are promising and suggest a compelling method for studying glioblastoma heterogeneity in FFPE samples and its application in both prospective and retrospective studies.
Glioblastoma (GBM) is considered the most malignant primary tumor of the brain accounting for ~54% of all gliomas and 16% of all primary brain tumors (1). Although standard treatment at diagnosis is multimodal and include surgical resection, radiation, and systemic chemotherapy, patients usually have a median survival of ~14.6 mos. from diagnosis (2). The poor prognosis of GBM is mainly due to its diffuse infiltrative growth into the surrounding brain (3), making it extremely difficult to treat by total surgical resection or chemo-radiotherapy (4) and delaying the efficacy of treatments.
GBM is composed of an interactive network of neoplastic and non-neoplastic cells, such as microglia/macrophages, that account for about 40% of the tumor mass, reactive astrocytes, fibroblasts, pericytes and immune cells (5). These well-established networks, characterized by cell-cell interactions and connections of cellular compartments, create a complex micro-environment that constantly gives signals, activating cells migration and developing finally permissive niches that promote cancer cells survival and proliferation (6).
Histopathologic features, that distinguish GBM from lower grade astrocytomas, are found near the contrast-enhancing rim that surrounds the tumor core and includes (1) foci of necrosis, usually with evidence of surrounding cellular pseudopalisades (“pseudopalisading necrosis”); (2) microvascular hyperplasia, a form of angiogenesis morphologically recognized as endothelial proliferation within newly sprouted vessels (7), and (3) “perineuronal satellitosis,” typical grouping of neoplastic astrocytes around neurons when the tumor infiltrates the gray matter (8). Connections between these cells compartments play an important role in the development and malignant progression of glioblastoma.
Therefore, it is essential to study the expression profiles of each cell compartment independently, to clarify the interaction between cells and their microenvironment.
To this end, we have applied laser capture microdissection (LCM) to isolate groups of cells from specific tissue compartments of human GBM FFPE tissues. LCM is a cutting-edge technology for isolating pure cell populations from a heterogeneous tissue sample. It can accurately target and capture cells of interest for a wide range of downstream analyses (9). Several studies have questioned tumor heterogeneity using samples of fresh frozen tissues (FF) or biopsies, encountering some relative limitations such as low starting material and privileged diagnostic procedures, lack of clinical annotations or long-term follow-up (10). FFPE tissue samples stored in diagnostic pathology biobank represent a suitable material to overcome these limitations and becoming an attractive source for retrospective and prospective studies. Moreover, the process of formalin-fixed paraffin-embedding is so far the most suitable histological method for stabilizing and preserving tissues with native morphology and cellular structures. FFPE tissues can be stored long term at room temperature and used over decades. For these reasons, despite poor quality and quantity of nucleic acids extracted from FFPE tissue, the number of molecular studies incorporating FFPE material is increasing.
In the last decade the advances in next-generation sequencing (NGS) technology has allow to explore a wide range of molecular analysis (i.e., genomic, epigenomic, and transcriptomic) using limited quality/quantity of material. The powerful and in-depth analysis of NGS technology starting from a limited quantity of material and fragmented sequences makes this technology suitable for the study of FFPE tissues.
Here, we investigate the applicability of our custom protocol for isolation of specific histopathological regions of GBM in FFPE tissues, extraction of total RNA, amplification and whole trascriptome analysis (RNA-seq). This method coupled LCM and RNA-seq (LCM-seq) and allows to study the expression profile of each single compartment, thus clarifying its role in the complexity of the tumor.
Three primary human FFPE GBM surgical specimens, diagnosed according to WHO diagnostic criteria (11), were retrieved from the archives of the Tumor Registry of the Anatomy and Pathology Institute of the University of Pisa. Subjects were chosen by the same pathologist, they have same histology, similar conditions and treatments. All cases had a diagnosis of GBM with no previous history of any brain neoplasia and have been diagnosed without R132 IDH1 mutations or R172 IDH2 mutations and 1p/19q co-deletions. Patients underwent maximal tumor resection performed by the same surgeon at the University Hospital of Pisa. All three tumors were located in the right temporal lobe and developed a relapse after 7–8 months from the first surgery. The study was approved by the Ethics Committee of the University Hospital of Pisa and all methods were performed in accordance with approved guidelines. Patient's data and samples have been completely anonymized.
Samples were selected to have six specific histological compartments: central tumor cells (tumor core astrocytes—TC), pseudopalisading cells surrounding the necrotic area (pseudopalisading astrocytes—PTC), infiltrating astrocytes forming perineuronal satellites (perineuronal astrocytes in satellitosis—PS), neurons surrounded by satellite astrocytes (neurons with satellitosis—NS), neo-vessels or microvascular proliferation (tumor blood vessels—TV) and normal blood vessels (NV).
FFPE tissue blocks were sectioned at 5 μm, mounted on slides covered with polyethylene-naphthalate (PEN)-membrane (Zeiss, Oberkochen, Germany) and left to dry overnight at room temperature. Sections were stained with hematoxylin and eosin (H&E). All steps were performed under RNase-free conditions. Visualization and microdissection was performed with PALM RoboMover Automatic Laser Capture Microdissector (Zeiss). Microdissected areas ranged from 33,700 up to 364,016 μm2.
Microdissected areas were directly incubate with 50 μl of lysis buffer PKD (Qiagen, Venlo, Netherlands) and 10 μl of proteinase K solution (Promega, Madison, WI, USA) at 56°C overnight. The day after samples were centrifuged at maximum speed for 10 min. RNA was purified using the Maxwell 16 LEV RNA FFPE Purification Kit (Promega) following manufacturer's instructions.
RNA was reverse transcribed with the SMART (Switching Mechanism at 5' End of RNA Template) technology that allows the efficient incorporation of known sequences at both ends of cDNA during first-strand synthesis, without adapter ligation, using the SMARTer Pico PCR cDNA Synthesis Kit (Clontech Laboratories Mountain View, CA) following manufacturer's instructions. Twenty amplification cycles were required to obtain sufficient library concentration for sequencing. cDNA concentration was determined using the Qubit Fluorometer (Life Technologies, Carlsbad, CA) and the quality was tested using the Agilent 2200 Tapestation (Agilent Technologies, Santa Clara, CA) system.
For each sample, 50 ng of cDNA were used as input material forge of total RNA will be used as input material for library construction according to Nextera XT DNA Library Preparation Kit (Illumina, San Diego, CA) protocol. Each NGS run included 6 pooled libraries loaded into one NextSeq High Output cartridge (300 Cycles; Illumina). Paired-end sequencing was performed on a NextSeq 500 system (Illumina) with 152 cycles (76 bp PE sequencing) following Encode Project protocol for best RNA Seq data (12). Individual microdissected areas inside each sample are unique to that section and therefore not repeatable through biological replicates. However, the biological triplicate can be considered the one composed of three different samples analyzed for the same areas, as correlation, PCA and differential analyses, evaluate the average value of the three samples.
Raw sequencing data were processed with AltAnalyze software (v2.1.0, Cincinnati Children's Hospital, Dr. Nathan Salomonis, Cincinnati, OH, USA) to generate Principal Component Analyses (PCA) and expression clustering profiles of RNA-seq data sets.
Spearman's rank correlation coefficients was used to evaluate our experimental performance by calculating the correlation between RNA-seq raw data experiments of each tumor compartments and between RNA-seq raw data from the BioProject NCBI database (13–18), depending on the cell type, analyzed using the same experimental approach of data analysis. Normal tissue cortex we downloaded from the Gene Expression Omnibus (GEO) GSE102741 dataset (16) and used as normal control.
Functional enrichment analysis of the DEGs between tumor compartments and control tissue and between different tumor compartments was performed using FunRich (19) analysis tool. Functional enrichment was carried out for Biological process and Biological pathways.
DEGs from functional enrichment analysis were associated with survival analysis within the glioma microarray dataset (Tumor Glioma French-284-MAS5.0-u133p2) from the R2: Genomics Analysis and Visualization Platform (http://r2.amc.nl). Kaplan-Meier analysis was conducted online, and p-values were calculated by the R2 platform user interface with log-rank test. A cutoff method “Kaplan median” provided on the R2 platform was used to separate high and low expression groups of genes.
Tumor cell purity was around 80% for all samples, with the remaining 20% consisting of hemorrhagic tissue. Tumor core regions represented from 33 up to 67% (Table 1, Figure 1) of the sample. Consistent with glioblastoma, prominent necrosis and microvascular proliferation were visible in each sample (Table 1, Figure 1). A percentage of about 5% of astrocytes migrated into satellites was evident in all three samples (Table 1, Figure 1).
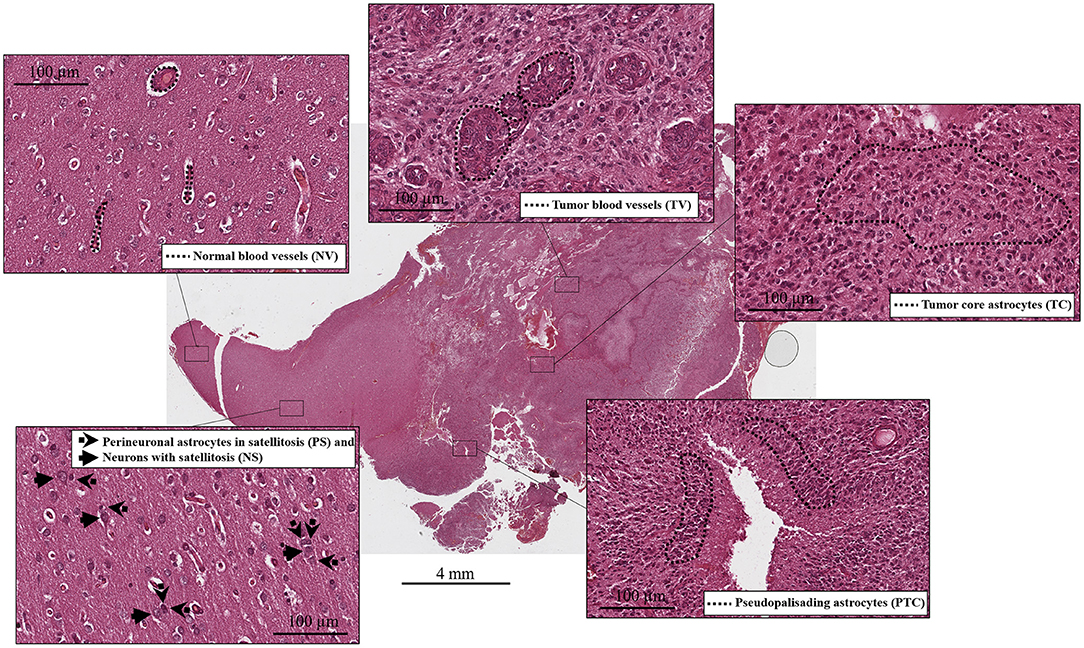
Figure 1. Histological compartments: central tumor cells (tumor core astrocytes—TC), pseudopalisading cells surrounding the necrotic area (pseudopalisading astrocytes—PTC), infiltrating astrocytes forming perineuronal satellites (perineuronal astrocytes in satellitosis—PS), neurons surrounded by satellite astrocytes (neurons with satellitosis—NS), neo-vessels or microvascular proliferation (tumor blood vessels—TV) and normal blood vessels (NV).
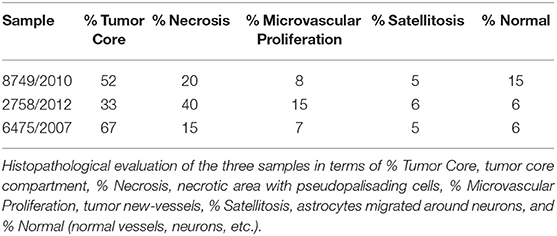
Table 1. Histopathologic features of GBM specimens used in this study.
We were able to select and isolate cellular compartment areas ranging from 33,700 up to 364,016 μm2. An average of 23.2 ± 4.7 ng/μl cDNA was obtained from all portions of the three samples. Total cDNA yield and integrity were evaluated as suitable to start library construction (Figure 2).
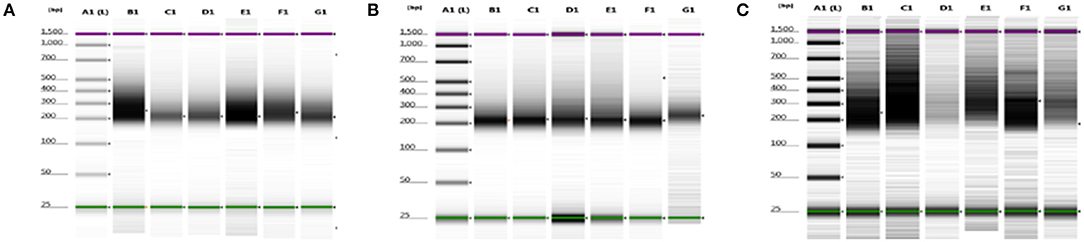
Figure 2. cDNA quality check using gel electrophoresis after SMARTer protocol. (A–C) Gel images of 8749/2010, 2758/2012, and 6475/2007 samples, respectively. Purple and green lines are intrinsic upper and lower markers, respectively. (A–C) Three independent experiments. Lane A1, ladder; lanes B1–G1 sample compartments (B1, PTC; C1, TC; D1, PS; E1, NS; F1, TV; G1, NV).
Averages of total areas of collected cells and cDNA yields, after SMARTer protocol, between the 3 samples, for each compartment, are listed in Table 2.
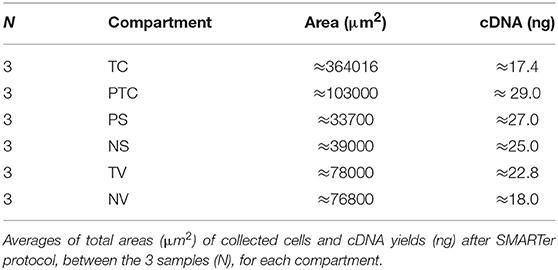
Table 2. cDNA yield after SMARTer protocol.
To address whether the expression pattern of RNA obtained from LCM and linear amplification (Supplementary Table 1) accurately reflects that of the corresponding cell compartment, we computed Spearman's correlation coefficients using RNA-seq raw data experiments from the BioProject NCBI database as controls (Table 3). The correlation score shows an average coefficient up to 0.65 for tumor core, microvascular proliferation and neurons (p < 0.001), while pseudopalisading cells and normal vessels show an average coefficient of 0.5 (p < 0.05), (Figure 3, Table 3). Moreover, to investigate the reliability and the integrity of our NGS transcription data results for each compartment, we evaluated the expression of genes considered as housekeeping candidates in human normal brain tissue, glioblastoma and endothelial cells (20–22) (RPL13A, RPL4, CYC1, EIF4A2).
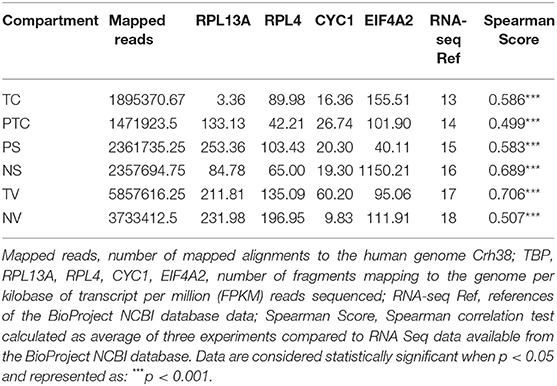
Table 3. Transcription data results and Spearman correlation score.
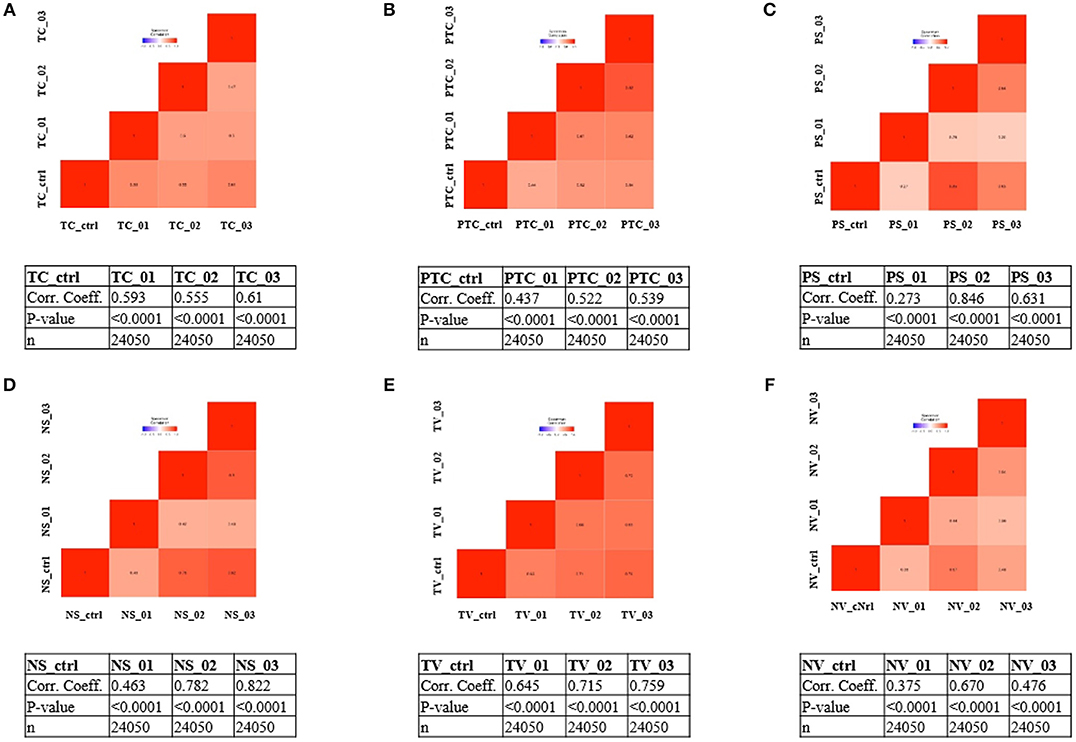
Figure 3. Correlation matrix showing Spearman's correlation coefficients of each experimental compartment RNA-seq raw data and experiments from the BioProject NCBI database as controls. (A) tumor core astrocytes—TC; (B) pseudopalisading astrocytes—PTC; (C) perineuronal astrocytes in satellitosis—PS; (D) neurons with satellitosis—NS; (E) tumor blood vessels—TV; (F) normal blood vessels—NV.
To visualize gene expression differences between each cellular subgroup and control tissue, we performed principal-component analysis (PCA) using all tumor compartments compared to control tissue RNA-seq raw data experiments from the Gene Expression Omnibus (GEO) GSE102741 dataset (16). PCA showed that control tissue and the tumor samples groups always segregated in two different areas of the 2D plots in the first dimension (PC1), (Figure 4A). 8585 mRNA genes were Differentially Expressed (DEGs) when considering a significance threshold of p < 0.05.
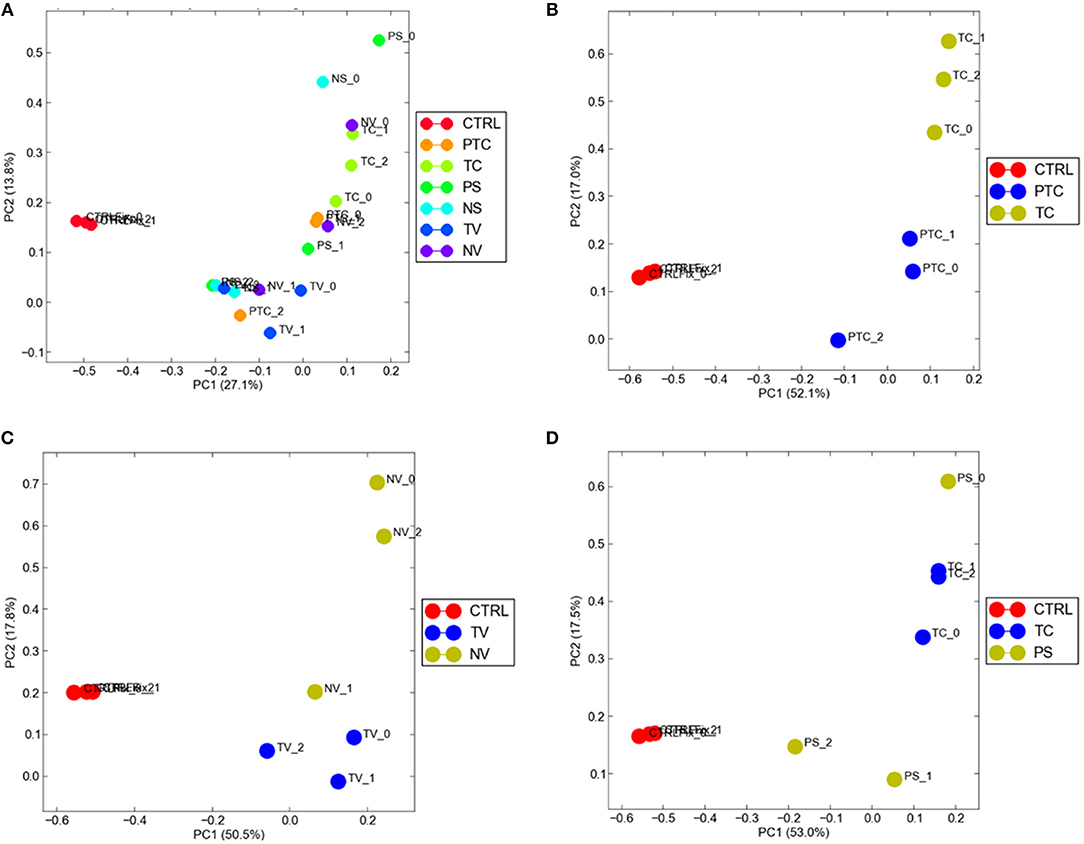
Figure 4. Distribution of normal tissues and cancer subtypes in the principal component space. (A) control tissue and the tumor samples are represented in two different areas of the 2D plots in the first dimension (PC1); gene expression diversity was captured and segregated in three different areas by the second dimension (PC2) when compared TC and PTC (B), TC and PS (C), TV and NV (D).
When comparing two different compartments to each other and to control, gene expression diversity was captured and segregated in three different areas by the second dimension (PC2). We observed gene expression differences comparing TC and PTC (Figure 4B), TC and PS (Figure 4C), and between TV and NV (Figure 4D).
To identify possible pathways that are significantly associated with the tumor, functional enrichment analysis was first computed on 8,585 differentially regulated genes (Supplementary Table 1), that contribute to the largest variation in PC1-axis (Figure 2A). Functional enrichment investigation shows biological processes and pathways deregulation in tumor compartments compared to control tissue, when considered DEGs with p < 0.05 (Table 4). The majority of DEGs belonged to the signal transduction/cell communication biological processes, including the tyrosine kinase-type cell surface receptor 4 (HER4), Filamin B (FLNB), Integrins (ITGA2, ITGA4,ITGA8, ITGA9, ITGB7, ITGBL1) and the proto-oncogene tyrosine-protein kinase SRC. Among the DEGs involved in transmembrane transport of small molecules we found aquaporins genes (AQP6, AQP7, AQP9, AQP10, AQP11). The most representative DEGs involved in cell growth and/or maintenance take part to the remodeling and homeostasis of the extracellular matrix (ECM). The expression of metalloproteinases and their inhibitors (MMP15, MMP16, MMP17, MMP24, TIMP1), laminins (LAMA2, LAMA3), collagen gene family members (COL4A2, COL4A3, COL4A3BP, COL4A5, COL6A1, COL9A2, COL10A1, COL11A1, COL11A2, COL12A1, COL17A1, COL18A1, COL19A1, COL21A1, COL24A1, COL25A1, COL26A1, COL27A1, COL28A1, COLGALT2) and tight junction components and adaptors (CLDN1, CLDN3, CLDN4, CLDN6, CLDN9, CLDN10, CLDN11, CLDN16, CLDN20, CLDN24, TJP1, TJP2, TJP3) was found altered in the tumor compartments compared to normal control tissue.
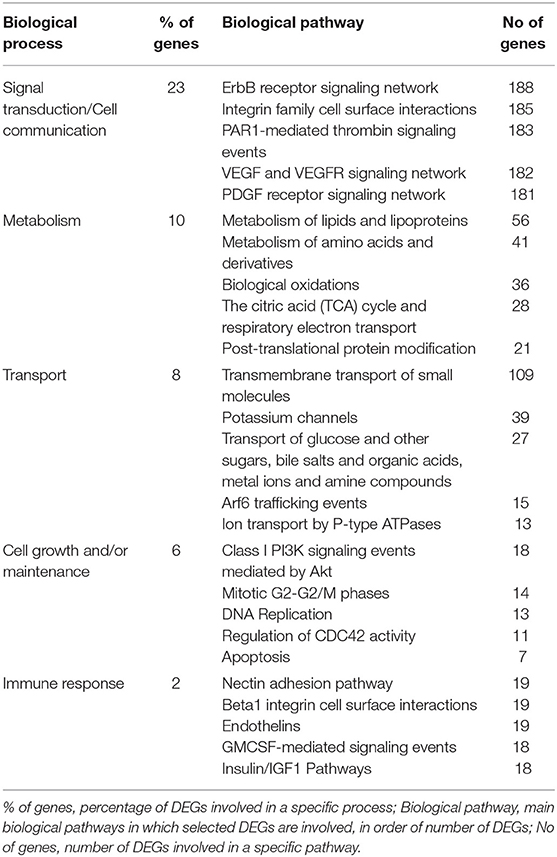
Table 4. Top 5 biological processes and relative pathway annotations for DEGs between all tumor compartments and control tissue.
DEGs analysis showed a total of 249 genes (Supplementary Table 1), of which 15 down-regulated and 234 up-regulated in pseudopalisading areas, when compared to tumor core areas. Functional enrichment analysis highlighted up-regulated DEGs of pseudopalisading compartments in TOP 5 biological pathways, according to DEGs number (Figure 5A). In particular, we found an overexpression of proangiogenic genes and pathways and genes involved in cell migration in PTC cells, such as Angiopoietin 2 (ANGPT2), Urokinase Plasminogen Activator Receptor (PLAUR), Growth Differentiation Factor 15 (GDF15), Matrix Gla Protein (MGP), Proto-oncogene serine/threonine-protein kinase Pim-1 (PIM1), Cullin 1 (CUL1), and Mitogen-activated protein kinases—MAPK (MAP3K6 and MAPK7).
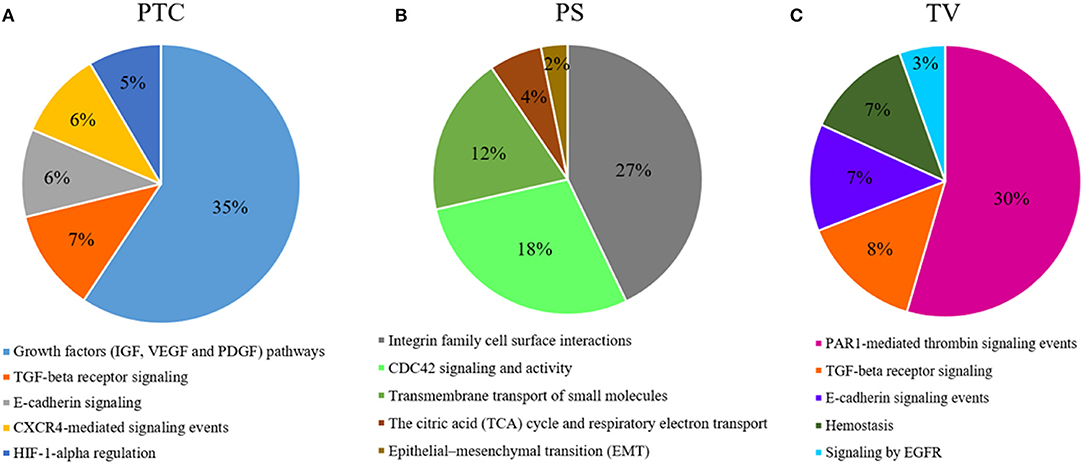
Figure 5. Functional enrichment analysis of DEGs. Top 5 biological processes up-regulated with percentage of DEGs involved in a specific pathway in (A), PTC to pseudopalisading astrocytes and, (B) PS perineuronal astrocytes comparing to TC tumor core astrocytes and, (C) TV tumor blood vessels comparing to normal blood vessels.
Comparing astrocytes in satellitosis to astrocytes in the tumor core, we found 358 DEGs (Supplementary Table 1). Two hundred and fifty six DEGs were specifically up-regulated in neoplastic astrocytes in satellitosis. We explored individual pathways from functional enrichment analysis, finding the TOP 5 biological pathways (Figure 5B) up-regulated in astrocytes in satellitosis. PS compartment overexpresses specific metalloproteinases (MMP9 and MMP28) and aquaporins (AQP1 and AQP4). Furthermore, PS cells overexpressed BRCA1 and Secreted Protein Acidic and Cysteine Rich like protein 1 (SPARCL1).
Functional enrichment analysis computed on 1,049 up-regulated genes in tumor vessels compared to normal vessels, out of 1,157 total DEGs (Supplementary Table 1), shows (Figure 5C) the TOP 5 biological pathways in which DEGs are involved. Endothelial cells of tumor neo-vessels, over-expressed a string of DEGs correlated with the signaling pathways that govern tumor angiogenesis, including the vascular endothelial growth factor receptor 3 (VEGFR3 or FLT4), HIF-1A, ANGPT2, Metalloproteinases (MMP11 and MMP15) and Integrins (ITGA2, ITGAE, and ITGB1BP1).
The association between DEGs from functional enrichment analysis and survival outcome is shown in Table 5 (Kaplan Meier survival curves are available in Supplementary Figures 1–4). We selected the top 5 significant associations within DEGs between GBM and Control Tissues and the top 5 significant associations within overexpressed DEGs of PTC cells vs. CT cells, PS cells vs. CT cells and TV vs. NV endothelial cells.
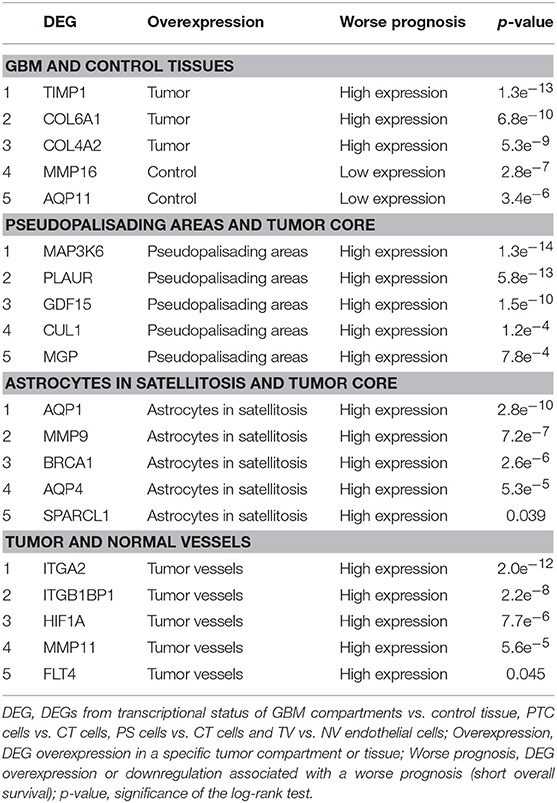
Table 5. Association between DEGs from functional enrichment analysis and survival outcome.
GBM is a devastating brain tumor disease for which no effective therapies are available (23). Large-scale genetic investigations have identified several mutations in key genes in GBM and TCGA consortium have provide molecular subtypes classification systems to specifically stratify GBM patients (24, 25). Nonetheless, the causes of GBM recurrence and drug resistance are still unknown. Although astrocytes are the most affected cells in GBM, other cell types such as microglia, oligodendrocytes, neurons and pericytes in different histological compartment may contribute to progression and to relapse of the disease (26). Moreover, GBM is also compartmentalized in anatomically distinct regions, referred to as morphologically and functionally distinct tumor niches (27).
Previous studies have interrogated tumor heterogeneity by analyzing the transcriptome profile of fresh/frozen primary tumor tissues (28, 29) and tumor single-cells (30–32). However, these studies still lack a systematic understanding of the molecular heterogeneity of the tumor in relation to anatomic heterogeneity. In this regard, further studies have assigned genomic alterations and gene expression profiles to specific anatomical features of glioblastoma. These investigations explored regional intratumoral differences in tumor periphery and core regions (14, 33), such as one has also considered the necrotic zone (34), while the most complete (35, 36), from which the Ivy Glioblastoma Atlas originated, analyzed 5 different tumor regions (leading edge, infiltrating tumor, cellular tumor, pseudopalisading cells around necrosis, and microvascular proliferation). The use of fresh/frozen samples, compared to FFPE tissues, certainly increases the quality of both extracted RNA and gene expression data, but does not allow to discriminate tumor compartments edges and structures, at the single cells level.
To characterize whole transcriptome modifications related to specific compartments, we conducted a LCM-seq study of 6 different tumor cell subpopulations in 3 human FFPE GBM samples: tumor core astrocytes—TC, pseudopalisading astrocytes—PTC, perineuronal astrocytes in satellitosis—PS, neurons with satellitosis—NS, tumor blood vessels—TV and normal blood vessels—NV. We first validated our data comparing LCM-seq expression values of each compartment to gene expression levels of RNA-Seq raw data from the Bio Project databases of NCBI (13–18), by applying Spearman correlation test (37) and finding good concordance in each dissected tumor compartment.
We performed, next, a principal component analysis (PCA), demonstrating that samples originating from each experimental group were clustered and indicating that each tumor compartment exhibit distinct gene expression profile. RNA-Seq data of normal human cerebral cortex tissue (16) was used as control to find differential expressed genes compared to all tumor groups. Our results shown a gene expression alteration of the principal genes involved in tumorigenesis and cancer progression mostly of them linked to signal pathways in glioblastoma. The majority of DEGs belonged to the signal transduction/cell communication biological processes. These DEGs have been already described in literature in association with GBM patient survival (38) and GBM tumor progression (39–43). An alteration of metabolism processes has also been found altered in our tumor samples, above all, the metabolism of lipids and amino acids, known to be altered in GBM (44–46). Among the DEGs involved in transmembrane transport of small molecules we found aquaporins genes. Several studies have shown the involvement of aquaporins in many aspects of brain pathogenesis, such as promotion of tumor cells motility and invasion, as well as formation of edema and improvement of tumor cells glycolytic metabolism (47). The most representative DEGs involved in cell growth and/or maintenance take part to the remodeling and homeostasis of the extracellular matrix (ECM). In GBM progression, the role of the ECM in cell migration and invasion and its correlation with patient survival has already been fully established (48–59).
RNA-Seq data of the single selected regions provide a snapshot of transcriptomic events that identify the current state of the tumor, characterized by the up and down-regulation of several genes. Although our data do not provide evidence on early molecular events, transcriptomic results seem to support that certain molecular events are region specific and each process is strictly dependent on others. We, therefore, tried to point out specific ongoing processes in each individual compartment, highlighting which are the up- or down-regulated genes of the specific microenvironment and not of the whole tumor. We have compared the transcriptional status of PTC cells vs. CT cells, PS cells vs. CT cells and TV vs. NV endothelial cells.
Our results of DEGs analysis in pseudopalisading cells compared to tumor core showed a considerable (35% of DEGs) up-regulation in genes involved in growth factors (IGF, VEGF, and PDGF) signaling pathways. Moreover, in PTC cells, we found an overexpression of genes belonged to TGF-beta receptor signaling, E-cadherin signaling, CXCR4-mediated signaling events and Hypoxic and oxygen homeostasis regulation of HIF-1-alpha. Pseudopalisades are described as waves of tumor and hypoxic cells that actively migrate away from an area of central hypoxia. These cells are known to overexpress the inducible hypoxia factor-1 (HIF-1) and other transcripts that suggest a response to a hypoxic microenvironment, such as those related to glycolysis, angiogenesis, and cell cycle control (7, 60). In particular, we found an overexpression of proangiogenic genes and pathways and genes involved in cell migration in PTC cells, known to promote cell survival and infiltrative growth, migration, angiogenesis and resistance to cancer-targeted therapies in GBM (61–67). Moreover, MAPKs participate in the regulation of vascular endothelial growth factor (VEGF) expression (68) and lead to the elevated level of HIF-1 protein which act as proangiogenic factor promoting cancer angiogenesis (69).
To explain the spread of neoplastic astrocytes to normal brain parenchyma, we have collected astrocytes around neurons in a specific histological configuration, named perineuronal satellitosis. This phenomenon is not even detectable through sophisticated surgical approaches and neuro-imaging acquisition but only appreciable at the histological level. Evidence suggest that astrocytes can be implicated in tumor propagation and in infiltration. Besides moving over long distances along myelinated fiber tracts and blood vessels, astrocytes can also cluster around neuronal soma (27, 70). Isolated astrocytes in neuronal satellitosis displayed a high activation of the Integrin family cell surface interactions pathways, responsible for the interaction of endothelial and tumor cells with the ECM (71). Other pathways represented by various DEGs overexpressed by astrocytes in satellitosis are the cell division control protein 42 homolog (CDC42) signaling and activity pathways. Previous studies have already demonstrate a correlation between CDC42 activation and increased aggressiveness and invasiveness of malignant gliomas (72). The other most representative pathways of this compartment are the transmembrane transport of small molecules, the citric acid (TCA) cycle and respiratory electron transport and epithelial-mesenchymal transition (EMT). PS compartment overexpresses specific metalloproteinases and aquaporins, crucial in cell migration as already mentioned above. Furthermore, PS cells overexpressed BRCA1 and SPARCL1, already known in GBM to promote tumor cell viability, migration and invasion and to correlate with patients prognosis (73, 74).
The presence of microvascular proliferation is one of the most important morphologic features of glioblastoma (75). Several mechanisms have been involved in blood vessels formation of GBM, such as germination of capillaries from pre-existing blood vessels through endothelial proliferation and tumor cells release of angiogenic factors (76). Blocking VEGF/VEGFR signaling, to reduce and trim the growth of tumor vessels, emerged as the first promising treatment strategy in GBM patients. However, to date, the anti-VEGF therapy has helped only a small subset of GBM patients, and those patients demonstrated only transient improvements without achieving overall survival benefits (27). Most of the DEGs overexpressed in the endothelial cells of the tumor neo-vessels, compared to those of the normal vessels, are grouped by the functional enrichment analysis under the PAR1-mediated thrombin signaling events pathway. PAR-1 plays an important role in angiogenesis and its expression is also directly associated with increased VEGF levels (77). FLT4 DEG is not expressed in endothelium of normal brain, in physiological adult tissues, but its mRNA was found only in high-grade gliomas and its expression has been correlated with tumor grade (78). Other angiogenetic key factors, such as HIF-1A, ANGPT2, Metalloproteinases, and Integrins were found over-expressed in the endothelial cells of microvascular proliferation.
In this study, we provide a feasible and reliable method for isolating pure GBM cell populations from different histological compartments, with LCM approach, minimizing cross-contamination. Our results demonstrate the suitability of LCM coupled to deep transcriptome sequencing for capturing molecular changes in different GBM compartments and investigating the tumor heterogeneity. Our results are promising and suggest that LCM-seq is a sensitive technology that may be used to study FFPE specimens in both prospective and retrospective archive-based studies. Transcriptome profile of neurons with satellitosis (NS) will be used in future studies in the comparison to neurons microdissected from healthy marginal areas. This will allow a better characterization also of the interactions occurring between the astrocytes surrounding the neuron and the neuron itself.
This manuscript contains previously unpublished data. The name of the repository and accession number are not available.
The study was approved by the Ethics Committee of the University Hospital of Pisa and all methods were performed in accordance with approved guidelines. Patient's data and samples have been completely anonymized.
AN, SF, CM, and PC conceived the idea. FP provided patient data and material. PC, MM, and FL contributed to the sample-preparations. PC, MM, and FL carried out the laboratory analyses. VO and MM performed laser capture microdissection. PA performed the statistics. SF and PC analyzed and interpreted the data. CM was involved in the planning and supervising. SF and PC wrote the manuscript and designed the figures; contributed equally to this work. All authors read and approved the final manuscript.
The authors declare that the research was conducted in the absence of any commercial or financial relationships that could be construed as a potential conflict of interest.
The Supplementary Material for this article can be found online at: https://www.frontiersin.org/articles/10.3389/fonc.2019.00482/full#supplementary-material
1. Tamimi AF, Juweid M. Chapter 8. Epidemiology and outcome of glioblastoma. In: De Vleeschouwer S, editor. Glioblastoma. Brisbane, QLD: Codon Publications (2017).
2. Davis ME. Glioblastoma: overview of disease and treatment. Clin J Oncol Nurs. (2016) 20(Suppl. 5):S2–8. doi: 10.1188/16.CJON.S1.2-8
3. Hou LC, Veeravagu A, Hsu AR, Tse VC. Recurrent glioblastoma multiforme: a review of natural history and management options. Neurosurg Focus. (2006) 20:E5.
4. Kumar HR, Zhong X, Sandoval JA, Hickey RJ, Malkas LH. Applications of emerging molecular technologies in glioblastoma multiforme. Expert Rev Neurother. (2008) 8:1497–506. doi: 10.1586/14737175.8.10.1497
5. Matias D, Balça-Silva J, da Graça GC, Wanjiru CM, Macharia LW, Nascimento CP, et al. Microglia/Astrocytes-glioblastoma crosstalk: crucial molecular mechanisms and microenvironmental factors. Front Cell Neurosci. (2018) 12:235. doi: 10.3389/fncel.2018.00235
6. Wels J, Kaplan RN, Rafii S, Lyden D. Migratory neighbors and distant invaders: tumor-associated niche cells. Genes Dev. (2008) 22:559–74. doi: 10.1101/gad.1636908
7. Rong Y, Durden DL, Van Meir EG, Brat DJ. 'Pseudopalisading' necrosis in glioblastoma: a familiar morphologic feature that links vascular pathology, hypoxia, and angiogenesis. J Neuropathol Exp Neurol. (2006) 65:529–39. doi: 10.1097/00005072-200606000-00001
8. Tehrani M, Friedman TM, Olson JJ, Brat DJ. Intravascular thrombosis in central nervous system malignancies: a potential role in astrocytoma progression to glioblastoma. Brain Pathol. (2008) 18:164–71. doi: 10.1111/j.1750-3639.2007.00108.x
9. Liu A. Laser capture microdissection in the tissue biorepository. J Biomol Tech. (2010) 21:120–5.
10. Liu Y, Noon AP, Aguiar Cabeza E, Shen J, Kuk C, Ilczynski C, et al. Next-generation RNA sequencing of archival formalin-fixed paraffin-embedded urothelial bladder cancer. Eur Urol. (2014) 66:982–6. doi: 10.1016/j.eururo.2014.07.045
11. Louis DN, Perry A, Reifenberger G, von Deimling A, Figarella-Branger D, Cavenee WK, et al. The 2016 World Health Organization classification of tumors of the central nervous system: a summary. Acta Neuropathol. (2016) 131:803–20. doi: 10.1007/s00401-016-1545-1
12. Hitz BC, Rowe LD, Podduturi NR, Glick DI, Baymuradov UK, Malladi VS, et al. SnoVault and encodeD: a novel object-based storage system and applications to ENCODE metadata. PLoS ONE. (2017) 12:e0175310. doi: 10.1371/journal.pone.0175310
13. Blein S, Bardel C, Danjean V, McGuffog L, Healey S, Barrowdale D, et al. Comparison of RNA-sequencing from fresh frozen or formalin-fixed paraffin-embedded tissue in glioblastoma. In: Clinical Interventional Oncology. Miami, FL: BioProject (2016).
14. Darmanis S, Sloan SA, Croote D, Mignardi M, Chernikova S, Samghababi P, et al. Single-cell RNA-seq analysis of infiltrating neoplastic cells at the migrating front of human glioblastoma. Cell Rep. (2017) 21:1399–410. doi: 10.1016/j.celrep.2017.10.030
15. Casselli T, Qureshi H, Peterson E, Perley D, Blake E, Jokinen B, et al. MicroRNA and mRNA transcriptome profiling in primary human astrocytes infected with Borrelia burgdorferi. PLoS ONE. (2017) 12:e0170961. doi: 10.1371/journal.pone.0170961
16. Wright C, Shin JH, Rajpurohit A, Deep-Soboslay A, Collado-Torres L, Brandon NJ, et al. Altered expression of histamine signaling genes in autism spectrum disorder. Transl Psychiatry. (2017) 7:e1126. doi: 10.1038/tp.2017.87
17. Pan X, Wang B, Yuan T, Zhang M, Kent KC, Guo LW. Analysis of combined transcriptomes identifies gene modules that differentially respond to pathogenic stimulation of vascular smooth muscle and endothelial cells. Sci Rep. (2018) 8:395. doi: 10.1038/s41598-017-18675-2
18. Belt H, Koponen JK, Kekarainen T, Puttonen KA, Mäkinen PI, Niskanen H, et al. Temporal dynamics of gene expression during endothelial cell differentiation from human iPS cells: a comparison study of signalling factors and small molecules. Front Cardiovasc Med. (2018) 5:16. doi: 10.3389/fcvm.2018.00016
19. Pathan M, Keerthikumar S, Ang CS, Gangoda L, Quek CY, Williamson NA, et al. FunRich: an open access standalone functional enrichment and interaction network analysis tool. Proteomics. (2015) 15:2597–601. doi: 10.1002/pmic.201400515
20. Aithal MG, Rajeswari N. Validation of housekeeping genes for gene expression analysis in glioblastoma using quantitative real-time polymerase chain reaction. Brain Tumor Res Treat. (2015) 3:24–9. doi: 10.14791/btrt.2015.3.1.24
21. Urich E, Lazic SE, Molnos J, Wells I, Freskgård PO. Transcriptional profiling of human brain endothelial cells reveals key properties crucial for predictive in vitro blood-brain barrier models. PLoS ONE. (2012) 7:e38149. doi: 10.1371/journal.pone.0038149
22. Penna I, Vella S, Gigoni A, Russo C, Cancedda R, Pagano A. Selection of candidate housekeeping genes for normalization in human postmortem brain samples. Int J Mol Sci. (2011) 12:5461–70. doi: 10.3390/ijms12095461
23. Ozdemir-Kaynak E, Qutub AA, Yesil-Celiktas O. Advances in glioblastoma multiforme treatment: new models for nanoparticle therapy. Front Physiol. (2018) 9:170. doi: 10.3389/fphys.2018.00170
24. Verhaak RG, Hoadley KA, Purdom E, Wang V, Qi Y, Wilkerson MD, et al. Integrated genomic analysis identifies clinically relevant subtypes of glioblastoma characterized by abnormalities in PDGFRA, IDH1, EGFR, and NF1. Cancer Cell. (2010) 17:98–110. doi: 10.1016/j.ccr.2009.12.020
25. Brennan CW, Verhaak RG, McKenna A, Campos B, Noushmehr H, Salama SR, et al. The somatic genomic landscape of glioblastoma. Cell. (2013) 155:462–77. doi: 10.1016/j.cell.2013.09.034
26. Bonavia R, Inda MM, Cavenee WK, Furnari FB. Heterogeneity maintenance in glioblastoma: a social network. Cancer Res. (2011) 71:4055–60. doi: 10.1158/0008-5472.CAN-11-0153
27. Hambardzumyan D, Bergers G. Glioblastoma: defining tumor niches. Trends Cancer. (2015) 1:252–65. doi: 10.1016/j.trecan.2015.10.009
28. Parker NR, Hudson AL, Khong P, Parkinson JF, Dwight T, Ikin RJ, et al. Intratumoral heterogeneity identified at the epigenetic, genetic and transcriptional level in glioblastoma. Sci Rep. (2016) 6:22477. doi: 10.1038/srep22477
29. Sottoriva A, Spiteri I, Piccirillo SG, Touloumis A, Collins VP, Marioni JC, et al. Intratumor heterogeneity in human glioblastoma reflects cancer evolutionary dynamics. Proc Natl Acad Sci USA. (2013) 110:4009–14. doi: 10.1073/pnas.1219747110
30. Patel AP, Tirosh I, Trombetta JJ, Shalek AK, Gillespie SM, Wakimoto H, et al. Single-cell RNA-seq highlights intratumoral heterogeneity in primary glioblastoma. Science. (2014) 344:1396–401. doi: 10.1126/science.1254257
31. Müller S, Liu SJ, Di Lullo E, Malatesta M, Pollen AA, Nowakowski TJ, et al. Single-cell sequencing maps gene expression to mutational phylogenies in PDGF- and EGF-driven gliomas. Mol Syst Biol. (2016) 12:889. doi: 10.15252/msb.20166969
32. Yuan J, Levitin HM, Frattini V, Bush EC, Boyett DM, Samanamud J, et al. Single-cell transcriptome analysis of lineage diversity in high-grade glioma. Genome Med. (2018) 10:57. doi: 10.1186/s13073-018-0567-9
33. Van Meter T, Dumur C, Hafez N, Garrett C, Fillmore H, Broaddus WC. Microarray analysis of MRI-defined tissue samples in glioblastoma reveals differences in regional expression of therapeutic targets. Diagn Mol Pathol. (2006) 15:195–205. doi: 10.1097/01.pdm.0000213464.06387.36
34. Aubry M, de Tayrac M, Etcheverry A, Clavreul A, Saikali S, Menei P, et al. From the core to beyond the margin: a genomic picture of glioblastoma intratumor heterogeneity. Oncotarget. (2015) 6:12094–109. doi: 10.18632/oncotarget.3297
35. Puchalski RB, Shah N, Miller J, Dalley R, Nomura SR, Yoon JG, et al. An anatomic transcriptional atlas of human glioblastoma. Science. (2018) 360:660–63. doi: 10.1126/science.aaf2666
36. Prabhu A, Kesarwani P, Kant S, Graham SF, Chinnaiyan P. Histologically defined intratumoral sequencing uncovers evolutionary cues into conserved molecular events driving gliomagenesis. Neuro Oncol. (2017) 19:1599–606. doi: 10.1093/neuonc/nox100
37. Siska C, Kechris K. Differential correlation for sequencing data. BMC Res Notes. (2017) 10:54. doi: 10.1186/s13104-016-2331-9
38. Donoghue JF, Kerr LT, Alexander NW, Greenall SA, Longano AB, Gottardo NG, et al. Activation of ERBB4 in glioblastoma can contribute to increased tumorigenicity and influence therapeutic response. Cancers. (2018) 10:E243. doi: 10.3390/cancers10080243
39. Nissou MF, El Atifi M, Guttin A, Godfraind C, Salon C, Garcion E, et al. Hypoxia-induced expression of VE-cadherin and filamin B in glioma cell cultures and pseudopalisade structures. J Neurooncol. (2013) 113:239–49. doi: 10.1007/s11060-013-1124-4
40. Zheng Y, McFarland BC, Drygin D, Yu H, Bellis SL, Kim H, et al. Targeting protein kinase CK2 suppresses prosurvival signaling pathways and growth of glioblastoma. Clin Cancer Res. (2013) 19:6484–94. doi: 10.1158/1078-0432.CCR-13-0265
41. Hu G, Wei B, Wang L, Wang L, Kong D, Jin Y, et al. Analysis of gene expression profiles associated with glioma progression. Mol Med Rep. (2015) 12:1884–90. doi: 10.3892/mmr.2015.3583
42. Ahluwalia MS, de Groot J, Liu WM, Gladson CL. Targeting SRC in glioblastoma tumors and brain metastases: rationale and preclinical studies. Cancer Lett. (2010) 298:139–49. doi: 10.1016/j.canlet.2010.08.014
43. Lewis-Tuffin LJ, Feathers R, Hari P, Durand N, Li Z, Rodriguez FJ, et al. Src family kinases differentially influence glioma growth and motility. Mol Oncol. (2015) 9:1783–98. doi: 10.1016/j.molonc.2015.06.001
44. Ru P, Williams TM, Chakravarti A, Guo D. Tumor metabolism of malignant gliomas. Cancers. (2013) 5:1469–84. doi: 10.3390/cancers5041469
45. Guo D, Bell EH, Chakravarti A. Lipid metabolism emerges as a promising target for malignant glioma therapy. CNS Oncol. (2013) 2:289–99. doi: 10.2217/cns.13.20
46. Panosyan EH, Lin HJ, Koster J, Lasky JL. In search of druggable targets for GBM amino acid metabolism. BMC Cancer. (2017) 17:162. doi: 10.1186/s12885-017-3148-1
47. Maugeri R, Schiera G, Di Liegro CM, Fricano A, Iacopino DG, Di Liegro I. Aquaporins and Brain Tumors. Int J Mol Sci. (2016) 17:E1029. doi: 10.3390/ijms17071029
48. Nakada M, Okada Y, Yamashita J. The role of matrix metalloproteinases in glioma invasion. Front Biosci. (2003) 8:e261–9.
49. Hagemann C, Anacker J, Ernestus RI, Vince GH. A complete compilation of matrix metalloproteinase expression in human malignant gliomas. World J Clin Oncol. (2012) 3:67–79. doi: 10.5306/wjco.v3.i5.67
50. Gabelloni P, Da Pozzo E, Bendinelli S, Costa B, Nuti E, Casalini F, et al. Inhibition of metalloproteinases derived from tumours: new insights in the treatment of human glioblastoma. Neuroscience. (2010) 168:514–22. doi: 10.1016/j.neuroscience.2010.03.064
51. Pointer KB, Clark PA, Schroeder AB, Salamat MS, Eliceiri KW, Kuo JS. Association of collagen architecture with glioblastoma patient survival. J Neurosurg. (2017) 126:1812–21. doi: 10.3171/2016.6.JNS152797
52. Liebner S, Fischmann A, Rascher G, Duffner F, Grote EH, Kalbacher H, et al. Claudin-1 and claudin-5 expression and tight junction morphology are altered in blood vessels of human glioblastoma multiforme. Acta Neuropathol. (2000) 100:323–31. doi: 10.1007/s004010000180
53. Salvador E, Burek M, Förster CY. Tight junctions and the tumor microenvironment. Curr Pathobiol Rep. (2016) 4:135–45. doi: 10.1007/s40139-016-0106-6
54. Karnati HK, Panigrahi M, Shaik NA, Greig NH, Bagadi SA, Kamal MA, et al. Down regulated expression of Claudin-1 and Claudin-5 and up regulation of beta-catenin: association with human glioma progression. CNS Neurol Disord Drug Targets. (2014) 13:1413–26.
55. Lathia JD, Li M, Hall PE, Gallagher J, Hale JS, Wu Q, et al. Laminin alpha 2 enables glioblastoma stem cell growth. Ann Neurol. (2012) 72:766–78. doi: 10.1002/ana.23674
56. Kawataki T, Yamane T, Naganuma H, Rousselle P, Andurén I, Tryggvason K, et al. Laminin isoforms and their integrin receptors in glioma cell migration and invasiveness: evidence for a role of alpha5-laminin(s) and alpha3beta1 integrin. Exp Cell Res. (2007) 313:3819–31. doi: 10.1016/j.yexcr.2007.07.038
57. Aaberg-Jessen C, Christensen K, Offenberg H, Bartels A, Dreehsen T, Hansen S, et al. Low expression of tissue inhibitor of metalloproteinases-1 (TIMP-1) in glioblastoma predicts longer patient survival. J Neurooncol. (2009) 95:117–28. doi: 10.1007/s11060-009-9910-8
58. Nakano A, Tani E, Miyazaki K, Yamamoto Y, Furuyama J. Matrix metalloproteinases and tissue inhibitors of metalloproteinases in human gliomas. J Neurosurg. (1995) 83:298–307. doi: 10.3171/jns.1995.83.2.0298
59. Franceschi S, Mazzanti CM, Lessi F, Aretini P, Carbone FG, LA Ferla M, et al. Investigating molecular alterations to profile short- and long-term recurrence-free survival in patients with primary glioblastoma. Oncol Lett. (2015) 10:3599–606. doi: 10.3892/ol.2015.3738
60. Brat DJ, Castellano-Sanchez AA, Hunter SB, Pecot M, Cohen C, Hammond EH, et al. Pseudopalisades in glioblastoma are hypoxic, express extracellular matrix proteases, and are formed by an actively migrating cell population. Cancer Res. (2004) 64:920–7.
61. Sie M, Wagemakers M, Molema G, Mooij JJ, de Bont ES, den Dunnen WF. The angiopoietin 1/angiopoietin 2 balance as a prognostic marker in primary glioblastoma multiforme. J Neurosurg. (2009) 110:147–55. doi: 10.3171/2008.6.17612
62. Gilder AS, Natali L, Van Dyk DM, Zalfa C, Banki MA, Pizzo DP, et al. The urokinase receptor induces a mesenchymal gene expression signature in glioblastoma cells and promotes tumor cell survival in neurospheres. Sci Rep. (2018) 8:2982. doi: 10.1038/s41598-018-21358-1
63. Veeravalli KK, Rao JS.Veeravalli KK, Rao JS. MMP-9 and uPAR regulated glioma cell migration. Cell Adh Migr. (2012) 6:509–12. doi: 10.4161/cam.21673
64. Fan YC, Zhu YS, Mei PJ, Sun SG, Zhang H, Chen HF, et al. Cullin1 regulates proliferation, migration and invasion of glioma cells. Med Oncol. (2014) 31:227. doi: 10.1007/s12032-014-0227-x
65. Codó P, Weller M, Kaulich K, Schraivogel D, Silginer M, Reifenberger G, et al. Control of glioma cell migration and invasiveness by GDF-15. Oncotarget. (2016) 7:7732–46. doi: 10.18632/oncotarget.6816
66. Mertsch S, Schurgers LJ, Weber K, Paulus W, Senner V. Matrix gla protein (MGP): an overexpressed and migration-promoting mesenchymal component in glioblastoma. BMC Cancer. (2009) 9:302. doi: 10.1186/1471-2407-9-302
67. Deng D, Wang L, Chen Y, Li B, Xue L, Shao N, et al. MicroRNA-124-3p regulates cell proliferation, invasion, apoptosis, and bioenergetics by targeting PIM1 in astrocytoma. Cancer Sci. (2016) 107:899–907. doi: 10.1111/cas.12946
68. Eto N, Miyagishi M, Inagi R, Fujita T, Nangaku M. Mitogen-activated protein 3 kinase 6 mediates angiogenic and tumorigenic effects via vascular endothelial growth factor expression. Am J Pathol. (2009) 174:1553–63. doi: 10.2353/ajpath.2009.080190
69. Fallah A, Sadeghinia A, Kahroba H, Samadi A, Heidari HR, Bradaran B, et al. Therapeutic targeting of angiogenesis molecular pathways in angiogenesis-dependent diseases. Biomed Pharmacother. (2019) 110:775–85. doi: 10.1016/j.biopha.2018.12.022
70. Wesseling P, Kros JM, Jeuken JWM. The pathological diagnosis of diffuse gliomas: towards a smart synthesis of microscopic and molecular information in a multidisciplinary context. Diagn Histopathol. (2011) 17:486–94. doi: 10.1016/j.mpdhp.2011.08.005
71. Nakada M, Kita D, Watanabe T, Hayashi Y, Teng L, Pyko IV, et al. Aberrant signaling pathways in glioma. Cancers. (2011) 3:3242–78. doi: 10.3390/cancers3033242
72. Okura H, Golbourn BJ, Shahzad U, Agnihotri S, Sabha N, Krieger JR, et al. A role for activated Cdc42 in glioblastoma multiforme invasion. Oncotarget. (2016) 7:56958–75. doi: 10.18632/oncotarget.10925
73. Rasmussen RD, Gajjar MK, Tuckova L, Jensen KE, Maya-Mendoza A, Holst CB, et al. BRCA1-regulated RRM2 expression protects glioblastoma cells from endogenous replication stress and promotes tumorigenicity. Nat Commun. (2016) 7:13398. doi: 10.1038/ncomms13398
74. Li T, Liu X, Yang A, Fu W, Yin F, Zeng X. Associations of tumor suppressor SPARCL1 with cancer progression and prognosis. Oncol Lett. (2017) 14:2603–10. doi: 10.3892/ol.2017.6546
75. Rodriguez FJ, Orr BA, Ligon KL, Eberhart CG. Neoplastic cells are a rare component in human glioblastoma microvasculature. Oncotarget. (2012) 3:98–106. doi: 10.18632/oncotarget.427
76. Das S, Marsden PA. Angiogenesis in glioblastoma. N Engl J Med. (2013) 369:1561–3. doi: 10.1056/NEJMcibr1309402
77. Liu X, Yu J, Song S, Yue X, Li Q. Protease-activated receptor-1 (PAR-1): a promising molecular target for cancer. Oncotarget. (2017) 8:107334–45. doi: 10.18632/oncotarget.21015
Keywords: glioblastoma, microenvironment, LCM, RNA-seq, tumor heterogeneity
Citation: Civita P, Franceschi S, Aretini P, Ortenzi V, Menicagli M, Lessi F, Pasqualetti F, Naccarato AG and Mazzanti CM (2019) Laser Capture Microdissection and RNA-Seq Analysis: High Sensitivity Approaches to Explain Histopathological Heterogeneity in Human Glioblastoma FFPE Archived Tissues. Front. Oncol. 9:482. doi: 10.3389/fonc.2019.00482
Received: 14 February 2019; Accepted: 21 May 2019;
Published: 07 June 2019.
Edited by:
Gordon Li, Stanford University, United StatesReviewed by:
Kamalakannan Palanichamy, The Ohio State University, United StatesCopyright © 2019 Civita, Franceschi, Aretini, Ortenzi, Menicagli, Lessi, Pasqualetti, Naccarato and Mazzanti. This is an open-access article distributed under the terms of the Creative Commons Attribution License (CC BY). The use, distribution or reproduction in other forums is permitted, provided the original author(s) and the copyright owner(s) are credited and that the original publication in this journal is cited, in accordance with accepted academic practice. No use, distribution or reproduction is permitted which does not comply with these terms.
*Correspondence: Sara Franceschi, cy5mcmFuY2VzY2hpQGZwc2NpZW5jZS5pdA==
†These authors share first authorship
‡These authors share senior authorship
Disclaimer: All claims expressed in this article are solely those of the authors and do not necessarily represent those of their affiliated organizations, or those of the publisher, the editors and the reviewers. Any product that may be evaluated in this article or claim that may be made by its manufacturer is not guaranteed or endorsed by the publisher.
Research integrity at Frontiers
Learn more about the work of our research integrity team to safeguard the quality of each article we publish.