
94% of researchers rate our articles as excellent or good
Learn more about the work of our research integrity team to safeguard the quality of each article we publish.
Find out more
ORIGINAL RESEARCH article
Front. Oncol. , 10 February 2012
Sec. Cancer Genetics
Volume 2 - 2012 | https://doi.org/10.3389/fonc.2012.00012
 Krishna R. Kalari1,2
 David Rossell3
 Brian M. Necela2
 Yan W. Asmann1
 Asha Nair1
 Saurabh Baheti1
 Jennifer M. Kachergus2
 Curtis S. Younkin2
 Tiffany Baker2
 Jennifer M. Carr2
 Xiaojia Tang2
 Michael P. Walsh2
 High-Seng Chai1
 Zhifu Sun1
 Steven N. Hart1
 Alexey A. Leontovich1
 Asif Hossain1
 Jean-Pierre Kocher1
 Edith A. Perez4
 David N. Reisman5
 Alan P. Fields2
 E. Aubrey Thompson2*
KRAS mutations are highly prevalent in non-small cell lung cancer (NSCLC), and tumors harboring these mutations tend to be aggressive and resistant to chemotherapy. We used next-generation sequencing technology to identify pathways that are specifically altered in lung tumors harboring a KRAS mutation. Paired-end RNA-sequencing of 15 primary lung adenocarcinoma tumors (8 harboring mutant KRAS and 7 with wild-type KRAS) were performed. Sequences were mapped to the human genome, and genomic features, including differentially expressed genes, alternate splicing isoforms and single nucleotide variants, were determined for tumors with and without KRAS mutation using a variety of computational methods. Network analysis was carried out on genes showing differential expression (374 genes), alternate splicing (259 genes), and SNV-related changes (65 genes) in NSCLC tumors harboring a KRAS mutation. Genes exhibiting two or more connections from the lung adenocarcinoma network were used to carry out integrated pathway analysis. The most significant signaling pathways identified through this analysis were the NFκB, ERK1/2, and AKT pathways. A 27 gene mutant KRAS-specific sub network was extracted based on gene–gene connections from the integrated network, and interrogated for druggable targets. Our results confirm previous evidence that mutant KRAS tumors exhibit activated NFκB, ERK1/2, and AKT pathways and may be preferentially sensitive to target therapeutics toward these pathways. In addition, our analysis indicates novel, previously unappreciated links between mutant KRAS and the TNFR and PPARγ signaling pathways, suggesting that targeted PPARγ antagonists and TNFR inhibitors may be useful therapeutic strategies for treatment of mutant KRAS lung tumors. Our study is the first to integrate genomic features from RNA-Seq data from NSCLC and to define a first draft genomic landscape model that is unique to tumors with oncogenic KRAS mutations.
The most common form of lung cancer is histologically defined as non-small cell lung cancer (NSCLC). Activating mutations in the KRAS oncogene are often found in NSCLC patients with smoking history (Eberhard et al., 2005; Pao et al., 2005b). The KRAS oncogene harbors activating mutations, especially in codons 12 or 13; and such mutations are prevalent in pancreatic cancer (Almoguera et al., 1988), leukemia, colorectal carcinomas (Andreyev et al., 1997), and about 20–30% of lung adenocarcinomas (Riely et al., 2009). Another prevalent oncogene in NSCLC is the epidermal growth factor receptor (EGFR). EGFR kinase domain mutations have been established as valid predictors of therapeutic response to EGFR-targeted therapeutics such as the small molecule EGFR inhibitors gefitinib, erlotinib, and lapatinib and the EGFR antibody cetuximab. In contrast, the therapeutic significance of KRAS mutations in NSCLC remains unclear and no clinically useful KRAS inhibitors have been developed for management of NSCLC patients (Riely et al., 2009). In NSCLC, activating KRAS mutations are predominant and are mutually exclusive of mutations in EGFR. Studies indicate that lung adenocarcinoma patients with KRAS mutations are associated with resistance to EGFR inhibitors (Eberhard et al., 2005; Pao et al., 2005a; Massarelli et al., 2007). The mechanisms that underlie such resistance are largely unknown, and there is a very pressing need to identify and exploit new molecular targets for management of patients with NSCLC tumors with KRAS mutations. Since oncogenic KRAS has proved to be difficult to target directly (Vojtek and Der, 1998; Shields et al., 2000), an alternative strategy is to identify signaling pathways that are activated downstream of mutant KRAS and to develop key nodal components of these pathways as therapeutic targets using next-generation sequencing technology.
There is very little information on differential gene expression in NSCLC tumors with and without KRAS mutation. Interrogation of oncomine and gene expression omnibus (GEO) databases revealed few studies that have focused specifically on the relationship of KRAS mutation with gene expression in lung adenocarcinomas patients (Beer et al., 2002) or cell lines (Bild et al., 2006; Singh et al., 2009). Furthermore, most of these studies are based on Affymetrix Hu6800 oligonucleotide arrays and analytical technology that is, by modern standards, relatively immature to study gene expression profiles. Thorough analysis of microarrays led us to conclude that there is little reliable data on differential patterns of gene expression in NSCLC tumors with and without KRAS mutations, and virtually no genomic studies of somatic mutations, splice variants, or fusion gene products that are specifically associated with such tumors is available. Deep sequencing of transcriptome (RNA-Seq) provides a powerful tool to interrogate the whole transcriptional landscape. Therefore, we combined RNA-Seq with sophisticated methods and new analytical pipelines developed by our group to analyze RNA-Seq data, to revisit the challenge of identifying genomic features that define differences in the genomic landscape of KRAS-mutated and KRAS-wild-type primary NSCLC tumors.
In the present study, we identified genomic features such as differential gene expression, alternate splice variants, and expressed polymorphisms that are significantly involved in NSCLC tumors harboring KRAS-mutated tumors when compared to KRAS-wild-type tumors (Figure 1). These genomic features were then used to develop a human NSCLC interactome network. Our analysis represents the first reported effort to integrate gene expression, alternatively splicing, and nucleotide sequence variation data into a model that define a genomic landscape unique to NSCLC tumors harboring oncogenic KRAS mutations. Our results, in addition to validating previous studies on the role of RAF, ERK1/2, AKT, and NFκB in mutant KRAS NSCLC, also reveal novel links to other druggable target pathways including TNFR and PPARγ. Our results indicate that this approach will lead to novel insights into the biology of mutant KRAS tumors and identify novel druggable pathways to treat KRAS-mutant tumors.
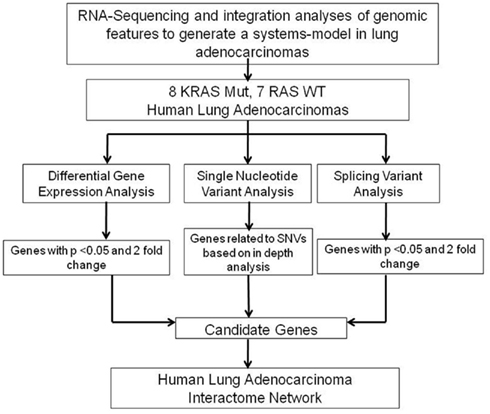
Figure 1. Our data analysis approach. High-level representation of our approach to analyze RNA-Seq data in human lung adenocarcinomas with and without KRAS mutation.
The sequence data used in this manuscript have been deposited in GEO (GSE34914).
We performed RNA-sequencing of 15 lung adenocarcinomas, 8 with KRAS mutation and 7 without KRAS mutation. All tumors were grade I or II and were obtained from surgical resection. Tumors were macrodissected to remove normal tissue prior to freezing, and all samples were histologically evaluated and determined to be >70% tumor tissue. The KRAS mutational status was determined by polymerase chain reaction (PCR) amplification and confirmed by Sanger sequencing of exon 1 of KRAS. These studies were carried out under Mayo Clinic IRB protocol 08-005844.
Total RNA was prepared from 15 fresh frozen lung adenocarcinomas. All RINs were >7.0, as determined using the Agilent Bioanalyzer. The cDNA libraries were prepared from polyA enriched RNA using Illumina protocols. cDNA fragments of 300–400 bp were selected, and non-directional 50 nucleotide paired-end sequencing was performed as described previously (Sun et al., 2011). Sequencing was carried out at Mayo Clinic Advanced Genomic Technology Center at Rochester, MN, USA using the Illumina Genome Analyzer II (GA II). One tumor sample without KRAS mutation was run twice for QC evaluation. The FASTQ read files for the 16 samples were used for further data analysis. Data for gene counts was obtained using our Mayo Clinic pipeline and Burrows–Wheeler Alignment (BWA) alignment. Twenty to fifty-two million tags were obtained from sequencing. The percent of reads mapped for 16 samples varied from 71 to 84.2%. Table 1 consists of details from sample statistics for paired-end runs; the table contains counts combined for each sample from both reads.
Gene expression and alternate splicing data analyses were carried out by downloading database tables from the UCSC table browser in reference to human genome build GRCh37, which corresponds to UCSC hg19 assembly (Fujita et al., 2011). 1000g2010nov data was obtained from the 1000 Genomes Project PHASE, 2010 November release1 and dbSNP version 1322 was used for single nucleotide variation (SNV) analysis. SIFT database provided by http://sift-dna.org/was used to predict whether an SNV coding an amino acid substitution will affect protein function. ANNOVAR was used to functionally annotate genetic variants (Wang et al., 2010). TopHat (Trapnell et al., 2010) and BWA tools (Li and Durbin, 2009) were used to align RNA-Seq reads. Most of the statistical analyses were conducted using R: a language and environment for statistical computing3. Quantification of splicing from paired-end reads was performed using an R package – CASPER to infer gene alternative splicing patterns from paired-end sequencing data (Rossell, 2010). Partek software tools were used for plot generation and data mining purposes. A Microsoft SQL server database was used to store and query data for analysis. A series of computational programs was written using Perl scripting language to access and filter data from the Microsoft SQL database.
The Illumina standard pipeline, GA II was employed for processing of raw images, to make base calls and to generate FASTQ sequence reads from paired-end RNA-sequencing data. The exon–exon boundary database was generated using exon and gene definitions obtained from UCSC refFlat table for hg19 assembly. Uni-directional combinations of exon junction database for the sequencing length (50 bases) were generated using exon boundaries defined by the refFlat file from UCSC Table Browser. FASTQ sequence reads were aligned to the human reference genome (hg19) and to our in-house exon junction database using BWA. BWA is a fast and accurate short read aligner. A maximum of two mismatches were allowed for first 32 bases in each alignment, and reads that had more than two mismatches or were mapped to multiple genomic locations (alignment score less than 3) were discarded. The aligned sequence tags were summarized and annotated using SnowShoes, an in-house RNA-Seq pipeline (manuscript in preparation). The read counts for genes are generated for further downstream analyses. A non-mutant KRAS sample that was run twice had high correlation; hence we took the average read count for each gene for that sample. Raw read counts for a total of 22,316 genes were obtained for gene expression analysis. Genes (15,092) that had a median read count >24 (16 reads) in at least one of the KRAS groups were used for further analysis. Individual read count data were normalized using mode, as follows: read count/sample read count mode *sm, where sm is the smallest mode across all the samples. Since the length of the transcript is assumed to be constant when comparing two sample cohorts, no normalization for the length of genes was performed for differential expression analysis. ANOVA implementation of Partek Genomics Software was used for differential gene expression analysis after normalizing RNA-Seq gene count data. Microarray data used in this study were normalized with gc-robust multi-array average (gcRMA) algorithm, using Partek Genomics (Partek Inc., St Louis, MO, USA). Normalized microarray data were analyzed using ANOVA implementation of Partek Genomic Software for differential gene expression analysis.
TopHat is a fast splice junction mapping software that uses short read aligner – Bowtie to align RNA-Seq reads (Langmead et al., 2009; Trapnell et al., 2010). TopHat outputs alignments in sequence alignment/map (SAM) format. Samtools (Li et al., 2009) were used to convert files to binary alignment/map (BAM) format. BAM files were loaded into Bioconductor, and the CASPER package4 was used to quantify known splicing variants. Briefly, CASPER obtains the list of known splicing variants for each gene from UCSC, and estimates their relative abundances by modeling the reads as a mixture of multinomial distributions (Figure 2). Maximum likelihood estimates of the relative abundances were obtained via the EM algorithm (Dempster et al., 1977). Transcript expression data was obtained for each sample from CASPER analysis. Transcripts with no mapped reads were imputed with a zero and all samples with transcript data were merged for splicing analysis. Mann–Whitney–Wilcoxin test that does not assume normality was performed to identify differential alternative splice forms between the KRAS-mutant and KRAS-wild-type samples.
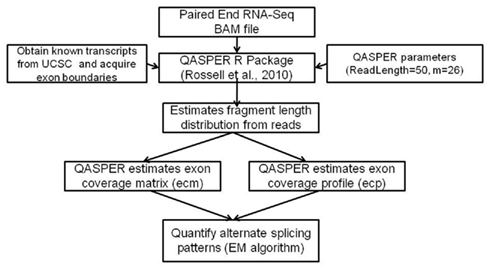
Figure 2. High-level approach of CASPER – a splicing analysis R package. Flowchart of methods to quantify alternate splice forms from RNA-Seq data.
Novel SNVs and SNVs with different allelic frequencies in samples with and without KRAS mutations were also discovered using transcriptome sequencing data. Analysis of SNVs from lung adenocarcinomas has been performed using a variety of computational methods. Single reads from paired-end data for a sample were aligned to exon–exon junction database and genome independently with BWA default parameters (Figure 3). When a read maps to junction and genome, the read that map to the junction gets priority and the read from genome mapping will be filtered. In addition to duplicate mapping reads, reads of low quality (mapQ < 20) were also filtered. From a paired-end RNA-Seq, four files were obtained from junction and genomic BWA alignments. As shown in Figure 3, a total of four BAM alignment files for each sample were used to create a pileup file. The pile up file generated for each sample was used to predict single nucleotide variants using SNVMix – a novel binomial mixture model (Goya et al., 2010). The number of reference and alternate base reads were obtained for every transcribed position in the genome. SNVMix uses a probabilistic method based on a binomial mixture model to infer genotypes. At each nucleotide position in the data, there is one of three genotype states (Goya et al., 2010) generated from sequence data: aa (homozygous for the reference base), ab (heterozygous), and bb (homozygous for the non-reference base). In order to minimize errors, only bases with >Q20 base quality were considered in determining counts. We also filtered our SNV data against dbSNP version 132, the 1000 genomes project (see text footnote 1), the Illumina Body Map 2.0 data from 16 normal tissues (data downloaded from www.broadinstitute.org/igvdata/BodyMap/hg19/IlluminaHiSeq2000_BodySites), and four normal lung epithelial cell samples (Beane et al., 2011). Illumina body map data and normal lung epithelial RNA-Seq was obtained in order to eliminate any previously described germ line variants. Illumina body map samples and lung epithelial cell lines were processed for SNVs in the same manner as our 16 lung adenocarcinoma samples. SNV data from all samples were stored in a Microsoft SQL server 2005 database. In-house programs were developed to filter and query data from the database. ANNOVAR software was used to functionally annotate and filter genetic variants. Frequency comparisons of the SNVs were performed using the Fishers exact test from Plink software5. Additional filtering of SNVs was performed using SNV data generated from TopHat alignment in order to remove any false positive SNVs arising due to alignment issues. A variety of filters were built on forward and reverse directionality reads for SNVs, as described in the text.
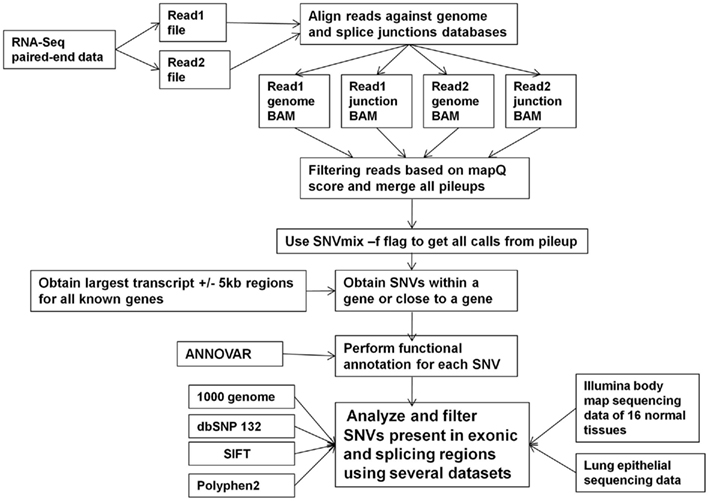
Figure 3. High-level approach to identify SNVs. Flowchart of methods to process RNA-Seq data to obtain SNVs using a variety of tools, databases, and next-generation sequencing normal sample datasets.
Ingenuity Pathway Analysis (IPA) software (Ingenuity® Systems6) was used for pathway analysis. IPA constructs protein interactions based on a regularly updated “Ingenuity Pathways Knowledge Database.” The IPA knowledge database consists of millions of relationships between proteins extracted from the biological literature. Each relationship between molecules is created using the IPA knowledge database. IPA was used to identify pathways based on differential gene expression, alternate splicing and SNV gene sets. Significant pathways in IPA were identified using Fisher’s exact test. The p-value indicates the likelihood of the input gene list or proteins in a given pathway or network being found together due to random chance. Cytoscape, a popular open source bioinformatics package, was used for complex network analysis and visualization (Smoot et al., 2011). Integration of the genomic features (differential expression, alternative splice variants, and SNVs) was performed using Cytoscape. Network analyzer, a Cytoscape plug-in, was used to compute a comprehensive set of topological parameters for directed networks (Assenov et al., 2008). Number of edges, distribution of degree counts, and neighborhood connectivity scores were obtained for the integrated network using network analyzer. Reactome was also used for network analysis. Reactome consists of expert curated and peer-reviewed high quality data to infer human functional interactions among genes7. Reactome and human interactome8 databases were also used along with Cytoscape to build networks. Only the genes that were expressed in RNA-Seq data (median read count >16 in at least one of the KRAS groups) were used as reference gene set during network analysis.
Genomic DNA was extracted from NSCLC tumors using standard protocols. The seven SNVs corresponding to genes (KRAS, GSTZ1, ECT2, GLS, WDTC1, SRSF3, and RBM23) were evaluated using Sanger sequencing. Primer pairs for these SNVs were designed with Primer3 version 4.0 software, and were used to amplify all variants by PCR. PCR products were purified from unincorporated nucleotides using a Millipore PCR purification plate. A total volume of 10 μl, containing 80 ng of the clean product and 1.6 pM of one of the primers (forward or reverse), was used for sequencing. Electropherograms were analyzed with SeqScape v2.5 (ABI, Applied Biosystems, Foster City, CA, USA).
Quantitative real time PCR (qPCR) was used to verify alternative splicing of selected candidate transcripts. Total 1 μg of RNA was isolated and converted to cDNA using Applied Biosystem’s High Capacity cDNA RT kit (Part # 4368813). Note that the protocol for cDNA library construction for qPCR was different from that used for RNA-Seq analysis, so as to minimize potential artifacts that might arise during cDNA conversion. Probes and primers corresponding to known exon/exon junctions were purchased from Life Tech (Applied Biosystems) and qPCR was carried out using an AB 7900HT analyzer.
Read counts were obtained for 22,316 genes from 15 lung adenocarcinoma samples with and without KRAS mutation. The read count data were normalized using mode normalization and log2 transformation as described in the Section “Materials and Methods.” Genes with a median read count <16 in lung adeoncarcinoma samples with and without KRAS mutation were eliminated from further analysis. The remaining 15,092 transcripts were analyzed using ANOVA to identify 374 transcripts that were differentially expressed genes in KRAS mutation samples versus KRAS-wild-type samples with p-value <0.05 and twofold-changes in gene counts. The association between the KRAS genotype and the top six differentially expressed genes is shown in Figure 4A. Hierarchical clustering of the 374 differentially expressed genes is shown in Figure 4B, in which total gene counts were standardized by the mean value among the samples.
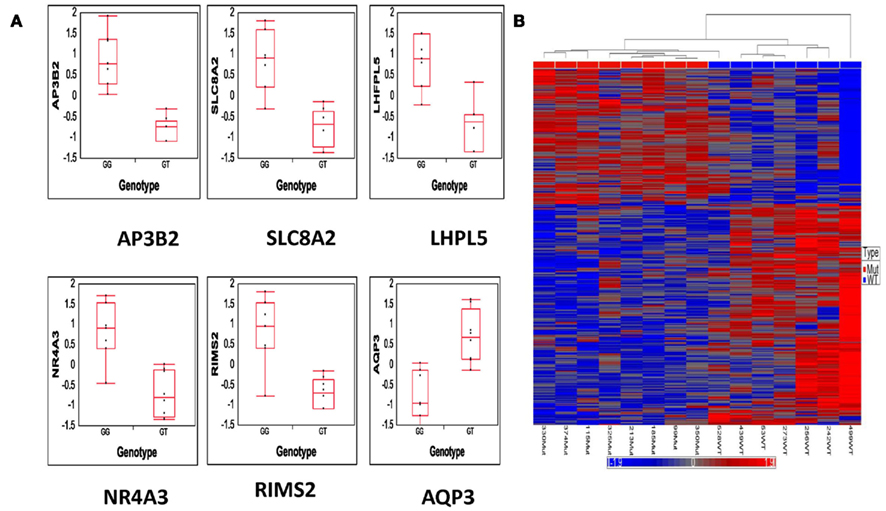
Figure 4. Results from differential gene expression analysis. (A) Top six significantly differentially expressed genes between KRAS-mutant genotype (GT) and KRAS-wild-type genotype (GG). (B) Hierarchical clustering of 374 genes that are differentially expressed with at least twofold-change and p-value <0.05.
Ingenuity pathway analysis was used to determine biological relationships among the 374 differentially expressed genes. The top five networks, based on Fisher’s exact test, were associated with immunological disease, cell signaling, cell death, nervous system development, and function and cellular development pathways. The key nodes of the five networks are NFκB, ERK1/2, AKT, MAPK, PI3K complex, IL12, and JNK. The top four networks (gene–gene relationships) from IPA analysis are shown in Figures 5A–D. IPA also determines the number of subgroups of genes that are associated with a known or canonical pathway. The top 3 canonical pathways from the 374 gene list are cell cycle regulation by B-cell translocation gene (BTG) family proteins, glioblastoma multiforme signaling, and Wnt/β-catenin signaling.
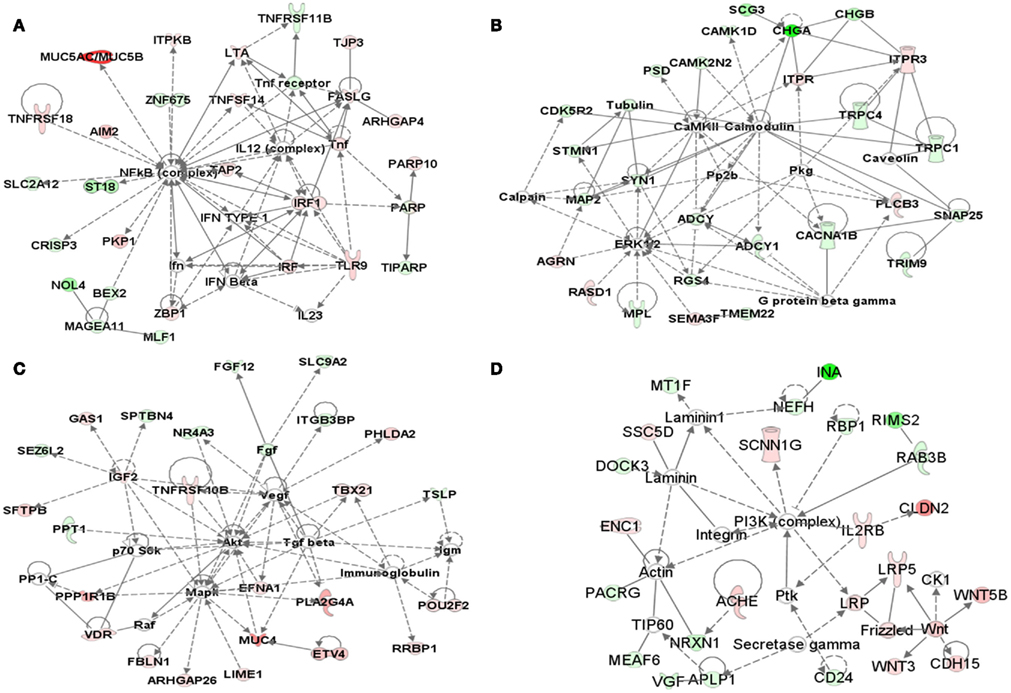
Figure 5. Network analysis. (A–D) Top networks identified with IPA software for the 374 genes that are differentially expressed between KRAS-mutant and wild-type lung adenocarcinoma samples. The pink or red color nodes in networks indicate a gene that is up regulated in KRAS-mutant compared to the KRAS-wild-type, green color indicates the genes that are down regulated in KRAS-mutant samples compared to the KRAS-wild-type samples.
We used CASPER, an R package, to obtain the expression of isoforms for all the refseq genes or transcripts. The UCSC hg19 assembly consists of 31,599 known transcripts. Genes with only one known isoform were removed from the analysis (13,633 transcripts). CASPER estimates relative expression levels, i.e., proportion of transcripts for a given gene originating from each variant. Transcript expression values from individual samples were organized into a single file and transcripts with no reads were set to zero. Data from CASPER files contained 17,966 transcripts for further analysis. There were 314 transcripts corresponding to 259 genes with a p-value <0.05 and minimum twofold-change in median of multiple ratios between KRAS-mutant and wild-type samples. An example of output from CASPER package is shown in Figure 6. The estimated abundance of alternatively spliced NM_00268 and NM_053024 transcripts is 66.79 and 33.21 for the profiling two gene PFN2 in KRAS mutated samples (Figure 6A), whereas the abundance ratios for NM_00268 and NM_053024 transcripts are estimated as 82.28 and 17.72% respectively for KRAS-wild-type samples (Figure 6C). Figures 6B,D show the reads for PFN2 transcripts for the same KRAS mutated and wild-type lung adenocarcinoma samples. We also analyzed data using junction data obtained from TopHat to identify isoforms. Our in silico analysis of junction data for PFN2 gene from TopHat is similar to CASPER data and indicates that the short isoform (NM_002628) is abundantly expressed in KRAS-mutant samples compared to KRAS WT group.
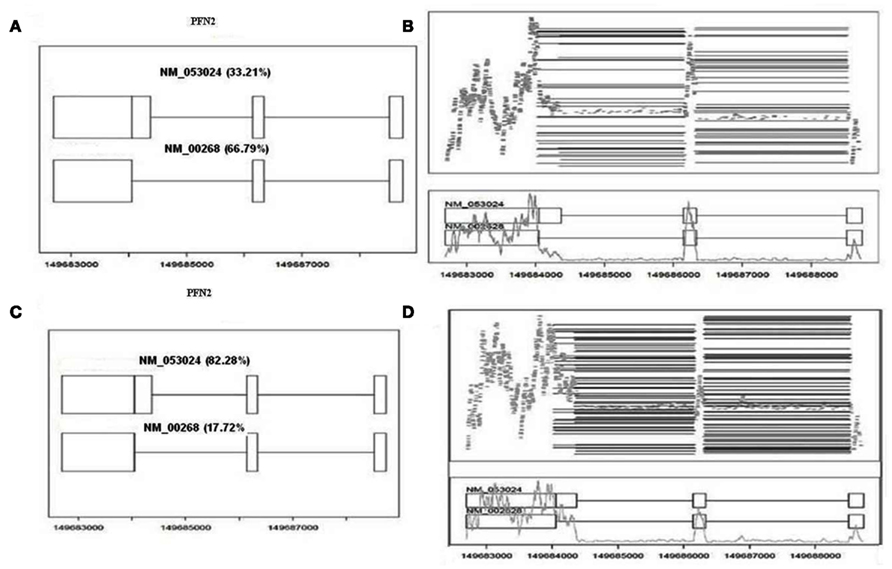
Figure 6. Output of CASPER from splicing analysis. (A) CASPER output for alternate splice forms in KRAS-mutant sample. The data indicates that NM_002628 transcript is highly abundant compared to NM_053024 transcript of PFN2 gene. (B) Observed reads for PFN2 gene. Black lines in upper section of the plot indicates long reads and gray lines indicate short reads typically spanning a single exon. The gray line on bottom half of plot indicates coverage at each position. (C) CASPER output for KRAS WT sample. NM_053024 transcript is predominantly expressed compared to other transcript. (D) Is similar to (B) but it corresponds to KRAS WT sample in (C).
For pathway analysis using IPA, we have used the 259 genes corresponding to 314 transcripts. The top five networks from IPA analysis were associated with cellular growth and proliferation, cell-to-cell signaling and interaction, nervous system development and function, molecular transport, and infection mechanisms. Similar to the pathway analysis of differentially expressed genes, the key nodes in the top five networks were NFκB, ERK1/2, SNCA, AKT, PKC, MAPK, and Insulin.
The SNVs that are ±5 kb from a refseq gene were obtained and filtered based on several criteria as described in Section “Materials and Methods.” From the SNVMix output, genotypes ranging from 60 to 120 million per sample were investigated to call an SNV.
Nucleotide sequence at every genomic coordinate was evaluated when we had sufficient depth of sequence. We evaluated each nucleotide position for read depth, and for reads supporting the reference and alternate alleles for an SNV. An SNV was called when the genotype of one or more samples deviated from the reference genome genotype. In the current analysis, a SNV was not investigated if the genotype consists of multiple alleles, if there was no variation in genotype, or if the variation is present in less than two samples. We also eliminated SNVs from further analysis if the read depth was <3. After the application of the filters described above, a final set of 73,717 unique single nucleotide variants remained for further investigation. Since we have considered the regions that are close to a gene for SNV investigation, the majority of the SNVs are present in exonic (34,411) and 3′ UTR (25,736) regions. Of the 34,411 exonic SNVs, there are 11,949 synonymous SNVs that do not change an amino acid. Hence, we ignored these SNVs and estimated alternate allele frequencies from genotype data obtained from SNVMix software between the lung adenocarcinomas groups in 23,987 non-synonymous, exonic SNVs. For additional investigation of SNVs, we also obtained the 1000 genome and dbSNP132 data for all the 23,987 SNVs which include non-synonymous, stop gain, and stop loss mutations.
Fisher’s exact test, called from PLINK software, was used to calculate differences in alternate allele frequencies. Eighty-four SNVs corresponding to 74 genes had a p-value <0.05 between tumor samples with and without KRAS mutation. Table 2 shows details of 13 SNVs with a p-value <0.01. Table 2 consists of 18 columns with a variety of information for 13 SNVs.

Table 2. Top 13 SNVs that have different allelic frequencies in KRAS mutation group compared to the KRAS-wild-type samples.
Table 2 consists of details of SNV (chr, chromosome; Position, chromosome location; Gene, gene corresponding to SNV; Ref, reference allele; Alt, alternate allele; KRAS Mut, frequency of alternate allele observed in KRAS mutation group; KRAS WT, frequency of alternate allele observed in group without KRAS mutation; MAF, minor allele frequency; P, Fishers exact p-value; 1KGenome, frequency of alternate allele observed in 1000 genome samples; dbSNP132, dbSNP ID based on chromosome location if it exists; SIFT, SIFT score that predicts amino acid changes that may be affected by protein function; MAF Body Map, frequency of alternate allele in Illumina body map 16 tissues that are sequenced and analyzed similarly for SNVs; Illumina Lung, genotype of Illumina lung sample from body map data and lung epithelial genotypes for NormNonSmoker – normal non-smoker; NormSmoker, normal smoker; SmokerNon-Cancer, smoker non-cancer; and SmokerLungCancer, smoker lung cancer samples respectively). “?” represents data not available in Table 2.
As shown in Table 2, the top significant SNV located on chromosome 12 corresponded to the KRAS gene. Thus, our SNV analysis confirms our in silico validation of sample classification based on KRAS mutational status. In addition to KRAS mutation there are an additional 79 SNVs that are present in the 1000 genome dataset with a minor allele frequency (maf) ranging from 0.95 to 0.02 (median maf = 0.35) and four more SNVs that are not present in the 1000 genome or dbSNP132 datasets, but which are differentially observed in the KRAS-mutant and wild-type samples with Fisher’s exact p-value <0.05.
To test if any of the four SNVs, corresponding to WDTC1 (chr1:27630115), GLS (chr2:191819311), SRSF3 (chr6:36564670), and RBM23 (chr14:23370943) are novel, we performed TopHat alignment and individually examined the data in nucleotide sequence pileup files created from TopHat bam files. SNVs corresponding to RBM23 and GLS are located at exonic splicing junction. Hence the alignments for these two variants were also examined carefully in integrative genomic browser (IGV). We found that the reads supporting the alternate allele for these two variants were present at the 5′ ends of the sequence reads, and therefore likely to represent sequence and/or alignment errors. Hence we dropped these two SNVs from our analysis. The SNV corresponding to WDTC1 was not called as a variant during TopHat alignment. There were no reads supporting the alternate allele, hence we discarded that as a novel variant. Finally, we investigated the variant corresponding to SRSF3 from TopHat alignment and pileup data. This variant had an average read depth of 184; however, we found there is a strand bias of reads for the alternate allele. Thus, reads supporting the alternate allele C in the forward strand were 21, compared to 565 reads from the negative strand, such that this SNV was also eliminated on this basis.
We then filtered the remaining differentially detected SNVs to eliminate those that are at a splice junction, have alternate alleles that are exclusively found at the 5′ end of the reads, or have strand bias for alternate reads. These rules plus a limit for maximum read depth to call an SNV and genotype confidently using SNVMix were applied to remove false positives. This led us to 72 SNVs corresponding to 65 genes that have different allelic frequencies between the tumors with and without KRAS mutation.
An IPA analysis was carried out on the 65 genes corresponding to SNVs that have a preferential alternate allele present in samples with or without KRAS mutation. The top five networks were associated with tumor morphology, cellular growth and proliferation, cell death, cellular function and maintenance of cancer, neurological disease, cellular development, cell cycle, and cell morphology. The most significant disease associated with these SNVs was cancer and the key nodes in the top five networks were NFκB, ERK1/2, AKT, TNF, PI3K, ESR1, beta estradiol, and TGFB1.
Genes from differential expression (374 genes), alternate splicing (259 genes), and SNV (65 genes) analyses were used for integration analyses. Genes existing in multiple features were removed such that the final gene set for integration analysis consisted of 659 unique genes. Chromosomal mapping of these 659 genes identified several lung adenocarcinoma-specific clusters (Figure 7). Individual evaluation of chromosomes suggest that there may be clusters of genes on chromosomes 1, 3, 6, and 11 that are associated with KRAS lung adenocarcinomas (Figure 7).
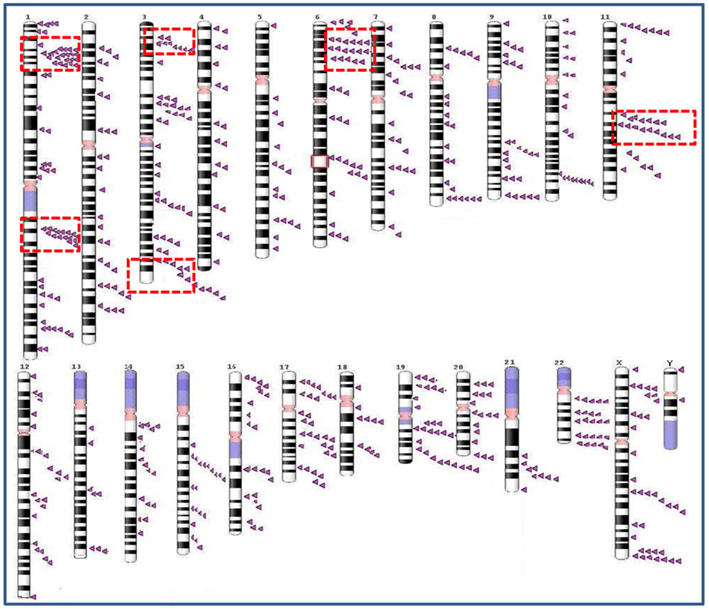
Figure 7. Genomic view diagram. Chromosomal view of all the genes obtained from multi-feature analysis of lung adenocarcinomas with and without KRAS mutation. Chromosomes 1, 3, 6, and 11 consists of abundant gene clusters associated with KRAS mutation. Arrow in the diagram represents a gene obtained from genomic feature analysis. Arrows identify the loci of genes obtained from genomic feature analysis. Larger arrows are shown when the genes are far apart, but when the gene locations are adjacent they are represented as smaller arrows.
NFκB, ERK1/2, and AKT canonical pathways were observed in all three independent feature analyses and also in the integrated analysis of 659 genes. The NFκB pathway has previously been shown to be essential for the development of tumors with KRAS mutation in a mouse model of lung adenocarcinoma (Meylan et al., 2009). Previous studies have also shown the involvement of AKT (Okudela et al., 2004) and ERK1/2 canonical pathways (Blasco et al., 2011) in mutant KRAS lung adenocarcinomas. In independent feature analyses, the MAPK pathway is targeted by both differential gene expression and alternate splicing but not with SNVs. Similarly, PI3K has been shown to target through differential gene expression and SNV features but not by alternative splicing. These data indicate pathways involved in mutant KRAS tumors are targeted by multiple genetic mechanisms in these tumors.
We randomly selected 6/15 samples for qPCR validation of four differentially expressed genes identified in our RNA-Seq analysis. Significant correlations were observed ranging from 0.69 to 0.84, when qRT-PCR results were compared with RNA-seq expression data (data not shown). We also randomly selected two small genes with multiple splice variants for functional validation.
Two genes, one with two splice variants and another with more than two splice variants were used for functional validation of our splicing analysis. As shown in Figure 8, qPCR data of samples agree with CASPER analysis for PFN2. KRAS-mutant samples preferentially express the NM_002628 variant of PFN2 when compared to the NM_053024 variants (Figure 8). The two most significant SNVs (KRAS and GSTZ1) showing differences in frequency in KRAS-mutant versus wild-type tumors were validated using Sanger sequencing of genomic DNA. The presence of the reference and alternate allele (A) is shown in IGV Browser (Figure 8B). Sanger sequencing validation of the SNV is also shown in Figure 8C.
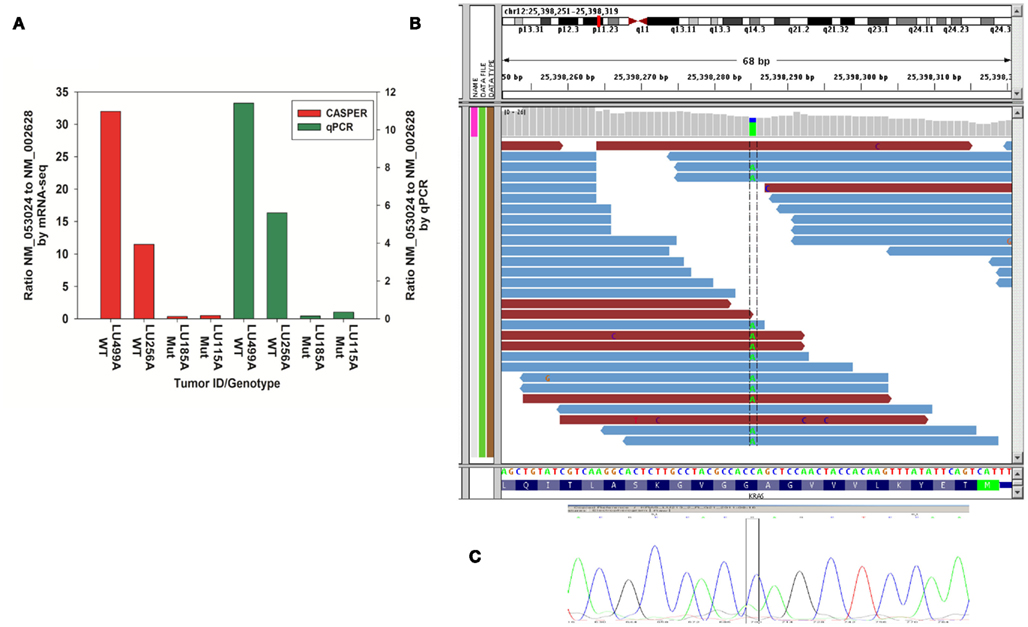
Figure 8. The qPCR validation and SNV validation results. (A) Validation of CASPER estimations of relative abundances for PFN2 gene in two mutant and wild-type samples using qPCR (B) Visualization of KRAS-mutant SNV using IGV Browser. Coverage file and bam files are shown in the top part of the IGV Browser output. The bottom part of the picture consists of Refseq gene with nucleotides. Nucleotide position of chr12: 133384864 is displayed in dotted columns of the figure, it shows that the reference allele at that particular position is (C) and alternate allele present at that position is (A), so the SNV at that position is (C/A) change. (C) Sanger sequencing data confirming the variation.
A 659 gene set obtained from our integration analysis was used to build lung adenocarcinoma networks. Reactome and protein–protein interactome databases were used to build networks using Cytoscape. Linker genes (genes not present in our list but known to interact with genes in our list based on the published literature or protein-protein interaction databases) were also included to construct networks using Cytoscape. Thus, our lung adenocarcinoma network consists of linker genes and the set of genes obtained from different genomic features of RNA sequencing analyses. The functionality and directionality of connections between the nodes are also indicated in Figure 9. Topological parameters of the directed network were obtained using network analyzer. Table 3 consists of the top 50 genes from this analysis along with edge count, degree, and neighborhood connectivity parameters. As shown in the Table 3, MAPK14 is a linker gene consisting of 63 edge counts, 12 outgoing edges, and 51 in degree edges, with a high neighborhood connectivity score of 23.71. Most of top genes from network analysis are linker genes, due to the fact that most of these genes are well established regulators of our candidate genes derived from different features of tumors. In summary, the most significant connected genes (hubs) from our analyses are MAPK14 (linker gene), and CCND1 from differential gene expression, LAMA4 from SNV, and RPS27A from alternate splicing analysis.
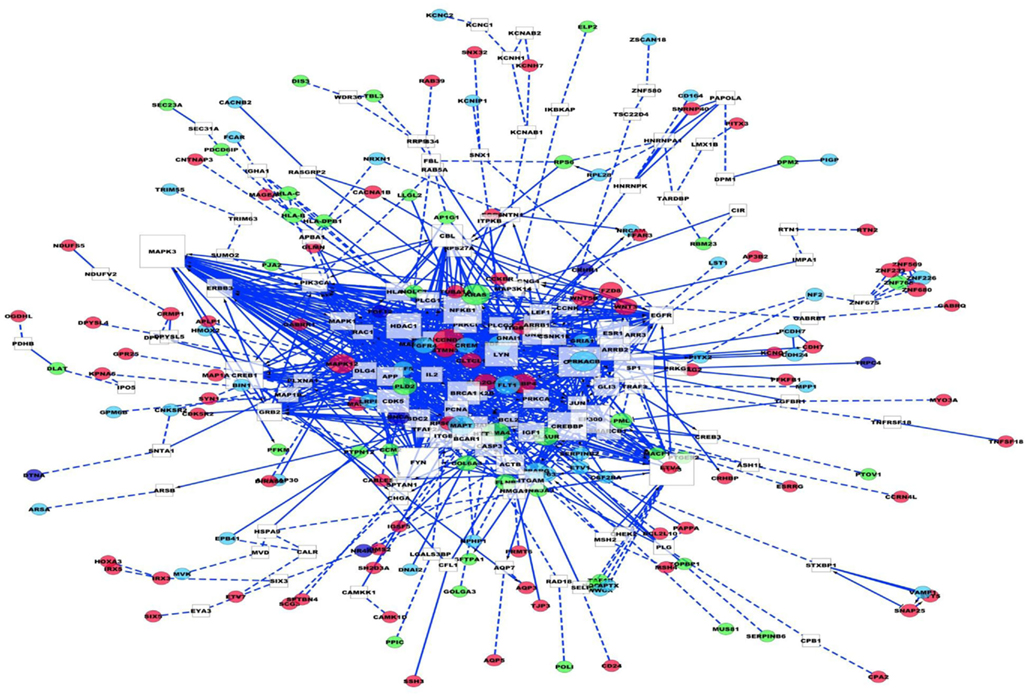
Figure 9. Lung adenocarcinoma interaction network. In the diagram white squares are linker genes. Dark pink are differentially expressed genes, light blue are splicing variants, purple are genes that are differentially expressed and alternately spliced. Green are genes corresponding to SNVs. Blue dotted lines means indirect connections, blue solid lines indicate direct evidence of connection between the genes.
To understand the connections between these genes in terms of known druggable targets and pathways we used IPA software. We obtained 387 genes that had at least two or more edges from the lung adenocarcinoma network developed previously (Figure 9) and submitted these data to IPA analysis. The 387 gene set consisted of 171 linker genes and 216 genes that were obtained from the multi-feature analysis of lung adenocarcinomas with and without KRAS mutation. In this way, we identified canonical pathways that are prevalent in the 387 dataset. Figure 10 represents the top canonical pathways identified in our IPA analysis. The most significant canonical pathway consisted of 52/377 genes associated with molecular mechanisms of cancer (Figure 10).
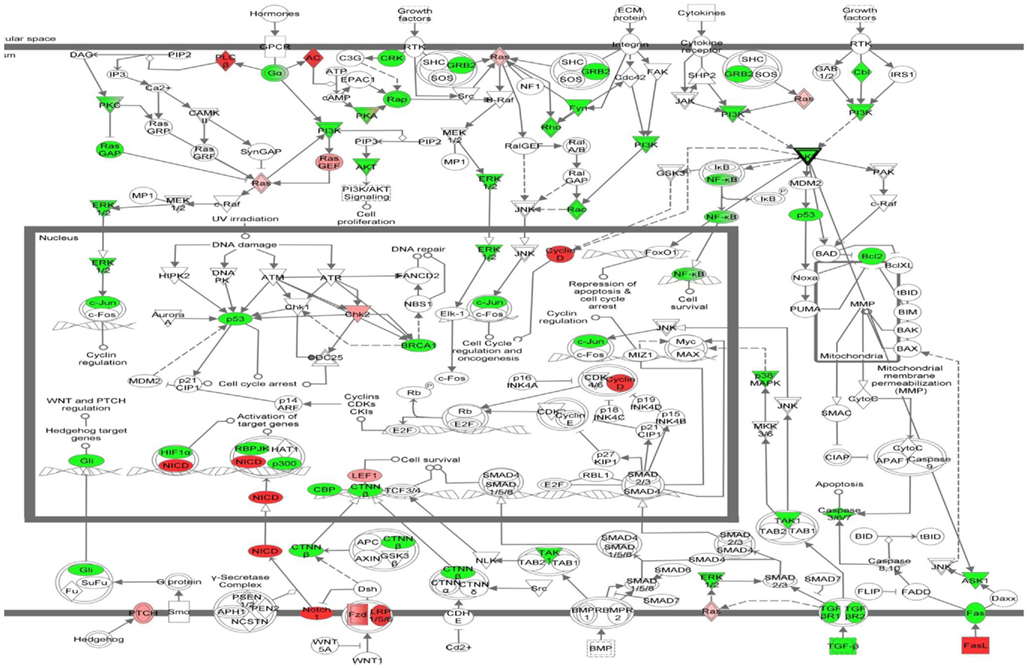
Figure 10. Most significant canonical pathway from this study. Molecular mechanisms of cancer is the most significant known pathway obtained from multi-feature analysis of lung adenocarcinoma network. In the diagram green symbols represent linker genes and red or pink colors represent list of genes from lung adenocarcinoma network.
To specifically explore the connections of the lung adenocarcinoma network with the KRAS gene, we obtained the upstream and downstream connections that are specific to KRAS gene from our 659 integrated multi-featured gene list. Figure 11 shows the direct and indirect connections to KRAS. As shown in Figure 11, there are 14 genes (LOC100506736, FBLN2, CCND1, AGRN, FBN1, MYCN, NQO1, SCNN1, ST5, TNFRSF10B, PPARG, GAS1, PLCB3, and IGF1) that are indirectly connected with KRAS from our 659 unique gene list obtained from three different genomic features. To build and expand the KRAS sub-specific network, we also used the grow feature in IPA to obtain direct gene-gene interactions from the Ingenuity Knowledge Base. This analysis gave us an additional 12 genes (RAF1, RALGDS, RASSF1, ICMT, PTBP1, ELAVL1, WT1, ESX1, Ras, FEZF, RASGRF2, and IGF2BP1) with direct connections to KRAS. The IPA overlay feature for known drugs was also used to determine if there are known FDA-approved drugs or clinical drug candidates within the 27 gene KRAS sub network. Three of the 27 genes are the target of known FDA-approved drugs (RAF1, PPARG, and TNFRSF10B).
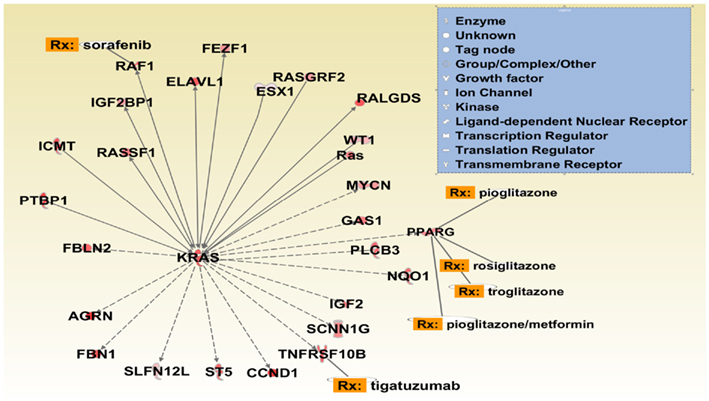
Figure 11. KRAS sub network. The network connections are obtained from our multi-feature gene list and Ingenuity knowledge base (IKB). Direct and indirect connections to KRAS gene are obtained from multi-feature list and only direct connections are obtained from IKB. The bar chart close to the gene indicates the log2 expression of the gene for each sample from RNA-sequencing data. Rx connection to a gene indicates FDA approved or clinical trial drugs.
In the 27 gene KRAS sub network we identified four known biomarkers for NSCLC (CCND1, KRAS, PPARG, and Ras). From the Ingenuity knowledge base, it is known that human CCND1 protein and PPARG are useful biomarkers for measuring the efficacy of the PPARγ agonist pioglitazone hydrochloride in the treatment of NSCLC. Similarly KRAS has been used as a biomarker for cetuximab, pazopanib, carboplatin, and erlotinib treatment of NSCLC. Interestingly, three therapeutic trials using PPARG agonists in NSCLC are currently being conducted9. Given our current analysis, it will be of interest to determine whether a correlation between clinical benefit and KRAS mutational status emerges from these trials.
We have conducted an integration analysis of multiple genomic features obtained from deep sequencing of NSCLC tumors with and without KRAS mutation. To our knowledge, this report represents the first attempt to leverage RNA-Seq data and a variety of computational methods to obtain an integrated genomic landscape map that incorporates differential gene expression, alternate splicing, and SNV data. This approach allowed us to comprehensively mine lung cancer data to produce a genomic landscape of NSCLC tumors. In our study, we took advantage of the genomic features obtained from our NSCLC samples along with the 1000 Genome data (normal samples), dbSNP data, and the Illumina body map data obtained from 16 normal tissues and the normal lung cell line data (Beane et al., 2011). Thus far there is only one paper that published lung cancer data using RNA-Seq; in that study, Beane and coauthors studied gene expression differences determined by RNA-Seq to understand the impact of tobacco smoke exposure in pooled samples from non-transformed bronchial epithelial cells from smokers and non-smokers with and without lung cancer. We used these data as “normal” controls for our analyses. To date; there is very little genomic information on differential gene expression, alternate splicing, and single nucleotide polymorphisms in NSCLC tumors with and without KRAS mutation. We searched oncomine, GEO databases for gene expression studies and identified only two studies for which KRAS status of the tumors was known. One study was published in 2002 and used Affymetrix Hu6800 gene expression chips for 96 lung adenocarcinoma samples whose clinical parameters are known (Beer et al., 2002). Collected prior to 2001, the Beer et al. cohort contained 40 KRAS-mutants and 45 KRAS-wild-type samples, the remainder being of unknown KRAS status. Microarray data were reanalyzed to identify differentially expressed genes using the approach described in Section “Materials and Methods.” Only 19 genes were differentially expressed at p-value <0.05 and fold change > ±2. More than likely these results reflect analytical deficiencies related to the state of the art in microarray development that prevailed when these samples were analyzed. Another study determined KRAS status in 38 samples for human mammary epithelial cells and generated Affymetrix Human Genome U133 Plus2.0 (GSE3141) data (Bild et al., 2006). We reanalyzed GSE3141 data for which KRAS status was accurately published to identify differentially expressed genes using the approach described previously. Thirty-eight samples (11 samples with KRAS mutation and 27 samples without KRAS mutation) were used for analysis. Four hundred thirty-five probe sets corresponding to 311 genes were differentially expressed with a p-value <0.05 and with a fold change > ±2. Only nine genes overlapped with our 345 differentially expressed genes. This could be due to differences in the gene expression patterns induced by oncogenic KRAS in breast versus lung tissue.
Deep sequence analysis of total mRNA makes it possible to analyze tumor samples and to quantify differential gene expression, alternative splicing, and SNV. There is always a concern that differences in cellularity may affect the outcome of genomic analyses of tumor tissue. We have attempted to minimize this potential problem by selecting only tumor samples that were histologically evaluated as >70% tumor tissue. In addition, there are several bioinformatics challenges such as base calling, assembly, alignment, and after-alignment handling of huge amounts of data from an RNA-Seq experiment. There are more than 300 software tools for next-generation sequence alignment, assembly, base calling, and post-alignment analysis10. We have used a combination of software tools for various analytical purposes. For each genetic feature obtained in this study, we computationally validated our analysis using at least two or more combinations of approaches. We have discussed our approach for each genetic feature in detail in Section “Materials and Methods.” Our results demonstrate that transcriptome sequencing has the potential to provide new insights in our understanding of the genomic consequences of KRAS mutation in NSCLC patients by integrating different genomic features.
Even though KRAS mutations are highly prevalent in cancers, it has proven to be quite difficult to exploit mutated KRAS as a therapeutic target. Thus, a goal of our analysis was to identify druggable targets that are genomic associated with the mutant KRAS phenotype. Our analysis identified the RAF, ERK1/2, and NFκB pathways as specifically associated with mutant KRAS. Each of these pathways have previously been shown to be functionally linked to mutant KRAS tumorigenesis and represent bonafide drug targets for clinical treatment of KRAS tumors. Sorafenib inhibits RAF1 and is currently being tested in NSCLC patients in phase II trial11 (Blumenschein et al., 2009). In addition to these previously known KRAS related drug targets, our analysis revealed underappreciated links of mutant KRAS with the TNFR (Drosopoulos et al., 2005; Ji et al., 2006) and PPARγ (Ignatenko et al., 2004) signaling pathways. Although our analysis is the first comprehensive transcriptome sequencing analysis concerned with the mutant KRAS phenotype, it does not have sufficient power to detect all genes associated to NSCLC tumors and KRAS. Thus, larger sample sizes will be desirable; and such analyses are ongoing at this time. However, we submit that the power of future studies is likely to be inherent in an integrated analysis, of the sort that we have defined here, which takes advantage of all of the genomic features that can be identified using RNA-Seq technology and leverages these technologies with new analytical tools. The tools that are available to quantify and integrate such features are currently in a state of rapid evolution as many investigators struggle with the complex issues related to building integrated systems models. The present model represents a first draft, rather than a rigorously defined genomic landscape model; and we anticipate that ongoing work in our laboratory and others will shortly lead to a better definition of the salient genomic features that distinguish KRAS mutational signaling events. However, our data demonstrate the utility of these approaches to identify critical druggable targets that can be exploited to manage the very significant subset of NSCLC tumors with KRAS mutations.
The authors declare that the research was conducted in the absence of any commercial or financial relationships that could be construed as a potential conflict of interest.
This work was supported in part by grants from the Florida Department of Health James and Esther King program (1KG05 to Alan P. Fields and E. Aubrey Thompson) and the National Cancer Institute (CA081436 to Alan P. Fields). Krishna R. Kalari is supported by a career development award from the Eveleigh Family Foundation. Additional support was provided by the Mayo Foundation. Support for analytical infrastructure was provided by a grant from the 26.2 with Donna Foundation and the National Marathon to Fight Breast Cancer. We thank Capella Weems for managing the lung cancer tissue resources and preparing the samples that were analyzed in this study. Bruce Eckloff provided outstanding support for deep sequence analysis through the Mayo Clinic Advanced Genomics Technology Center, which is supported in part by the Mayo Clinic Cancer Center Support Grant (CA15083). Ying Li, Sumit Middha, and Divaakar Siva Baala Sundaram provided data analysis support in database management and analysis of next-generation sequencing data.
Almoguera, C., Shibata, D., Forrester, K., Martin, J., Arnheim, N., and Perucho, M. (1988). Most human carcinomas of the exocrine pancreas contain mutant c-K-ras genes. Cell 53, 549–554.
Andreyev, H. J., Tilsed, J. V., Cunningham, D., Sampson, S. A., Norman, A. R., Schneider, H. J., and Clarke, P. A. (1997). K-ras mutations in patients with early colorectal cancers. Gut 41, 323–329.
Assenov, Y., Ramirez, F., Schelhorn, S. E., Lengauer, T., and Albrecht, M. (2008). Computing topological parameters of biological networks. Bioinformatics 24, 282–284.
Beane, J., Vick, J., Schembri, F., Anderlind, C., Gower, A., Campbell, J., Luo, L., Zhang, X. H., Xiao, J., Alekseyev, Y. O., Wang, S., Levy, S., Massion, P. P., Lenburg, M., and Spira, A. (2011). Characterizing the impact of smoking and lung cancer on the airway transcriptome using RNA-Seq. Cancer Prev. Res. (Phila.) 4, 803–817.
Beer, D. G., Kardia, S. L., Huang, C. C., Giordano, T. J., Levin, A. M., Misek, D. E., Lin, L., Chen, G., Gharib, T. G., Thomas, D. G., Lizyness, M. L., Kuick, R., Hayasaka, S., Taylor, J. M., Iannettoni, M. D., Orringer, M. B., and Hanash, S. (2002). Gene-expression profiles predict survival of patients with lung adenocarcinoma. Nat. Med. 8, 816–824.
Bild, A. H., Yao, G., Chang, J. T., Wang, Q., Potti, A., Chasse, D., Joshi, M. B., Harpole, D., Lancaster, J. M., Berchuck, A., Olson, J. A. Jr., Marks, J. R., Dressman, H. K., West, M., and Nevins, J. R. (2006). Oncogenic pathway signatures in human cancers as a guide to targeted therapies. Nature 439, 353–357.
Blasco, R. B., Francoz, S., Santamaria, D., Canamero, M., Dubus, P., Charron, J., Baccarini, M., and Barbacid, M. (2011). c-Raf, but not B-Raf, is essential for development of K-Ras oncogene-driven non-small cell lung carcinoma. Cancer Cell 19, 652–663.
Blumenschein, G. R. Jr., Gatzemeier, U., Fossella, F., Stewart, D. J., Cupit, L., Cihon, F., O’leary, J., and Reck, M. (2009). Phase II, multicenter, uncontrolled trial of single-agent sorafenib in patients with relapsed or refractory, advanced non-small-cell lung cancer. J. Clin. Oncol. 27, 4274–4280.
Dempster, A. P., Laird, N. M., and Rubin, D. B. (1977). Maximum likelihood from incomplete data via the EM algorithm. J. Roy. Stat. Soc. B Met. 39, 1–38.
Drosopoulos, K. G., Roberts, M. L., Cermak, L., Sasazuki, T., Shirasawa, S., Andera, L., and Pintzas, A. (2005). Transformation by oncogenic RAS sensitizes human colon cells to TRAIL-induced apoptosis by up-regulating death receptor 4 and death receptor 5 through a MEK-dependent pathway. J. Biol. Chem. 280, 22856–22867.
Eberhard, D. A., Johnson, B. E., Amler, L. C., Goddard, A. D., Heldens, S. L., Herbst, R. S., Ince, W. L., Janne, P. A., Januario, T., Johnson, D. H., Klein, P., Miller, V. A., Ostland, M. A., Ramies, D. A., Sebisanovic, D., Stinson, J. A., Zhang, Y. R., Seshagiri, S., and Hillan, K. J. (2005). Mutations in the epidermal growth factor receptor and in KRAS are predictive and prognostic indicators in patients with non-small-cell lung cancer treated with chemotherapy alone and in combination with erlotinib. J. Clin. Oncol. 23, 5900–5909.
Fujita, P. A., Rhead, B., Zweig, A. S., Hinrichs, A. S., Karolchik, D., Cline, M. S., Goldman, M., Barber, G. P., Clawson, H., Coelho, A., Diekhans, M., Dreszer, T. R., Giardine, B. M., Harte, R. A., Hillman-Jackson, J., Hsu, F., Kirkup, V., Kuhn, R. M., Learned, K., Li, C. H., Meyer, L. R., Pohl, A., Raney, B. J., Rosenbloom, K. R., Smith, K. E., Haussler, D., and Kent, W. J. (2011). The UCSC Genome Browser database: update 2011. Nucleic Acids Res. 39, D876–D882.
Goya, R., Sun, M. G., Morin, R. D., Leung, G., Ha, G., Wiegand, K. C., Senz, J., Crisan, A., Marra, M. A., Hirst, M., Huntsman, D., Murphy, K. P., Aparicio, S., and Shah, S. P. (2010). SNVMix: predicting single nucleotide variants from next-generation sequencing of tumors. Bioinformatics 26, 730–736.
Ignatenko, N. A., Babbar, N., Mehta, D., Casero, R. A. Jr., and Gerner, E. W. (2004). Suppression of polyamine catabolism by activated Ki-ras in human colon cancer cells. Mol. Carcinog. 39, 91–102.
Ji, H., Houghton, A. M., Mariani, T. J., Perera, S., Kim, C. B., Padera, R., Tonon, G., McNamara, K., Marconcini, L. A., Hezel, A., El-Bardeesy, N., Bronson, R. T., Sugarbaker, D., Maser, R. S., Shapiro, S. D., and Wong, K. K. (2006). K-ras activation generates an inflammatory response in lung tumors. Oncogene 25, 2105–2112.
Langmead, B., Trapnell, C., Pop, M., and Salzberg, S. L. (2009). Ultrafast and memory-efficient alignment of short DNA sequences to the human genome. Genome Biol. 10, R25.
Li, H., and Durbin, R. (2009). Fast and accurate short read alignment with Burrows-Wheeler transform. Bioinformatics 25, 1754–1760.
Li, H., Handsaker, B., Wysoker, A., Fennell, T., Ruan, J., Homer, N., Marth, G., Abecasis, G., and Durbin, R. (2009). The sequence alignment/map format and SAM tools. Bioinformatics 25, 2078–2079.
Massarelli, E., Varella-Garcia, M., Tang, X., Xavier, A. C., Ozburn, N. C., Liu, D. D., Bekele, B. N., Herbst, R. S., and Wistuba, I. I. (2007). KRAS mutation is an important predictor of resistance to therapy with epidermal growth factor receptor tyrosine kinase inhibitors in non-small-cell lung cancer. Clin. Cancer Res. 13, 2890–2896.
Meylan, E., Dooley, A. L., Feldser, D. M., Shen, L., Turk, E., Ouyang, C., and Jacks, T. (2009). Requirement for NF-kappaB signalling in a mouse model of lung adenocarcinoma. Nature 462, 104–107.
Okudela, K., Hayashi, H., Ito, T., Yazawa, T., Suzuki, T., Nakane, Y., Sato, H., Ishi, H., Keqin, X., Masuda, A., Takahashi, T., and Kitamura, H. (2004). K-ras gene mutation enhances motility of immortalized airway cells and lung adenocarcinoma cells via Akt activation: possible contribution to non-invasive expansion of lung adenocarcinoma. Am. J. Pathol. 164, 91–100.
Pao, W., Miller, V. A., Politi, K. A., Riely, G. J., Somwar, R., Zakowski, M. F., Kris, M. G., and Varmus, H. (2005a). Acquired resistance of lung adenocarcinomas to gefitinib or erlotinib is associated with a second mutation in the EGFR kinase domain. PLoS Med. 2, e73. doi:10.1371/journal.pmed.0020073
Pao, W., Wang, T. Y., Riely, G. J., Miller, V. A., Pan, Q., Ladanyi, M., Zakowski, M. F., Heelan, R. T., Kris, M. G., and Varmus, H. E. (2005b). KRAS mutations and primary resistance of lung adenocarcinomas to gefitinib or erlotinib. PLoS Med. 2, e17. doi:10.1371/journal.pmed.0020017
Riely, G. J., Marks, J., and Pao, W. (2009). KRAS mutations in non-small cell lung cancer. Proc. Am. Thorac. Soc. 6, 201–205.
Rossell, D. (2010). “Quantifying alternative splicing from paired end reads”, in Proceedings of the Eighteenth Annual International Conference on Intelligent Systems for Molecular Biology, Boston, MA.
Shields, J. M., Pruitt, K., Mcfall, A., Shaub, A., and Der, C. J. (2000). Understanding Ras: ‘it ain’t over ‘til it’s over’. Trends Cell Biol. 10, 147–154.
Singh, A., Greninger, P., Rhodes, D., Koopman, L., Violette, S., Bardeesy, N., and Settleman, J. (2009). A gene expression signature associated with “K-Ras addiction” reveals regulators of EMT and tumor cell survival. Cancer Cell 15, 489–500.
Smoot, M. E., Ono, K., Ruscheinski, J., Wang, P. L., and Ideker, T. (2011). Cytoscape 2.8: new features for data integration and network visualization. Bioinformatics 27, 431–432.
Sun, Z., Asmann, Y. W., Kalari, K. R., Bot, B., Eckel-Passow, J. E., Baker, T. R., Carr, J. M., Khrebtukova, I., Luo, S., Zhang, L., Schroth, G. P., Perez, E. A., and Thompson, E. A. (2011). Integrated analysis of gene expression, CpG island methylation, and gene copy number in breast cancer cells by deep sequencing. PLoS One 6, e17490. doi:10.1371/journal.pone.0017490
Trapnell, C., Williams, B. A., Pertea, G., Mortazavi, A., Kwan, G., Van Baren, M. J., Salzberg, S. L., Wold, B. J., and Pachter, L. (2010). Transcript assembly and quantification by RNA-Seq reveals unannotated transcripts and isoform switching during cell differentiation. Nat. Biotechnol. 28, 511–515.
Vojtek, A. B., and Der, C. J. (1998). Increasing complexity of the Ras signaling pathway. J. Biol. Chem. 273, 19925–19928.
Keywords: transcriptome sequencing, RNA-Seq, KRAS mutation, NSCLC, bioinformatics, network analysis, data integration and computational methods
Citation: Kalari KR, Rossell D, Necela BM, Asmann YW, Nair A, Baheti S, Kachergus JM, Younkin CS, Baker T, Carr JM, Tang X, Walsh MP, Chai H-S, Sun Z, Hart SN, Leontovich AA, Hossain A, Kocher J-P, Perez EA, Reisman DN, Fields AP and Thompson EA (2012) Deep sequence analysis of non-small cell lung cancer: integrated analysis of gene expression, alternative splicing, and single nucleotide variations in lung adenocarcinomas with and without oncogenic KRAS mutations. Front. Oncol. 2:12. doi: 10.3389/fonc.2012.00012
Received: 18 November 2011;
Accepted: 23 January 2012;
Published online: 10 February 2012.
Edited by:
Lao H. Saal, Lund University, SwedenReviewed by:
Nicole Cloonan, The University of Queensland, AustraliaCopyright: © 2012 Kalari, Rossell, Necela, Asmann, Nair, Baheti, Kachergus, Younkin, Baker, Carr, Tang, Walsh, Chai, Sun, Hart, Leontovich, Hossain, Kocher, Perez, Reisman, Fields and Thompson. This is an open-access article distributed under the terms of the Creative Commons Attribution Non Commercial License, which permits non-commercial use, distribution, and reproduction in other forums, provided the original authors and source are credited.
*Correspondence: E. Aubrey Thompson, Department of Cancer Biology, Room No. 214, Mayo Clinic Comprehensive Cancer Center, 4500 San Pablo Road, Jacksonville, FL 32224, USA. e-mail:dGhvbXBzb24uYXVicmV5QG1heW8uZWR1
Disclaimer: All claims expressed in this article are solely those of the authors and do not necessarily represent those of their affiliated organizations, or those of the publisher, the editors and the reviewers. Any product that may be evaluated in this article or claim that may be made by its manufacturer is not guaranteed or endorsed by the publisher.
Research integrity at Frontiers

Learn more about the work of our research integrity team to safeguard the quality of each article we publish.