 Lauren E. Watkins
 Bryan Haddock3
 Ananya Goyal
 Feliks Kogan
- 1Department of Radiology, Stanford University, Stanford, CA, United States
- 2Department of Imaging Research, Steadman Philippon Research Institute, Vail, CO, United States
- 3Department of Clinical Physiology, Nuclear Medicine and PET, Rigshospitalet, Copenhagen University Hospital, Copenhagen, Denmark
- 4Department of Bioengineering, Stanford University, Stanford, CA, United States
Introduction: Accurately estimating bone perfusion and metabolism using [18F]NaF kinetics from shorter scan times could help address concerns related to patient comfort, motion, and throughput for PET scans. We examined the impact of changing the PET scan duration on the accuracy of [18F]NaF kinetic parameters in the knee.
Methods: Both knees of twenty participants with and without osteoarthritis were scanned using a hybrid PET-MRI system (53 ± 13 years, BMI 25.9 ± 4.2 kg/m2, 13 female). Seventeen participants were scanned for 54 ± 2 min, and an additional three participants were scanned for 75 min. Patlak Ki and Hawkins kinetic parameters (Ki, K1, extraction fraction) were assessed using 50- or 75-minutes of scan data as well as for scan durations that were retrospectively shortened. The error of the kinetic uptake parameters was calculated in bone regions throughout the knee.
Results: The mean error of Patlak Ki, Hawkins Ki, K1, and extraction fraction was less than 10% for scan durations exceeding 30 min and decreased with increasing scan duration.
Conclusions: The length of dynamic data acquisition can be reduced to as short as 30 min while retaining accuracy within the limits of reproducibility of Hawkins kinetic uptake parameters.
1. Introduction
[18F]sodium fluoride [(18F)NaF] positron emission tomography (PET) imaging is a promising technique to study the role of bone metabolism in joint diseases such as osteoarthritis (1). [18F]NaF uptake is influenced by regional bone blood flow, or perfusion, and bone metabolism. Tracer uptake kinetics may be quantified using dynamic scans of up to 60 min or longer. The rate of fluoride clearance from plasma to the bone matrix (Ki) can be estimated using the graphical Patlak model (2) or using nonlinear regression based on the Hawkins two-tissue model (3). The Hawkins method can further be used to estimate bone perfusion (K1) as well as the fraction of [18F] extracted into the bone where it binds to the bone matrix in newly formed hydroxyapatite crystals at sites of bone formation (4) [extraction fraction, or k3/(k2 + k3)]. The Hawkins Ki has good reproducibility, with a precision error of less than 15% when calculated from 50 to 60 min of dynamic PET data (5–8). However, long scan times can result in increased motion artifacts, reduced throughput, and patient discomfort (9). Methods of accurately estimating [18F]NaF uptake kinetics from shorter acquisitions could help address these concerns.
Here, we examined the impact of shortening dynamic PET acquisition duration on kinetic [18F]NaF uptake parameters in the knee, hypothesizing that the scan duration could be shortened without impacting the accuracy of kinetic uptake parameters.
2. Methods
2.1. Study population
This study was approved by the University Institutional Review Board and all participants signed an informed consent form. Participants included 20 volunteers with (n = 12) and without (n = 8) clinically diagnosed knee osteoarthritis (53 ± 13 years, BMI 25.9 ± 4.2 kg/m2, 13 female).
2.2. Image acquisition
Both knees of all participants were scanned simultaneously using a 3 T whole-body time-of-flight hybrid PET-MRI system (GE SIGNA, GE Healthcare, Milwaukee WI) with two 16-channel flexible phased-array wrap coils. Both knees were scanned in one PET bed position in list mode [field of view: 25 cm axial × 60 cm trans-axial, full width at half maximum at 1 cm axial: 4.66 mm (10)] immediately following intravenous injection of 91.2 ± 6.6 MBq (0.8 ± 0.4 ml) of [18F]NaF (SOFIE Biosciences, Gilroy CA). Seventeen participants were scanned for 50–60 min (54 ± 2 min), and an additional 3 healthy participants were scanned for 75 min.
2.3. Image reconstruction
MRI was performed simultaneously with PET acquisition. MR-based attenuation correction of PET data was performed using a 2-point Dixon fat-water T1-weighted spoiled gradient echo MR sequence (11, 12) with TR/TE1/TE2 = 4.1/1.1/2.2 ms, FOV = 50 × 37.5 cm, matrix = 256 × 128, slice thickness = 5.2 mm (Figures 1A,B). MR angiography images, for segmentation and measurement of the popliteal artery volume, were acquired using a 3D inversion recovery spoiled gradient echo (IR-SPGR) sequence with repetition time (TR)/echo time (TE) = 21/2.1 ms, matrix = 512 × 512, number of slices = 18, slice thickness = 1.2 mm (Figure 1C). Quantitative double-echo in steady state (qDESS) images acquired for tissue segmentation had TR/TE1/TE2 = 24.6/5.8/43.4 ms, FOV = 16 cm, matrix = 320 × 320, and slice thickness = 1.5 mm (Figure 2B, Figure 4).
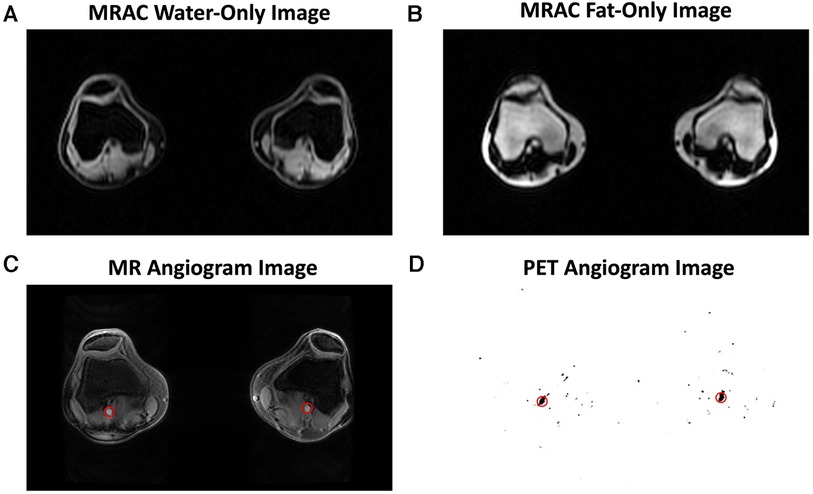
Figure 1. Representative images are shown for the magnetic resonance imaging (MRI) and positron emission tomography (PET) images used in image analysis. MR-based attenuation correction (MRAC) of PET data was performed using a 2-point Dixon fat-water T1-weighted spoiled gradient echo MR sequence, which generated a water-only image (A) and fat-only image (B). An MR angiogram (C) and PET angiogram (D) were used to automatically segment the popliteal arteries (red circles) and derive the arterial input function.
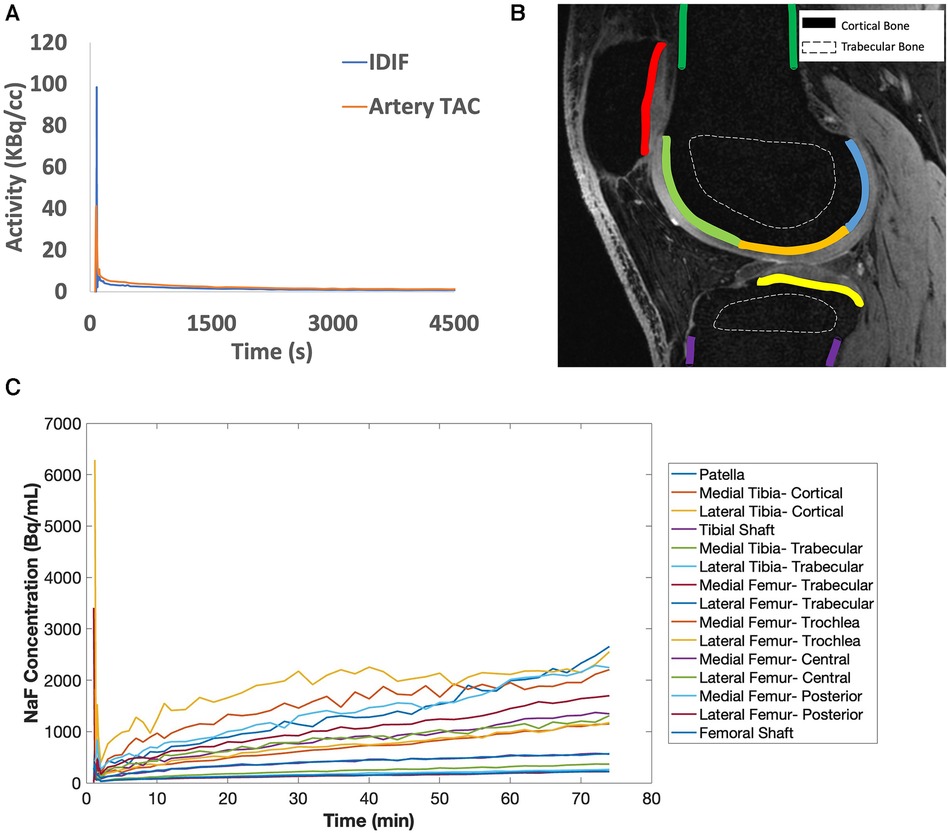
Figure 2. (A) [18F]sodium fluoride [(18F)NaF] uptake in the popliteal arteries was assessed using an image-derived input function (IDIF, blue line), which has a similar shape as the time activity curve (TAC) in the popliteal artery (artery TAC, orange line). (B) Bone was segmented from quantitative double-echo in steady state (qDESS) images and refined via a custom MATLAB script to derive a total of 15 bone subregions for cortical (solid lines) and trabecular bone (dashed lines). In the qDESS image shown: dark green = cortical bone of the femoral shaft, light green = subchondral bone of the trochlear region of the femur, orange = subchondral bone of the central region of the femur, blue = subchondral bone for the posterior region of the femur, yellow = subchondral bone for the tibia, purple = cortical bone of the tibial shaft, and red = subchondral bone for the patella. (C) Example tissue TACs are shown for each of the 15 bone subregions per knee.
All PET image frames were reconstructed from acquired list-mode data using a time-of-flight reconstruction (∼400 picosecond timing resolution) with resolution recovery corrections and a regularized reconstruction iterative algorithm [QClear, beta value of 350 (13)]. Reconstructed image frames had a matrix size of 384 × 384 and voxel size of 1.30 mm × 1.30 mm × 2.78 mm. An image-derived input function (IDIF) was determined from [18F]NaF activity (kBq/ml) in the popliteal artery of each knee independently, as previously described (1, 14, 15). With this technique, differences between venous blood samples and IDIF values measured at 50 min were on average within 0.2 kBq/ml, which corresponds to a coefficient of variation of 12% (Supplementary Figure S1). Dynamic PET frames were reconstructed with frame times: 20 × 1 s, 10 × 10 s, 10 × 30 s, 5 × 1 min, and 2 min frames for the remaining duration of the scan to calculate the IDIF (Figure 2A). First, the popliteal arteries were automatically segmented from MR angiography images and a short time-frame PET angiogram (0–16 s after injection) (14). Representative images are shown in Figures 1C,D, where the popliteal artery diameter was 5.5 (right) and 6.0 mm (left), in agreement with published ranges for artery diameters in adults (16, 17). To minimize spill-over artifacts (18), the voxels centered in the middle of the artery were determined for each dynamic frame and used for the IDIF region of interest. Centered voxels were defined by including the voxels in each axial slice within the highest 10% of arterial [18F]NaF activity and as having a positive gradient in the three dynamic frames preceding the bolus peak (3 s) and a negative post-peak gradient. A 3-ml venous blood sample was taken at the end of the scan (50 or 75 min after injection) and measured in a well counter to confirm that IDIF activity measures were similar to venous blood sample measurements. The venous sample was not utilized to calibrate the input function nor was a population-based input function utilized. Further, a time activity curve (TAC) of bone tracer uptake was reconstructed from dynamic list mode PET data with frame times: 6 × 10 s, 10 × 1 min, and 2 min frames for the remaining duration of the scan.
2.4. Segmentation
Tracer uptake was calculated in regions in the patella, femur, and tibia representing cortical, subchondral, and trabecular bone as described previously (14). Briefly, qDESS images were first re-sampled to PET resolution using Horos software and used to manually create masks of the entire femur, patella, and tibia in ITK-Snap (19). Bone masks were then segmented further to separate trabecular, subchondral, and cortical bone masks using k-means clustering of registered water-only and fat-only Dixon images (14). Cortical bone at the patellar tendon epiphyses was excluded. Subchondral bone masks were manually subdivided into regions representing the patella as well as the medial and lateral tibia and femur, then each portion of the femur was further manually subdivided into trochlear, central, and posterior regions. There were 15 bone regions per knee (Figure 2B, representative TAC curve for each bone region in Figure 2C).
2.5. Kinetic uptake parameters
Kinetic rate constants: K1 = bone perfusion (ml min−1 ml−1), k2 = tissue clearance (min−1), k3 = mineralization (min−1) and metabolism (Ki, ml min−1 ml−1) were calculated for individual bone regions as described above. For kinetic modeling of tracer uptake, the IDIF and tissue TAC data were fit to a Hawkins two-tissue tracer kinetic model (Figure 3) using a nonlinear regression (NLR) method as described previously (3). Given the signal to noise in the knee, the small value of the rate constant k4 (0.01/min), and the shorter scan durations considered in this study, k4 was defined as 0 (8). NLR fitting to estimate these three rate parameters, along with parameters to account for partial volume fraction, blood fraction, and input dispersion estimate (a total of 6 parameters) was performed for each bone region using COMKAT software (20). Extraction fraction was defined as k3/[k2 + k3] and represents the fraction of [18F] entering the bone tissue that binds to the bone matrix (as opposed to being cleared back into the plasma pool) and ranges in value from 0 to 1. KiNLR (Ki), the rate of clearance of [18F] from the plasma to the bone mineral compartment, was calculated as K1*extraction fraction with units of mL min−1 ml−1. For comparison to previous literature examining uptake parameter estimation with shortened protocols (21, 22), Ki was also calculated using the graphical Patlak method (2) using uptake data starting at 10 min for fitting to ignore the non-linear part of the curve during the non-equilibrium state of the system (23).
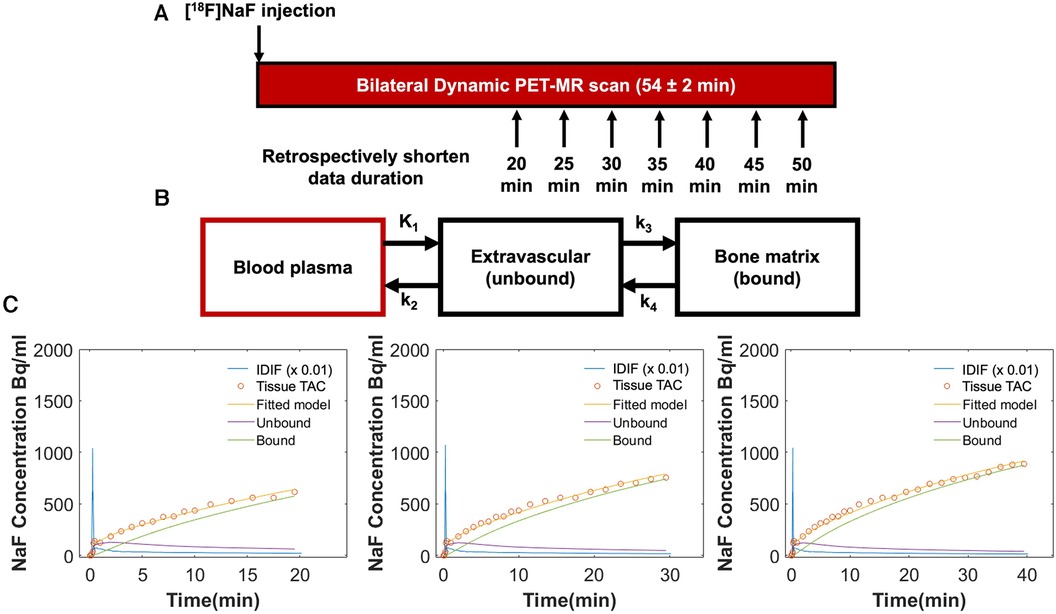
Figure 3. (A) Both knees of all participants were scanned simultaneously using a 3 T hybrid PET-MRI system immediately following intravenous injection of [18F]sodium fluoride [(18F)NaF]. Seventeen participants were scanned for a minimum of 50 min (54 ± 2 min), and an additional three healthy participants were scanned for 75 min. Tracer uptake data was retrospectively shortened to 20, 25, 30, 35, 40, and 45 min. (B) Tracer uptake data (IDIF and tissue TAC) for each duration was fit to a Hawkins two-tissue tracer kinetic model to estimate rate constants for individual bone regions: K1 = bone perfusion (ml min−1 ml−1), k2 = tissue clearance (min−1), and k3 = mineralization (min−1). K4 was set to 0. From these rate constants, extraction fraction [the fraction of (18F) entering the bone tissue that binds to the bone matrix] was defined as k3/[k2 + k3] and Ki [the rate of clearance of (18F) from the plasma to the bone mineral compartment] was calculated as K1*extraction fraction (ml min−1 ml−1). (C) Representative Hawkins model fits are shown for data of 20, 30, and 40 min of duration for the same bone region in an osteoarthritic knee. At 20 min, Ki = 0.0121 ml min−1 ml−1, K1 = 0.015 ml min−1 ml−1, and extraction fraction = 0.81; at 30 min, Ki = 0.0116 ml min−1 ml−1, K1 = 0.015 ml min−1 ml−1, and extraction fraction = 0.78; at 40 min, Ki = 0.0096 ml min−1 ml−1, K1 = 0.013 ml min−1 ml−1, and extraction fraction = 0.75.
2.6. Data analysis
Kinetic parameters were first calculated using 50 min of scan data for all participants. To examine how abbreviated PET scan times might impact kinetic uptake parameters, Patlak and Hawkins kinetic modeling was also performed for retrospectively shortened IDIF and tissue TAC data of only 20-, 25-, 30-, 35-, 40-, or 45-minutes duration (Figure 3). For the 3 participants scanned for 75 min, the same methods were repeated comparing the kinetic parameters obtained from the 75 min of data to those obtained from shortened data sets. The mean and standard deviation of the normalized difference (error, %) of the kinetic uptake parameters derived from the shortened scan data were calculated with reference to parameters derived from modeling the original scan data. Finally, since signal to noise is important to consider, error was reported separately for bone regions with relatively “high” uptake (Ki > 0.03 ml min−1 ml−1), “low” uptake (Ki < 0.01 ml min−1 ml−1), and “medium” uptake (Ki between 0.01–0.03 ml min−1 ml−1).
3. Results
Across all bone regions and participants, the mean error of the Hawkins Ki, K1, and extraction fraction, and the Patlak Ki, was less than 6% for all scan durations with respect to parameters calculated using 50 min of scan data. Representative Hawkins model fits used to estimate kinetic parameters for shortened scan durations are shown in Figure 3C. A summary of the volumes of each bone region and y-axis intercept values from Patlak analysis (V0) are provided in the Supplemental Material. Mean and standard deviation in values and percent errors for Patlak Ki, Hawkins Ki, K1, and extraction fraction are presented in Tables 1, 2 respectively. The standard deviation of the error was 15% or less for scan durations of 30 min or longer.
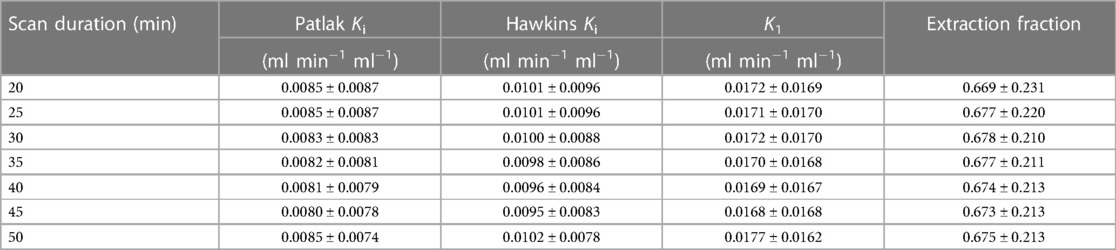
Table 1. Mean and standard deviation in the kinetic parameters for each scan duration.
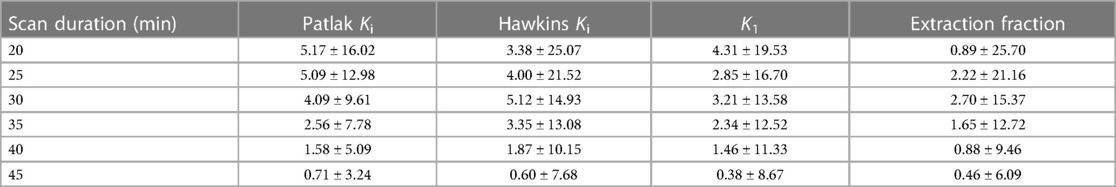
Table 2. Mean and standard deviation of the percent error of kinetic uptake parameters from shortened scan data compared to 50-minute scan data.
An example qDESS MRI and maximum intensity projection (MIP) PET images of tracer uptake at 30, 50, and 75 min depict an area of focally high tracer uptake in the patella at each timepoint for a healthy knee (Figure 4). For the three healthy subjects scanned for 75 min, the mean and standard deviation of the kinetic uptake parameters at 75 min were 0.0054 ± 0.0027 ml min−1 ml−1 for Patlak Ki, 0.0067 ± 0.0032 ml min−1 ml−1 for Hawkins Ki, 0.0095 ± 0.0048 for K1 ml min−1 ml−1, and 0.745 ± 0.180 for extraction fraction. Errors in the estimation of kinetic parameters associated with using shortened scan durations compared to parameters calculated using 75 min of scan data as a reference are presented in Table 3. Negative values represent underestimations of uptake parameters relative to those calculated using 75 min of scan data. For scan durations 30 min or longer, the mean and standard deviation of the error was less than 15% for all parameters. The errors decreased with increasing scan duration.
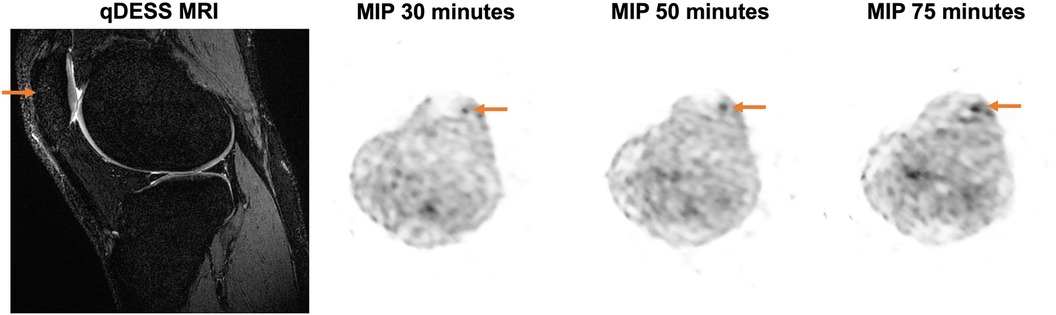
Figure 4. Representative MRI and maximum intensity projection (MIP) PET images are shown for a 27-year-old female healthy participant with a BMI of 19.94 kg/m2. A sagittal qDESS MRI shows a structurally unremarkable patella; however, MIP PET images demonstrate an area of focally high uptake (arrow) at the 30-, 50-, and 75-minute timepoints.
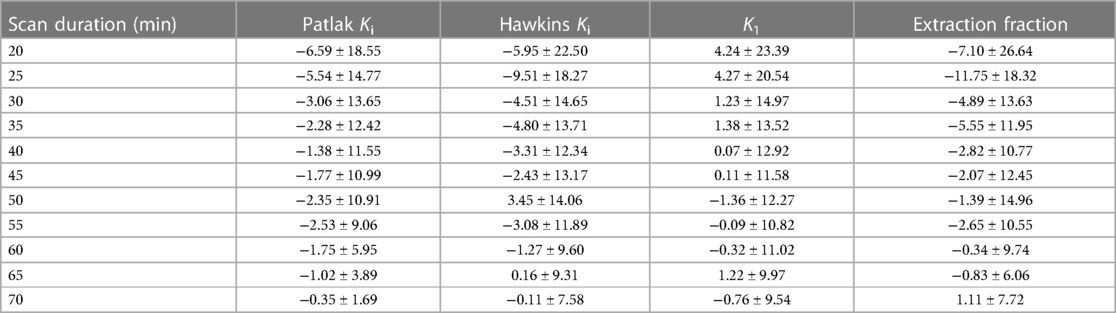
Table 3. Mean and standard deviation of the percent error of kinetic uptake parameters from shortened scan data compared to 75-minute scan data.
Error in kinetic parameters grouped by [18F]NaF uptake rates is shown in Figure 5 and Table 4. There were 14 regions with high Ki, 144 regions with medium Ki, and 442 regions with low Ki. The mean error at 50 min is 0% since parameters derived from a 50-minute scan were used as a reference. The error decreased with increasing duration of the scan data used for fitting the models, and was less than 10% for high, medium, and low uptake rates when calculated using data with a duration of at least 30 min.
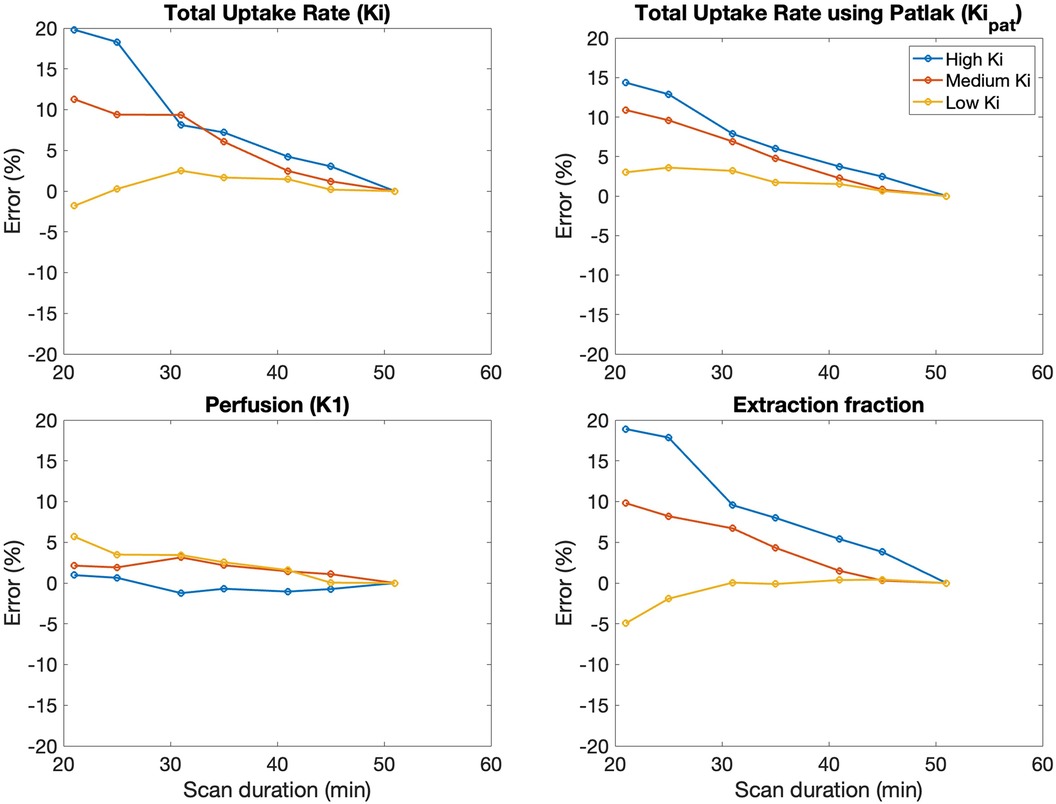
Figure 5. The average error in kinetic uptake parameters associated with shortened scan durations was reported separately for bone regions with relatively “high” uptake (Ki > 0.03 ml min−1 ml−1), “medium” uptake (Ki between 0.01–0.03 ml min−1 ml−1), and “low” uptake (Ki < 0.01 ml min−1 ml−1). Error was calculated with reference to the parameters derived from a 50-minute scan. For all kinetic uptake parameters, error decreased with increasing duration of the scan data used for fitting the models.
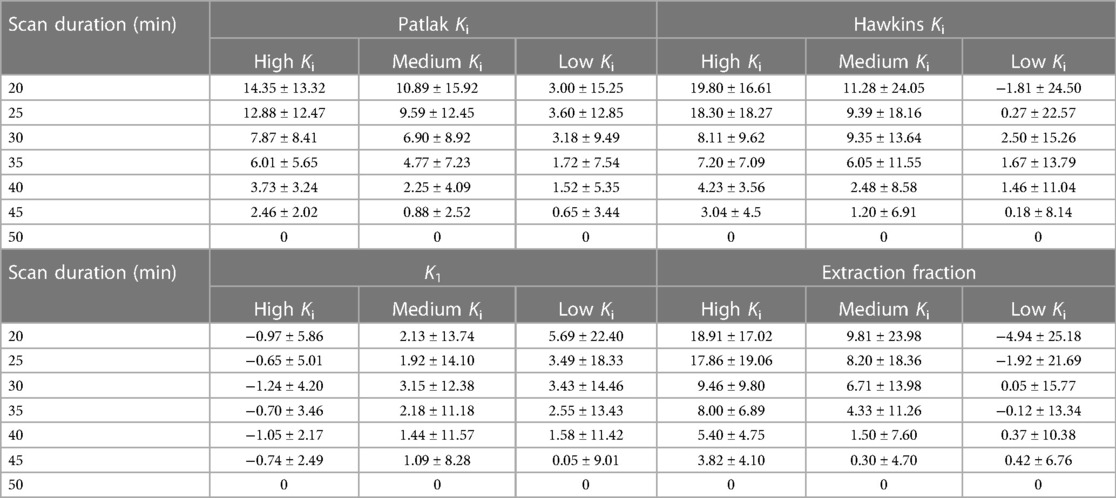
Table 4. Mean and standard deviation of the percent error in kinetic uptake parameters in bone regions with low (Ki < 0.01 ml min−1 ml−1), medium (Ki between 0.01–0.03 ml min−1 ml−1), and high (Ki > 0.03 ml min−1 ml−1) Ki values.
4. Discussion
We examined the impact of shorter scan durations on estimating kinetic parameters, including Hawkins parameters for bone perfusion (K1), extraction fraction [k3/(k2 + k3)], and metabolism (Ki) from [18F]NaF uptake. Retrospectively shortening the duration of the time activity curve increased errors in Ki, K1, and extraction fraction. Trends were similar between Hawkins and Patlak techniques, though the Patlak Ki was associated with lower variability and the parameter V0 from the graphical Patlak analysis increased in a linear fashion as scan time decreased. The mean error in Hawkins uptake parameters were, however, less than 10% for scan durations exceeding 30 min for regions with high and low uptake. Errors in kinetic uptake parameters were comparable between Hawkins and Patlak models.
Conventional techniques for kinetic quantification using [18F]NaF require data from a 60-minute dynamic scan (23). Precision error using the 60-minute scans are reported to range from 13.9–14.5% for Hawkins Ki and 11.7–13.5% for Patlak Ki (6, 7). The precision error metric from reproducibility studies, defined as the percentage of the standard deviation divided by the mean from two repeated PET scans (6), is comparable to the standard deviation of the percent error between abbreviated and full-length scans used in this study. For scan durations of 30 min or longer, the standard deviations in the error were within previously reported ranges for precision error at 60 min (23) for all kinetic uptake parameters. Further, the errors in parametric values with shortened scan durations are similar to prior literature on new techniques for quantifying [18F]NaF uptake rates from shorter acquisitions (22), including from a 12-minute dynamic scan using a Hawkins model with fixed rate constants (24). With the 12-minute technique, the Hawkins Ki had an equivalent or superior statistical power compared to the conventional scan in an osteoporotic population. However, with fixed rate constants, K1 values were in a fixed ratio to Ki and did not represent true measurements of bone blood flow. In the current study, both Ki and associated Hawkins rate constants were freely fitted to available scan data, which may be more widely applicable to a variety of conditions where bone metabolism may vary.
Although studies typically use scan times of around an hour, increased scanning time, such as in the 75-minute datasets in the present study, give similar results. Kinetic uptake parameters for all abbreviated scan durations were within 5% of values calculated from 50 min of scan data and within 12% of values calculated from 75 min of scan data; for both, errors were within 5% for scan durations exceeding 30 min. PET images show similar patterns of tracer uptake at 30, 50, and 75 min. At 30 min, it can be assumed that circulating venous and arterial [18F]NaF have reached equilibrium (25). A 30-minute scan may thus represent a reasonable lower limit for abbreviated dynamic acquisitions without appreciable impacts on parametric values. Introducing errors on the order of 5% from shorter acquisitions may be an acceptable compromise to reduce overall study time and motion artifacts for exercise studies, for example, where relative changes in kinetic uptake parameters on the order of 25%–180% have been observed (26).
SUV, Ki, and K1 have been observed to be elevated in osteoarthritic knees compared to healthy ones (1), although areas of high uptake may occur in non-osteoarthritic knees (27) and after exercise in healthy knees (26). To account for the variable uptake levels that may be found within a given knee or in situations like loading that induce high tracer uptake, differences in errors at each scan duration were examined according to tracer uptake levels. The overall error in uptake parameters decreased with increasing scan durations but was variable between bone regions with high or low uptake rates. Bone regions with moderate to high uptake rates had higher SNR contributing to lower error in K1 with shorter scan durations but larger errors in the extraction fraction. Extraction fraction is generally associated with greater variability than K1 due to greater uncertainties in estimating rate constants k2 and k3 (28). Additionally, extraction fraction in bone regions with moderate-high uptake is more variable than in bone regions with low uptake, as observed in prior work in an osteoarthritic population and exercise studies where high uptake rates were associated with [18F] delivery that outpaced clearance (1, 26, 29). Errors in kinetic parameters calculated with reference to a 75-minute PET acquisition followed similar trends. Shortening the scan duration to 30 min was sufficient to estimate kinetic parameters within 10% of parameters calculated using 50 and 75 min of scan data. Using shorter scans with fewer time points or shorter frames does change the calculus regarding signal to noise. Although regions of interest within the knee are small curved shapes where smaller voxels are advantageous for segmentation and contrast recovery (30, 31), the combined signal to noise of the volume does need to be sufficient for fitting parameters requiring an optimization of frame time, number of frames and voxel size.
One limitation of this work was the variability in the number of regions with different Ki values in this population including osteoarthritic knees. The selection of Ki ranges was based on prior work in an osteoarthritic population (1), but there were fewer bone regions with high Ki compared to regions with low Ki, which may have impacted the observed differences in mean error between groups. While it is a heterogeneous sample, the division of results by bone regions with different uptake rates attempted to represent regional and metabolic variability associated with disease and associated impacts on errors observed in shortened scans. Regions of low and high bone metabolism can be found in knees with conditions affecting bone metabolism such as osteoarthritis, so it is important to consider this variability when using abbreviated protocols. Another limitation was that only three datasets with 75 min of data were used to compare errors against datasets with 50–60 min of data. This data was used as a proof of concept to demonstrate that results were not noticeably different when longer duration scans were used as a reference. Additionally, k-loss due to k4 was not assessed for longer scan times. As assessed by Siddique et al., k-loss due to k4 can introduce errors underestimating Ki by approximately 20% after 2 h (32). However, in this dataset only three participants were scanned for longer than 50 min and, for these three datasets, the scan time was only 75 min which is a short time frame compared to the 120 min used previously to determine Ki loss. Moreover, we aimed to focus our analysis on the shorter scan durations, where k4 is small (∼0.01/min) and is commonly considered negligible. Bone was not considered in the attenuation correction technique and while this may affect the accuracy of quantifying tracer uptake, this would have a similar impact at all durations studied. The same image-derived input function was used for the arterial input function (14, 15) for all retrospectively time-under sampled pharmacokinetic model fitting. Multiple plasma blood measurements were not used for validation; however, this technique has previously shown good reproducibility (14, 15). Minor discrepancies observed between the IDIF and artery TAC following peak tracer delivery may be attributed to a known bias where the IDIF underestimates measures on the order of 2%–5% (15) or may possibly reflect tracer uptake in arterial walls. Alternative input functions were beyond the scope of this work and were not explored. Finally, a limitation of techniques incorporating shorter acquisitions is that SUV will be lower with shorter uptake times. SUV could still be incorporated in population studies with shorter protocols as a relative measure compared to background uptake by standardizing the duration and starting time for SUV measurements across scans.
Overall, we observed that the duration of the dynamic [18F]NaF PET scan can be reduced while maintaining low errors in bone perfusion (K1) and metabolism (Ki) estimation from the Hawkins model. Shorter dynamic [18F]NaF PET scans, potentially as short as 30 min, could be used without appreciable error in Hawkins uptake parameters in bone regions with both low and high tracer uptake.
Data availability statement
The original contributions presented in the study are included in the article/Supplementary Material, further inquiries can be directed to the corresponding author.
Ethics statement
The studies involving humans were approved by Stanford University Institutional Review Board. The studies were conducted in accordance with the local legislation and institutional requirements. The participants provided their written informed consent to participate in this study.
Author contributions
LW, BH, and FK contributed to conception and design of the study. LW performed data collection. All authors contributed to data analysis. LW wrote the first draft of the manuscript. All authors contributed to the article and approved the submitted version.
Funding
This work was supported by the GE Healthcare and NIH grants R01AR074492, R01AR079431 and R21EB030180.
Conflict of interest
The authors declare that the research was conducted in the absence of any commercial or financial relationships that could be construed as a potential conflict of interest.
Publisher's note
All claims expressed in this article are solely those of the authors and do not necessarily represent those of their affiliated organizations, or those of the publisher, the editors and the reviewers. Any product that may be evaluated in this article, or claim that may be made by its manufacturer, is not guaranteed or endorsed by the publisher.
Supplementary material
The Supplementary Material for this article can be found online at: https://www.frontiersin.org/articles/10.3389/fnume.2023.1194961/full#supplementary-material
References
1. Watkins LE, MacKay J, Haddock B, Mazzoli V, Uhlrich SD, Gold GE, et al. Assessment of quantitative [18F]sodium fluoride PET measures of knee subchondral bone perfusion and mineralization in osteoarthritic and healthy subjects. Osteoarthr Cartil. (2021) 29(6):849–58. doi: 10.1016/j.joca.2021.02.563
2. Patlak CS, Blasberg RG. Graphical evaluation of blood-to-brain transfer constants from multiple-time uptake data. Generalizations. J Cereb Blood Flow Metab. (1985) 5(4):584–90. doi: 10.1038/jcbfm.1985.87
3. Hawkins RA, Choi Y, Huang SC, Hoh CK, Dahlbom M, Schiepers C, et al. Evaluation of the skeletal kinetics of fluorine-18-fluoride Ion with PET. J Nucl Med. (1992) 33(5):633–42. PMID: 1569473
4. Schümichen C, Rempfle H, Wagner M, Hoffmann G. The short-term fixation of radiopharmaceuticals in bone. Eur J Nucl Med. (1979) 4(6):423–8. doi: 10.1007/BF00300839
5. Frost ML, Blake GM, Park-Holohan SJ, Cook GJR, Curran KM, Marsden PK, et al. Long-term precision of 18F-fluoride PET skeletal kinetic studies in the assessment of bone metabolism. J Nucl Med. (2008) 49(5):700–7. doi: 10.2967/jnumed.107.046987
6. Brenner W, Vernon C, Muzi M, Mankoff DA, Link JM, Conrad EU, et al. Comparison of different quantitative approaches to 18F-fluoride PET scans. J Nucl Med. (2004) 45(9):1493–500. PMID: 15347716
7. Al-Beyatti Y, Siddique M, Frost ML, Fogelman I, Blake GM. Precision of 18F-fluoride PET skeletal kinetic studies in the assessment of bone metabolism. Osteoporos Int. (2012) 23(10):2535–41. doi: 10.1007/s00198-011-1889-2
8. Siddique M, Frost ML, Blake GM, Moore AEB, Al-Beyatti Y, Marsden PK, et al. The precision and sensitivity of 18F-fluoride PET for measuring regional bone metabolism: a comparison of quantification methods. J Nucl Med. (2011) 52(11):1748–55. doi: 10.2967/jnumed.111.093195
9. Meikle SR, Sossi V, Roncali E, Cherry SR, Banati R, Mankoff D, et al. Quantitative PET in the 2020s: a roadmap. Phys Med Biol. (2021) 66(6):06RM01. doi: 10.1088/1361-6560/abd4f7
10. Grant AM, Deller TW, Khalighi MM, Maramraju SH, Delso G, Levin CS. NEMA NU 2-2012 performance studies for the SiPM-based ToF-PET component of the GE SIGNA PET/MR system. J Med Phys. (2016) 43(5):2334–43. doi: 10.1118/1.4945416
11. Wagenknecht G, Kaiser HJ, Mottaghy FM, Herzog H. MRI For attenuation correction in PET: methods and challenges. Magn Reson Mater Phys Biol Med. (2013) 26(1):99–113. doi: 10.1007/s10334-012-0353-4
12. Karakatsanis NA, Abgral R, Trivieri MG, Dweck MR, Robson PM, Calcagno C, et al. Hybrid PET- and MR-driven attenuation correction for enhanced 18 F-NaF and 18F-FDG quantification in cardiovascular PET/MR imaging. J Nucl Cardiol. (2020) 27(4):1126–41. doi: 10.1007/s12350-019-01928-0
13. Yoshii T, Miwa K, Yamaguchi M, Shimada K, Wagatsuma K, Yamao T, et al. Optimization of a Bayesian penalized likelihood algorithm (Q.Clear) for 18F-NaF bone PET/CT images acquired over shorter durations using a custom-designed phantom. EJNMMI Phys. (2020) 7(1):56. doi: 10.1186/s40658-020-00325-8
14. Haddock B, Fan AP, Jørgensen NR, Suetta C, Gold GE, Kogan F. Kinetic [18F]-fluoride of the knee in normal volunteers. Clin Nucl Med. (2019) 44(5):377–85. doi: 10.1097/RLU.0000000000002533
15. Haddock B, Kogan F, Fan AP, Suetta C, Gold GE. Image derived arterial input function using popliteal artery for [18F]-sodium fluoride (NaF) PET/MRI. Proceedings of the international society for magnetic resonance in medicine (2018). p. 5156. Available at: https://cds.ismrm.org/protected/18MProceedings/PDFfiles/5156.html (Accessed October 12, 2023)
16. Wolf YG, Kobzantsev Z, Zelmanovich L. Size of normal and aneurysmal popliteal arteries: a duplex ultrasound study. J Vasc Surg. (2006) 43(3):488–92. doi: 10.1016/j.jvs.2005.11.026
17. Singh S, Kumar S, Alam MT, Khan K. Measurement of popliteal artery diameter: a cadavaric study. Acad Anat Int. (2019) 5(1):12–5. doi: 10.21276/aanat.2019.5.1.4
18. Khalighi MM, Deller TW, Fan AP, Gulaka PK, Shen B, Singh P, et al. Image-derived input function estimation on a TOF-enabled PET/MR for cerebral blood flow mapping. J Cereb Blood Flow Metab. (2018) 38(1):126–35. doi: 10.1177/0271678X17691784
19. Yushkevich PA, Piven J, Hazlett HC, Smith RG, Ho S, Gee JC, et al. User-guided 3D active contour segmentation of anatomical structures: significantly improved efficiency and reliability. Neuroimage. (2006) 31(3):1116–28. doi: 10.1016/j.neuroimage.2006.01.015
20. Muzic J, Cornelius S. COMKAT: compartment model kinetic analysis tool. J Nucl Med. (2001) 42(4):636–45. PMID: 11337554
21. Raijmakers P, Temmerman OPP, Saridin CP, Heyligers IC, Becking AG, Van Lingen A, et al. Quantification of 18F-fluoride kinetics: evaluation of simplified methods. J Nucl Med. (2014) 55(7):1122–7. doi: 10.2967/jnumed.113.135269
22. Siddique M, Blake GM, Frost ML, Moore AEB, Puri T, Marsden PK, et al. Estimation of regional bone metabolism from whole-body 18F-fluoride PET static images. Eur J Nucl Med Mol Imaging. (2012) 39(2):337–43. doi: 10.1007/s00259-011-1966-y
23. Puri T, Frost ML, Moore AEB, Cook GJR, Blake GM. Input function and modeling for determining bone metabolic flux using [18F] sodium fluoride PET imaging: a step-by-step guide. Med Phys. (2023) 50(4):2071–88. doi: 10.1002/mp.16125
24. Puri T, Frost ML, Cook GJ, Blake GM. [18F] Sodium fluoride PET kinetic parameters in bone imaging. Tomography. (2021) 7(4):843–54. doi: 10.3390/tomography7040071
25. Cook GJR, Lodge MA, Marsden PK, Dynes A, Fogelman I. Non-invasive assessment of skeletal kinetics using fluorine-18 fluoride positron emission tomography: evaluation of image and population-derived arterial input functions. Eur J Nucl Med. (1999) 26(11):1424–9. doi: 10.1007/s002590050474
26. Haddock B, Fan AP, Uhlrich SD, Jørgensen NR, Suetta C, Gold GE, et al. Assessment of acute bone loading in humans using [18F]NaF PET/MRI. Eur J Nucl Med Mol Imaging. (2019) 46(12):2452–63. doi: 10.1007/s00259-019-04424-2
27. Kogan F, Fan AP, Monu U, Iagaru A, Hargreaves BA, Gold GE. Quantitative imaging of bone–cartilage interactions in ACL-injured patients with PET–MRI. Osteoarthr Cartil. (2018) 26(6):790–6. doi: 10.1016/j.joca.2018.04.001
28. Piert M, Zittel TT, Becker GA, Jahn M, Stahlschmidt A, Maier G, et al. Assessment of porcine bone metabolism by dynamic [18F]fluoride ion PET: correlation with bone histomorphometry. J Nucl Med. (2001) 42(7):1091–100. PMID: 11438633
29. Watkins LE, Haddock B, MacKay JW, Baker J, Uhlrich SD, Mazzoli V, et al. [18F] Sodium fluoride PET-MRI detects increased metabolic bone response to whole-joint loading stress in osteoarthritic knees. Osteoarthr Cartil. (2022) 30(11):1515–25. doi: 10.1016/j.joca.2022.08.004
30. Rep S, Tomse P, Jensterle L, Jarabek L, Zaletel K, Lezaic L. Image reconstruction using small-voxel size improves small lesion detection for positron emission tomography. Radiol Oncol. (2022) 56(2):142–9. doi: 10.2478/raon-2022-0015
31. Morey AM, Noo F, Kadrmas DJ. Effect of using 2 mm voxels on observer performance for PET lesion detection. IEEE Trans Nucl Sci. (2016) 63(3):1359–66. doi: 10.1109/TNS.2016.2518177
Keywords: [18F]NaF PET, scan duration, Hawkins model, osteoarthritis, kinetic uptake parameters
Citation: Watkins LE, Haddock B, Goyal A and Kogan F (2023) Effects of dynamic [18F]NaF PET scan duration on kinetic uptake parameters in the knee. Front. Nucl. Med. 3:1194961. doi: 10.3389/fnume.2023.1194961
Received: 27 March 2023; Accepted: 10 November 2023;
Published: 24 November 2023.
Edited by:
Alberto Cuocolo, University of Naples Federico II, ItalyReviewed by:
Mirwais Wardak, Genentech Inc., United StatesLaurence Carroll, Johns Hopkins University, United States
© 2023 Watkins, Haddock, Goyal and Kogan. This is an open-access article distributed under the terms of the Creative Commons Attribution License (CC BY). The use, distribution or reproduction in other forums is permitted, provided the original author(s) and the copyright owner(s) are credited and that the original publication in this journal is cited, in accordance with accepted academic practice. No use, distribution or reproduction is permitted which does not comply with these terms.
*Correspondence: Feliks Kogan ZmtvZ2FuQHN0YW5mb3JkLmVkdQ==