 Konstantin V. Zavadovsky1*
 Darya A. Vorobyeva1
 Olga V. Mochula1
 Andrew V. Mochula1Alina N. Maltseva1Andrew E. Bayev1Marina O. Gulya1
 Alessia Gimelli2
 Vyacheslav V. Ryabov1
- 1Tomsk National Research Medical Centre, Cardiology Research Institute, Russian Academy of Sciences, Moscow, Russia
- 2Fondazione Toscana, CNR Gabriele Monasterio, Pisa, Italy
Background: To assess single-photon emission computed tomography cadmium-zinc-telluride (SPECT CZT)-derived myocardial blood flow (MBF) flow reserve (MFR) and flow difference (FD) in patients with acute myocardial infarction (AMI) and to compare this data with serum cardiac troponin and cardiac magnetic resonance (CMR) findings.
Methods: A total of 31 patients with AMI underwent invasive coronary angiography (ICA), serial high-sensitivity serum cardiac troponin I (cTnI) measurement, and CZT SPECT with visual and quantitative (MBF, MFR, and FD) perfusion parameters, and contrast-enhanced CMR. All patients with AMI were divided into two groups: (1) with non-obstructive coronary arteries (MINOCA), n = 10; (2) with obstructive coronary artery disease (MICAD), n = 21.
Results: The values of SSS and SRS were significantly (p < 0.01) higher whereas global stress MBF, MFR significantly lower in patients with MICAD as compared to MINOCA – 5.0 (3.0; 5.0) vs. 9.0 (5.0; 13.0); 2.0 (1.0; 3.0) vs. 6.0 (3.0; 11.0); 2.02 (1.71; 2.37) vs. 0.86 (0.72; 1.02) ml/min/g; and 2.61 (2.23; 3.14) vs. 1.67 (1.1; 1.9), respectively. Stress MBF correlated with cTnI at 24 h and day 4: ρ = −0.39; p = 0.03 and ρ = −0.47; p = 0.007, respectively. FD correlated with cTnI at 24 h and day 4: ρ = −0.39; p = 0.03 and ρ = −0.46; p = 0.009. CMR analysis showed that infarct size, MVO and myocardial edema in patients with MICAD were significantly (< 0.05) higher as compared to MINOCA: 19.4 (10.4; 29.7) vs. 1.8 (0.0; 6.9); 0.1 (0.0; 0.7) vs. 0.0 (0.0; 0.0) and 19.5 (12.0;30.0) vs. 3.0 (0.0; 12.0), respectively. According to vessel-based analysis of CMR data, acute myocardial injury (defined as late gadolinium enhancement and myocardial edema) was observed more frequently in patients with MICAD compared to MINOCA: 34(37%) vs. 5(5%) p = 0.005, respectively. The values of regional stress MBF, MFR and FD were significantly decreased in LV territories characterized by myocardial injury compared to those without: 0.98 (0.73; 1.79) vs. 1.33 (0.94; 2.08) p < 0.01, 1.64 (1.0; 2.36) vs. 2.0 (1.53; 2.89) p < 0.01 and 0.33 (0.05; 0.57) vs. 0.56 (0.36; 1.32) p> 0.01, respectively.
Conclusion: In patients with AMI, SPECT CZT-derived flow measures were associated with the high-sensitivity troponin I as well as the extent of edema, microvascular obstruction, and infarct size detected by CMR. On the regional level, quantitative SPECT CZT measures were significantly lower in vessel territories characterized by myocardial injury.
Introduction
Myocardial blood flow (MBF) and myocardial flow reserve (MFR) are well-established quantitative non-invasive measures reflecting coronary pathophysiology in the broad spectrum of cardiac pathology (1). The gold standard of non-invasive MBF and MFR assessment is positron emission tomography (PET) with 15O-H2O and 13N-ammonia. This method showed high accuracy in the diagnosis of functionally significant stenosis (2, 3) in patients with stable obstructive CAD as well as in ischemia without flow-limiting stenosis (4). Moreover, decreased values of MBF and MFR were demonstrated in the territory of infarct-related artery and reference artery as well (5). Further, reduced MFR in non-viable left ventricular (LV) segments in patients with successfully revascularized acute myocardial infarction (AMI) was shown using 13N-ammonia PET (6).
However, the low availability and high cost of cardiac PET hinder the wide spread of this method (7). Good agreement between cadmium-zinc-telluride (CZT) single-photon emission computed tomography (SPECT) and PET-derived flow and reserve results were reported in previous studies with 15O-H2O (8), 13N-ammonia (9, 10) and 82Rb (11). Although the diagnostic (12, 13) and prognostic (14) value of CZT SPECT is well studied in patients with stable CAD, the data regarding global and regional MBF and MFR in patients with acute coronary syndrome (ACS) is lacking. Moreover, there is only one study reported the correlation of CZT-derived flow indexes with MR-measured hyperemic MBF and CFR in 30 stable CAD subjects (15). No data is available regarding the association of serial markers of myocardial necrosis measurement, in particular, high-sensitivity serum cardiac troponin I (cTnI) and SPECT CZT derived quantitative indexes of MBF and MFR.
The study of MBF and MFR in patients with AMI may provide additional data to assess the extent and severity of microcirculation impairment due to epicardial artery lesion, subsequence myocardial edema, and microvascular obstruction (MVO) as well as reperfusion injury. It may be of help to triage patients and improve the risk stratification, particularly in subjects with AMI and no obstructive coronary arteries.
For this purpose, this study aimed to assess SPECT CZT-derived myocardial blood flow and flow reserve in patients with AMI and to compare this data with serum cardiac troponin and cardiac magnetic resonance findings.
Methods
Study Design
In accordance with the “Cardiac Structure, Function, and Clinical Manifestations in MINOCA” study design (clinicaltrials.gov NCT03572023) all patients with the acute coronary syndrome, submitted to invasive coronary angiography (ICA), with and without obstructive coronary arteries, were enrolled in the study. Patients with obstructive coronary arteries (myocardial infarction with obstructive coronary arteries, MICAD) were enrolled as a control group. Patients with either normal coronaries or no obstructive (<50%) coronary atherosclerosis were identified as myocardial infarction with non-obstructive coronary arteries (MINOCA), while patients with stenosis 50% or higher of one coronary artery were identified as MICAD.
Inclusion criteria were the following: age 18 years and older, ACS who underwent ICA within 24 h of the onset of the disease, high and moderate cardiovascular risk on the Grace scale, and sinus rhythm on ECG. Exclusion criteria were: hemodynamic instability, myocardial inflammatory diseases, storage diseases, moderate-to-severe cardiac valvular disease, atrial fibrillation, previous revascularization, severe comorbidity, severe renal failure (eGFR <30), pacing, claustrophobia, contraindication to adenosine administration.
Rest ECG and high-sensitivity serum cardiac troponin I measurement were performed on admission and after 24 h. Within 2 weeks after ICA, all patients underwent stress/rest SPECT myocardial perfusion scintigraphy (MPS) with quantitative mMBF and MFR assessment as well as cardiac magnetic resonance (CMR) with late gadolinium enhancement (LGE) for the assessment of AMI.
All patients were followed up for 1 year. The primary endpoint was major adverse cardiovascular events (MACE), including all-cause of death, myocardial infarction, and revascularization.
The study was approved by the Local Ethical Committee and conformed to the Declaration of Helsinki on human research. Written informed consent was obtained from every patient after an explanation of the protocol, its aims, and potential risks.
Serum Cardiac Biomarkers
High-sensitivity serum cardiac troponin I was measured 3 times (in 24 h, 4 days, and 7 days after the admission). cTnI levels were determined by Immunoassay Systems Access (Beckman Coulter, Brea, CA, USA). The upper limit of the norm was conventionally taken from the 99th percentile from the upper reference level (cTnI laboratory reference cut-off for normalcy: <0.04 ng/ml).
Invasive Coronary Angiography
All patients underwent quantitative coronary arteriography on an Axiom Artis coronary angiography system (Siemens; Erlangen, Germany). Coronary angiography in all patients was performed using a 5F Judkins-type catheter through the femoral approach. All patients received oral aspirin, an intravenous bolus injection of 5,000 IU of heparin, and intracoronary isosorbide dinitrate (2 mg) before angiography. All coronary artery stenoses were quantitatively assessed using dedicated software by two experienced readers (AEB and SIV). Coronary artery stenosis ≥50% in major epicardial coronary arteries and in the left main coronary artery was considered significant. The degree of perfusion was evaluated according to thrombolysis in myocardial infarction (TIMI) criteria (16).
Myocardial Perfusion Scintigraphy
Patient Preparation
Patients were instructed to refrain from caffeine and methylxanthine-containing substances and to avoid nitrates, calcium channel blockers, and beta-blockers for at least 24 h before the scan. All scans were performed after overnight fasting.
MPS Acquisition Protocol
Each patient underwent rest-stress CZT SPECT (Discovery NM/CT 570c; GE Healthcare, Haifa, Israel) imaging according to a single-day protocol (mean 8 ± 2 days from ICA). All patients were imaged in the supine position with arms placed over their heads. Before the first dynamic acquisition, a low-dose CT scan (tube voltage 120 kV, tube current 20 mA, rotation time 0.8 s, helical pitch 0.969:1, slice thickness 5 mm, and interstice interval of 5 mm) was performed for heart positioning and for attenuation correction (AC).
Three MBq/kg of 99mTc-Sestamibi were injected at rest using a syringe pump intravenously as a 5 ml bolus (injection rate 1 ml/sec) followed by saline flush (20 ml with the rate 2 ml/s, using an automatic injector Ulrich Missouri XD 2001 Ulrich GmbH & Co. KG, Ulm Germany). List mode ECG-gated dynamic data acquisition started 10 s prior to the radiopharmaceutical bolus injection and acquired for 610 s. After 40 min from rest tracer injection, a 7 min long standard ECG-gated (16 framed per cardiac cycle) rest acquisition was performed using a dedicated patient positioning application in order to obtain the same coordinates of the heart as in the previous scan. The stress study was performed immediately after.
After 2 min of intravenous infusion of adenosine (160 mcg/kg/min), the second dose of 99mTc Sestamibi (9 MBq/kg) was injected, and list mode dynamic data acquisition of 610 s was started 10 s prior to the radiotracer injection. The infusion of adenosine continued for additional 2 min (17). After that, as for the rest scan, patients were removed from the gamma-camera and a stress standard ECG-gated scan was acquired after 45 min from the tracer injection.
Conventional CZT Data Reconstruction
Low dose CT scans were transferred to the Xeleris workstation to obtain AC maps. The alignment of perfusion and CT data was done with visual control. CZT images were reconstructed on the dedicated workstation (Xeleris 4.0; GE Healthcare, Haifa, Israel) using maximum-penalized-likelihood iterative reconstruction (60 iterations; Green OSL Alpha 0.7; Green OSL Beta 0.3) to acquire perfusion images in standard cardiac axes (short axis, vertical long axis, and horizontal long axis). The software Myovation for Alcyone (GE Healthcare, Haifa, Israel) was used for image reconstruction, and the Butterworth post-processing filter (frequency 0.37; order 7) was applied to the reconstructed slices. The reconstruction was performed in a 70 × 70 pixels matrix with 50 slices.
Raw MPS-CZT data at stress and at rest were visually analyzed for motion and attenuation artifacts. Stress/rest images were analyzed with a commercially available software package Corridor 4DM (University of Michigan, Ann Arbor, MI, USA) on AC images.
Each of 17 segments was scored based on semiquantitative 5-point scoring system (from 0 = normal uptake to 4 = absent radiotracer distribution) (18). Accordingly, the sum of the stress scores of all segments (SSS) and the sum of the rest scores of all segments (SRS) was quantified. A summed difference score (SDS) was calculated as the difference between SSS and SRS. Image processing was performed at the Core Facility “Medical Genomics” (Tomsk National Research Medical Center, Tomsk, Russia).
Analysis of Gated Images
LV functional analysis was performed from 16-frames reformatted images using commercially available software (Corridor4DM, Invia, Ann Arbor, MI).
Dynamic CZT Data Analysis
Dynamic CZT imaging was processed as previously published (19). In brief, the acquired data were initially reconstructed (in 70 × 70 pixels matrix; 50 slices) and re-binned into 20 frames: 12 frames of 10 s each and 8 frames of 30 s each. The reframed and corrected (for stress dataset) dynamic images were reconstructed using penalized maximum likelihood expectation maximization iterative algorithm. Finally, the reconstructed dynamic images, as well as CT AC maps, were processed by 4DM Reserve (2015 version) application. The time–activity curves (TAC) for the input function and whole LV myocardium as well as for the left anterior descending coronary artery (LAD), left circumflex coronary artery (LCx) and right coronary artery (RCA) vessel territories were generated semi-automatically. The region of interest (ROI) for input function was located on the valve plane and included parts of the LV cavity and left atrium. Manual motion correction of the dynamic dataset was performed in accordance with manufacturer's recommendation (20). The myocardial tracer uptake was estimated using a 1 tissue compartment model (1TCM) (21). To convert the tracer uptake rate to MBF values the Renkin–Crone flow model was used with the following parameters: α = 0.879, β = 0.337 for AC and α = 0.814, β = 0.065 for non-attenuation corrected (NAC) images (20–23). The value of MFR was calculated as the MBF ratio (MBF stress/MBF rest). Additionally, the absolute difference between stress MBF and rest MBF as flow difference (FD) was calculated (24, 25). The calculation of quantitative parameters was performed on both AC and NAC images.
Cardiac Magnetic Resonance Acquisition and Image Analysis
Patients underwent CMR imaging 7 ± 2 days after admission, using a 1.5-Tesla clinical magnetic resonance scanner (Vantage Titan, Toshiba, Japan). Images were acquired during multiple breath-holds with a cardiac software package. ECG-gated cine images were obtained for functional analysis using a steady-state free precession sequence (slice thickness 8 mm, slice gap 2 mm, average repetition time (TR) and echo time (TE) 3.7/1.9 ms, respectively, flip angle 72°, FOV 360 × 360 mm, matrix 240 × 128, typically 12 phases per cardiac cycle), in the following orientations: two-chamber long axis, four-chamber long axis, and a short axis stack covering LV from the base to apex (typically 10 slices).
Prior to contrast administration, breath-hold T2-weighted spin-echo images were acquired to visualize infarct-related edema and intramyocardial hemorrhage (IMH) in short-axis orientation covering the whole LV. Typical parameters were TR = 1,774 ms; TE 80 ms.
Late gadolinium enhancement imaging was performed using an inversion recovery gradient echo sequence 8–15 min after administration of 0.15–0.2 mmol/kg gadolinium-based contrast agent Gadobutrol (Gadovist, Bayer Healthcare, Germany) in short-axis orientation covering the whole LV. Typical parameters were the following: slice thickness 7–10 mm; TR 9.1 mm; TE 3.6 ms; flip angle 17°; and TI 240–360 ms nulled to normal myocardium.
Myocardial edema (ME) was defined as an area with a high signal (hyperintensive) and was manually delineated and quantified. IMH was defined as an area with a low (attenuated) signal within the edematous myocardium and was manually delineated and quantified.
Infarct size, MVO, and myocardial edema were expressed as % of LV mass. Infarct size was quantified in a contrast-enhanced T1-WI,10 min post contrast administration using automatic algorithm EWA (Expectation Maximization, weighted intensity, a priori information) (26) as hyper enhanced areas whereas MVO was identified as a region of hypoenhancement within the region of the hyperenhanced infarct. Myocardial edema was quantitatively assessed on T2-weighted images. All image analysis was done using the freely available software Segment version 2.2 R6589 (27).
Statistical Analysis
Data were assessed for normal distribution using the Shapiro–Wilk test. Continuous variables were expressed as mean ± standard deviation (SD) or as median with interquartile range (IQR, Q25–Q75). Differences between independent groups were determined by the Mann–Whitney U test. Spearman test was used to estimate the correlation coefficient between quantitative variables. Categorical variables were compared using Fisher's exact test. Survival analysis was performed using the Kaplan–Meier method. p < 0.05 was considered statistically significant. Statistical analyses were performed using STATISTICA 10.0 (StatSoft Inc, Tusla, OK, USA) and MedCalc version 18.9.1 (MedCalc Software, Mariakerke, Belgium).
Results
Patients
The flow chart of the study is presented in Figure 1. A total of 31 patients were enrolled in the study. Detailed clinical characteristics of the study group are presented in Table 1. Based on ICA data 10 (32%) patients with AMI had non-obstructive coronary artery and 21 (68) obstructive coronary artery lesions. Most of the patients had hypertension and dyslipidemia. The length of hospital stay was 11 ± 2 days and was similar between MINOCA and MICAD. In 1 year follow-up 2(9.5%) of patients with MICAD had MI, no MACE was observed in MINOCA (Supplementary Figure S1).
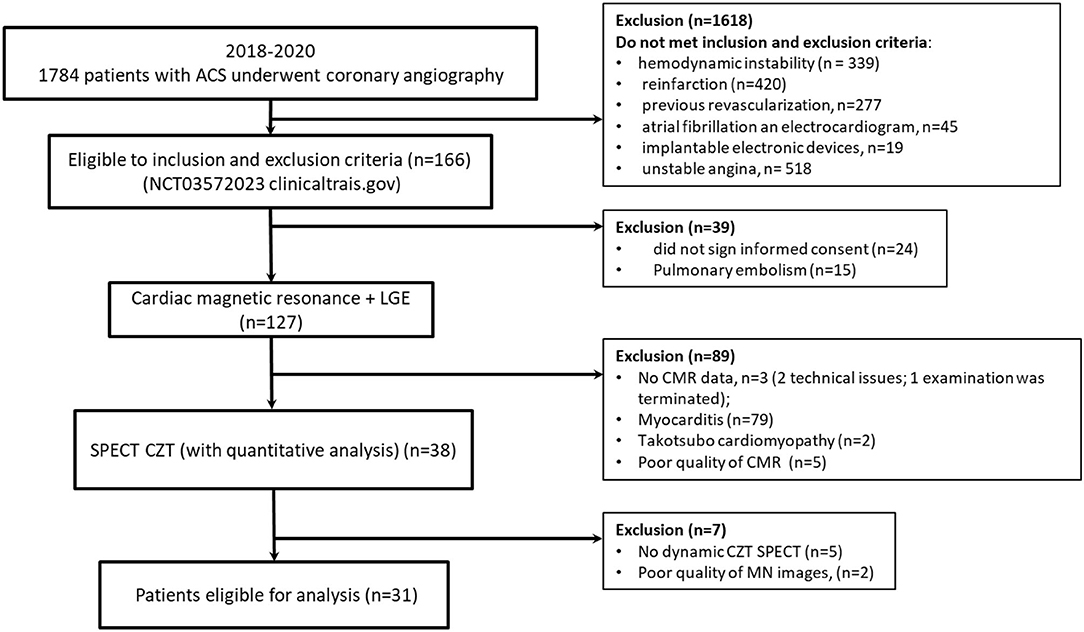
Figure 1. Flow diagram showing the patients included in the study. MINOCA, Myocardial infarction with non-obstructive coronary arteries; MICAD, Myocardial infarction with obstructive coronary artery disease; ACS, acute coronary syndrome.
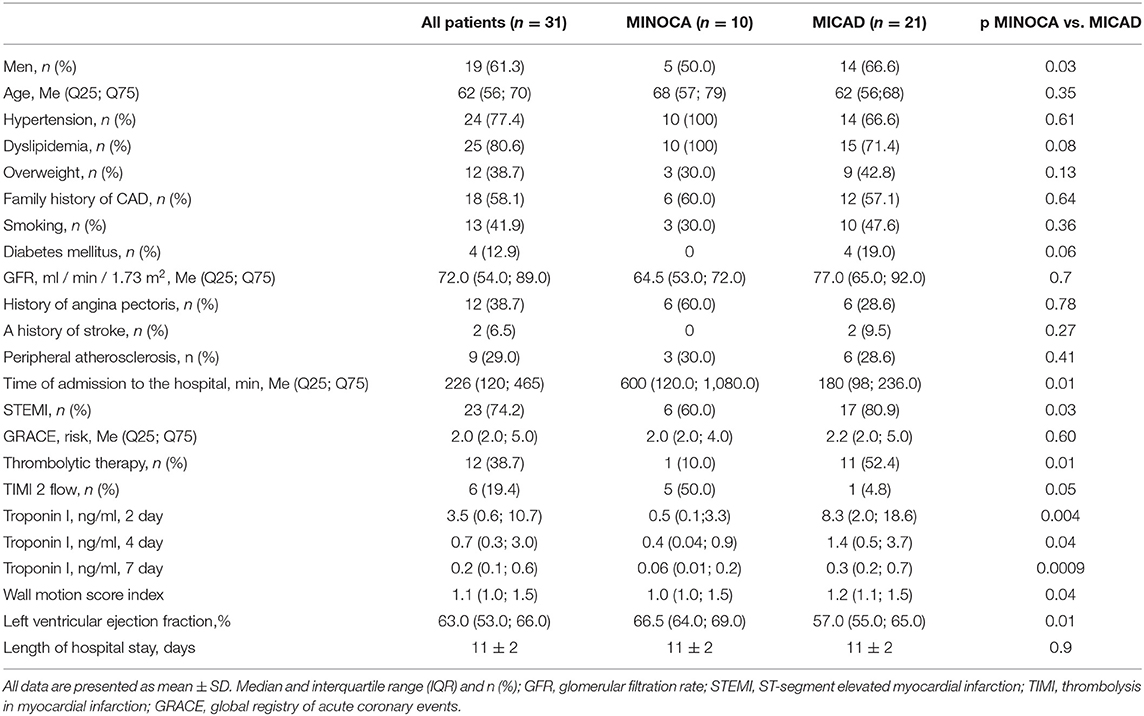
Table 1. The clinical characteristics of patients.
ICA Results
All patients underwent ICA within 1 day after admission to the emergency department. Mean time of ICA from the onset of symptoms was 315 ± 167 min. Per-patient analysis showed one-vessel disease in 14 (45%) patients, two vessel and three vessel disease in six (19%) and one (3%) patients, respectively. 13 (43%) patients had ≥50% stenosis in LAD, 4(13%) in LCx and 11(35%) in RCA. At per-vessel analysis, a total of 93 vessels were analyzed. Obstructive lesion was detected in 29 (31%) vessels −14(15%) in LAD, LCX in 4(4%) and 11(12%) in RCA. There were no obstructive lesions in the LMA. Infarct-related artery was LAD, LXC, and RAC in 12, 1, and 8 cases, respectively.
TIMI flow grade of 3 was observed in all patients with MINOCA and they were not stented. A total of 16/21 (76%) patients with MICAD underwent PCI with drug-eluting stenting of infarct-related arteries (IRA); in 3/16 cases, two stents were installed. In 13 IRA, TIMI flow grade before and after stenting was 3; in 5–0 and 3; in 1–0 and 2, respectively.
In four cases, a distal lesion of the IRA was detected (TIMI 0). After mechanical recanalization and balloon angioplasty, there was no blood flow in the distal segment of IRA (TIMI 0); PCI was not performed. In one case, non-occlusive thrombosis of the anterior descending artery was detected (TIMI2). Thromboaspiration was performed with the appointment glycoprotein IIb/IIIa receptor inhibitors (Eptifibatide). According to optical coherence tomography, performed the next day a hemodynamically insignificant plaque of 25% (TIMI 3) with areas of erosion was found, and a non-invasive management strategy was chosen.
Cardiac Magnetic Resonance Results
Based on all patient's sample analyses, late gadolinium enhancement, MVO, and myocardial edema were observed in 28 (90%), 11 (35%), and 24 (77%) patients, respectively. Interestingly, there were no MVO in patients with MINOCA. Quantitative values of infarct size, MVO, and myocardial edema are presented in Table 2. In patients with MICAD, the values of infarct size, MVO, and myocardial edema were significantly (<0.05) higher as compared to those in MINOCA. The combination of myocardial edema and late gadolinium enhancement was considered AMI (28, 29). A total of 93 vessel territories were analyzed. There were 39 (42%) vessel territories considered as having acute myocardial injury [5 (5%) in MINOCA and 34 (37%) in MICAD] and 54 (58%) with no myocardial injury [25 (27%) in MINOCA and 29 (31%) in MICAD]. The number of vessel territories with acute myocardial injury in MICAD subjects was significantly higher as compared to MINOCA (34 vs. 5, p = 0.005) (Supplementary Figure S2). Additional data describing the regional CMR analysis results is provided in the supplementary material (Supplementary Figure S3). Representative cases of patients MINOCA and MICAD are presented in Figures 2, 3.
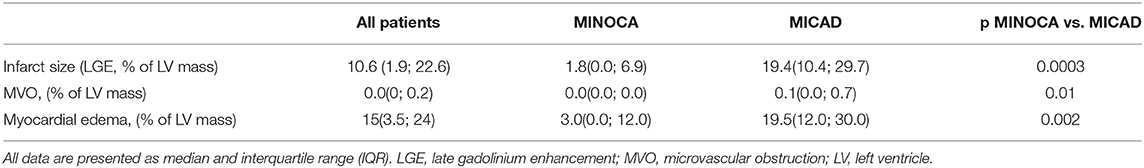
Table 2. CMR result.
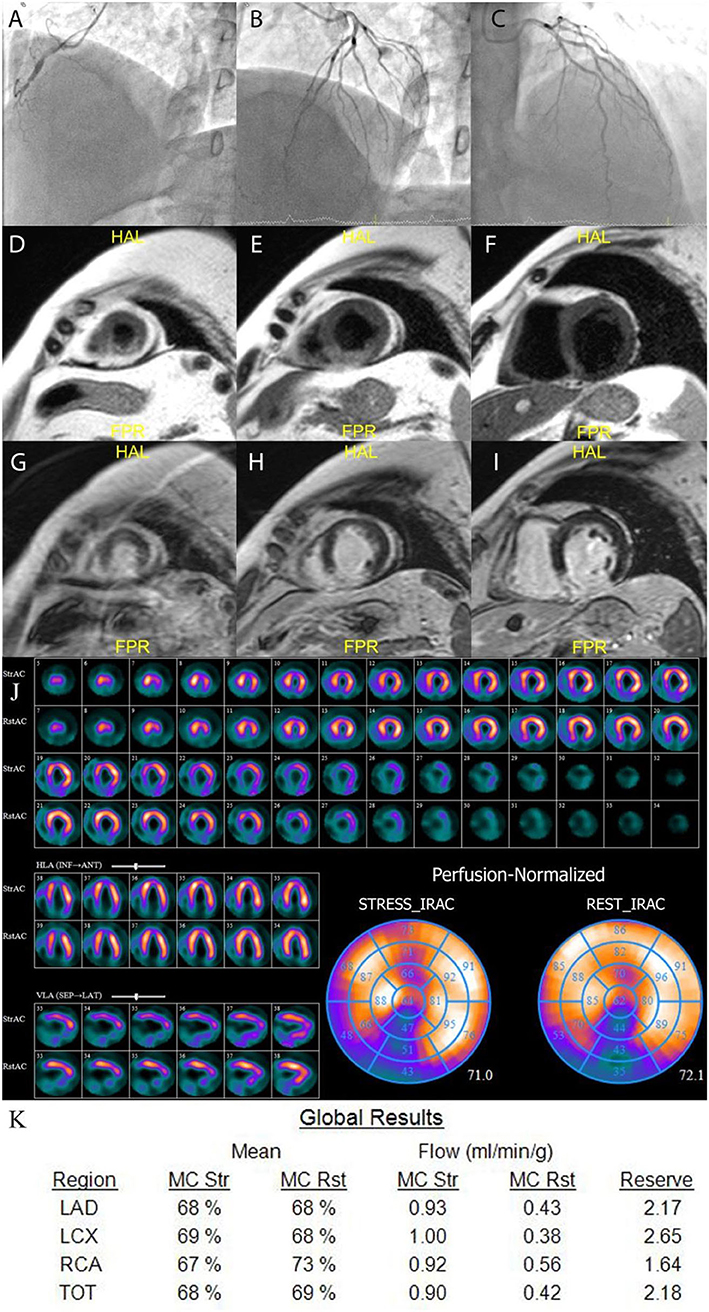
Figure 2. Example of MICAD patient. A 55 years old male with RCA occlusion (A) and no CAD in LAD and LCx (B,C). CMR results: T2-weighted images (D–F) show transmural edema in the posterior and posterior-septal segments; late gadolinium enhancement images (G–I) show high signal intensity in the same regions indicating necrosis in the posterior and posterior-septal segments. The qualitative MPS (J) shows severe fixed perfusion defect in posterior wall and small reversible defect in mid and basal anterior wall. The quantitative CZT SPECT results (K) show abnormal MFR in RCA territory. LAD, left anterior descending artery; LCx, left circumflex artery; RCA, right coronary artery; TOT, total value; MC, motion correction; mL/min/g, milliliters per minute per gram; Rst, rest; Str, stress.
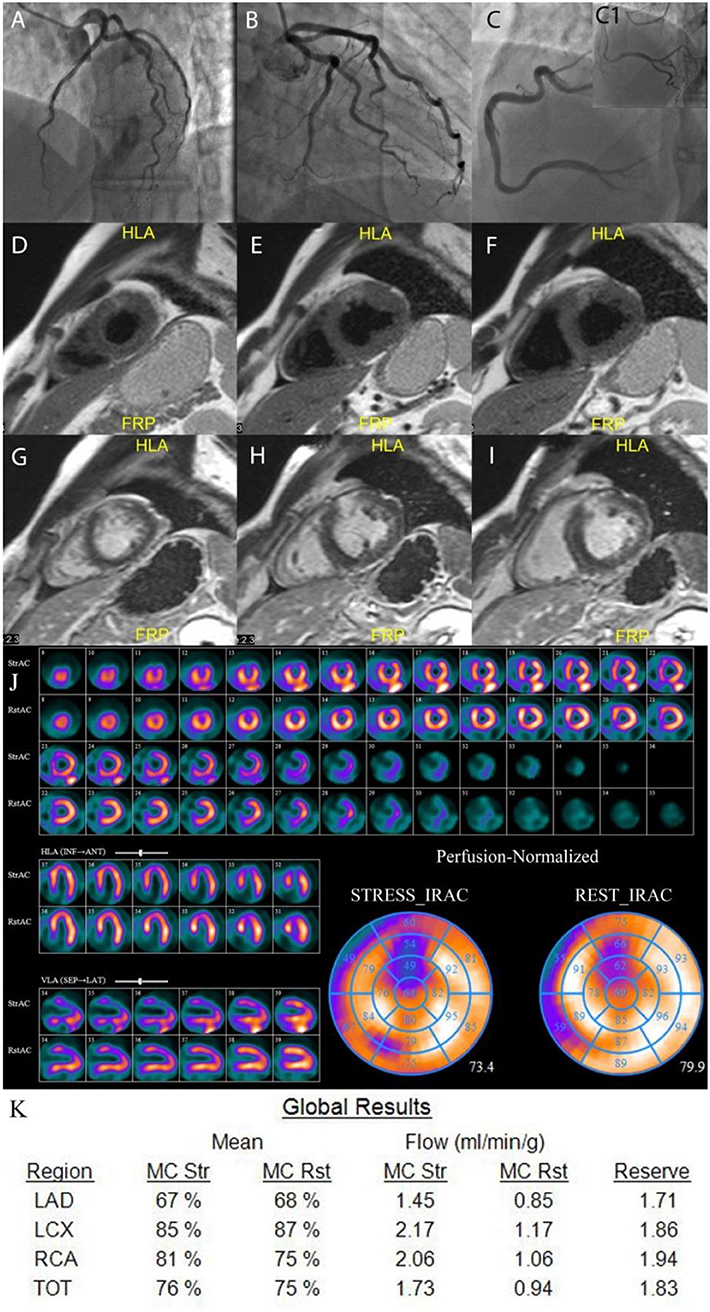
Figure 3. Example of MINOCA patient. A 46 years old male with no obstructive coronary arteries (A–C1). CMR results: T2-weighted images (D–F) show transmural edema in the anterior segments; late gadolinium enhancement images (G–I) show high signal intensity in the same regions indicating necrosis in the anterior segments. The qualitative MPS (J) shows severe moderate to severe partially reversible perfusion defect in the anterior wall. The quantitative CZT SPECT results (K) show abnormal stress MBF and MFR in LAD vessel territory. LAD, left anterior descending artery; LCx, left circumflex artery; RCA, right coronary artery; TOT, total value; MC, motion correction; mL/min/g, milliliters per minute per gram; Rst, rest; Str, stress.
MPS Results
In a mean of 8 ± 2 (min 4; max 13) days after admission a total of 20 patients underwent 2-days rest-stress dynamic SPECT protocol and 11 patients had a rest-stress single-day protocol. The results of MPS are presented in Table 3. A total of 25(81%) patients had abnormal (SSS>3) myocardial perfusion−7 (70%) in MINOCA and 21(100%) in MICAD. Patients with MICAD showed high values of SSS and SRS (p <0.01) and lower values of global sMBF, MFR, and FD when compared to the MINOCA group. Moreover, the values of stress EF and PER were significantly (p < 0.05) lower in MICAD vs. the MICAD subgroup.
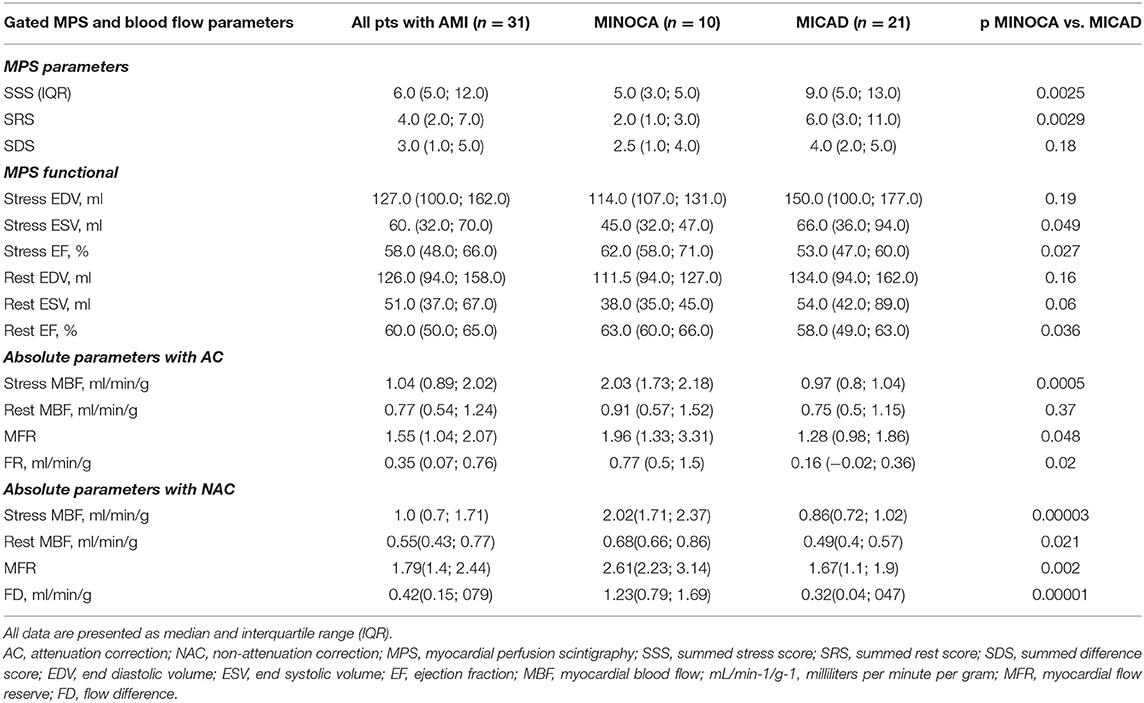
Table 3. Myocardial perfusion scintigraphy results.
Among 3 (10%) patients with normal myocardial perfusion 1 (3%) had abnormal CMR. The correlations between CZT-derived global quantitative flow values with infarct size, MVO, and myocardial edema derived by CMR are presented in Table 4. Significant (p < 0.05) correlation between infarct size and stress MBF was revealed. Moreover, NAC rest MBF demonstrated a significant correlation with IS, MVO, and ME. The weakest correlation was observed between CZT SPECT-derived absolute flow indexes and the extent of microvascular obstruction.
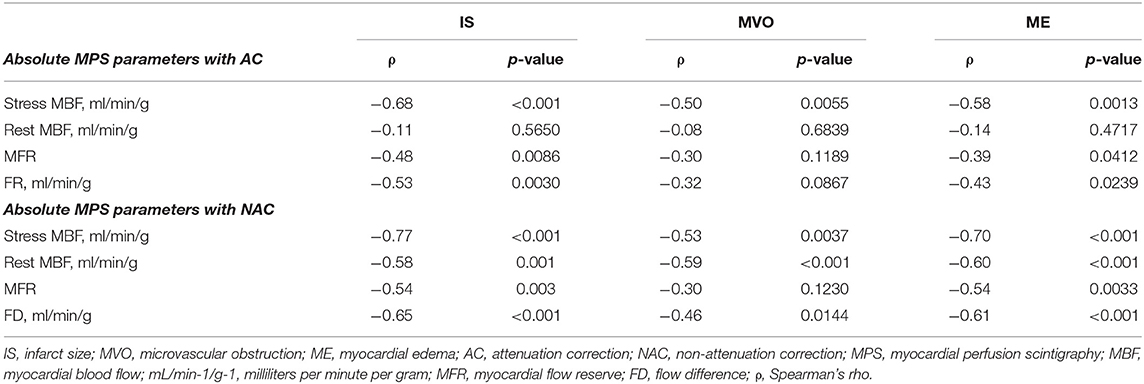
Table 4. The Spearman correlations between CMR and absolute MPS parameters.
Relationship Between Cardiac Serum Troponin and MPS Results
According to the whole same analysis cTnI at 24 h correlated significantly (p < 0.05) with stress MBF and FD (both with AC and NAC). cTnI on day 4 correlated significantly with MFR_AC and FD_AC. cTnI level at 7 day showed a negative correlation (p < 0.01) with stress MBF_NAC and FD_NAC. Detailed correlations analyses of cardiac serum troponin with quantitative and visual MPS parameters are provided in Supplementary Tables S1–S3, Supplementary Figure S4 shows scatter plots and correlations between serial cTnI levels and MBF. Subgroup analysis showed a significant correlation only between cTnI level at 4 day and SRS (p = 0.03), cTnI level at 7 day, and SSS (p = 0.005) in patients with MINOCA. No significant correlation was found between cTnI and MPS values in the MICAD subgroup.
MPS Regional Analysis
Regional analysis of CZT SPECT data was based on CMR findings. The mean interval between CMR and MPS was 3 days (min 0; max 5). Vessel territories with a CMR pattern of acute myocardial injury (LGE plus ME) were considered as CMR positive and ones with no such signs–as CMR negative. The result of the regional analysis for the whole sample is provided in Table 5. sMBF, MFR and FD were significantly (<0.01) lower in vessel territories considered CMR positive compared to those without myocardial injury. Subgroup analysis showed that only in MINOCA subjects, sMBF_AC, MFR_AC, and FD_AC were significantly (<0.05) lower in CMR positive vessel territories, as compared to CMR negative ones. Detailed data is provided in Supplementary Table S4.

Table 5. CMR based regional analysis of SPECT CZT data.
Discussion
This study showed that in patients with AMI the values of both visual and quantitative MPS indexes correlate significantly with the level of high-sensitivity serum cardiac troponin I and CMR findings. In particular, the values of regional sMBF, MFR, and FD are significantly decreased in LV territories characterized by myocardial injury. Finally, the values of quantitative MPS are lower in MICAD compared to patients with MINOCA.
These results indicated that in patients with acute myocardial infarction, the impairment of flow and reserve, assessed by SPECT CZT, is correlated with extension and severity of myocardial edema and infarct size.
Myocardial Blood Flow in Acute Coronary Syndrome
In line with the previous study by Stewart et al. where the comparison in rest and stress MBF (by PET with 13N-ammonia) were performed on the day 9 after PCI in infarct-related and reference artery (5), we found out significantly reduced MBF, MFR and FD (both AC and NAC) in LV territories with myocardial injury. The disturbances of myocardial microcirculation due to myocardial edema and injury may be considered as a reason for quite low values of global MBF both on stress and rest. In a previous study enrolled patients with ST-elevation myocardial infarction (STEMI), Pan et al. showed significantly lower rest MBF in infarcted territories compared to those of reference territories (30.5 ± 7.4 vs. 73.4 ± 8.1 ml/min/100 ml, p < 0.001) (30). Moreover, a moderate correlation between peak high-sensitivity troponin T and rest MBF was revealed by the authors. In our study, even though the majority of patients had STEMI, the rest of MBF neither correlates with cTnI nor differs in injured and non-injured myocardial regions. Moreover, the values of rest MBF in regions both with and without myocardial injury were higher compared to the study of Pan et al. (30).
SPECT CZT Studies of MBF and MFR in Patients With Stable CAD
Although previous studies showed that SPECT MPS may provide diagnostic and prognostic information regarding cardiac events in high-risk patients (31), particularly in those with AMI, (32–34), this study elucidates the value of quantitative SPECT CZT in MINOCA and MICAD individuals. CZT SPECT derived MBF and MFR are currently well-validated against PET (8, 9, 11, 20), invasive angiography (19, 35–37) and invasive FFR (8, 38–40).
Previous CZT studies demonstrated the feasibility of CZT SPECT to detect differences in MBF and MFR between patients with and without stable CAD (11) and reduction of MBF and MFR according to the number of vessels with stenosis. It was shown that high-risk patients with stable CAD have reduced values of stress MBF and MFR (12, 19, 38). However, there is a paucity of data regarding the diagnostic value of CZT SPECT in patients with the acute coronary syndrome. Han et al. (41) reported significantly lower values of MFR in patients with a history of myocardial infarction (1.56 ± 0.26) in comparison to those without (2.71 ± 1.02). However, the use of different tracers (201Tl in the study of Han vs. 99mTc in the others) and their different extraction fractions make these results difficult to compare.
To our knowledge, for the first time, we assessed the value of CZT in ACS patients and compared it to CMR findings. We found significantly reduced MBF and MFR in LV regions with myocardial injury, as detected by CMR. Our findings imply that the use of CZT SPECT can detect not only regional microcirculation abnormalities related to acute coronary syndrome (42, 43) but also characterized the severity of the injury, as indicated by the moderate negative correlation between MPS flow indexes and CMR variables.
Moreover, this study provides new insight into MBF and MFR in patients with AMI with and without obstructive coronary arteries. In fact, we found out that both visual and quantitative parameters of myocardial perfusion in the MINOCA subgroup were in the normal range or impaired mildly.
The prognosis in MINOCA compared to MICAD remains controversial. Although earlier studies suggested a better prognosis of MINOCA as compared to MI with obstructive coronary artery disease (44, 45) more recent studies showed no differences in prognosis among MINOCA and patients with MICAD (46–48). In this study, two patients with MICAD suffered myocardial infarction during the follow-up period.
When MINOCA was compared to stable CAD patients with no obstructive arteries, it was revealed worse 1 year prognosis in terms of mortality, myocardial infarction, and revascularization in MINOCA (49). In our study, MINOCA patients showed abnormal myocardial perfusion, despite smaller than the one of MICAD group, that may be associated with worse prognosis (50, 51). The usefulness of quantitative SPECT in patient with ACS, whether with or without obstructive CAD, may indicate the myocardium at risk as well as residual ischemia in infarct-related artery territory, which may have prognostic value and determine of treatment strategy (52).
Limitation
Few patients limits the statistical power of this study, as well as the one-center enrolment and observation design. Nevertheless, we found statistically significant differences in regional values of SPECT CZT-derived quantitative flow measures between LV territories with and with no myocardial injury as well as the correlation with cTnI. The measurement of MBF and MFR as well as CMR were performed 7–8 days past PCI. In the MICAD group we performed MPS and MRI after stenting, which may affect the results of a visual and quantitative assessment of myocardial perfusion, flow, and injury. On the other hand, the time interval between MPS, MRI, and cTnI (on day 7) did not exceed 1 day, so the association between findings was not affected by the different times of image acquisition.
Conclusion
The results of this study demonstrated the feasibility of CZT SPECT to assess global and regional abnormalities of MBF and MFR in AMI subjects. On the global level, SPECT CZT-derived flow measures were associated with high sensitivity troponin I as well as the extent of edema, MVO, and infarct size detected by CMR. On the regional level, quantitative SPECT CZT measures were significantly lower in vessel territories with myocardial injury. Since MINOCA patients are characterized by mild reduction of myocardial blood flow and perfusion assessed visually and quantitatively, it implies that this group of patients has a more pronounced risk of cardiac events and needs more aggressive observation and treatment, despite the absence of obstructive coronary artery lesion and TIMI grade 3 flow. It requires further large-scale studies to test the prognostic significance of SPECT-derived MBF and MFR in patients with the acute coronary syndrome.
Data Availability Statement
The raw data supporting the conclusions of this article will be made available by the authors, without undue reservation.
Ethics Statement
The studies involving human participants were reviewed and approved by Committee on Biomedical Ethics of the Cardiology Research Institute, Tomsk National Research Medical Center, Russian Academy of Sciences. The patients/participants provided their written informed consent to participate in this study.
Author Contributions
KZ and AG: conception of the design, drafting of the manuscript, data analysis, and final approval. DV: clinical data analysis and revising the manuscript. OM: CMR data analysis and revising the manuscript. AVM, ANM, and MG: nuclear data processing, analysis, and revising the manuscript. AB: invasive coronary angiography data analysis and revising the manuscript. VR: conception of the idea, revising the manuscript, and final approval. All authors contributed to the article and approved the submitted version.
Conflict of Interest
The authors declare that the research was conducted in the absence of any commercial or financial relationships that could be construed as a potential conflict of interest.
Publisher's Note
All claims expressed in this article are solely those of the authors and do not necessarily represent those of their affiliated organizations, or those of the publisher, the editors and the reviewers. Any product that may be evaluated in this article, or claim that may be made by its manufacturer, is not guaranteed or endorsed by the publisher.
Acknowledgments
We thank Dr. Stanislav I. Vintizenko, MD, Ph.D. who assisted performing and analyzing ICA data.
Supplementary Material
The Supplementary Material for this article can be found online at: https://www.frontiersin.org/articles/10.3389/fnume.2022.935539/full#supplementary-material
References
1. Leucker TM, Valenta I, Schindler TH. Positron emission tomography-determined hyperemic flow, myocardial flow reserve, and flow gradient-quo vadis? Front Cardiovasc Med. (2017) 4:46. doi: 10.3389/fcvm.2017.00046
2. Danad I, Szymonifka J, Twisk JWR, Norgaard BL, Zarins CK, Knaapen P, Min JK. Diagnostic performance of cardiac imaging methods to diagnose ischaemia-causing coronary artery disease when directly compared with fractional flow reserve as a reference standard: a meta-analysis. Eur Heart J. (2017) 38:991–8. doi: 10.1093/eurheartj/ehw095
3. Knuuti J, Ballo H, Juarez-Orozco LE, Saraste A, Kolh P, Rutjes AWS, et al. The performance of non-invasive tests to rule-in and rule-out significant coronary artery stenosis in patients with stable angina: a meta-analysis focused on post-test disease probability. Eur Heart J. (2018) 39:3322–30. doi: 10.1093/eurheartj/ehy267
4. Schindler TH, Cardenas J, Prior JO, Facta AD, Kreissl MC, Zhang XL, et al. Relationship between increasing body weight, insulin resistance, inflammation, adipocytokine leptin, and coronary circulatory function. J Am Coll Cardiol. (2006) 47:1188–95. doi: 10.1016/j.jacc.2005.10.062
5. Stewart RE, Miller DD, Bowers TR, McCullough PA, Ponto RA, Grines CL, et al. perfusion and vasodilator function after angioplasty for acute myocardial infarction. J Nucl Med. (1997) 38:770–7.
6. Fukuoka Y, Nakano A, Tama N, Hasegawa K, Ikeda H, Morishita T, et al. Impaired myocardial microcirculation in the flow-glucose metabolism mismatch regions in revascularized acute myocardial infarction. J Nucl Cardiol. (2017) 24:1641–50. doi: 10.1007/s12350-016-0526-z
7. Driessen RS, Raijmakers PG, Stuijfzand WJ, Knaapen P. Myocardial perfusion imaging with PET. Int J Cardiovasc Imaging. (2017) 33:1021–31. doi: 10.1007/s10554-017-1084-4
8. Agostini D, Roule V, Nganoa C, Roth N, Baavour R, Parienti JJ, et al. First validation of myocardial flow reserve assessed by dynamic 99mTc-sestamibi CZT-SPECT camera: head to head comparison with 15O-water PET and fractional flow reserve in patients with suspected coronary artery disease. The WATERDAY study. Eur J Nucl Med Mol Imaging. (2018) 45:1079–90. doi: 10.1007/s00259-018-3958-7
9. Giubbini R, Bertoli M, Durmo R, Bonacina M, Peli A, Faggiano I, et al. Comparison between N 13 NH 3-PET and 99m Tc-Tetrofosmin-CZT SPECT in the evaluation of absolute myocardial blood flow and flow reserve. J Nucl Cardiol. (2021) 28:1906–18. doi: 10.1007/s12350-019-01939-x
10. Nkoulou R, Fuchs TA, Pazhenkottil AP, Kuest SM, Ghadri JR, Stehli J, et al. Absolute myocardial blood flow and flow reserve assessed by gated SPECT with cadmium-zinc-telluride detectors using 99mTc-tetrofosmin: head-to-head comparison with 13N-ammonia PET. J Nucl Med. (2016) 57:1887–92. doi: 10.2967/jnumed.115.165498
11. Acampa W, Zampella E, Assante R, Genova A, De Simini G, Mannarino T, et al. Quantification of myocardial perfusion reserve by CZT-SPECT: a head to head comparison with 82Rubidium PET imaging. J Nucl Cardiol. (2021) 28:2827–39. doi: 10.1007/s12350-020-02129-w
12. Ben Bouallègue F, Roubille F, Lattuca B, Cung TT, Macia JC, Gervasoni R, et al. SPECT myocardial perfusion reserve in patients with multivessel coronary disease: correlation with angiographic findings and invasive fractional flow reserve measurements. J Nucl Med. (2015) 56:1712–7. doi: 10.2967/jnumed.114.143164
13. Ben-Haim S, Murthy VL, Breault C, Allie R, Sitek A, Roth N, et al. Quantification of myocardial perfusion reserve using dynamic SPECT imaging in humans: a feasibility study. J Nucl Med. (2013) 54:873–9. doi: 10.2967/jnumed.112.109652
14. Liga R, Neglia D, Kusch A, Favilli B, Giorgetti A, Gimelli A. Prognostic role of dynamic CZT imaging in CAD patients: interaction between absolute flow and CAD burden. JACC Cardiovasc Imaging. (2021) 15:540–2. doi: 10.1016/j.jcmg.2021.09.030
15. Fang YD, Liu YC, Ho KC, Kuo FC, Yang CF, Yen TC, et al. Single-scan rest/stress imaging with 99mTc-Sestamibi and cadmium zinc telluride-based SPECT for hyperemic flow quantification: a feasibility study evaluated with cardiac magnetic resonance imaging. PLoS ONE. (2017) 12:e0183402. doi: 10.1371/journal.pone.0183402
16. Effects of tissue plasminogen activator and a comparison of early invasive and conservative strategies in unstable angina and non-Q-wave myocardial infarction. Results of the TIMI IIIB Trial. Thrombolysis in myocardial ischemia. Circulation. (1994) 89:1545–56. doi: 10.1161/01.CIR.89.4.1545
17. Henzlova MJ, Duvall WL, Einstein AJ, Travin MI, Verberne HJ. ASNC imaging guidelines for SPECT nuclear cardiology procedures: Stress, protocols, and tracers. J Nucl Cardiol. (2016) 23:606–39. doi: 10.1007/s12350-015-0387-x
18. Cerqueira MD, Weissman NJ, Dilsizian V, Jacobs AK, Kaul S, Laskey WK, et al. Standardized myocardial segmentation and nomenclature for tomographic imaging of the heart. A statement for healthcare professionals from the cardiac imaging committee of the council on clinical cardiology of the American heart association. Circulation. (2002) 105:539–42. doi: 10.1161/hc0402.102975
19. Zavadovsky KV, Mochula AV, Maltseva AN, Boshchenko AA, Baev AE, Andreev SL, et al. The diagnostic value of SPECT CZT quantitative myocardial blood flow in high-risk patients. J Nucl Cardiol. (2022) 29:1051–63. doi: 10.1007/s12350-020-02395-8
20. Wells RG, Marvin B, Poirier M, Renaud J, deKemp RA, Ruddy TD. Optimization of SPECT measurement of myocardial blood flow with corrections for attenuation, motion, and blood binding compared with PET. J Nucl Med. (2017) 58:2013–9. doi: 10.2967/jnumed.117.191049
21. Leppo JA, Meerdink DJ. Comparison of the myocardial uptake of a technetium-labeled isonitrile analogue and thallium. Circ Res. (1989) 65:632–9. doi: 10.1161/01.RES.65.3.632
22. Lortie M, Beanlands RS, Yoshinaga K, Klein R, Dasilva JN, DeKemp RA. Quantification of myocardial blood flow with 82Rb dynamic PET imaging. Eur J Nucl Med Mol Imaging. (2007) 34:1765–74. doi: 10.1007/s00259-007-0478-2
23. Moody JB, Murthy VL, Lee BC, Corbett JR, Ficaro EP. Variance estimation for myocardial blood flow by dynamic PET. IEEE Trans Med Imaging. (2015) 34:2343–53. doi: 10.1109/TMI.2015.2432678
24. Camici PG, Rimoldi OE. The clinical value of myocardial blood flow measurement. J Nucl Med. (2009) 50:1076–87. doi: 10.2967/jnumed.108.054478
25. Ziadi MC. Myocardial flow reserve (MFR) with positron emission tomography (PET)/computed tomography (CT): clinical impact in diagnosis and prognosis. Cardiovasc Diagn Ther. (2017) 7:206–18. doi: 10.21037/cdt.2017.04.10
26. Engblom H, Tufvesson J, Jablonowski R, Carlsson M, Aletras AH, Hoffmann P, et al. A new automatic algorithm for quantification of myocardial infarction imaged by late gadolinium enhancement cardiovascular magnetic resonance: experimental validation and comparison to expert delineations in multi-center, multi-vendor patient data. J Cardiovasc Magn Reson. (2016) 18:27. doi: 10.1186/s12968-016-0242-5
27. Heiberg E, Sjögren J, Ugander M, Carlsson M, Engblom H, Arheden H. Design and validation of Segment–freely available software for cardiovascular image analysis. BMC Med Imaging. (2010) 10:1. doi: 10.1186/1471-2342-10-1
28. Lockie T, Nagel E, Redwood S, Plein S. Use of cardiovascular magnetic resonance imaging in acute coronary syndromes. Circulation. (2009) 119:1671–81. doi: 10.1161/CIRCULATIONAHA.108.816512
29. Demirkiran A, Everaars H, Amier RP, Beijnink C, Bom MJ, Götte MJW, et al. Cardiovascular magnetic resonance techniques for tissue characterization after acute myocardial injury. Eur Heart J Cardiovasc Imaging. (2019) 20:723–34. doi: 10.1093/ehjci/jez094
30. Pan J, Yuan M, Yu M, Gao Y, Shen C, Wang Y, et al. Myocardial blood flow quantified by low-dose dynamic ct myocardial perfusion imaging is associated with peak troponin level and impaired left ventricle function in patients with ST-elevated myocardial infarction. Korean J Radiol. (2019) 20:709–18. doi: 10.3348/kjr.2018.0729
31. El-Hajj S, AlJaroudi WA, Farag A, Bleich S, Manaoragada P, Iskandrian AE, et al. Effect of changes in perfusion defect size during serial regadenoson myocardial perfusion imaging on cardiovascular outcomes in high-risk patients. J Nucl Cardiol. (2016) 23:101–12. doi: 10.1007/s12350-015-0174-8
32. Berti V, Sciagrà R, Acampa W, Ricci F, Cerisano G, Gallicchio R, et al. Relationship between infarct size and severity measured by gated SPECT and long-term left ventricular remodelling after acute myocardial infarction. Eur J Nucl Med Mol Imaging. (2011) 38:1124–31. doi: 10.1007/s00259-011-1739-7
33. Smit JM, Hermans MP, Dimitriu-Leen AC, van Rosendael AR, Dibbets-Schneider P, de Geus-Oei LF, et al. Long-term prognostic value of single-photon emission computed tomography myocardial perfusion imaging after primary PCI for STEMI. Eur Heart J Cardiovasc Imaging. (2018) 19:1287–93. doi: 10.1093/ehjci/jex332
34. Zampella E, Mannarino T, Gaudieri V, D'Antonio A, Giallauria F, Assante R, et al. Effect of changes in perfusion defect size during serial stress myocardial perfusion imaging on cardiovascular outcomes in patients treated with primary percutaneous coronary intervention after myocardial infarction. J Nucl Cardiol. (2021). doi: 10.1007/s12350-021-02770-z
35. de Souza ACDAH, Gonçalves BKD, Tedeschi AL, Lima RSL. Quantification of myocardial flow reserve using a gamma camera with solid-state cadmium-zinc-telluride detectors: Relation to angiographic coronary artery disease. J Nucl Cardiol. (2021) 28:876–84. doi: 10.1007/s12350-019-01775-z
36. Bailly M, Thibault F, Courtehoux M, Metrard G, Angoulvant D, Ribeiro MJ. Myocardial flow reserve measurement during CZT-SPECT perfusion imaging for coronary artery disease screening: correlation with clinical findings and invasive coronary angiography-the CFR-OR study. Front Med. (2021) 8:691893. doi: 10.3389/fmed.2021.691893
37. Wang J, Li S, Chen W, Chen Y, Pang Z, Li J. Diagnostic efficiency of quantification of myocardial blood flow and coronary flow reserve with CZT dynamic SPECT imaging for patients with suspected coronary artery disease: a comparative study with traditional semi-quantitative evaluation. Cardiovasc Diagn Ther. (2021) 11:56–67. doi: 10.21037/cdt-20-728
38. Miyagawa M, Nishiyama Y, Uetani T, Ogimoto A, Ikeda S, Ishimura H, et al. Estimation of myocardial flow reserve utilizing an ultrafast cardiac SPECT: comparison with coronary angiography, fractional flow reserve, and the SYNTAX score. Int J Cardiol. (2017) 244:347–53. doi: 10.1016/j.ijcard.2017.06.012
39. Zavadovsky KV, Mochula AV, Boshchenko AA, Vrublevsky AV, Baev AE, Krylov AL, et al. Absolute myocardial blood flows derived by dynamic CZT scan vs invasive fractional flow reserve: correlation and accuracy. J Nucl Cardiol. (2021) 28:249–59. doi: 10.1007/s12350-019-01678-z
40. Li C, Xu R, Yao K, Zhang J, Chen S, Pang L, et al. Functional significance of intermediate coronary stenosis in patients with single-vessel coronary artery disease: a comparison of dynamic SPECT coronary flow reserve with intracoronary pressure-derived fractional flow reserve (FFR). J Nucl Cardiol. (2022) 29:622–9. doi: 10.1007/s12350-020-02293-z
41. Han S, Kim YH, Ahn JM, Kang SJ, Oh JS, Shin E, et al. Feasibility of dynamic stress 201Tl/rest 99mTc-tetrofosmin single photon emission computed tomography for quantification of myocardial perfusion reserve in patients with stable coronary artery disease. Eur J Nucl Med Mol Imaging. (2018) 45:2173–80. doi: 10.1007/s00259-018-4057-5
42. Van Herck PL, Carlier SG, Claeys MJ, Haine SE, Gorissen P, Miljoen H, et al. Coronary microvascular dysfunction after myocardial infarction: increased coronary zero flow pressure both in the infarcted and in the remote myocardium is mainly related to left ventricular filling pressure. Heart. (2007) 93:1231–7. doi: 10.1136/hrt.2006.100818
43. Niccoli G, Scalone G, Lerman A, Crea F. Coronary microvascular obstruction in acute myocardial infarction. Eur Heart J. (2016) 37:1024–33. doi: 10.1093/eurheartj/ehv484
44. Smilowitz NR, Mahajan AM, Roe MT, Hellkamp AS, Chiswell K, Gulati M, et al. Mortality of myocardial infarction by sex, age, and obstructive coronary artery disease status in the ACTION registry-GWTG (acute coronary treatment and intervention outcomes network registry-get with the guidelines). Circ Cardiovasc Qual Outcomes. (2017) 10:e003443. doi: 10.1161/CIRCOUTCOMES.116.003443
45. Pasupathy S, Air T, Dreyer RP, Tavella R, Beltrame JF. Systematic review of patients presenting with suspected myocardial infarction and nonobstructive coronary arteries. Circulation. (2015) 131:861–70. doi: 10.1161/CIRCULATIONAHA.114.011201
46. Safdar B, Spatz ES, Dreyer RP, Beltrame JF, Lichtman JH, Spertus JA, et al. Presentation, clinical profile, and prognosis of young patients with myocardial infarction with nonobstructive coronary arteries (MINOCA): results from the VIRGO study. J Am Heart Assoc. (2018) 7:e009174. doi: 10.1161/JAHA.118.009174
47. Choo EH, Chang K, Lee KY, Lee D, Kim JG, Ahn Y, et al. Prognosis and predictors of mortality in patients suffering myocardial infarction with non-obstructive coronary arteries. J Am Heart Assoc. (2019) 8:e011990. doi: 10.1161/JAHA.119.011990
48. Lopez-Pais J, Izquierdo Coronel B, Galán Gil D, Espinosa Pascual MJ, Alcón Durán B, Martinez Peredo CG, et al. Clinical characteristics and prognosis of myocardial infarction with non-obstructive coronary arteries (MINOCA): a prospective single-center study. Cardiol J. (2020). doi: 10.5603/CJ.a2020.0146. [Epub ahead of print].
49. Kovach CP, Hebbe A, O'Donnell CI, Plomondon ME, Hess PL, Rahman A, et al. Comparison of patients with nonobstructive coronary artery disease with versus without myocardial infarction (from the VA clinical assessment reporting and tracking [CART] program). Am J Cardiol. (2021) 146:1–7. doi: 10.1016/j.amjcard.2021.01.015
50. Gimelli A, Pugliese NR, Buechel RR, Coceani M, Clemente A, Kaufmann PA, et al. Myocardial perfusion scintigraphy for risk stratification of patients with coronary artery disease: the AMICO registry. Eur Heart J Cardiovasc Imaging. (2022) 23:372–80. doi: 10.1093/ehjci/jeaa298
51. Otaki Y, Betancur J, Sharir T, Hu LH, Gransar H, Liang JX, et al. 5-Year prognostic value of quantitative versus visual mpi in subtle perfusion defects: results from REFINE SPECT. JACC Cardiovasc Imaging. (2020) 13:774–85. doi: 10.1016/j.jcmg.2019.02.028
Keywords: acute myocardial infarction, myocardial perfusion imaging, myocardial blood flow (MBF), cardiac troponin I (cTnI), cardiac magnetic resonance (CMR) imaging
Citation: Zavadovsky KV, Vorobyeva DA, Mochula OV, Mochula AV, Maltseva AN, Bayev AE, Gulya MO, Gimelli A and Ryabov VV (2022) Myocardial Blood Flow and Flow Reserve in Patients With Acute Myocardial Infarction and Obstructive and Non-Obstructive Coronary Arteries: CZT SPECT Study. Front. Nucl. Med. 2:935539. doi: 10.3389/fnume.2022.935539
Received: 04 May 2022; Accepted: 31 May 2022;
Published: 06 July 2022.
Edited by:
Matthieu Bailly, Centre Hospitalier Régional d'Orléans, FranceReviewed by:
Terrence Ruddy, University of Ottawa Heart Institute, CanadaEmilia Zampella, University of Naples Federico II, Italy
Copyright © 2022 Zavadovsky, Vorobyeva, Mochula, Mochula, Maltseva, Bayev, Gulya, Gimelli and Ryabov. This is an open-access article distributed under the terms of the Creative Commons Attribution License (CC BY). The use, distribution or reproduction in other forums is permitted, provided the original author(s) and the copyright owner(s) are credited and that the original publication in this journal is cited, in accordance with accepted academic practice. No use, distribution or reproduction is permitted which does not comply with these terms.
*Correspondence: Konstantin V. Zavadovsky, a29uc3R6YXZAZ21haWwuY29t