 Cheng Peng
 Kaiwen Shi1
94% of researchers rate our articles as excellent or good
Learn more about the work of our research integrity team to safeguard the quality of each article we publish.
Find out more
ORIGINAL RESEARCH article
Front. Nucl. Eng., 02 April 2025
Sec. Nuclear Reactor Design
Volume 4 - 2025 | https://doi.org/10.3389/fnuen.2025.1551626
This article is part of the Research TopicNuclear Reactor Safety and Accident Mitigation ManagementView all articles
Introduction: During severe accidents, the interaction of hot melt with coolant forms porous debris beds in the reactor lower head or cavity. The long-term coolability of these beds is critical for accident mitigation and reactor safety enhancement, primarily determined by the dryout heat flux (DHF). Despite existing models, gaps persist in accounting for two-phase flow dynamics and interfacial shear effects.
Methods: This study develops high-fidelity mechanistic models to address these limitations. First, classical DHF models are reviewed, identifying key assumptions requiring refinement. New models are derived by incorporating: (1) two-phase flow characteristics (e.g., relative permeability, capillary pressure) and (2) gas-liquid interfacial shear stress. These models are extended to stratified debris bed configurations. Validation is performed using experimental data from KTH's POMECO-HT (top-injection) and VTT's STYX-3.1 tests.
Results: The two-phase flow model achieved a 20% DHF prediction error, while the interfacial shear model reduced errors to 8.9%. For stratified beds, the error further decreased to 4.5%, demonstrating superior accuracy.
Discussion: The results highlight the necessity of interfacial shear effects and stratification in DHF predictions. The proposed models offer a robust foundation for debris bed cooling analysis codes, significantly improving safety assessments.
Safety margin of the light water reactor under degraded core accidents should be carefully ensured in terms of nuclear reactor designs and safety analysis (Amidu et al., 2022). When a core melts down during one postulated accident, particulate debris beds with some certain structures can be largely formed as the melt develops various kinds of break-up (Peng, 2021) and fine-fragmentation (Xiang et al., 2023) within the water pool after it interacts with the cooling water, as in the case of the Three Mile Island nuclear accident (Garbrah and Nitheanandan, 2022). Once the debris beds in the lower plenum are sufficiently cooled down over a long period of time, severe accidents can be terminated within the reactor vessel. The coolability of the debris bed in the lower plenum is primarily evaluated and analyzed by conducting dryout experiments with a particulate debris bed submerged in a water pool (Lindholm et al., 2006). One parameter, named dryout heat flux (DHF) is valuable, which magnitude reflects the coolability of the debris beds.
Large numbers of factors affect the DHF, which can be divided into two main categories related to the structure of the debris beds (particle size distribution, porosity, geometry, etc.) and to the form of cooling characteristics (size of water pool, water injection pattern, etc.) (Ahmed et al., 2022). The complexity of the debris bed structure essentially determines its cooling performance, in particular the porosity, geometry, and the height of debris beds have a large impact on the DHF, and moreover, the heterogeneity of the real debris bed structure is even more pronounced (e.g., cake-like lumpy layers may locate at the bottom and the clogged blocks bonded together in the middle, which may deteriorate the heat transfer (Park et al., 2019)), which is largely dependent on debris transfer to the lower head. Magallon (2006) performed extensive comparisons between FARO and KROTOS test groups to confirm that at high pressure condition, except for the test with Zr metal in the melt, the debris was made of a cake in contact with the bottom and overlaying fragments, as in TMI. The cake-like configuration, as a result of the jet break-up length being larger than the water pool depth, shows a rather compact structure with vertical cracks. In addition, almost in all the tests, the tiny powders with the particle size in the range of 3.0–4.8 mm were quantified where no special event took place. In many cases, agglomeration will occur in the upper portion of the debris as this is the interaction area of hot debris. Debris at the bottom near the vessel wall may be cooled due to heat transfer through the vessel and potentially solidify in different configurations.
The form of cooling characteristics mainly affects the relative flow direction between the vapor and liquid phases within the debris bed and the capacity that the two-phase flow removes heat from the bed. A one-dimensional cylindrical debris bed may experience “vapor-liquid countercurrent flow” during the dryout process under the water ingress from the top, where the floating vapor prevents the injection of cooling water into the porous media, reducing the DHF, whereas the “vapor-liquid co-current flow” during water injection from the bottom (in the case with the introduction of external reactor vessel cooling from IRWST to the reactor pit where the debris may relocate) increases capacity of the two-phase flow for removing heat from the debris bed, upgrading the DHF. In contrast, the three-dimensional heap-shaped debris bed may present not quite the same phenomenon as previous. Due to the accumulation of vapor in the central part of the heap, the pressure difference along the side in the water-vapor mixing zone may lead to a natural convection in the water, which drives water around into the porous bed, forming a “vapor-liquid co-current flow” in the granular bed (Yang et al., 2023).
In addition to light water reactors, sodium-cooled fast reactors are designed with an In-vessel retention (IVR) strategy for hypothetical core disruptive accidents (HCDAs). If the fuel in the damaged core can be well cooled, the cooling margin of the core will be greatly strengthened and the probability of the success to IVR will be largely increased. Therefore, the cooling of the debris bed in a sodium-cooled fast reactor is also one of the major concerns (Ding et al., 2023). A full understanding of the two-phase flow in the liquid-sodium system is of vital importance in order to study the coolability of the debris bed, as the evaporation of liquid sodium and the solidification of the fuel pellets also result in a gas-liquid flow in a porous media. Earlier studies on the self-levelling characteristic of debris beds have elucidated its contribution to the debris beds’ coolability (Cheng et al., 2013) and, in addition, relevant cooling models for sodium-cooled fast reactors have been validated (Matsuo et al., 2008). However, both for experiments and analytical models, further consideration of the contribution of each characteristic parameter in two-phase flow is needed to improve the original cooling model for debris beds. The debris beds formed after a CDA in a sodium-cooled fast reactor contains not only tiny powders but also large fuel particles up to 10 mm in diameter. However, the particle size and porosity may be largely influenced by the likelihood of steam explosion. FARO and KROTOS experiments (Magallon, 2006) showed that very fine debris may remain longer in suspension in the water before settling and forming a sort of mud on the top of the quenched part, which may influence (compromise?) cooling. In order to construct a cooling model within a debris bed, it is quite essential to evaluate the particle size and porosity.
A number of mechanistic or empirical models have been developed based on different assumptions or simplifications (Chang and Kim, 1985). 0-dimensional POBEDA model is derived from the two-phase flow equations, which assumes that the vapor and water within a debris bed flow through separate channels, and that the interaction between the two phases occurs only at the intersection of both flow channels. This assumption is usually treated to be acceptable when the lateral dimensions of the flow channel are of the same order of magnitude as the particle size. For instance, in the STYX test (Lindholm et al., 2006), this size is less than 0.8 mm and it can be assumed that there is no countercurrent flow of vapor and water within a single flow channel. In this case, as in the Lipinski’s model in general (Yeo and No, 2019), the gravitational forces for each phase, the frictional forces on the flow in a porous medium, and the capillary pressure drop due to surface tension are taken into account.
The basic equations are as follows Equations 1, 2.
where p is the pressure, ρ is the density, g is the acceleration of gravity, z is the axial coordinate and the subscripts g and l represent vapor and water, respectively. The friction term follows the Ergun single-phase flow pressure drop equation, as in Equation 3, where w is the mean flow velocity in the flow channel and EL and ET are semi-empirical coefficients related to the porosity of the debris beds ε and the effective particle diameter D (also including fluid viscosity and density), which can be expressed as Equations 4, 5.
The capillary pressure difference within a same flow channel can be expressed as in Equation 6.
By differentiating Equation 6 along the axial direction z of the debris bed and substituting it into Equations 2, 3, the mean flow velocity wg of the vapor phase can be quickly solved under neglecting the frictional pressure drop of the liquid phase in the flow channel (this assumption generally agrees well when the void fraction is less than 0.9), as shown in Equation 7, which demonstrates that the flow velocity of the vapor depends not only on the characteristic parameters of the debris bed, but also on the nature of the fluid.
Moreover, neglecting the effect of capillary pressure drop on the flow within the debris bed (which corresponds to almost zero near the top of the debris bed), the dryout heat flux can be expressed as Equation 8, where the volume fraction can be treated as a function of the debris bed height.
Theofanous and Saito (Theofanous and Saito, 1981) established an empirical expression for the dryout heat flux of a 0-dimensional debris bed, as in Equation 9, where the subscript w indicates the state of water at 25°C, l is the liquid phase and g is the gas phase. F is the particle shape factor, and for aqueous media with a debris bed at 1 bar, d/F ∼ 2 cm. When the bed’s porosity is 40%, Equation 9 can be further turned into Equation 10.
Schrock et al. (1984) developed a 0-dimensional debris bed cooling model, based on the work by Theofanous et al. as in Equation 11, where the empirical coefficient C can be taken from 0.775 to 1.075.
Chang and Kim (1985) proposed a dryout heat flux model for a 0-dimensional debris bed based on a drift flow model, with the drift flow control Equations 12, 13, where v denotes the drift flow velocity, Fg and Fl can be expressed as Equations 14, 15, respectively under the condition of annular flow with vertically symmetrical distribution.
Ignoring the terms of dP/dz in Equations 12, 13 and substituting Equations 14, 15 under quasi-steady-state process, one can obtained as Equation 16. The shear stress along the vertical wall can be approximated by Equation 17, and for the wall friction factor Cwf under turbulent flow, it can be approximated by 0.005. The tangential stress at the intersection can be expressed as Equation 18. The friction factor Ci depends on the state of the intersection, and its value can be determined by the roughness of the disturbance wave under two-phase annular flow, as in Equation 19, while the relationship between the roughness and void fraction can be determined by Equation 20.
Neglecting the effect of the wall (Cwf = 0), based on the drift flow model, the drift flow rate jgl can be calculated, as shown in Equation 21, where K is represented by Equation 22.
When the mean velocity of the gas phase is given, the dryout heat flux of the debris bed can be determined by Equation 23. For the case with the void fraction is taken as 0.8 (Chang and Kim, 1985), the corresponding dryout heat flux can be simplified into Equation 24.
In this paper, a new debris bed cooling model that takes into account the characteristics of two-phase flow and interface interactions under homogeneous configuration will be firstly derived based on fast iteration method. Then, a DHF model for vertically stratified debris bed will be proposed. These mathematical models then will be validated against several typical international experimental results, in order to provide a theoretical basis for the development of a debris bed cooling mechanistic code for sodium-cooled fast reactors.
Most of the relative models above are simplified and ignore the effect of void fraction in the debris bed, except for the Chang model, however, it is somehow improper, under some certain circumstances, such as the case with high drift flow rate. In addition, mechanistic models should be adopted instead of empirical engineering models to reflect the dominant factors in DHF. Therefore, we start with the derivation of the most primitive governing equation.
The basic governing equations developed for the cooling of debris beds are such models referring to the gas-liquid phase pressure gradient in a porous medium proposed by Ergun (Park et al., 2018), as shown in Equations 25, 26, where κr,l, κr,g, and ηr,l, ηr,g are the relative permeabilities and passabilities of liquid and gas, respectively; Fi is the interfacial drag between liquid and gas.
Noting
Equation 27 can be transformed into the most simplified result (Equation 28), where ET,g and EL,g are listed as in Equations 29, 30.
For κ, η, κr,g and ηr,g, they can be solved by Equations 31–34, respectively. For spherical particles, Ck is taken to be 150; Cη is taken to be 1.75; m is taken to be 3 (as Lipinski and Reed suggested); and n can be taken to be 3 (as suggested by Lipinski) or 5 (as suggested by Reed) (Lindholm et al., 2006).
Then, the dryout heat flux qDHF is represented by Equation 35 and it can be found that the model can reflect the influence of different void fraction, porosity, particle diameter and particle shape factor on the dryout heat flux for homogeneous geometry.
The shear force on the gas phase at the gas-liquid interface can be expressed as Equation 14, with the neglection of the shear force on the wall. For the Ci in Equation 18 of tangential stress at the interface, it can be assumed to be formula 36 by Chang et al., as follows.
For the relative velocity between the gas and liquid phases, Vgl, on the other hand, it can be estimated from the drift flow model, as in Equations 37, 38, and the drift flow rate expression Equation 21 obtained by Chang and Kim, 1985, where the parameter K can be written as Equation 22.
Ultimately, Vgl can be expressed as Equation 39.
Substituting Equation 39 into Equation 14, the shear force on the gas phase at the gas-liquid interface can be expressed as Equation 40. Then, Equation 41 can be derived by substituting Equation 40 into Equation 27.
The mean velocity of the gas phase, Jg, can be quickly solved by Equation 41, as Equation 42, and the dryout heat flux considering the effect of interfacial shear stress can be formularized as Equation 43.
The previous two DHF models are both closely related to the void fraction within the debris bed. Therefore, empirical correlation related to the void fraction needs to be introduced to quantify the mean void fraction for different geometries of debris beds and the thermal-hydraulic parameters. The relationship between the void fraction and the gas-phase Reynolds number for different particle diameters has been investigated by IRSN in France based on the CALIDE experimental setup (Chikhi et al., 2016) and can be described in Figures 1, 2 for 4 mm and 8 mm in particle diameter, respectively. This phenomenon was also found in a horizontal two-phase flow experiment conducted at Oklahoma State University in 2011 (Godbole et al., 2011), as shown in Figure 3, which shows that there is a consistent trend between the void fraction and the superficial mean velocity of the gas phase, regardless of whether the flow pattern in the pipe belongs to the bubbly flow, slug flow, annular flow, churning flow or froth flow.
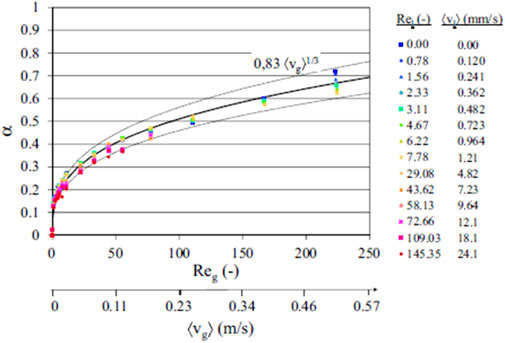
Figure 1. Void fraction in a debris bed comprised of particles with diameter of 4 mm as a function of mean flow velocity in the gas phase (Air-water) (Chikhi et al., 2016).
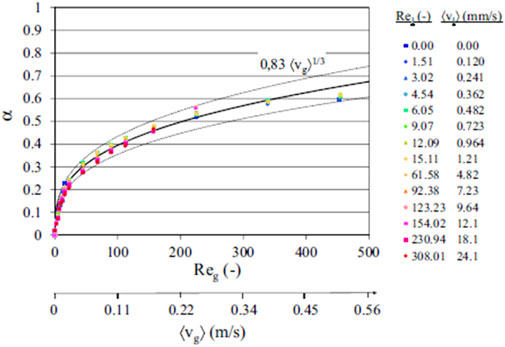
Figure 2. Void fraction in a debris bed comprised of particles with diameter of 8 mm as a function of mean flow velocity in the gas phase (Air-water) (Chikhi et al., 2016).
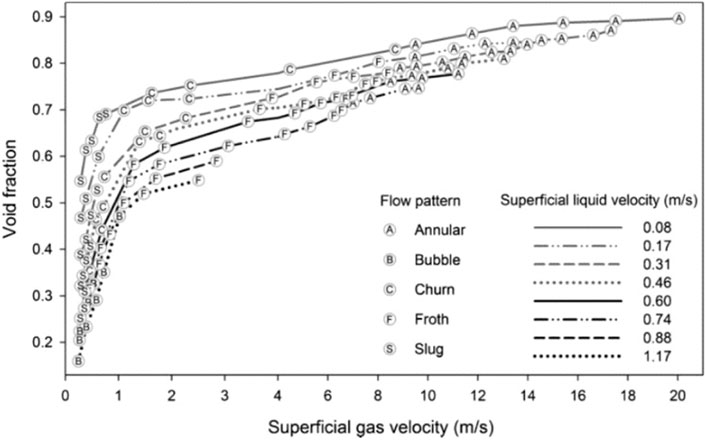
Figure 3. Void fraction in a horizontal pipe as a function of superficial gas velocity corresponding to different flow patterns (Godbole et al., 2011).
In this case, IRSN obtained fitting results as in Equation 44 for a particle debris bed with the mean particle diameter of 4 mm, and as in Equation 45 with the mean particle diameter of 8 mm. Moreover, they suggested an analytical result that can be further extended to other debris bed structures (Equation 46), where it can be seen that the void fraction is no longer influenced by parameters such as the particle size, but mainly by the superficial velocity of the gas phase. This implies that the DHF models concerning the void fraction can be iteratively calculated with the aid of the Equation 46 to obtain a convergible superficial velocity of vapor phase, thus determining the corresponding mean void fraction.
Besides, it can be clearly found that the two mechanistic models developed can be applied to any type of debris bed cooling system, for example, the water ingress in a classic LWR debris bed and cooling by sodium of an SFR debris bed, just by simply adjusting the corresponding coolant thermophysical parameters and the debris bed geometry, if there is no more new phenomenon figured out in liquid metal cooled debris bed scenarios.
The iterative process will be debugged below using the initial conditions and experimental results from a test at POMECO carried out at KTH in Sweden (Huang and Ma, 2018; Li et al., 2012).
The iterative process in homogeneous bed configuration can be shown in Figure 4. The POMECO-HT experimental system from KTH in Sweden can be found from their public papers (Huang and Ma, 2018). In addition to the experimental study of top water injection, this set-up can also be adopted for bottom and downward water injection studies to assess the effectiveness of the debris cooling enhancement measures. In view of the above model assumptions of cooling water passing down through the channels from the top, and the steam rising up through the channels from the bottom, leading to the possible formation of CCFL, only the top water injection conditions and results were selected.
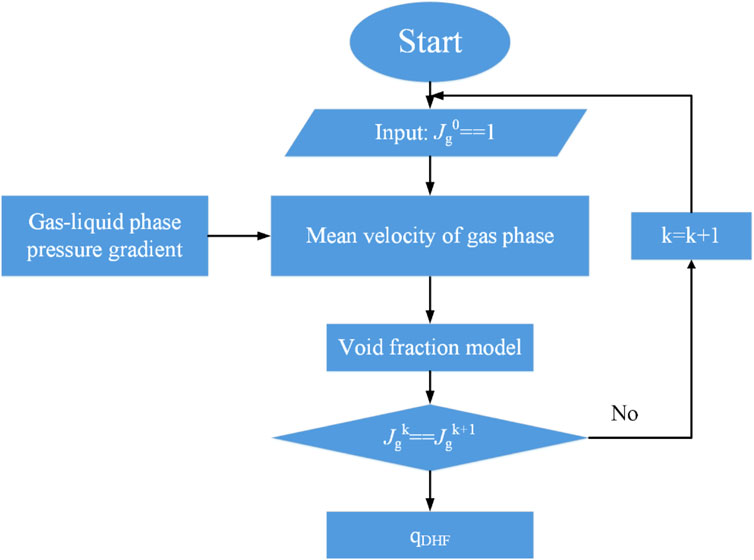
Figure 4. The flowchart of the iteration in homogeneous bed configuration.
The test section is made out of stainless steel with a cross-sectional area of 200 mm × 200 mm and a height of 620 mm to hold up the debris bed and electric heater, which can be shown in Figure 5. A stainless steel water tank (200 mm × 200 mm) with a height of 1,000 mm is mounted on top of it and the two are linked by flanges, with a water level gauge installed in the tank to measure the water level during the experiment. The test section and the water tank are wrapped with an insulation layer. 120 resistance temperature detector (RTD) heaters are evenly arranged inside the debris bed in 15 layers in the axial direction, with eight heaters per layer. An average distance of 38 mm in the axial direction and 25 mm in the horizontal direction between two adjacent layers of heaters are maintained. In addition to the electric heating equipment, there are 96 thermocouples evenly arranged in 16 layers in the axial direction within the debris bed, and the distance between the thermocouples and the electric heating rods is 19 mm. Besides, in order to measure the surface temperature of the electric heating rods, there are six thermocouples arranged in close proximity (about 2 mm spacing) on the surface of the heating rods, as well.
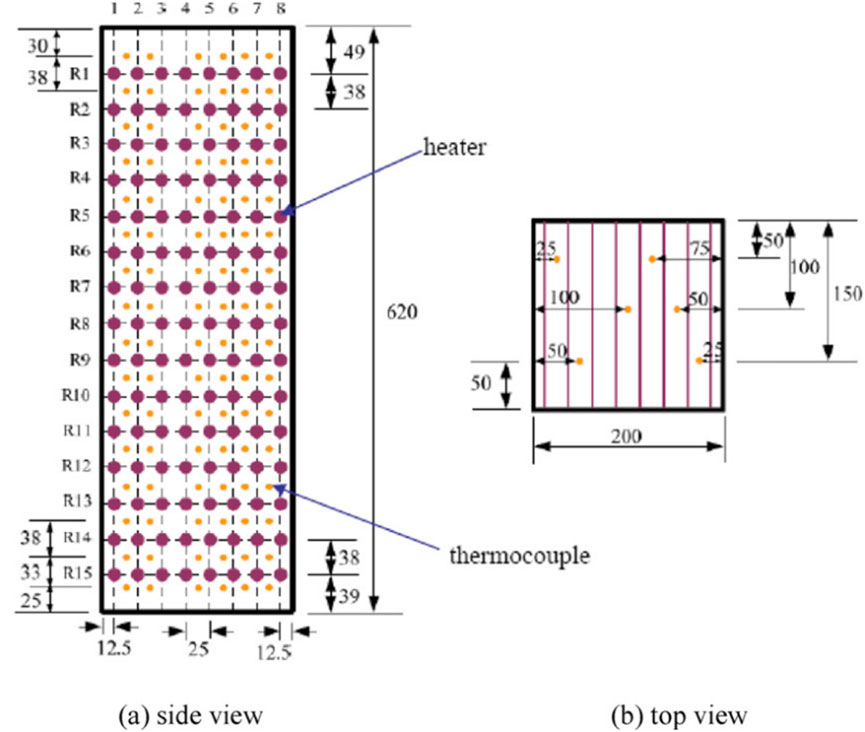
Figure 5. The distribution of heaters and thermocouples within the test section (Huang and Ma, 2018).
The selected condition was a homogeneous debris bed geometry with a particle diameter of 3 mm and a porosity of 0.367. The bed height was initialized at 610 mm. This type of homogeneous debris bed has been employed for the validation of MEWA code (Li et al., 2012) as well. DHF model concerning the two-phase flow characteristics, which has been proposed in Section 2.1, was used as an example for iterative testing, coupled with Equation 46. The iterative process is shown in Table 1.
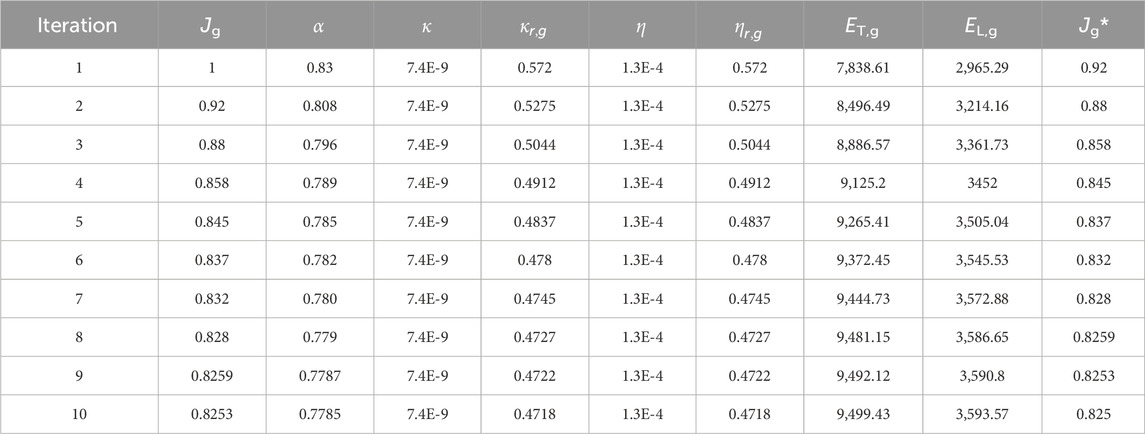
Table 1. Iterative process for all involved parameters.
It can be seen that the superficial velocity of the vapor phase can be controlled at around 0.04%, when iterating about 10 times, at which the mean void fraction within the debris bed is approximately 0.7785, corresponding to a dryout heat flux of approximately 957.158 kW/m2 calculated by Equation (35). However, the dryout heat flux obtained for this test condition is approximately 790 kW/m2, which illustrates that the prediction error from this mechanistic model by using the present iterative algorithm is approximately 20%.
In real severe accident scenerios, stratified debris bed can be developed as a result of various molten materials involved being solidified. The heat transfer from such configuration can be much distinct from the homogeneous one. Therefore, the dryout model for stratified debris bed is going to be built based on the interfacial shear stress, as well,as shown in Figure 6.
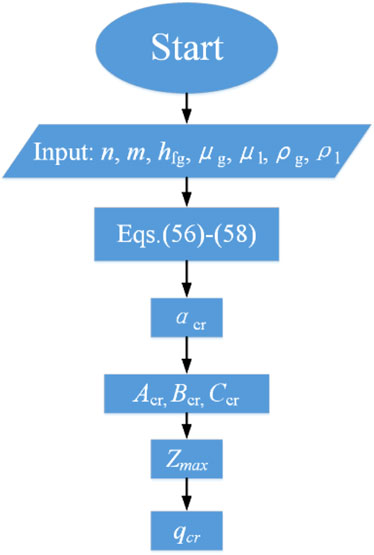
Figure 6. The flowchart of the iteration in stratified bed configuration.
With ignorance of the capillary pressure difference, the momentum equation for the gas-liquid two-phase flow can be transformed from Equation 27 into 47. The heat transfer rate at a certain elevation, z, can be estimated by the heat yield from the region below z, which can be demonstrated in Equation 48. In this equation, q’’’ refers to the mean volumetric heating rate.
Inserting Equation 48 into Equation 47, one can be obtained as Equation 49. Therefore, z can be determined by Equation 50.
Lindholm et al. (2006) introduced the relative permeabilities and passabilities for the liquid and steam under the laminar and turbulent flow through, as shown in Equations 51-54, in which the symbol s refers to the local saturation:
The critical void fraction, αcr can be determined by the following Equation 55.
The terms
In summary, the critical void fraction, αcr calculated by coupling Equations 55–57 can be inserted into Equation 50, and the maximum elevation for the onset of dryout can be estimated. Then, the corresponding dryout heat flux can be derived, based on Equation 58.
In addition to the model verification in chapter three used for the iterative testing, the mechanistic model in Section 2.2, which takes into account the interfacial shear stress, is used for further validation.
The selected condition is identical to the homogeneous debris bed condition with the particle diameter of 3 mm and a porosity of 0.367. The iterative process is shown in Table 2.
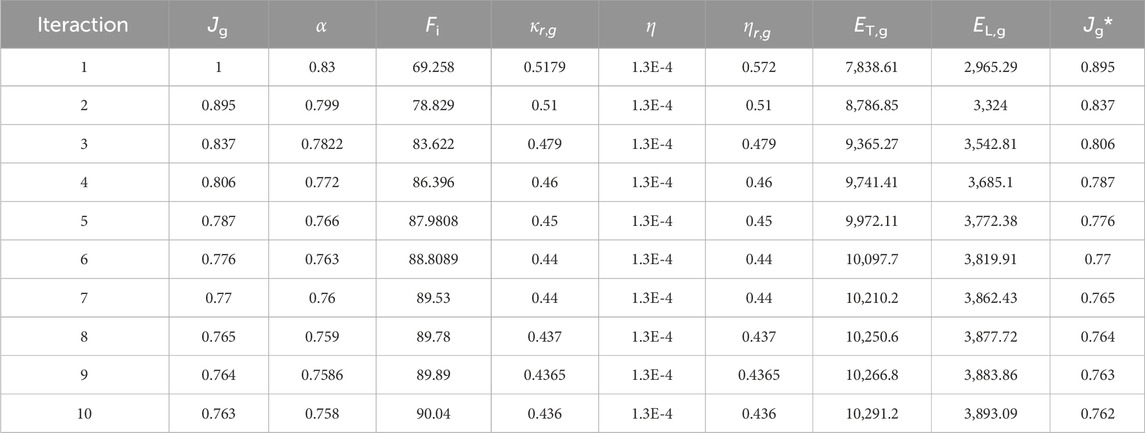
Table 2. Iterative process for all involved parameters.
It can be seen that the superficial velocity of the vapor phase can be controlled to about 0.13% when it is iterated about 10 times, at which the mean void fraction within the debris bed is about 0.758, corresponding to a dryout heat flux of about 860.63 kW/m2 calculated by Equation 43. Compared to the experimental results addressed in chapter three, the relative prediction error is reduced to approximately 8.9%, which supports the hypothesis that taking into account the effect of interfacial shear stress generated by the gas phase motion greatly improves the prediction reliability of the model for this test condition.
In addition to the debris bed cooling experiments conducted on the POMECO-HT setup with steel sphere as particles, uniformly and non-uniformly arranged sand-made debris bed experiments (Konovalikhin et al., 2001) were also performed. In this section, DHF experiments based on the uniformly arranged sand debris bed as the validation object are selected to compare the prediction errors of various DHF models presented in this paper. For the test condition, the mean porosity of the debris bed is 0.26 with the fragment diameter of 0.8 mm, and the hydraulic diameter of the test vessel is 0.35 m. The calculated results for each mechanistic model are shown in Figure 7.
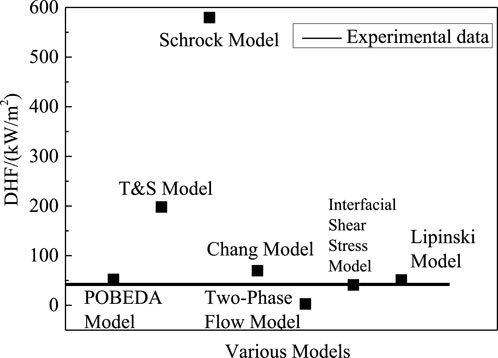
Figure 7. Comparison of various models for prediction of DHF in the sand-made debris bed.
As seen in Figure 6, the solid black line represents the experimental data from POMECO, while the solid black dots represent the calculation results by POBEDA model, the Theofanous and Saito (T&S) model, the Schrock model, the Chang model, the Lipinski model, and the DHF models proposed in this article. The prediction errors of the POBEDA model, and the Lipinski 0-dimensional model are relatively small and can be limited to within 16%, while the other models from the previous literature may overestimate the dryout situation to varying degrees. In particular, the model based on the two-phase flow characteristics developed in this paper may have difficulty in predicting the DHF for conditions with small particles. Alternatively, the other DHF model developed in this study and based on the interfacial shear stress can show a better result more in line with the POMECO data for this small debris particle (0.8 mm) test. This is probably due to the relatively more important role of interfacial shear stress during gas-liquid flow when the debris particles are small, which may have a critical role in enhancing the DHF.
VTT in Finland had conducted an experimental study on the cooling characteristics of an axial stratified debris bed, known as the STYX-3.1 experiment, and measured its dryout heat flux. The sketch of the geometry is shown in Figure 8, and the main experimental parameters are shown in Table 3 as follows.
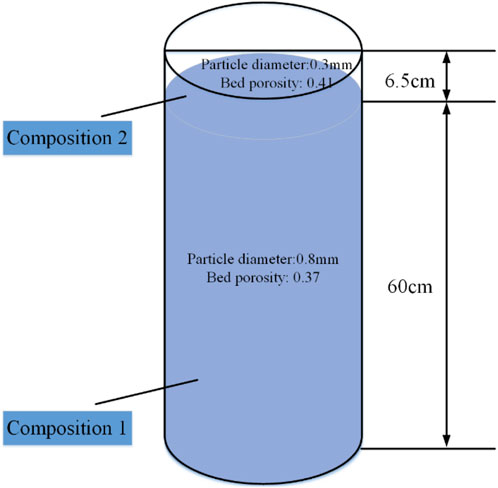
Figure 8. The sketch of geometry of the debris bed in STYX-3.1.
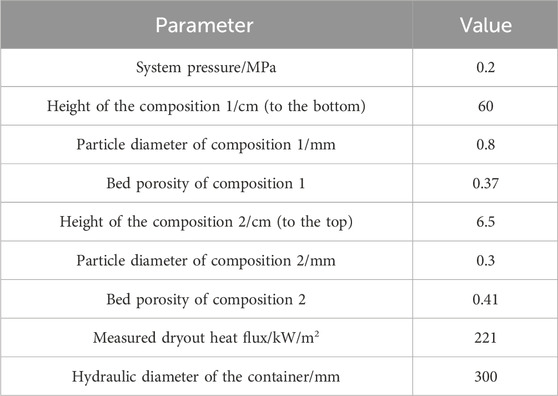
Table 3. Key parameters from the dryout heat flux experiments of STYX-3.1.
Validation is conducted for the proposed theoretical model for stratified debris bed. The selected empirical coefficients of m = 3 and n = 3 are recommended by Lindholm et al. (2006). For the lower part of the debris bed (i.e., composition 1) in the STYX-3.1 experiment, the relationship between the void fraction and the height of the debris bed is severely affected by the volumetric heating rate, as shown in Figure 9. It can be observed that when the postulated volumetric heating rate is only 103 W/m3, the height of the debris bed required to reach dryout conditions is nearly 230 m. As the volumetric heating rate gradually increases, the height of the debris bed corresponding to dryout condition decreases sharply. When the volumetric heating rate reaches 104 W/m3, the debris bed should be as high as about 23 m to undergo dryout, and moreover, when the volumetric heating rate further increases to 105 W/m3, the corresponding height is approximately 2.3 m. This conclusion manifests that there is a negative relation between the volumetric heating rate and the elevation corresponding to dryout condition. For this composition 1, the relationship between the
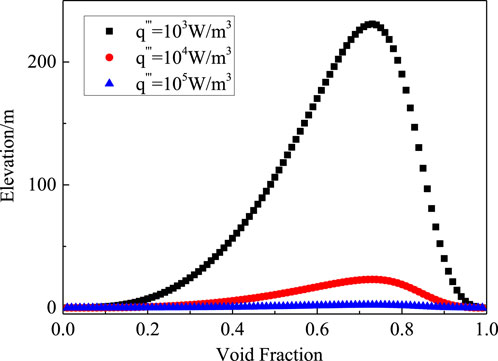
Figure 9. The relationship between the void fraction and the height of the debris bed (Composition 1/STYX-3.1).
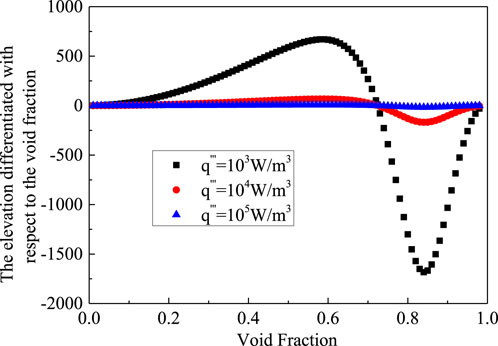
Figure 10. The relationship between the void fraction and
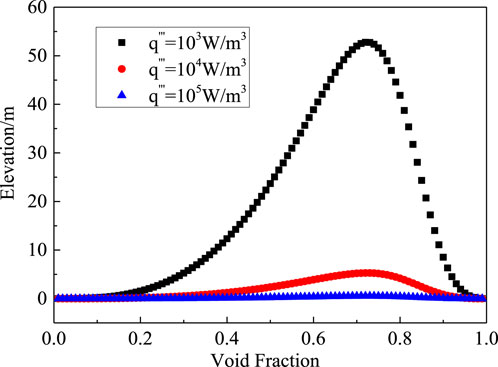
Figure 11. The relationship between the void fraction and the height of the debris bed (Composition 2/STYX-3.1).
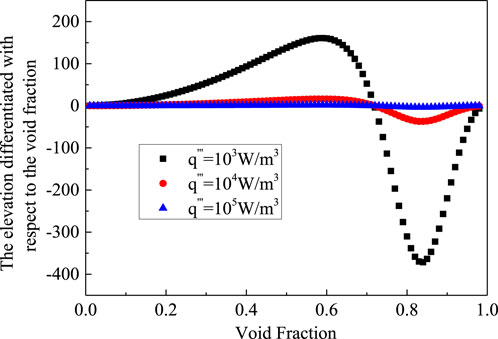
Figure 12. The relationship between the void fraction and
Figures 13, 14 illustrate the heat flux varied with the elevation of the debris bed for each composition. It can be observed that, at any given volumetric heating rate, the heat flux gradually increases with the height of the debris bed. However, for different volumetric heating rates, the product of the height of the debris bed and the volumetric heating rate (i.e., the heat flux) at the same void fraction is kept constant. Therefore, by identifying the critical void fraction for any condition, one can determine the corresponding height of the debris bed for this void fraction, and subsequently estimate the DHF. Considering that the critical void fraction for dryout in this test is approximately 0.73, for composition 1 with volumetric heating rates of 103, 104, and 105 W/m3, the corresponding maximum elevations zmax are 230.9 m, 23.09 m, and 2.309 m, respectively, with DHF values all being 230.92 kW/m2. For composition 2, the corresponding maximum elevations zmax are 52.7 m, 5.27 m, and 0.527 m, with DHF values all being 52.77 kW/m2. The measured dryout heat flux in the experiment is 221 kW/m2, which is closer to the predicted DHF in composition 1, with a prediction error of around 4.5%, which demonstrates that the dryout may take place in the lower part of the debris bed with less porosity. The prediction result based on the POBEDA model (Lindholm et al., 2006) is 198 kW/m2, with an error of about 10.4%. Thus, it can be verified that the debris bed cooling model for stratified configuration, which takes the interfacial shear stress into account, improves the accuracy of the prediction results.
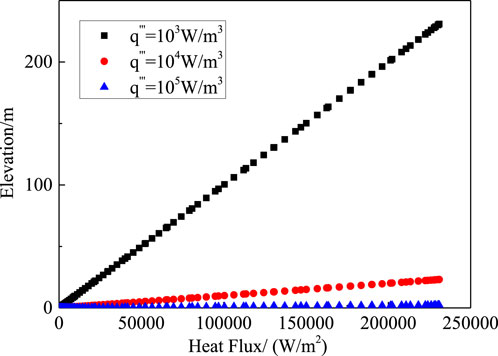
Figure 13. The relationship between the height of the debris bed and the heat flux (Composition 1/STYX-3.1).
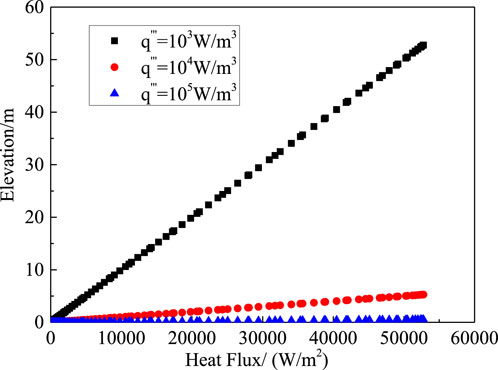
Figure 14. The relationship between the height of the debris bed and the heat flux (Composition 2/STYX-3.1).
In this paper, two dryout heat flux models for homogeneous debris bed concerning the two-phase flow characteristic and the interfacial shear stress, respectively and one for stratified configuration are theoretically proposed, coupled with empirical coefficients. In collaboration with the void fraction model, the DHF models for homogenous debris bed can be calculated iteratively with convergent superficial gas velocity and the mean void fraction. Three concluding remarks are highlighted here.
1) By validating against the POMECO tests (steel sphere, 3 mm in particle diameter) conducted by KTH, the simulation results show that the prediction error of the two-phase flow characteristics DHF model is around 20%, while the prediction error of the interfacial shear stress DHF model is significantly reduced at 8.9%.
2) By validating against the POMECO tests (sand sphere, 0.8 mm in particle diameter) conducted by KTH, the interfacial shear stress DHF model is shown to be favorable for predicting such debris conditions when compared to various mechanistic or classical models from literature. This is likely due to the vital role interfacial shear stress plays in enhancing the DHF of debris beds.
3) By validating against the STYX-3.1 test conducted by VTT, it shows a negative relation between the volumetric heating rate and the elevation corresponding to dryout condition, and moreover, the critical void fraction is independent of the volumetric heating rate. The present semi-empirical model can better predict the dryout condition of stratified debris beds with a prediction error of around 4.5%.
The original contributions presented in the study are included in the article/supplementary material, further inquiries can be directed to the corresponding authors.
CP: Conceptualization, Formal Analysis, Funding acquisition, Investigation, Methodology, Validation, Writing–original draft, Writing–review and editing, Project administration. KS: Data curation, Formal Analysis, Investigation, Validation, Writing–original draft. JD: Project administration, Resources, Supervision, Visualization, Writing–review and editing. JW: Supervision, Visualization, Writing–review and editing.
The author(s) declare that financial support was received for the research, authorship, and/or publication of this article. This work was supported by 1) the operating fund of Key Laboratory of Nuclear Power Systems and Equipment (Shanghai Jiao Tong University), Ministry of Education, China. 2) the National Natural Sciecne Foundation of China (12105167).
The authors declare that the research was conducted in the absence of any commercial or financial relationships that could be construed as a potential conflict of interest.
The author(s) declare that no Generative AI was used in the creation of this manuscript.
All claims expressed in this article are solely those of the authors and do not necessarily represent those of their affiliated organizations, or those of the publisher, the editors and the reviewers. Any product that may be evaluated in this article, or claim that may be made by its manufacturer, is not guaranteed or endorsed by the publisher.
Ahmed, Z., Jordan, C., Jain, P., Robb, K., Bindra, H., and Eckels, S. J. (2022). Experimental investigation on the coolability of nuclear reactor debris beds using seawater. Int. J. Heat Mass Transf. 184, 122347. doi:10.1016/j.ijheatmasstransfer.2021.122347
Amidu, M. A., Olatubosun, S. A., Ayodeji, A., and Addad, Y. (2022). Severe accident in high-power light water reactors: mitigating strategies, assessment methods and research opportunities. Prog. Nucl. Energy 143, 104062. doi:10.1016/j.pnucene.2021.104062
Chang, S. H., and Kim, S. H. (1985). Derivation of a dryout model in a particle debris bed with the drift-flux approach. Nucl. Sci. Eng. 91, 404–413. doi:10.13182/nse85-a18357
Cheng, S. B., Yamano, H., Suzuki, T., Tobita, Y., Nakamura, Y., Zhang, B., et al. (2013). Characteristics of self-leveling behavior of debris beds in a series of experiments. Nucl. Eng. Technol. 45, 323–334. doi:10.5516/net.02.2012.068
Chikhi, N., Clavier, R., Laurent, J.-P., Fichot, F., and Quintard, M. (2016). Pressure drop and average void fraction measurements for two-phase flow through highly permeable porous media. Ann. Nucl. Energy 94, 422–432. doi:10.1016/j.anucene.2016.04.007
Ding, W., Chen, R. H., Tian, W. X., Qiu, S., and Su, G. (2023). Numerical investigation of dynamic characteristics of debris bed formation based on CFD-DEM method. Ann. Nucl. Energy 180, 109492. doi:10.1016/j.anucene.2022.109492
Garbrah, S. H. G., and Nitheanandan, T. (2022). 15-Severe accident prevention and mitigation in pressurized heavy water reactors. Press. Heavy Water React. 7, 477–508. doi:10.1016/B978-0-12-822054-2.00017-9
Godbole, P. V., Tang, C. C., and Ghajar, A. J. (2011). Comparison of void fraction correlations for different flow patterns in upward vertical two-phase flow. Heat. Transf. Eng. 32 (10), 843–860. doi:10.1080/01457632.2011.548285
Huang, Z., and Ma, W. M. (2018). Validation and application of the MEWA code to analysis of debris bed coolability. Nucl. Eng. Des. 327, 22–37. doi:10.1016/j.nucengdes.2017.11.038
Konovalikhin, M. J., Kazachkov, I. V., and Sehgal, B. R. (2001). “Dryout heat flux in a low porosity volumetrically heated particle bed,” in Proceedings of 4th International Conference on Multiphase Flows, New Orleans, LA, 1–20.
Li, L. X., Ma, W. M., and Thakre, S. (2012). An experimental study on pressure drop and dryout heat flux of two-phase flow in packed beds of multi-sized and irregular particles. Nucl. Eng. Des. 242, 369–378. doi:10.1016/j.nucengdes.2011.11.006
Lindholm, I., Holmstrom, S., Miettinen, J., Lestinen, V., Hyvärinen, J., Pankakoski, P., et al. (2006). Dryout heat flux experiments with deep heterogeneous particle bed. Nucl. Eng. Des. 236, 2060–2074. doi:10.1016/j.nucengdes.2006.03.036
Magallon, D. (2006). Characteristics of corium debris bed generated in large-scale fuel-coolant interaction experiments. Nucl. Eng. Des. 236, 1998–2009. doi:10.1016/j.nucengdes.2006.03.038
Matsuo, E., Abe, Y., Chitose, K., Koyama, K., and Itoh, K. (2008). Study on jet breakup behavior at core disruptive accident for fast breeder reactor. Nucl. Eng. Des. 238, 1996–2004. doi:10.1016/j.nucengdes.2007.11.011
Park, J. H., Park, H. S., and Lee, M. (2019). Experimental study on evaluation of effective diameter for non-spherical particles in predicting pressure gradients of water/air two-phase flow in particle beds. Int. J. Heat Mass Transf. 140, 139–146. doi:10.1016/j.ijheatmasstransfer.2019.05.072
Park, J. H., Park, H. S., Lee, M., and Moriyama, K. (2018). Modeling of pressure drop in two-phase flow of mono-sized spherical particle beds. Int. J. Heat Mass Transf. 127 (Part A), 986–995. doi:10.1016/j.ijheatmasstransfer.2018.06.040
Peng, C. (2021). Influence of coupled factors on premixing and fragmentation of mild thermal interaction. Ann. Nucl. Energy 160, 108394. doi:10.1016/j.anucene.2021.108394
Schrock, V. E., Wang, C.-H., Revankar, S., Wei, L. H., Lee, S. Y., and Squarer, D. (1984). “Flooding in particle beds and its role in dryout heat flux prediction,” in Proceedings of the sixth meeting on debris coolability, Los Angeles, CA, November 7–9, 1984, EPRI NP-4455.
Theofanous, T. G., and Saito, M. (1981). An assessment of class-9 (Core-Melt) accidents for PWR dry-containment systems. Nucl. Eng. Des. 66, 301–332. doi:10.1016/0029-5493(81)90162-x
Xiang, Y., Liang, D. S., Komlev, A., Fang, D., Deng, Y., Zhao, L., et al. (2023). An experimental investigation on debris bed formation from fuel coolant interactions of metallic and oxidic melts. Appl. Therm. Eng. 233, 121186. doi:10.1016/j.applthermaleng.2023.121186
Yang, S. X., Gong, H. J., Fang, Y., Hu, Y., Zan, Y., Yang, Z., et al. (2023). Experimental study on coolability of mixed particle size debris bed under top flooding. Prog. Nucl. Energy 156, 104523. doi:10.1016/j.pnucene.2022.104523
Keywords: dryout, DHF, debris bed cooling, severe accident, modeling
Citation: Peng C, Shi K, Deng J and Wu J (2025) Dryout modelling for both homogeneous and stratified debris beds. Front. Nucl. Eng. 4:1551626. doi: 10.3389/fnuen.2025.1551626
Received: 26 December 2024; Accepted: 05 March 2025;
Published: 02 April 2025.
Edited by:
Sanjeev Gupta, Becker Technologies, GermanyReviewed by:
Wenhai Qu, Shanghai Jiao Tong University, ChinaCopyright © 2025 Peng, Shi, Deng and Wu. This is an open-access article distributed under the terms of the Creative Commons Attribution License (CC BY). The use, distribution or reproduction in other forums is permitted, provided the original author(s) and the copyright owner(s) are credited and that the original publication in this journal is cited, in accordance with accepted academic practice. No use, distribution or reproduction is permitted which does not comply with these terms.
*Correspondence: Cheng Peng, ZGlvbWlvQHNoaWVwLmVkdS5jbg==; Jian Deng, ZGVuZ2ppYW5fbnBpY0AxNjMuY29t
Disclaimer: All claims expressed in this article are solely those of the authors and do not necessarily represent those of their affiliated organizations, or those of the publisher, the editors and the reviewers. Any product that may be evaluated in this article or claim that may be made by its manufacturer is not guaranteed or endorsed by the publisher.
Research integrity at Frontiers
Learn more about the work of our research integrity team to safeguard the quality of each article we publish.