
94% of researchers rate our articles as excellent or good
Learn more about the work of our research integrity team to safeguard the quality of each article we publish.
Find out more
ORIGINAL RESEARCH article
Front. Nucl. Eng., 24 February 2025
Sec. Nuclear Materials
Volume 4 - 2025 | https://doi.org/10.3389/fnuen.2025.1495360
This article is part of the Research TopicStructures and Properties of Fluorite-related Systems for Nuclear ApplicationsView all 6 articles
 Thierry Wiss1*
 Rudy J. M. Konings1Dragos Staicu1
 Alessandro Benedetti1Jean-Yves Colle1Vincenzo V. Rondinella1
 Emilio Maugeri1†
 Zeynep Talip1†
 Arne Janssen1†Oliver Dieste2
 Luana Cognini2
 Emanuele De Bona3
 Gianguido Baldinozzi4Christine Guéneau5
The heat capacity of alpha-damaged uranium, plutonium, and americium mixed dioxide (Uu, Puv, Amw)O2±x samples was measured during thermal annealing. The excess of heat released was assessed and the recovery stages associated with various defects described by integrating results from transmission electron microscopy, helium desorption spectroscopy, thermal diffusivity, and XRD annealing studies. It is shown that different defect-annealing stages could be singled out. It could also be evidenced that the excess of energy stored in defects tends to saturate after rather low damage levels, but that, with increasing radiogenic helium production, another contribution of stored energy appears which can be attributed to the formation of He-defect complexes that cannot be annihilated until higher temperatures are reached.
Heat capacity (Cp) and thermal diffusivity (α) are essential thermophysical properties that determine the thermal behavior of materials. Their temperature dependence reflects all the excitations that the substance undergoes when heated. Moreover, heat capacity relates to essential thermodynamic quantities such as (standard) enthalpy and entropy, which are used in thermodynamic descriptions of pure compounds and solid solutions (Holba et al., 2013).
In actinide dioxides, α-self-irradiation induces significant disorder in the cation and anion sub-lattices already during the early stages of damage accumulation. This results in a quick deterioration of phonon characteristic lifetimes, leading to a significant decrease of the thermal and other physical properties of these materials. In UO2, for example, the increasing self-irradiation disorder causes the Cp of the sharp antiferromagnetic transition to become a broader anomaly, with the peak decreasing in intensity, broadening, and shifting to lower T, leading to a redistribution of the excess entropy over the broader thermal interval. Recently, periodic measurements of a (Ux, Pu1-x)O2 sample-specific heat, in the 5–50 K temperature interval were performed. The antiferromagnetic transition observed at the Néel temperature, typical of UO2-based compounds, was also affected by the chemical disorder due to the substitutional plutonium atoms in the ideal uranium lattice. Moreover, as the displacive disorder in the lattice increases as a direct consequence of the α-self-irradiation, the UO2 magnetic transition peak broadened further and decreased its maximum intensity (Vălu et al., 2019). Previous studies of PuO2 low temperature heat capacity revealed that a pronounced recovery stage occurs at temperatures at approximately 54 K (Turcotte and Chikalla, 1973); no clear evidence could be drawn on the specific sub-lattice involved until Rutherford backscattering spectroscopy analyses (Turos et al., 1990; Matzke et al., 1991) showed that the cationic sub-lattice was specifically concerned in ion-implanted UO2. As expected, and as seen for other thermal properties, the impact of self-irradiation is already significant for moderate cumulated doses (Flotow et al., 1976).
Calorimetric measurements of samples undergoing α-damage show that the annealing of non-equilibrium defects produces measurable heat. As first recognized by Wigner (1946), a significant fraction of the energy released in a radiation process in a material can be stored as atomic defects and extended imperfections. Calorimetry is a well-adapted technique for the analysis of radiation damage recovery because it is continuous as a function of temperature and uses a constant heating rate. Staicu et al. (2004; 2015) observed several distinct stages of heat release in alpha-damaged UO2 samples during differential scanning calorimetry (DSC) experiments: the identification of the non-equilibrium defects was made possible by a comparative analysis of the independent recovery processes of lattice parameter, of void/dislocation growth, and of helium release. A substantial increase of thermal diffusivity was observed in the same temperature range after the annealing stage. Similar observations were reported by the same authors for the heat capacity and thermal diffusivity of (Pux, Am1-x)O2±y samples (Staicu et al., 2015). The different recovery stages of the α-damaged UO2 samples were attributed to different defect types. The first two stages at (600–750 K) and (750–900 K) were attributed to the recombination of oxygen and U defects, respectively. After these two stages, during which complementary point defects annihilate, defect associations as loops and voids are responsible for the two subsequent energy release stages. In both cases, the co-precipitation of O and U defects is needed. It was previously shown in annealing studies (Staicu et al., 2010) that the diffusion enthalpies, observed in the temperature range (900–1100 K) for which extended defect precipitation occurs, are clearly higher than during the previous two temperature ranges, during which single defect atomic jumps were involved, indicating that mobile defect clusters are formed. The energies released in forming interstitial loops and voids are compatible with the expected concentration of Schottky trio defects (the smallest neutral associations of U and O vacancies which play a significant role in the accommodation of gaseous fission products) formed by defect associations that survive recombination.
The precipitation of He in the fluorite crystal structure does not produce visible calorimetric effects until a concentration of approximately 1017 He.g−1 (Staicu et al., 2010). Moreover, the diffusion and release of fission gas occurs at higher temperatures than those characterizing (single) defect diffusion—when dislocations are well-developed and voids are formed. An interesting observed feature is that He is scarcely trapped by voids, so its diffusion is not strictly associated with that of vacancies (Staicu et al., 2004). Recent measurements on samples that cumulated more radiogenic He than those reported in Staicu et al. (2010) have been analyzed, and their contribution to the apparent, Cp*—the Cp of the radiation-damaged compounds affected by the accumulated radiation damage—is object of this paper. It is also shown that the He diffusion coefficient in an alpha-doped UO2 sample varied by a factor 104 for damage of 0.04–0.7 dpa in the temperature range 1300 K–1700 K (Luzzi et al., 2018). Additionally, the impact of stoichiometry on the nature of the defects generated by alpha-damage and their recovery is also assessed.
These results are useful in order to provide information on the evolution of the state of spent fuel under interim and final storage conditions. A practical application of these results is that the stored energy in spent fuels can be expected to increase during the disposal timeframe, potentially leading to changes in properties (mechanical, thermo-physical). The time range of interest for forecasting the fate of spent fuels can vary from decades to millennia, time covered by our previous investigations (Wiss et al., 2021; Wiss et al., 2014) and partly in this recent work, particularly for the calorimetric studies.
Another point of interest of the assessment of the damage effects, particularly in (U, Pu)O2 samples, lies in the challenges related to multi-recycled Pu in MOX fuel. In this case, compared to the standard MOX, the isotopic composition of the Pu will be enriched in 238Pu, 240Pu, and 241Pu (β-decaying into the strong alpha-emitter 241Am), which have much higher specific activities than the 239Pu isotope; those fuels will thus be subjected to strong self-irradiation before being irradiated in a reactor (Kahraman et al., 2022).
Full knowledge of the characteristic temperatures of elementary mechanisms could enable prediction of the relevant macroscopic technological property. In practice, this remains complex and requires inputs from a broad set of characterization techniques. For example, electron microscopy is typically unable to detect the smallest defects that also represent the majority of defects induced by irradiation, whereas other techniques display specific sensitivity to a specific and limited subset of defects (e.g., positron annihilation spectroscopy essentially probes atomic vacancies). In this study, the total energy released by defects of different natures is measured, and an attempt is made to correlate the temperature dependence of this signal with specific defects using a broad and complementary range of techniques.
The alpha-doped samples used for this study were synthesized during three distinct campaigns with different objectives. 238Pu-doped UO2 samples, were synthesized in the late 1990s (Rondinella et al., 1999; Rondinella V., 2000; Rondinella V. V., 2000); a second campaign took place in 2018 (De Bona, 2019). Archive (U,Pu)O2 mixed oxide (MOX) pellets with high Pu content were also investigated to assess the alpha damage and their impact on thermo-physical properties.
The first batches of α-doped samples were produced by incorporating 8.8 wt% of an additive containing 66.7 wt% 238PuO2 (half-life of 87 years) in natural UO2 by a sol–gel process (Fernandez, 1999). The other components of the additive were 21.1 wt% of other Pu isotopes, 12.1 wt% of 234U, and 0.1 wt% of 241A.m. A homogeneous solid solution was obtained to produce pellets with a sintered density of 94% of the theoretical value.
The more recent preparation of alpha-doped samples has already been described extensively by De Bona et al. (2020). In brief, a Pu additive containing 53 wt% 238Pu was dissolved in HNO3 and mixed with a uranyl nitrate solution of known concentration to achieve the desired ratios. The two targeted compositions were 2.5 and 10 wt% Pu-doped UO2, equivalent to an actual 238Pu content of approximately 1.25 and 5 wt%, allowing kinetic studies of the radiation damage accumulation. The (U,Pu)O2 powders were then pressed to form pellets in a 5 mm diameter cylindrical die under 738 MPa and sintered at the nominal temperature of 1923 K under Ar – 4% H2 during 6 h. The final disks had average geometrical and Archimedes relative densities of 94.7% and 97.5% of the theoretical density (TD), respectively. The chemical compositions of these samples were assessed by their lattice parameter values measured using XRD and were found to be in excellent agreement with the targeted compositions according to Vegard’s law predictions.
The archive samples were from the TRABANT experiments, originally synthesized for irradiation in the CAPRA program (Picard, 2000); the samples used in this study were prepared by two different techniques. To ensure a homogeneous solid solution of the (Ux, Pu1-x)O2 fuel, the starting oxide powders were prepared by a droplet-to-particle processing technique based on aqueous processes. This technique allows excellent control of composition for multicomponent materials, as each droplet contains precursors with the desired stoichiometry of the final product. The pellet fabrication technique used is a “hybrid” process, combining sol–gel with powder metallurgy. The resulting annular pellets were sintered at 1923 K for 6 h in a slightly reducing argon atmosphere to obtain final O/M ratios of 1.995 (Somers, 1999).
The minor actinide bearing samples, (Pu0.939, Am0.061)O1.81 (PuAm1) and (Pu0.756, Am0.244)O1.72 (PuAm2), from the FUTURE project (Maschek et al., 2008) were obtained by infiltrating porous beads of PuO2-x with americium nitrate solution followed by a calcination step to convert the nitrate to oxide before pressing and sintering. The latter was performed under the appropriate conditions (1873 K over 8 h in a gas mixture Ar/6%H2) to obtain O content corresponding to an average valence of 3.66 for Pu (O/Pu ratio of 1.83 for plutonium oxide) and 3.2 for Am (O/Am ratio of 1.6 for americium oxide). The fuels were sintered in order to sit in the hypo-stoichiometric composition range to reduce cladding corrosion.
The samples described are listed in Table 1, summarizing the dose cumulated at the time of the Cp and/or thermal diffusivity measurements. A short label was introduced to help the discussion of the different types of samples; the damage (expressed in dpa) was assessed from the cumulated alpha-dose following the procedure described in the next section. Whereas the UPu2.5, UPu9 and UPu10 samples were enriched in 238Pu, the TRABANT samples (UPu40, UPu45) consist of a most conventional Pu isotopic composition but with a significant content of 241Am of about 1.5 wt%: therefore, they were more aged. The PuAm1 and PuAm2 samples had also a more conventional Pu isotopic composition, and the main part of the alpha damage was due to the Am.
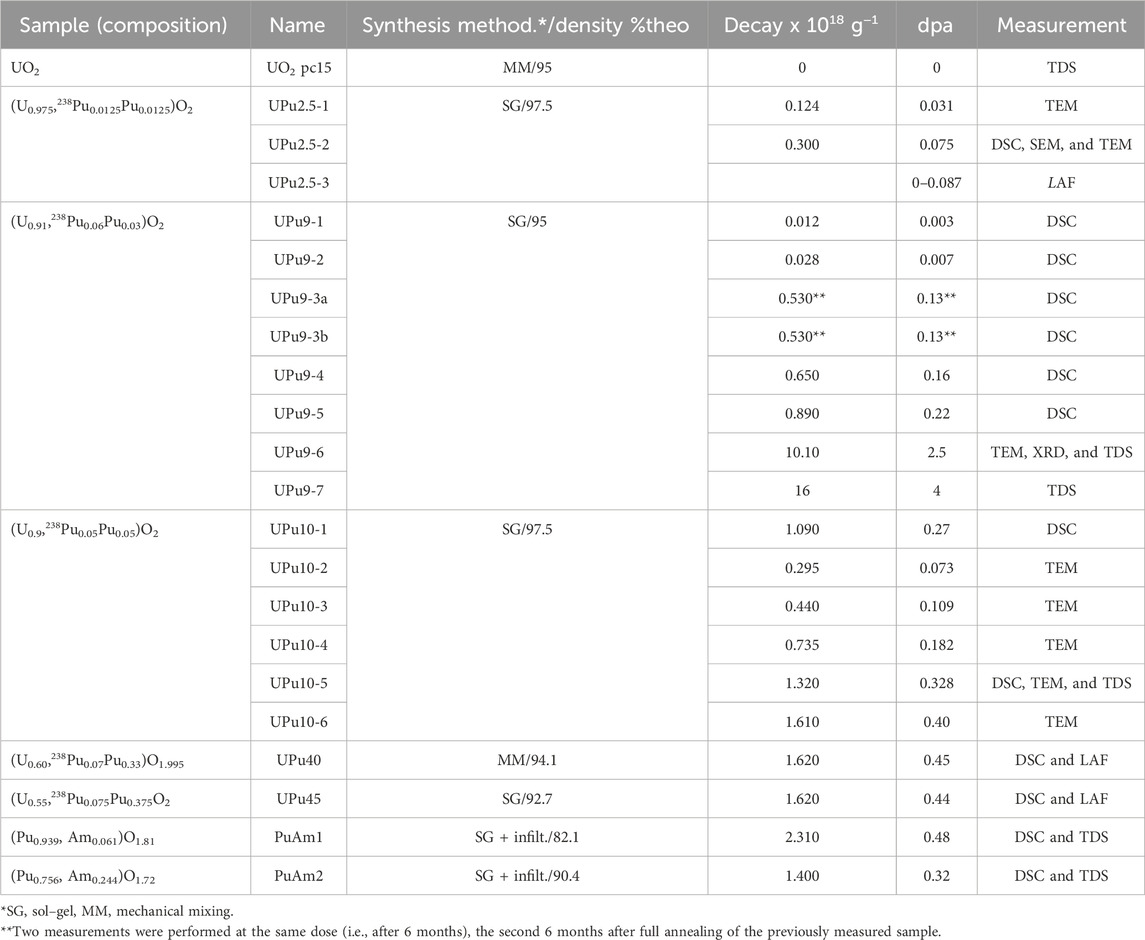
Table 1. Inventory of the samples used in this study. 238Pu is indicated specifically as a main contributor to the alpha-damage accumulated during the experiments. As an indication, 4 dpa would be reached by a spent UO2 LWR fuel of 40 GWd.t−1 after 30,000 years or a high burnup 100 GWd.t−1 LWR fuel after 5,000 years. More corresponding spent fuel damage doses can be found in Wiss et al. (2021).
The samples studied for understanding the helium behavior either contained radiogenic He or He from infusion—samples heated in an autoclave under high temperature and high He pressure (Maugeri et al., 2009).
The total alpha dose cumulated at the time of the experiments was performed using the decay engine of the Nucleonica web portal (Magill and Dreher, 2009), knowing the detailed isotopic composition of our samples. An estimation of the upper limit for the concentration of point defects created by self-irradiation can be directly obtained if the recombination processes are neglected. For instance, the α-decay dose accumulated in the 10 wt% Pu-doped UO2 (UPu9) sample over 6 months is 5.3·1017 g-1, with a corresponding energy deposition rate of approximately 0.1 W cm−3. Each α-particle (energy of approximately 5.5 MeV) creates approximately 66 U displacements (assuming a displacement energy threshold of 40 eV—Soullard and Alamo, 1978) and 140 O displacements (displacement energy threshold 20 eV—Soullard and Alamo, 1978), whilst the 234U recoil atom (energy of 92 keV) creates 295 U and 1180 O displacements as determined by the SRIM code (Ziegler et al., 2010). These values are subjected to slight variations as a function of the alpha energy and corresponding recoil nucleus energy (e.g., for the alpha particle; 5.59 MeV for 238Pu, 5.24 MeV for 239Pu, or 5.49 for 241Am). If damage overlapping and recombination are not considered, the total defect concentrations are 2.0·1020 g−1 for uranium and 7.3·1020 g−1 for O Frenkel pairs. Assuming the atomic density of UO2 is 6.23·1021 atoms·g−1, the displacements per atom (dpa) value is of the order of magnitude of 0.1. In fact, only a small fraction of the defects created is effectively present as point defects at these damage doses and temperature. The majority either recombines or interacts with other defects to form less costly extended configurations, and it is the specific objective of this present study to qualify and quantify their effect on the heat capacity. For actinide dioxides, an equivalence of 1 dpa to 4·1018 day g−1 can be assumed. This is an average value that evolves with the composition of the sample (function of the different energies of the actinides constituting our samples). An absolute value of dpa is not considered here but rather gives a starting number to compare the initial damage produced in our samples related to the decay doses. The various calculation options of SRIM, particularly the number of vacancies produced by initial cascades which in turn are used to calculated dpa, is discussed in Agarwal et al. (2021).
In Table 1, the dpa values are indicated at the time of the various Cp measurements. The total number of displaced atoms is most probably lower than calculated (even considering replacements during cascades). However, the SRIM code generates data commonly used, allowing good inter-comparison of the damage between samples whatever the exact meaning of dpa in such cases (i.e., actinide oxides damaged by alpha-decay). In a gross manner, the labels reflect the basic actinide content for a quick reading in the figures in particular.
As an indication, 4 dpa would be reached by a spent UO2 LWR fuel of 40 GWd.t−1 after 30,000 years or a high burnup 100 GWd.t−1 LWR fuel after 5,000 years. More corresponding spent fuel damage doses can be found in Wiss et al. (2021). The consideration of dpa for irradiated fuel only concerns self-irradiation after the end of irradiation. It is assumed that the fuel after discharge (never observed straight after irradiation) has cumulated substantial damage (in the order of 1 dpa per day for standard fuel or 1,500 dpa after irradiation) but that this damage has been affected by the irradiation temperature and the radiation field (radiation enhanced annealing). The damage value mentioned therefore corresponds solely to the additional damage during cooling and storage and compares well with our samples.
The specific heat was measured by differential scanning calorimetry (Netzsch STA 409 C) using an Ar 6.0 flux (100 mL min−1) and a heating rate of 15 K min−1. The specific heat measurements were performed under slight overpressure of high purity Ar 6.0 gas. No change of stoichiometry took place under these conditions, as checked by the sample weights before and after measurement using a microgram analytical balance. A sapphire disk with a weight of approximately 60 mg was used as reference. The samples used were one or two pieces of disk, with approximately 100 mg total weight.
The relative uncertainty of the specific heat determined by this technique was estimated to be 7%, based on measurements obtained for standard UO2 samples. The apparent specific heat, Cp*, of damaged samples was obtained by applying ascending and descending temperature runs in the range 425–1475 K. The theoretical Cp(T) for the actinide dioxides reported here corresponds to the average of the ascending and descending cycles of ‘‘fresh”, non-radiation-damaged samples (blue curve in Figure 1), effectively canceling out the heat produced by the radioactive decay of the sample. The signal from the first ascending curve carries information about the excess of energy stored into the defects (green curve in Figure 1).
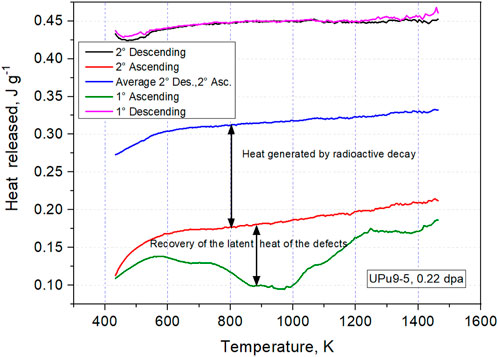
Figure 1. Apparent Cp* obtained by DSC during the first and second temperature cycles for the sample UPu9 (0.22 dpa).
Recurrent characterizations were performed by scanning electron microscopy (SEM) and transmission electron microscopy (TEM). Some samples were investigated after annealing to assess whether morphological changes took place (by SEM) and/or how the microstructure changed during the recovery of radiation damage (by TEM).
Images of (U,Pu)O2 samples were obtained in a Philips/FEI™ XL40 SEM operated at 25 kV, equipped with a SAMx Energy Dispersive X-ray analysis system (EDX). This microscope (high-voltage unit, column, chamber, and turbomolecular pump) is placed inside a glovebox, while the auxiliary components (primary vacuum system, water-cooling circuit, and acquisition electronic) are outside (Wiss et al., 2012).
The TEM analyses of all samples were performed using a FEI™ Tecnai G2 equipped with a field emission gun, a GATAN Tridiem GIF camera for EELS analyses, an Oxford EDX system, and a high-angle annular dark field (HAADF) detector for scanning transmission electron microscopy (STEM) imaging. The instrument was adapted for the examination of actinide contaminated specimens (Wiss et al., 2012). The samples were prepared by crushing a few milligrams of material in methanol in an agate mortar and then, after decanting, dripped over a 400-mesh copper grid coated with carbon.
Release profiles as a function of annealing temperature of the radiogenic He accumulated in the (U,Pu)O2 and (Pu, Am)O2-x samples due to α-decays was performed via Knudsen effusion mass spectrometry (KEMS) (Colle et al., 2014). The apparatus, adapted for the study of actinide-containing materials, was operated with a heating ramp of 10 K min−1.
UO2 samples infused with He were used as benchmark for He behavior in absence of radiogenic damage. The sample infusion methodology is described in Maugeri et al. (2009). Subsequently, the He-infused samples were annealed in a laser-heated Knudsen cell (LKC) to desorb the He, measuring their release rate as a function of annealing temperature using a mass spectrometer (Pfeiffer-vacuum qma 400 quadrupole mass spectrometer) and monitoring the temperature by a pyrometer. The released He gas was collected and measured by a quantitative gas measurement system with its own mass spectrometer (a Pfeiffer-vacuum qma 400 quadrupole-mass spectrometer) by spiking a known quantity of He gas. The details of the set-ups used can be found in Colle et al. (2008) and Colle et al. (2014).
The measurements of thermal diffusivity, α, were performed in a laser-flash device (LAF.I) installed in a lead-shielded glovebox provided with remote manipulators (Ronchi et al., 1999). The sample was heated at the measurement temperature (between 500 and 1,600 K) in a high-frequency furnace under a nitrogen atmosphere of 10−2 mbar. A laser pulse (2 milliseconds) was then applied to the front surface of the sample; the emerging temperature perturbation on the opposite surface was recorded by a photodiode pyrometer (0.05 K sensitivity) provided with an ad-hoc developed log amplifier with a rise time in the order of 50 μs.
The thermogram recorded by a 24-bit digitalizer, T = T(t), consisting of several thousand points, was analyzed using a realistic and accurate mathematical model of the pulse propagation in the sample: thermal diffusivity and various heat losses were calculated by numerical fitting. The measurement of the thermal diffusivity/conductivity on UPu40 and UPu45 samples was done using ascending and descending temperature programs up to approximately 1,600 K. The thermal conductivity was calculated from the measurements of the thermal diffusivity and density, with specific heat data corresponding with Konings et al. (2014) and thermal dilatation data corresponding with Carbajo et al. (2001) for (U,Pu)O2.
The thermal conductivity λ (95%TD) shown in Equation 1 for 95% of the theoretical density (5% porosity) was obtained from the thermal conductivity λ(p) of the sample containing a volume fraction p of porosity by the relation proposed by Brandt and Neuer (1976):
The Cp* was measured over several campaigns, and the samples were measured periodically to cover different damage levels (Table 1). The damage level accumulation expressed in dpa covers two orders of magnitude. The results show that, already at a very low damage level, a measurable effect can be observed on the Cp*, as is evident from the red curve in Figure 2 for 0.003 dpa, which was measured 3 weeks after annealing a (U0.91, 238Pu0.06Pu0.03)O2 sample. The Cp* values are displayed as a function of the accumulated damage (dpa) using a rainbow color code from blue to red for increasing dose, regardless of their composition differences. Nevertheless, this dependence will be discussed below since the magnitude of the various annealing steps might be correlated to the composition of the samples; in particular, to the U/Pu ratio, the presence of Am, and to the O stoichiometry.
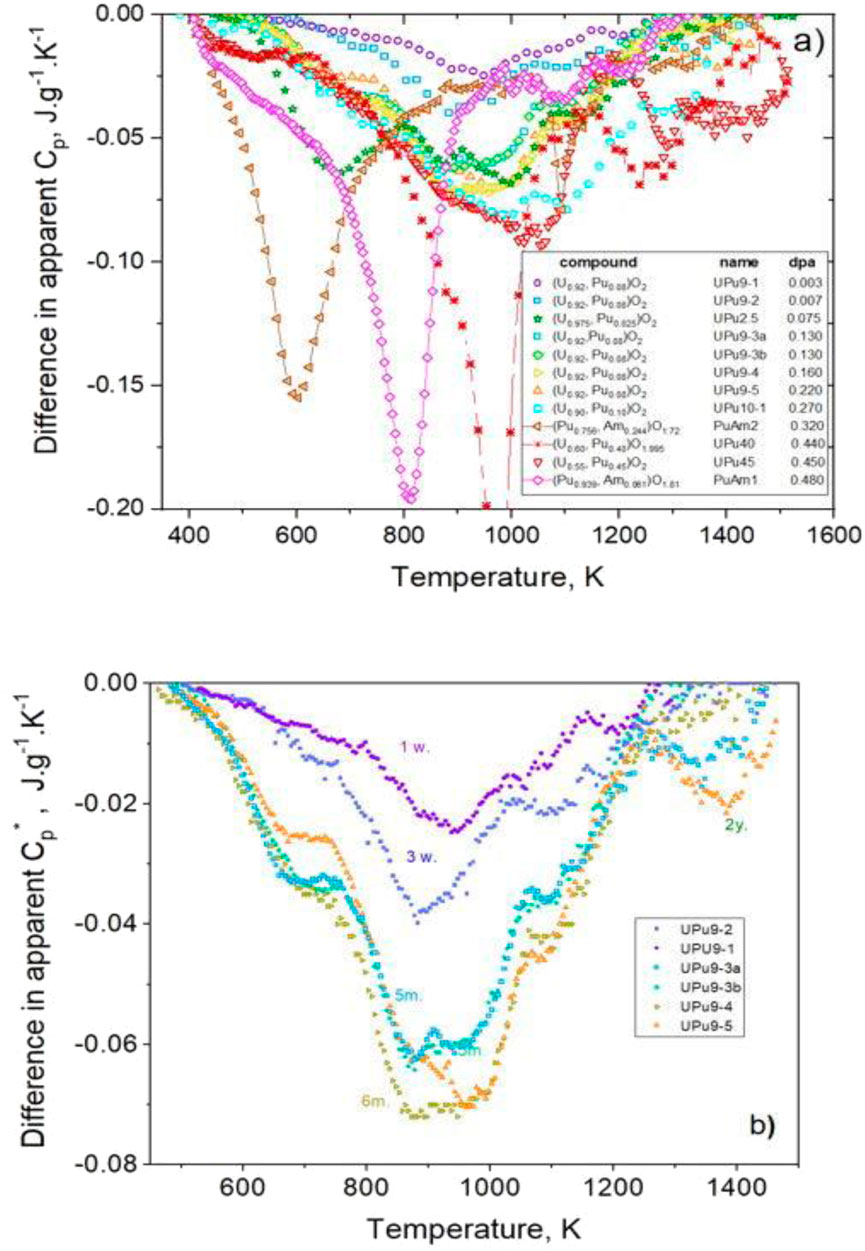
Figure 2. (A) Apparent Cp* obtained by DSC for different samples (see Table 1 for details) and damage levels. (B) specifically shows the sample UPu9 examined after different doses, time and labeled from UPu9-1 to UPu9-5. UPu9-3a and UPu9-3b are the same sample after exactly the same storage time (dose) after annealing for the second.
Figure 2A shows the difference in the apparent Cp* measured for the different samples listed in Table 1 and hence at different damage levels and possibly for different U/Pu ratios or even composition (e.g., with americium). Different peaks in the Cp* curve can be observed: their number and magnitude steadily increase with the damage dose. The total damage accumulated at the time of the Cp* measurements covers almost two orders of magnitude, whereas some further characterizations (microstructure, He-release) were performed over a broader range spanning more than three orders of magnitude. The sample UPu9-3 (0.13 dpa) was measured twice, at exactly the same damage level of 0.130 dpa (green and purple curves in Figure 2A). In this case, the same sample was first annealed and the Cp* evaluated after annealing at 1,700 K; it was re-measured after 6 months, corresponding to exactly the same cumulated alpha-dose (samples labeled UPu9-3a,b respectively). The two Cp* curves perfectly overlap, highlighting that all defects were first fully annealed. The two subsequent processes and radiation damage resulted in an identical Cp* profile; hence, they display same defect natures and concentrations, also meaning that all initially present defects were annealed. Figure 2B specifically shows the sample UPu9-1-5 measured at different times, corresponding to different damage doses. It shows that at very low dpa, after 1 and 3 weeks of storage, a noticeable excess of energy is released during annealing. That takes place in several steps. Increasing damage doses result in an increased total energy release shaping, particularly the various intermediate steps of release. Between 6 months and 2 years of damage accumulation, corresponding to a range of 0.16–0.22 dpa, a new peak in the Cp* curve takes shape approximately 1,300 K, whereas the peaks at lower temperature, approximately 700 K–900 K, decrease in magnitude. The general trend of the set of peaks observed on Figure 2A on all studied samples is summarized in Figure 3.
Figure 3. Apparent Cp* obtained by DSC for seven selected samples representing different compositions, damage, and stoichiometry. Ten peaks have been sketched out in total and are described in Table 2. Simplified defect annealing temperature ranges for actinide dioxides are also indicated, as later described in Table 3.
In Figure 3, five characteristic annealing curves were extracted to show the main differences that were observed as a function of composition, damage level, and stoichiometry. Ten peaks, not necessarily reproducible among the different samples, have been sketched out on the reported Cp* curves. The possible mechanisms of defect recovery associated with each different stage are listed in Table 2, together with the references supporting the different assignments; they are thoroughly addressed in the discussion section.
Table 2. Temperature range for defect recovery/mobility.
In Figure 3, the DSC result of the measurements of the two compositions (De Bona, 2019) UPu2.5-2 and UPu10-1 after 450 days of self-irradiation (corresponding to 0.075 and 0.270 dpa respectively) are compared to a composition of approximately 10 wt% Pu (samples named UPu9-2,5, shown in Figure 2B) and with samples with a higher Pu-content (UPu45). In addition, two Pu-samples with low and high Am content are also included. For the later samples, the damage level was comparable with the UPu45 sample. Table 2 summarizes the defect-annealing stages that have been tentatively associated with each peak. It is worth remembering that the position of the peak centroid is a good parameter for peak identification purposes, but the physically meaningful temperature is the maximum intensity point, which corresponds to the maximum reaction rate of the relevant quasi-chemical equation that describes defect recombination. Remarkably, the UPu2.5-2 and UPu10-1 samples released significantly higher energy than the others, mostly in the 1,000–1,300 K range. This discrepancy can be due to the subtraction of the self-heating effect, which is performed manually by the operator during the data analysis phase. A small change in the slope of the Cp corresponding to a defect-free lattice (obtained by the average of the ascending and descending curves of the annealed, as depicted in Figure 1) can result in such an artefact. In general, a qualitative trend can be observed, with the point-defect concentrations increasing up to approximately 0.125 dpa before saturating, when they associate and contribute to extended defect signals.
For the FUTURE samples (PuAm1, PuAm2) annealed (i.e., without auto-irradiation damage annealing effects), the shift between the apparent and real specific heat is more than three times higher for (Pu0.756Am0.244)O1.72 than for (Pu0.939Am0.061)O1.81, agreeing with the ratio of the Am contents. The Pu isotopic vector is 239Pu and 240Pu (half-lives of 2.4⋅104 and 6,540 years, respectively) for 99.8 wt% of the Pu inventory, while the Am is mainly 241Am (half-life of 432 years). Therefore, the internal heat production is proportional to the Am content. The specific heat measurements shown here were corrected accordingly.
The impact of the samples’ hypostoichiometry on the measured specific heats was estimated using the data of Duriez et al. (2000) for the specific heat of O2, and the maximum relative impact (4%) was found for the (Pu0.756 Am0.244)O1.72 sample. This impact is below the uncertainty for the specific heat measurements.
The total energy released during the annealing of the samples was assessed from the areas of the curves. The energy released was approximately 35 J g 1 for the UPu2.5-2 (0.075 dpa) and 43 J g 1 for the UPu10-1 (0.27 dpa) sample of Figure 4. In Figure 3, the first peak in the range 450–530 K appears for the sample with 0.27 dpa, and its magnitude increases with dpa—for the two TRABANT samples (UPu40, UPu45) with 0.4 dpa. The stage that is observed on the sample UPu2.5-2 at a temperature approximately 680 K (stage III) is peculiar and is most probably associated with a large difference in defect mobility in the two systems (O and U); therefore, the samples with higher activity could experience easier and quicker defect recombination. This is confirmed by the stages at 900 and 970 K (stages V and VI in Figure 3) observed for the UPu2.5-2 (0.075 dpa) and UPu9-5 (0.22 dpa) samples that have higher damage but a smaller peak around these stages. In addition, for the sample with the lower Pu content, it could be speculated that more interstitial O could be present, implying a higher magnitude of stages I–III. During stages III–VI, the total energy release from sample UPu2.5-2 is clearly higher than those of samples with comparable or even higher dpa (UPu9-3a,b with 0.130 dpa or UPu9-4 with 0.16 dpa) (Figure 4). These different stages are not necessarily entirely specific in terms of underlying mechanisms and associated species: therefore, besides their individual reporting in Table 2, they are grouped into the categories listed in Table 4.
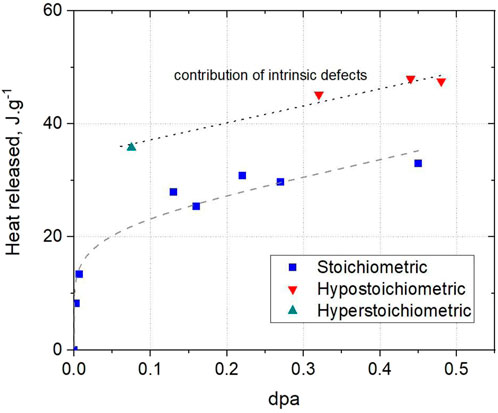
Figure 4. Total heat released by defect annealing as a function of alpha-damage dose (dpa) of the samples listed in Table 1. The blue squares are for stoichiometric samples, the green triangle for hyperstoichiometric, and the red triangles for hypostoichiometric samples. The dotted line is a guide for the eye to delineate the potential contribution to the released heat from intrinsic defects due to non-stoichiometry.
When assessing and fitting (blue dashed curve in Figure 4) the quantified energy release, it appears clearly during defect annealing that non-stoichiometric compounds have an excess of stored energy compared to the stoichiometric ones. The contribution of O defects is in that later case evident on the Cp* curves, like in Figure 3. This shows that the deviation from stoichiometry results in intrinsic defects in the fluorite structure correlated to the level of deviation from stoichiometry.
In UO2, thermal conductivity is dominated by the phonon transport. Any irregularity in the lattice resulting in a displacement of anions or cations from their original lattice position, such as radiation-induced point defects, acts as a phonon scattering center. As self-irradiation proceeds, more defects are introduced into the lattice, and hence the phonon mean-free path between two scattering centers becomes shorter. This directly affects the thermal conductivity of the material.
The measurements on UPu40 and UPu45 samples were performed up to approximately 1600 K on both heating and cooling. Two very early recovery stages at 450 K and 530 K are observed in the Cp* curve (Figure 3) for the two TRABANT samples, UPu40 and UPu45, with high Pu-content (and higher damage) or for the sample with 10 wt% Pu but with the higher damage. It can be speculated that stages I and II involve O defects, as will be discussed below.
The thermal conductivity measurement results (open circles) are shown in Figure 5. They are interpolated (dashed lines) with the 1/(A + BT) equation; the A and B coefficient values are reported on the graph in Figure 5.
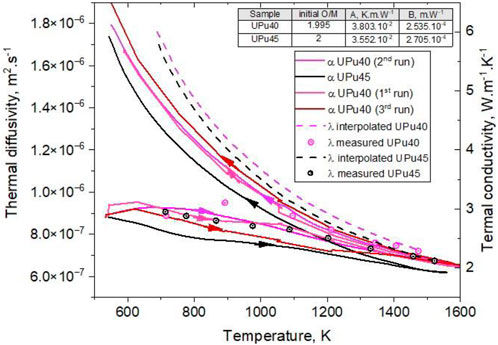
Figure 5. Thermal diffusivity and conductivity (interpolated for the ascending curves) of samples UPu40 and UPu45 (0.4 dpa) during a temperature ascending to 1,600 K and descending annealing (after defect annealing). The thermal diffusivity for the first three runs of UPu40 shows no changes observed between ascending and descending scans after the annealing.
The relative uncertainty about the thermal conductivity values is estimated to be 8%, resulting from the uncertainties of 6% on the thermal diffusivity, 5% on the specific heat, and 1% on the density.
The thermal diffusivity measured during the first ascending temperature run is significantly below the results obtained after annealing at the highest temperature at 1,600 K (Figure 5). This effect is due to the recovery of alpha self-irradiation damage accumulated in the samples during storage and also to the oxidation of the hypo-stoichiometric samples from the original O/M to stoichiometry (particularly for UPu40). A second measurement run was performed up to the maximum temperature; for this second run, no significant difference was observed between the results obtained during the ascending and descending temperature scans.
Thermal diffusivity was measured on the UPu2.5-3 sample as a function of damage (dpa). This (U,Pu)O2 sample was stoichiometrically prepared. Previous measurements under these conditions have shown that the stoichiometry of stoichiometric MOX samples is not modified during the thermal diffusivity measurements under near-vacuum nitrogen. The thermal diffusivity (conductivity) decreased by about 40% already in the first 150 days, which corresponds to a cumulated damage of 0.03 dpa—in good agreement with Staicu et al. (2010). Figure 6 shows the relative decrease of the calculated thermal conductivity (measured on the sample at 550 K and corrected for 95% TD) and the derived phonon mean free path. The mean free path was calculated from the measured data using Equation 2.
—where k is the thermal conductivity [W·m−1·K−1], cV is the volumetric heat capacity (J·K−1·m−3), v is the speed of sound in UO2 [m·s−1], and l is the mean free path [m]. The measurements were performed above the Debye temperature for UO2 (377 K), hence the heat capacity can be considered independent from T.
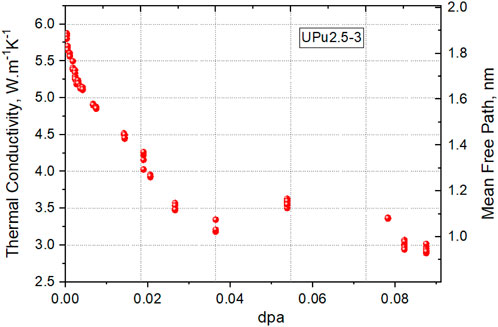
Figure 6. Thermal conductivity of the UPu2.5-3 sample and phonon mean free path scale (right) as a function of damage expressed in dpa. The thermal conductivity was measured at 550 K and corrected for 95% TD, for the sake of consistency with the literature.
A saturation in the thermal conductivity decrease with increasing dpa can be observed. This saturation is linked to the saturation of the radiation damage point defect concentration, which is due to the decreasing distance between vacancies and interstitials when the concentration increases, leading to recombination. Dislocation loops have very limited effect on thermal conductivity. A further increase in the concentration of dislocation loops might have a very small decreasing effect on the thermal conductivity, but at the same time, as dislocations are sinks for the point defects, fewer point defects are present in the material, with a positive effect on the thermal conductivity.
TEM investigations were performed periodically on the samples to examine the damage evolution during storage. Figure 7 shows a series of TEM micrographs recorded on several samples in a range between 0.031 and 0.4 dpa.
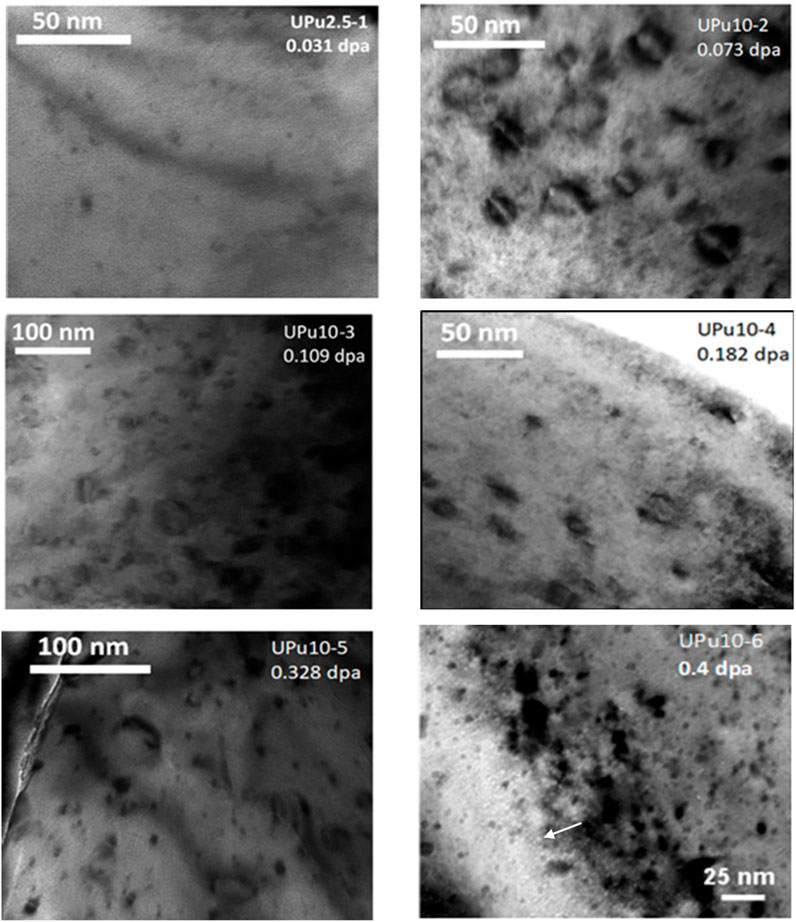
Figure 7. TEM micrographs of alpha-damaged samples at different dpa, as indicated in the images. The days and dpa are not correlated since the samples examined are of different activities (UPu2.5-1 top left and UPu10-2-6 others). Note the different scale bars. The arrow in the lower right image points to a He bubble (white spots in the image in under-focused).
The main observable defects are dislocation loops, as previously observed, for example, in Wiss et al. (2021), Wiss et al. (2014), Talip et al. (2014a), Wiss et al. (2013a), and De Bona et al. (2021), which appear at very low dpa at 0.031 dpa. The concentration and size of the loops increases with damage rate. At the highest dpa level reported here, nanometric He bubbles also become visible (white arrow in the lower right image of Figure 7). The concentration of the loops was not assessed in this series of micrographs since the tilting conditions (single tilt holder) did not permit measurements in a two beam conditions.
The TEM picture of the UPu2.5-1 sample aged 170 days (0.031 dpa) corresponds roughly to the saturation time for the thermal conductivity described in the thermal diffusivity/conductivity section (see Figure 6, where the thermal conductivity of the UPu2.5-3 sample and phonon mean free path scale (right) is a function of damage expressed in dpa). The thermal conductivity was measured at 550 K and corrected for 95% TD, to be consistent with the literature.
The SEM analysis in Figure 8 shows that no grain growth took place until 1,100 K, while the sample annealed at 2,100 K clearly shows pronounced grain growth as expected (Talip et al., 2014a). The SEM images also show that the samples are dense, with little porosity visible on the images.
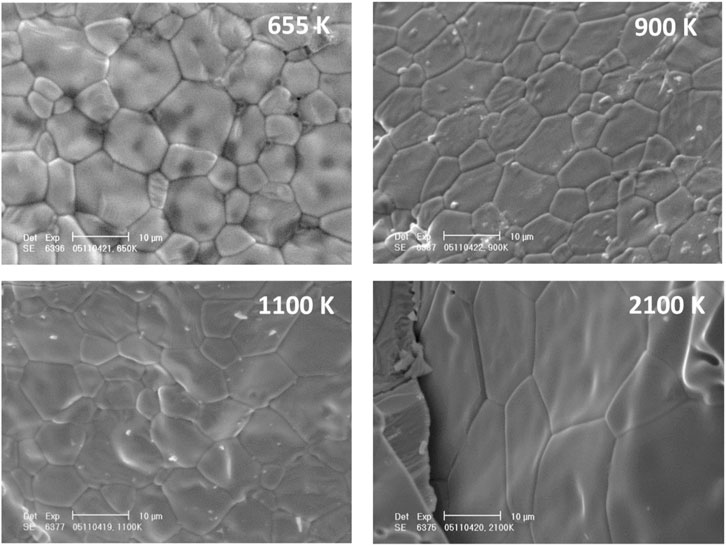
Figure 8. Secondary electron image of the UPu9-6 sample with 2.5 dpa after four annealing steps, as indicated in the images. Note that the sample after annealing at 655 K is representative of the one stored at room temperature.
The SEM images also show that the samples are dense, with little porosity visible on the images.
Figure 10 shows four typical He release curves in the temperature range of 400–2,000 K. The release at 0 dpa corresponds to a sample in which He was introduced by infusion (Maugeri et al., 2009; Talip et al., 2014b; Cognini et al., 2018), so no defects were present in except intrinsic ones. The He solubility in UO2 is very low, and He atoms are typically inserted at the octahedral site of the fluorite structure (Garrido et al., 2004). Although the onset for He release starts at a lower temperature (500 K), the main release peak is observed at 1,200 K (the absolute magnitude is about 100 times smaller and the curve was rescaled to show the details of this release).
The second curve in Figure 10 for 0.32 dpa corresponds to a sample UPu10-5 for which a TEM image is also shown in Figure 7 (at 0.328 dpa). In that case, the release of He starts at 1,000 K and peaks at 1,100 K, corresponding to stage VII in Figure 3. In this sample, a large quantity of defects is present, either visible as dislocation loops or not visible in TEM, like point defects. However, thermal diffusivity shows saturation before this value of damage (Staicu and Wiss, 2011), it was recently shown that the lattice parameter of these samples reaches a plateau at approximately 0.4 dpa; at the same time, the micro-strain decreases (De Bona et al., 2021), as also previously reported (Turcotte and Chikalla, 1973; Kato et al., 2009a) and in agreement with our microstructure observation of extended defects.
The third curve in Figure 10, for a damage of 2.5 dpa (UPu9-6), shows a shift of onset temperature for He release that is attributed to the change of the nature of He-defect associations. With increasing alpha damage, the formation of voids and their possible interaction with He atoms can already be seen in Figure 9 for the sample with 0.4 dpa (UPu10-6). Wiss et al. (2021) on the microstructure of alpha-damage actinide fluorite materials evidences the formation of dislocation loops and He bubbles at damage levels close to 2.5 dpa. Moreover, He bubbles are already observable in Figure 7 and at 4 dpa in sample UPu9-7 (Wiss et al., 2021).
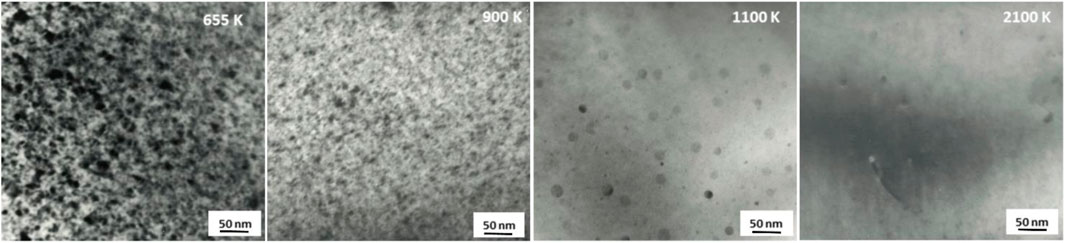
Figure 9. TEM micrographs of a 2.5-dpa sample (UPu9-6) taken after various annealing temperatures.
He release profiles during annealing are not presented for an in-depth discussion of the associated release mechanisms since the damage level, composition, and stoichiometry of the samples evidently contribute to the different onset for release observed. However, the correspondence of an excess of heat release observed during the Cp* measurements (in particular during stages VIII, IX and X—Figure 2A and Table 2) can be directly correlated with the observed He-release stage. We note again that the magnitude of He release in Figure 10 was normalized. The background information on He diffusion in alpha-damaged samples, addressing stoichiometry, solubility, and damage effects, can be found in Wiss et al. (2014), Talip et al. (2014a), Talip et al. (2014b), Wiss et al. (2015), Weber et al. (2019), and Wiss et al. (2013b). From the results published in the previously cited references, the range for the onset of He-release is highlighted (occurring in the range of 850–1,200 K as indicated by the dashed box), but in several cases the initial release is followed by a second step typically starting approximately 1,400 K and which is also visible in Figure 10. This second release is also connected to the Cp* (Figure 2).
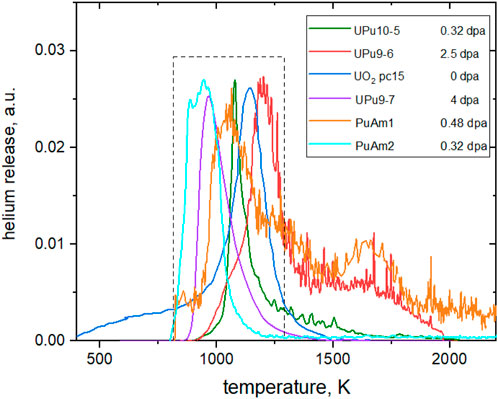
Figure 10. He release from six different samples. The normalized scale does not reflect the quantities of He but rather the characteristic temperatures for release onset and release peaks. The dashed rectangle delineates the temperature range for the main He-release peak.
In order to differentiate the different defect contributions from the Cp* measurements, a (non-exhaustive) review was performed to assess the nature of defects generated in UO2 or more generally in actinide dioxides by various means (implantation, doping, self-irradiation, modeling work, thermodynamic calculations).
In a second part of this discussion, the annealing behavior of such compounds will be used for comparison with our specific Cp* measurements.
Not only the temperature onsets but also the relative intensity of the peaks in the plots shown in Figures 2 and 3 are very different between the various samples studied. This effect can be related to the clustering of defects and to the different compositions. This difference in composition may also impact the stoichiometry and therefore the nature of defects as well as their mobility.
The problem of the behavior of the crystal defects induced by irradiation in spent fuels is complex, but some guiding principles can be gained by comparing to the behavior of defects in the pristine systems. In fluorite-related systems, a close and robust relationship exists between the nature of the atomic defects and the fundamental disorder of a crystal. For example, in reducing conditions, defects with an effective positive charge must be created to balance the negatively charged electrons. In a fluorite system, like UO2 or PuO2, anion vacancies are formed. PuO2-x is indeed an interesting system where significant O vacancy concentrations can be accommodated within the fluorite-structured crystal, as in the case of the (Pu, Am)O2-x system. The anion-deficient organization has consequences for the mass transport and thermodynamic properties of this system. Interestingly, the anion-deficient dioxides of actinides display very high anion mobility, and some of them are categorized as superionic conductors. A detailed description of the local organization of many of these actinide systems is still missing, but in an analogy with the works of Kang et al. or of Bevan et al. (Fouquet-Métivier, 2022; Sabathier et al., 2014) on lanthanide systems (CeO2-x, PrO2-x), it is believed that the actual basic organization of these vacancies is dominated by a cluster consisting of two O vacancies at the opposite ends of a body diagonal in one of the anion cubes of the fluorite structure—a configuration well-documented, for instance, in bixbyite and iota structures. This vacancy dimer is presumably stabilized by nearby trivalent ions. This structural defect is typically associated with electronic localization (polaron) (Debelle et al., 2011; Rondinella et al., 2003) because the self-trapping of the charge is favored by lattice relaxation due to the high polarizability of the ionic species of these structures. This disrupts a simple band theory description of these systems. There is evidence that, as soon their concentration is significant (low %), these clusters order and create superstructures extending over nanometric correlation lengths. Actually, in fluorite systems, the mass action law shows that cation interstitials can only exist as part of Frenkel-type defects, though cation Frenkel energies are generally significantly higher than vacancy formation energies in fluorite systems (Table 3). In oxidized systems, near a stoichiometric composition, point defect structures still dominate.
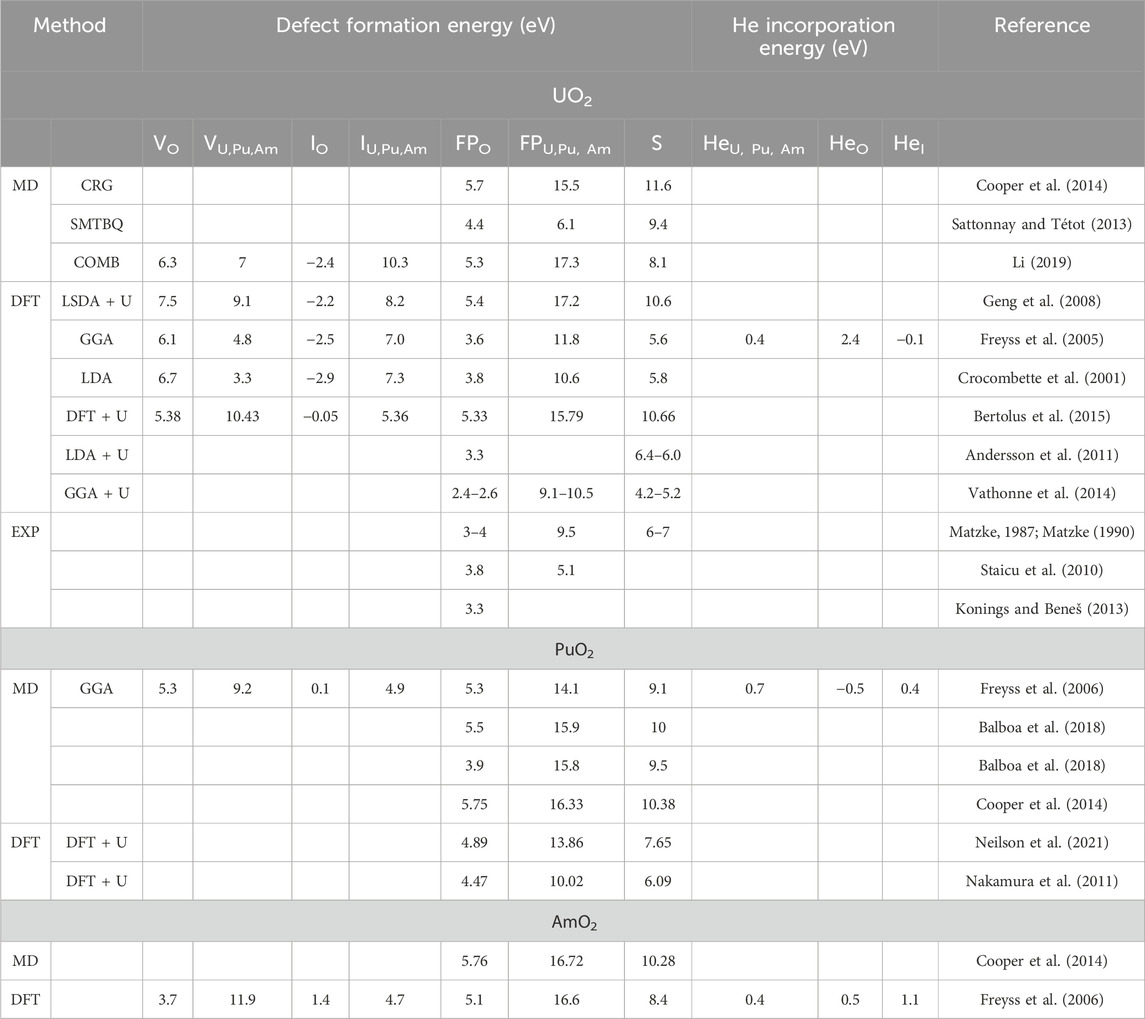
Table 3. Defect formation and helium incorporation energies for pure actinide dioxides obtained by different modeling methods and experimental values when available.
Initially, most generated point defects remain as individual defects, and the contribution of interstitial/vacancies grows more quickly than that of extended defects. After a certain threshold, the reorganization of defects into loops and voids becomes more and more significant, causing the contribution of extended defects to grow at the expense of point defects. This possibly takes place with different kinetics, depending on the specific compositions: in the case of the UPu10 samples, the self-heating effect largely boosts the overall defect migration, while for the UPu2.5, the effect is weaker. It is also likely that the defect mobility in these two systems is quite different, suggesting that the samples with higher activity could experience faster defect recombination and association, although this is not evident from some characterizations like XRD or hardness measurements for which the lower activity samples had/have not reached saturation of the measured parameter (e.g., lattice parameter, Vicker’s hardness) (De Bona, 2019; Rondinella et al., 2007). The energy release, in different temperature ranges, will be discussed in the next sections, linking it to real-space characterizations and to property changes specific to the different annealing stages.
In addition, the stoichiometry of the samples might affect the defect mobility; hence, their possible recombination does not necessarily indicate that intrinsic defects may contribute to the annealing behavior. This aspect is particularly relevant for samples with higher Pu content or with Am containing samples which might more promptly deviate from stoichiometry.
The O interstitials and the U, Pu, and Am vacancies saturate with increasing storage time while the extended defects and the large cavities do not. This leads to the important conclusion that the point defect concentration increases with sample aging—that is, it saturates with radiation damage accumulation and between 6 months and 2 years of aging (for these specific samples, i.e., UPu9 and UPu10). Instead, the concentration of the extended defects—voids, loops and bubbles—does not achieve saturation. This can be presented in the following Frenkel-like scheme:
—where, according Kröger and Vink’s notation (Kröger et al., 1956),
Actinide oxides are seldom stoichiometric, with an oxygen-to-metal ratio (O/M) equal to 2. Among the samples investigated in the present study, only PuAm2 (O/M = 1.72), PuAm1 (O/M = 1.81), and to some extent UPu40 (O/M = 1.995) showed a significant deviation to the ideal stoichiometry with a deficiency in O. In the calorimetric measurements, these samples are the only ones to exhibit a peak at low temperature (∼600 K for PuAm2, ∼800 K for PuAm1 and ∼950 K for UPu40) with a large magnitude compared to the other peaks observed in the other samples (Figure 2A). These peaks correspond to a large excess of energy released during annealing.
This peculiar behavior could be attributed to intrinsic and/or radiation damage defects as well as phase transitions. As these peaks at low temperature are observed only in hypo-stoichiometric samples, it can be assumed that intrinsic defects and/or possible related phase transitions are responsible for this behavior. Moreover, the temperature at which the excess energy release occurs decreases with the deviation from the ideal stoichiometry. Thus, it seems to be correlated with the O/M ratio and not primarily with the dpa level.
The PuAm2 and PuAm1 samples with a low O/M ratio probably contained a secondary phase. According to the phase diagram on the Pu–Am–O system, below ∼600 K, the samples would comprise a mixture of a fluorite (Pu,Am)O2 and a sesquioxide phase (Pu,Am)2O3. Above ∼600 K, a phase transition could occur, resulting in the disappearance of the sesquioxide phase and the formation of a bcc phase (Pu,Am)O1.61 (called bixbite).
However, Fouquet-Métivier (2022) investigated (Pu,Am)O2-x samples containing 20%, 50%, and 80% Am, showing that the as-fabricated samples (∼15 years ago) with a O/M ratio close to 2 were reduced, reaching a O/M ratio of about 1.94. Moreover, the characterization by XRD evidences the formation of a secondary fcc (fluorite phase) in addition to the fcc matrix. This decomposition of the mixed oxide, initially single-phase constituted, could be induced by radiation effects. A large deviation from Vegard’s law has been observed too, which could be explained by both swelling induced by alpha self-irradiation and by the reduction of the samples.
Another peculiarity in these mixed oxides is disorder on the cationic site. Fouquet-Métivier (2022) showed by XANES measurements that in a sample of (Pu,Am)O2-x with 20% Am and a O/M ratio of 1.94, Pu exhibits both Pu4+ and Pu3+ oxidation states and Am is present as Am4+ and Am3+. This cationic disorder may be associated with the formation of a large quantity of O vacancies.
To conclude, the peak observed at low temperature in the (Pu,Am)O2-x samples (PuAm1 ad PuAm2) could be attributed to several coupled phenomena: a phase transition (from 2 fcc phases to either a single fcc phase or to a mixture of a fcc phase and a (Pu,Am)O1.61 phase) and the oxidation of the samples from (Pu,Am)O2-x to (Pu,Am)O2 in case the atmosphere contains enough O. Indeed, the fact that both Pu and Am are present with a mixture of 3+ and 4+ oxidation states with associated O vacancies might enhance the diffusion of O.
For the sample UPu40, the initial O stoichiometry is close to 2 (O/M = 1.995). However, the O/M could have changed with time. With such a high Pu content, a secondary phase could have formed if the sample was reduced—either a secondary fcc phase with a low O/M ratio or a bixbite phase (U,Pu)O1.61. Moreover, the co-existence of U3+, U5+, Pu3+, and Pu4+ has been identified by Fouquet-Métivier in this sample even when the O.M ratio is close to 2.
Thus, the same kind of phenomena could have occurred in the UPu40 sample with a less pronounced effect, as the O stoichiometry is probably lower and the radiation effects are lower than (Pu,Am)O2-x samples.
A dedicated investigation of the effect of O stoichiometry is required to understand and explain the observed peaks at low temperature in hypo-stoichiometric samples.
Various techniques will only provide information on visible defects in accordance with their resolution. These can be by direct observations (TEM) or indirectly by considering the physical processes responsible for properties’ determination (e.g., XRD, thermal diffusivity, etc.).
As an example, two recovery stages were observed for the thermal diffusivity in the UPu2.5-3 sample at 800 and 1,050 K, attributed to O interstitial and U vacancy migration, respectively (De Bona, 2019). The evolution of heat capacity during thermal annealing confirmed that the alpha damage is recovered during these two stages. Looking more carefully, there are indeed three stages that can be distinguished in the thermal conductivity decrease, which can be related to three different stages of radiation damage build-up in the matrix. As can be seen from Figure 6, at the very beginning of self-irradiation (dpa ≤0.0025), the thermal conductivity decrease is very abrupt but, in the following 0.1 dpa accumulation, the further decrease is much slower. In the first phase, the matrix starts to be populated with point defects in a non-uniform way. As self-irradiation proceeds, more point defects are created, resulting in a more homogeneous distribution in the matrix. At this point, the contribution of each single point defect further added to the matrix decreases; consequently, the thermal conductivity is less affected. However, the concentration of point defects is still relatively low, and clustering into extended defects occurs only sporadically. New point defects which are introduced in the structure still mostly remain and contribute to lattice cell swelling and decrease the phonon mean free path. Finally, once approaching 0.035 dpa, the concentration of point defects is such that clustering into extended defects becomes quite likely. As point defect generation is equalized by recombination, the decrease in the thermal conductivity gradually saturates (De Bona et al., 2020). The formation of dislocation loops was indeed observed at 0.031 dpa in sample 2.5-1 as shown in the Figure 7 TEM image.
For UPu-9, the exothermic effect due to damage healing began at 650–700 K and ended at approximately 1,150 K (Figure 2). Under the chosen thermal annealing conditions, the intensity of this effect was very high, the apparent Cp* being up to 50% lower than Cp, and the total released energy approximately 40 J·g−1.
In order to assign the observed peaks in the Cp* measurements to defect recovery, it is necessary to have an accurate description of the observed defects as a function of the damage rate and to their thermal recovery.
Indeed, in the case of TEM studies that are capable of resolving extended defects, Sabathier et al. (2014) studied the microstructure of UO2 thin foils irradiated with 4 MeV Au-ions at RT. Cavities were detected from 5.7·1012 ions·cm−2. Their size (Ø 0.9 nm) does not evolve over the entire range of fluences (from 1.3·1012 to 2·1014 ions·cm−2). The cavity density increases with the fluence and levels off at 4.5·1023 m−3 for a fluence of 1·1014 ions·cm−2. They concluded that these nanovoids act as precursors for insoluble element segregation in oxide fuels, which in our case could explain the heterogeneous precipitation of He. This later aspect will be also discussed on the self-irradiated samples.
The origin of strain and stress build-up in 20-keV He-implanted UO2 was studied by Debelle et al. (2011) and was attributed to the formation of both self-interstitial defects and small He-vacancy clusters. The formation of extended defects arising from a self-reorganization process of interstitial defect clusters and inducing a plastic relaxation appears to be the most likely mechanism to account for observed strain relief. This study also supports the existence, in the case of the alpha-doped UO2 samples of our study, of such He-defect clusters.
Past studies on α-doped fuels (Wiss et al., 2014; Rondinella et al., 2003) report the independence of the properties’ evolution on the kinetics of damage to the matrix, even in the case of two orders of magnitude of difference in the activities of the samples involved. In these studies, properties such as Vickers hardness and lattice parameter swelling were monitored on α-doped UO2 samples, showing no dependence on the samples’ activity or composition. These studies concluded that, within limited ranges of dopant concentrations (i.e., up to 10 wt% Pu in UO2), the evolution of microstructural defect populations and macroscopic properties is not affected by the rate at which the corresponding levels of damage are injected. A similar conclusion was drawn recently by De Bona et al. (2021). However, Rahman et al. (2019) have recently shown that more damage is observed with higher Pu content. It should be noted that in De Bona et al. (2021) and Rondinella et al. (2007), the ratio between U and Pu was respectively 4 and 100. Although continuity was observed for property changes—lattice parameter and Vicker’s hardness with increasing dose—the low Pu content samples have not been measured until properties saturate. As mentioned before, and in particular in the assessment of the energy dissipated during annealing of defects, a contribution of intrinsic defects cannot be excluded, in particular in hypo-stoichiometric samples (e.g., larger content of Am or Pu).
Weber found no direct information to associate a defect with each recovery stage in damaged UO2 or PuO2 but attributed the first stage to O migration, the second stage to U (Pu) vacancies, and the third stage to the release of He trapped in vacancies (Weber, 1984). Despite the large difference in the relative lattice expansion data between α-particle- and fission-irradiated UO2 crystals, Weber emphasized this situation (Weber, 1981), agreeing with Nakae et al. (1979) on the recovery procedure, where the α-particle- and fission-irradiated UO2 crystal recovery procedures were similar. Further discussion and investigation have been considered, but their hypothesis is still valid for some actinide oxides. Indeed, for Kato et al. (2009b), the change in lattice parameter was formulated as a function of self-radiation dose. Three stages in the thermal recovery of the damage were observed in temperature ranges of below 673 K, 673–1,073 K, and above 1,073 K. The activation energies in each recovery stage were estimated to be 0.12, 0.73, and 1.2 eV, respectively, and the corresponding mechanism for each stage was considered to be the recovery of the anion Frenkel defect, the cation Frenkel defect, and a defect connected with He, respectively (Table 2).
Several studies have considered the nature and recovery of radiation damage in UO2 or other actinide dioxides, particularly damage by alpha decay. The studies include irradiated fuel, accelerator implanted/irradiated samples, and self-damaged actinide dioxides. Table 2 compiles observations made by several authors in correlation with the various peaks we observed in our experiments depicted Figure 2.
Nogita and Une (1993) observed thermal recovery of the lattice parameter occurring at 920–1,120 K for the low burn-up fuel and at 720–920 K for the high burn-up fuel with one stage. This difference in point defect recovery was suggested to result from differences in fuel temperature at the end of irradiation and as-fabricated grain size. At temperatures above 1,125 K, the point defects were almost completely recovered (Nogita and Une, 1993).
Onofri et al. (2020) and Weber et al. (2019) observed changes in void density and size with respect to temperature, damage (from Au), and gas atoms (Xe) by using ion 4 MeV and 390 keV Au and Xe irradiations, respectively, coupled with TEM characterizations. The irradiations were performed at 90–1270 K. Nanovoids were observed at very low temperature (90 K) and fluence. Void nucleation is described as a heterogeneous process since new voids are the direct consequence of the interaction of energetic ions with the lattice without involving diffusion of point defects and gas atoms. In the studied fluence range, no effect of irradiation temperature and xenon atoms on void size or density was highlighted. The change of void density and size with damage is the same regardless of the irradiation conditions. This confirms that ballistic effects monitor void changes in case of ion irradiations. With increasing damage, void density increases sharply and then saturates at 3–4·1013 i.cm−2, corresponding to 0.2–0.3 dpa.
Onofri et al. (2020) used in situ TEM to study the temperature effect on dislocation behavior in pre-irradiated polycrystalline UO2 foils. The samples irradiated with 4 MeV Au-ions at 90, 300, and 870 K and fluences of 0.5, 5, and 10·1014 Au.cm−2 showed a first annealing stage occurring between 770 and 1,270 K. When only dislocation loops are initially present due to low temperature and fluence irradiation, a second set of small dislocation loops (diameter <5 nm) was observed approximately 770 K. This could be attributed to point defect recovery on sinks such as dislocations. When both dislocation lines and irradiation loops are initially present, heavy line rearrangements by slip took place, particularly approximately 1,070 K. Then, whatever the initial irradiation conditions, a second annealing stage corresponding to the extended defect recovery was observed above 1,270–1,370 K. Both dislocation loop and line densities decreased with increasing temperature. These two studies reveal some possible mechanisms associated with defect recovery as observed in our samples, particularly the associated temperatures ranges. The formation of nanovoids, for example, has to be correlated with the precipitation of He, whereas the annealing of dislocations highlights the mobility of atoms that support the associated diffusion of He (as observed in the He release curves).
In this study, we performed annealing on the UPu9-6 sample after 2.5 dpa. As shown in Figure 11, lattice parameter recovery occurs in three steps (Weber, 1984; Kato et al., 2009b), as well as the thermal diffusivity (here represented via the A coefficient) which is associated point defect recovery. The He release peak is also indicated in this graph in Figure 11 and corresponds well with the temperature range for He defect recovery (Table 2).
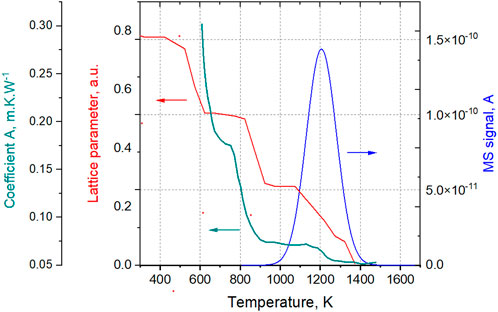
Figure 11. Lattice parameter, thermal conductivity A-coefficient, and He release signal for the alpha-damage sample UPu9-6, showing the recovery stages and He-release peak.
Several studies performed since the early 1970s on alpha self-damaged actinide dioxides have assessed the changes in properties related to the nature of the defects created. Annealing studies have contributed to a better view on the nature of these defects and their recovery as a function of temperature. Roof (2019) showed that the effects of self-irradiation on the lattice of 238(80%)PuO2 confirmed the predictions derived from previous observations that the lattice constant continues to increase with time but at a slower rate, indicating an approach to equilibrium. Very small reductions are also noted in the half-width of the diffraction lines (Roof, 2019).
In order to assess the nature and quantity of the defects produced by radioactive decay (in our case by alpha decay), a series of published data using various modeling tools is presented in Table 3. The stability of defects but also their migration must be evaluated to predict several parameters of the microstructure evolution of a material, particularly during annealing as reported in this study. Formation energies of defects govern the total amount of defects that are present in a solid; for impurities (He here), it also indicates which configuration is the most stable. Indeed, a second important property of defects is their migration energy, which governs atom diffusion through the lattice—hence the defect recovery for both cationic and anionic sub-lattices (Govers, 2008).
The scope of this paper is not to review the formation energies of the various defects present in the different actinide oxides. In particular, formation energy might vary substantially as a function of the stoichiometry (composition). This is the case for the formation of O vacancies in hypo-stoichiometric samples or interstitials in hyper-stoichiometric samples. It is, for example, reflected in Figure 4 by the excess of heat released during annealing of the non-stoichiometric samples of this study and is suggested as a contribution of intrinsic defects. The migration energy of O is energetically considered to increase along the sequence hypo-, hyper-, and stoichiometric actinide oxide. For the U diffusion energy, the experimentally evidenced sequence rather follows hyper-, stoichiometric and hypo-stoichiometric samples (Matzke, 1987).
Molecular dynamic calculations have concluded that with increase of Pu content in (U, Pu)O2 samples, the defect pattern evolved to the formation of a lower concentration of dislocation loops (starting with Frank loops and evolving toward unfaulted loops) (Duriez et al., 2000). Günay (2016) studied irradiated UO2 by atomistic simulation to obtain the diffusion coefficient of O ions. The results showed that irradiation-induced defects contribute the most to the overall O diffusion at temperatures below 800–1,200 K and can explain the recovery of the lattice constant. The activation and recovery energies, migration energy barrier, lattice parameter change, and defects attributed to each recovery stage were obtained and are in line with previous experimental studies (Nakae et al., 1979; Weber, 1984a). The three recovery stages at 600, 900, and 1,200 K could be reproduced and further experimental results reported in Kato et al. (2009a) and Kato and Konashi (2009) are in line with these findings—the temperature ranges respectively of anion defects, cation defects, and He-defect complex recovery. The same studies also show that there is no fundamental difference in the annealing stage regardless of the Pu content of MOX samples.
The modeling of extended defects is also of help in assessing the hypothetical microstructure of mixed actinide oxides. In Van Brutzel et al. (2022), the evolution with irradiation dose of the microstructure of (U, Pu)O2 solid solutions was simulated using molecular dynamics. Along the irradiation pathway, each microstructure created with spontaneous reorganization of defects was directly analyzed by determining the point defects and dislocation densities and by calculating the X-ray diffraction patterns. Unsurprisingly, it was found that the full width at half maximum of the XRD peaks are directly correlated with the perfect dislocation loop density. The increase of the FWHM usually corresponds to an increase of the microstrain, which is related here to the creation of small disoriented nanodomains. More unexpectedly, small peaks appear on the simulated XRD patterns for intermediate irradiation doses and seem directly correlated to the Frank loop density. Such findings are supported by TEM work performed on (U, Pu)O2 samples (Wiss et al., 2021); De Bona et al., 2020; Wiss et al., 2015).
Few studies exist for (Pux, Am1-x)O2 samples. Using DFT and a defect model, Neilson et al. (2021) studied the mode of Am incorporation within PuO2 and the impact of Am on the defect chemistry of the host. Under all conditions and Am concentrations investigated, Am was found to be accommodated with Pu vacancies, with Am existing in a combination of the (+IV) and (+III) oxidation states.
Although the calculated migration energies of defects have some discrepancies depending on the simulation details, in general it is believed that the magnitude of the migration barrier has the following order: VO < OI < UI < VU. Dorado et al. (2011) calculated (DFT + U) as the migration activation energy in UO2 of OI and of VU and obtained values of 0.63 eV and 3.1–3.9 eV, respectively. In the experimental work of Matzke (1987), the migration activation energy in UO2 of VO and OI were determined as 0.5-0.0.6 eV and 0.8–1.0 eV, respectively, and for U 5.6 eV. In all cases, these values are lower for the U migration activation energy in hyperstoichiometric UO2. Weber (1983) and Matzke and Turos (1992) showed that U-vacancies may be mobile at temperatures above 873 K. Therefore, both U-interstitials and -vacancies may contribute to the growth kinetics of interstitial loops in UO2.
Radiogenic He diffusion starts at 1,100 K, but intensifies approximately 1,300 K, producing an exothermic effect which supports the hypothesis that He atoms are associated with defects. As also shown in Figure 10, He release during thermal treatments presents different offset temperatures as a function of total He quantities present in the sample—cumulated alpha decays. In infused samples, He is in equilibrium and its concentration corresponds to the solubility of the gas in the material. In damaged samples, the release is shifted to higher temperatures due to the formation of bubbles, the sizes of which increase with He content.
Belhabib et al. (2015) demonstrated that the U-sublattice is progressively recovered at 870–1,070 K. This range is in good agreement with the temperature at which U vacancies are expected to become mobile (Turos et al., 1993). Moreover, in the same temperature range, the diffusion of He atoms from the interstitial octahedral positions becomes significant. It is assumed that the two phenomena are linked and that the motion of He atoms is enhanced by the diffusion of U vacancies. This is compatible with stage VII as described in Table 2. At higher doses, radiogenic He precipitates, and given its low solubility (Cognini et al., 2018), the diffusion of bubbles as described by Talip et al. (2014a) can be considered. It also cannot be ignored that O mobility in this temperature range might still contribute to some He diffusion and that in the ramp annealing process, some competing/additive effects are observed.
Yun et al. (2009) found that OI acts as a nucleation center for He cluster formation when other defects are not introduced in the UO2 lattice. In particular, if the number of He atoms exceeds five, they found that the collective action of these atoms is sufficient to create a small He bubble surrounded by additional point defects. As the He atoms cluster, they push the nearest U and O atoms from their normal equilibrium lattice sites, forming a void in the lattice to capture sufficient space for their nucleation.
Based on all the experimental and theoretical considerations above, a very simplified temperature-dependent scheme of damage recovery was proposed for fluorite oxides containing various amount of U, Pu and Am. O mobility is effective in the temperature range 450–600 K whereas the cations U, Pu, and Am interstitials are mobile in the range 700–1,000 K. At higher temperatures, He diffuses from extended defects. Table 4 summarizes the different stages for defect thermal annealing re-organization of actinide dioxides. The more He present, the higher the onset of release and the higher the stored energy associated with the complexes’ defect-He (see Figure 10)
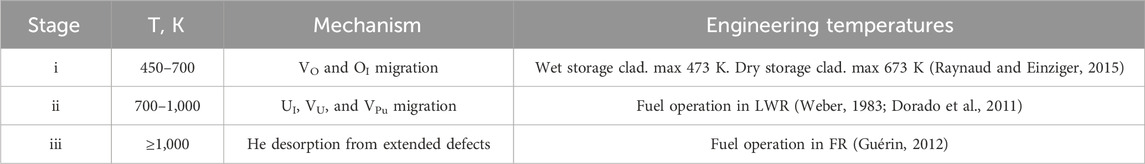
Table 4. Simplified defect annealing temperature ranges for actinide dioxides.
The temperature ranges are rather broad, but for the various recovery mechanisms, it can be speculated that full defect recovery will not occur in spent fuel at storage temperatures, whether wet or dry. While some properties will tend to saturate as will point defects, larger defects, in particular associated with He, will continue to cumulate increasing the total energy of the system.
Whereas the O Frenkel pair formation energy is about one third of the U Frenkel pair (Dorado et al., 2013), the same ratio applies for the migration energy for the O and U vacancy. The interstitial migration energy if one assumes indirect interstitial mechanisms for O and direct for U interstitial is a ratio of 1:5 (Dorado et al., 2010).
In wet storage conditions there should be no damage recovery, but in dry storage conditions the O defects should be recovered. This would, however, not impact the formation of extended defects, but the contrary, as observed in ion-irradiation performed at 773 K (Haddad et al., 2018) or 873 K (He et al., 2013).
As for the stored energy, it would represent an extra 40 MJ t−1 of spent fuel; that is, to heat 100 L of liquid water at constant pressure of 273–373 K or about 10 kW h of electricity.
Highly disordered systems like (self-) irradiated U and Pu and more generally actinide oxides display attractive mechanical and structural stability and exhibit a remarkable tendency toward accommodating defects within a broad high-symmetry single-phase solid solution. This apparent simplicity is partly the result of slow kinetics for most long-range transport mechanisms at temperatures compatible with most fuel storage scenarios. This seems to remain true even in mixed (U, Pu)O2 systems and in the case of moderate substitutions with lanthanides and other minor actinides, where the multicomponent nature of these systems leads to an increase of the overall entropy of the system, which also seems to help the stabilization of the defects without increasing the mechanical cost. However, beneath this reassuring picture, subtle lattice distortions and local associations between defects occur and several properties change. There is strong experimental evidence that short-range diffusion and defect associations of quenched metastable radiation defects occur and depend upon their excess concentrations.
Understanding the stability of these defect organizations also requires a refinement of the current computational thermodynamic models. A possible starting point is to calculate the enthalpies of formation of special quasi-random structures that describe the local correlations observed in the experiments. These DFT calculations have the advantage of allowing an estimate for the defect ordering temperatures that can be leveraged in the construction of models for Gibbs energy using CALPHAD.
This study shows that Cp has potentially higher detection capabilities for specific defect recovery from self-irradiation in UO2 or (U, Pu)O2 and more generally actinide mixed oxides than techniques like XRD. The total stored energy by the different defects could also be assessed. It could be shown that the stored energy from primary defects due to alpha-damage tends to saturate due to an equilibrium between production–recombination and/or precipitation into extended defects. This saturation has also been observed in the lattice parameter, in RAMAN studies, in thermal diffusivity, or in Vicker’s hardness. The specific temperature for defect recovery depends on composition damage level and stoichiometry, but three temperature ranges could be described for the O, the cations point defect recovery, and for the extended defects, respectively.
However, the continuous production of radiogenic He and precipitation in the samples show an increase of the stored energy in addition to the contribution of the other defects (including intrinsic defects). The extra stored energy from the He-defects would need to be studied further for samples with high He content—that is, with higher cumulated self-damage. In the Cp analyses, the maximum damage level of 0.4 dpa was assessed. Realistic damage levels in the order of 1 dpa or higher would be necessary to reflect damage levels of real spent fuels after decades (for MOX fuels) or centuries (for UO2 fuels) of storage. Particularly in wet storage conditions, it can be speculated that no defect recovery will occur, whereas O mobility in dry storage condition would allow a not negligible O type defect recovery.
The raw data supporting the conclusions of this article will be made available by the authors, without undue reservation.
TW: conceptualization, data curation, investigation, project administration, writing–original draft, and writing–review and editing. RK: conceptualization, data curation, writing–original draft, and writing–review and editing. DS: conceptualization, data curation, investigation, writing–original draft, and writing–review and editing. AB: data curation, investigation, and writing–original draft. J-YC: data curation, investigation, and writing–original draft. VR: writing–review and editing. EM: data curation, investigation, and writing–original draft. ZT: data curation, investigation, and writing–original draft. AJ: data curation, investigation, and writing–original draft. OD: data curation, investigation, and writing–original draft. LC: data curation, investigation, and writing–original draft. ED: data curation, investigation, and writing–original draft. GB: writing–review and editing and formal analysis. CD: data curation and writing–review and editing.
The authors declare that no financial support was received for the research, authorship, and/or publication of this article.
The authors are grateful to Eckhard Dahms for Cp and thermal diffusivity measurements, to Bert Cremer and Markus Ernstberger for the SEM/TEM investigations, and to Daniel Bouxière for the XRD measurements.
The authors declare that the research was conducted in the absence of any commercial or financial relationships that could be construed as a potential conflict of interest.
The author(s) declared that they were an editorial board member of Frontiers, at the time of submission. This had no impact on the peer review process and the final decision.
All claims expressed in this article are solely those of the authors and do not necessarily represent those of their affiliated organizations, or those of the publisher, the editors and the reviewers. Any product that may be evaluated in this article, or claim that may be made by its manufacturer, is not guaranteed or endorsed by the publisher.
Agarwal, S., Lin, Y., Stoller, R., and Zinkle, S. (2021). On the use of SRIM for calculating vacancy production: quick calculation and full-cascade options. Nucl. Instrum. Methods Phys. Res. Sect. B Beam Interact. Mater. Atoms 503, 11–29. doi:10.1016/j.nimb.2021.06.018
Andersson, D. A., Uberuaga, B. P., Nerikar, P. V., Unal, C., and Stanek, C. R. (2011). U and Xe transport in UO2: density functional theory calculations. Phys. Rev. B 84 (5), 054105. doi:10.1103/physrevb.84.054105
Balboa, H., Van Brutzel, L., Chartier, A., and Le Bouar, Y. (2018). Damage characterization of (U,Pu)O2 under irradiation by molecular dynamics simulations. J. Nucl. Mater. 512, 440–449. doi:10.1016/j.jnucmat.2018.07.056
Belhabib, T., Desgardin, P., Sauvage, T., Erramli, H., Barthe, M., Garrido, F., et al. (2015). Lattice location and annealing behaviour of helium atoms implanted in uranium dioxide single crystals. J. Nucl. Mater. 467, 1–8. doi:10.1016/j.jnucmat.2015.09.001
Bertolus, M., Freyss, M., Dorado, B., Martin, G., Hoang, K., Maillard, S., et al. (2015). Linking atomic and mesoscopic scales for the modelling of the transport properties of uranium dioxide under irradiation. J. Nucl. Mater. 462, 475–495. doi:10.1016/j.jnucmat.2015.02.026
Bevan, D. J. M., Grey, I. E., and Willis, B. T. M. (1986). The crystal structure of β-U4O9-y. J. Solid State Chem. France 61, 1–7. doi:10.1016/0022-4596(86)90002-2
Brandt, R., and Neuer, G. (1976). Thermal conductivity and thermal radiation properties of UO2. J. Non-Equilib. Thermodyn. 1, 3–23. doi:10.1515/jnet.1976.1.1.3
Carbajo, J. J., Yoder, G. L., Popov, S. G., and Ivanov, V. K. (2001). A review of the thermophysical properties of MOX and UO2 fuels. J. Nucl. Mater. 299 (3), 181–198. doi:10.1016/s0022-3115(01)00692-4
Cognini, L., Pizzocri, D., Barani, T., Van Uffelen, P., Schubert, A., Wiss, T., et al. (2018). Helium solubility in oxide nuclear fuel: derivation of new correlations for Henry’s constant. Nucl. Eng. Des. 340, 240–244. doi:10.1016/j.nucengdes.2018.09.024
Colle, J.-Y., and Capone, F. (2008). Very high temperature laser heated furnace for Knudsen cell mass spectrometry. Rev. Scien. Instr., 79, 055105–55111. doi:10.1063/1.2918135
Colle, J.-Y., Maugeri, E. A., Thiriet, C., Talip, Z., Capone, F., Hiernaut, J. P., et al. (2014). A mass spectrometry method for quantitative and kinetic analysis of gas release from nuclear materials and its application to helium desorption from UO2 and fission gas release from irradiated fuel. J. Nucl. Sci. Technol. 51 (5), 700–711. doi:10.1080/00223131.2014.889583
Cooper, M. W. D., Rushton, M. J. D., and Grimes, R. W. (2014). A many-body potential approach to modelling the thermomechanical properties of actinide oxides. J. Phys. Condens. Matter 26 (10), 105401. doi:10.1088/0953-8984/26/10/105401
Crocombette, J. P., Jollet, F., Nga, L. T., and Petit, T. (2001). Plane-wave pseudopotential study of point defects in uranium dioxide. Phys. Rev. B 64 (10), 104107. doi:10.1103/physrevb.64.104107
Debelle, A., Boulle, A., Garrido, F., and Thomé, L. (2011). Strain and stress build-up in He-implanted UO2 single crystals: an X-ray diffraction study. J. Mater. Sci. 46, 4683–4689. doi:10.1007/s10853-011-5375-1
De Bona, E. (2019). “Grain size effects on radiogenic helium gas in the nuclear fuel UO2,” in École doctorale n°573 Interfaces: approches interdisciplinaires, fondements, applications et innovation (Interfaces). Paris-Saclay: Paris-Saclay.
De Bona, E., Benedetti, A., Dieste, O., Staicu, D., Wiss, T., and Konings, R. (2020). Radiation effects in alpha-doped UO2. Nucl. Instrum. Methods Phys. Res. Sect. B Beam Interact. Mater. Atoms 468, 54–59. doi:10.1016/j.nimb.2020.01.024
De Bona, E., Colle, J. Y., Dieste, O., Cologna, M., Wiss, T., Baldinozzi, G., et al. (2021). Self-irradiation-induced disorder in (U, 238Pu)O2. MRS Adv. doi:10.1557/s43580-021-00040-1
Dorado, B., Durinck, J., Garcia, P., Freyss, M., and Bertolus, M. (2010). An atomistic approach to self-diffusion in uranium dioxide. J. Nucl. Mater. 400 (2), 103–106. doi:10.1016/j.jnucmat.2010.02.017
Dorado, B., Freyss, M., Amadon, B., Bertolus, M., Jomard, G., and Garcia, P. (2013). Advances in first-principles modelling of point defects in UO2: f electron correlations and the issue of local energy minima. J. Phys. Condens. Matter 25 (33), 333201. doi:10.1088/0953-8984/25/33/333201
Dorado, B., Garcia, P., Carlot, G., Davoisne, C., Fraczkiewicz, M., Pasquet, B., et al. (2011). First-principles calculation and experimental study of oxygen diffusion in uranium dioxide. Phys. Rev. B 83 (3), 035126. doi:10.1103/physrevb.83.035126
Duriez, C., Alessandri, J. P., Gervais, T., and Philipponneau, Y. (2000). Thermal conductivity of hypostoichiometric low Pu content (U,Pu)O2−x mixed oxide. J. Nucl. Mater. 277, 143–158. doi:10.1016/s0022-3115(99)00205-6
Evron, R., Kimmel, G., and Eyal, Y. (1994). Thermal recovery of self-radiation damage in uraninite and thorianite. J. Nucl. Mater. 217 (1-2), 54–66. doi:10.1016/0022-3115(94)90304-2
Fernandez, A. (1999). 9th CIMTEC, innovative materials in advance energy technologies. Adv. Sci. Technol.
Flotow, H. E., Osborne, D. W., Fried, S. M., and Malm, J. G. (1976). Heat capacity of 242PuO2 from 12 to 350°K and of 244PuO2 from 4 to 25°K. Entropy, enthalpy, and Gibbs energy of formation of PuO2 at 298.15°K. J. Chem. Phys. 65, 1124–1129. doi:10.1063/1.433186
Fouquet-Métivier, P. (2022). Study of the influence of americium on thermodynamic and structural properties of (U,Pu)O2±x mixed oxides. PhD thesis.
Freyss, M., Petit, T., and Crocombette, J.-P. (2005). Point defects in uranium dioxide: ab initio pseudopotential approach in the generalized gradient approximation. J. Nucl. Mater. 347 (1-2), 44–51. doi:10.1016/j.jnucmat.2005.07.003
Freyss, M., Vergnet, N., and Petit, T. (2006). Ab initio modeling of the behavior of helium and xenon in actinide dioxide nuclear fuels. J. Nucl. Mater. 352 (1), 144–150. doi:10.1016/j.jnucmat.2006.02.048
Garrido, F., Nowicki, L., Sattonnay, G., Sauvage, T., and Thomé, L. (2004). Lattice location of helium in uranium dioxide single crystals. Nucl. Instrum. Methods Phys. Res. Sect. B Beam Interact. Mater. Atoms 219-220, 196–199. doi:10.1016/j.nimb.2004.01.053
Geng, H. Y., Chen, Y., Kaneta, Y., Iwasawa, M., Ohnuma, T., and Kinoshita, M. (2008). Point defects and clustering in uranium dioxide by LSDA+U calculations. Phys. Rev. B 77 (10), 104120. doi:10.1103/physrevb.77.104120
Govers, K. (2008). Atomic scale simulations of noble gases behaviour in uranium dioxide, in PhD thesis in Faculté des sciences appliquées. Bruxelles: Université Libre de Bruxelles.
Günay, S. D. (2016). Thermal recovery mechanisms of UO2 lattices. J. Alloys Compd. 724, 841–850. doi:10.1016/j.jallcom.2017.07.100
Haddad, Y., Delauche, L., Gentils, A., and Garrido, F. (2018). In situ characterization of irradiation-induced microstructural evolution in urania single crystals at 773 K. Nucl. Instrum. Methods Phys. Res. Sect. B Beam Interact. Mater. Atoms 435, 25–30. doi:10.1016/j.nimb.2017.12.019
He, L.-F., Gupta, M., Yablinsky, C. A., Gan, J., Kirk, M. A., Bai, X. M., et al. (2013). In situ TEM observation of dislocation evolution in Kr-irradiated UO2 single crystal. J. Nucl. Mater. 443 (1–3), 71–77. doi:10.1016/j.jnucmat.2013.06.050
Holba, P., and Sedmidubský, D. (2013). “Crystal defects and nonstoichiometry contributions to heat capacity of solids,” in Thermal analysis of micro, nano- and non-crystalline materials: transformation, crystallization, kinetics and thermodynamics. Editors J. Šesták, and P. Šimon (Dordrecht: Springer Netherlands), 53–74.
Kahraman, O., Lebreton, F., Martin, P., and Mermoux, M. (2022). Observable consequences of self-irradiation damage in a MIMAS-type MOX nuclear fuel as analyzed by x-ray diffraction, electron microprobe analysis, and Raman imaging. A possible methodological approach. J. Appl. Phys. 132 (11). doi:10.1063/5.0103348
Kato, M., Komeno, A., Uno, H., Sugata, H., Nakae, N., Konashi, K., et al. (2009a). Self-radiation damage in plutonium and uranium mixed dioxide. J. Nucl. Mater. 393, 134–140. doi:10.1016/j.jnucmat.2009.05.020
Kato, M., Komeno, A., Uno, H., Sugata, H., Nakae, N., Konashi, K., et al. (2009b). Self-radiation damage in plutonium and uranium mixed dioxide. J. Nucl. Mater. 393 (1), 134–140. doi:10.1016/j.jnucmat.2009.05.020
Kato, M., and Konashi, K. (2009). Lattice parameters of (U, Pu, Am, Np)O2−x. J. Nucl. Mater. 385 (1), 117–121. doi:10.1016/j.jnucmat.2008.09.037
Konings, R. J. M., and Beneš, O. (2013). The heat capacity of NpO2 at high temperatures: the effect of oxygen Frenkel pair formation. J. Phys. Chem. Solids 74 (5), 653–655. doi:10.1016/j.jpcs.2012.12.018
Konings, R. J. M., Beneš, O., Kovács, A., Manara, D., Sedmidubský, D., Gorokhov, L., et al. (2014). The thermodynamic properties of the f-elements and their compounds. Part 2. The lanthanide and actinide oxides. J. Phys. Chem. Reference Data 43 (1), 013101. doi:10.1063/1.4825256
Kröger, F. A., and Vink, H. J. (1956). “Relations between the concentrations of imperfections in crystalline solids,” in Solid state physics. Editors F. Seitz, and D. Turnbull (Academic Press), 307–435.
Li, Y. (2019). A universal COMB potential for the whole composition range of the uraniumoxygen system. J. Nucl. Mater. 513, 102–119. doi:10.1016/j.jnucmat.2018.10.043
Luzzi, L., Cognini, L., Pizzocri, D., Barani, T., Pastore, G., Schubert, A., et al. (2018). Helium diffusivity in oxide nuclear fuel: critical data analysis and new correlations. Nucl. Eng. Des. 330, 265–271. doi:10.1016/j.nucengdes.2018.01.044
Lv, W., Zhao, Z., Sun, B., Guan, P., Yang, Y., and Zhang, P. (2023). Intrinsic oxygen defects in UO2 (111) and PuO2 (111) surfaces. Appl. Surf. Sci. 610, 155511. doi:10.1016/j.apsusc.2022.155511
Magill, J., and Dreher, R. (2009). The NUCLEONICA nuclear science portal. Current status. Trends, Needs Radiochem. Educ. U. S. Abroad 1164, 100–109.
Maschek, W., Chen, X., Delage, F., Fernandez-Carretero, A., Haas, D., Matzerath Boccaccini, C., et al. (2008). Accelerator driven systems for transmutation: fuel development, design and safety. Prog. Nucl. Energy 50 (2), 333–340. doi:10.1016/j.pnucene.2007.11.066
Matzke, H. (1987). Atomic transport properties in UO2 and mixed oxides (U, Pu)O2. J. Chem. Soc. Faraday Trans. 2 (83), 1121–1142. doi:10.1039/f29878301121
Matzke, H. (1990). Atomic mechanisms of mass transport in ceramic nuclear fuel materials. J. Chem. Soc. Faraday Tran. 86 (8), 1243. doi:10.1039/ft9908601243
Matzke, H., Meyer, O., and Turos, A. (1991). Damage recovery in the U-sublattice of ion implanted UO2 between 5 K and 2000K. Radiat. Eff. Defects Solids 119-121, 885–890. doi:10.1080/10420159108220837
Matzke, H., and Turos, A. (1992). Ion implantation studies of UO2 and UN. J. Nucl. Mater. 188, 285–292. doi:10.1016/0022-3115(92)90486-5
Maugeri, E., Wiss, T., Hiernaut, J. P., Desai, K., Thiriet, C., Rondinella, V., et al. (2009). Helium solubility and behaviour in uranium dioxide. J. Nucl. Mater. 385 (2), 461–466. doi:10.1016/j.jnucmat.2008.12.033
Nakae, N., Iwata, Y., and Kirihara, T. (1979). Thermal recovery of defects in neutron irradiated UO2. J. Nucl. Mater. 80 (2), 314–322. doi:10.1016/0022-3115(79)90194-6
Nakamura, H., Machida, M., and Kato, M. (2011). LDA+U study on plutonium dioxide with spin-orbit couplings. Prog. Nucl. Sci. Technol. 2, 16–19. doi:10.15669/pnst.2.16
Neilson, W. D., Pegg, J. T., Steele, H., and Murphy, S. T. (2021). The defect chemistry of non-stoichiometric PuO2±x. Phys. Chem. Chem. Phys. 23 (8), 4544–4554. doi:10.1039/d0cp06497a
Nogita, K., and Une, K. (1993). Thermal recovery of radiation defects and microstructural change in irradiated UO2 fuels. J. Nucl. Sci. Technol. 30 (9), 900–910. doi:10.3327/jnst.30.900
Onofri, C., Sabathier, C., Baumier, C., Bachelet, C., Drouan, D., Gérardin, M., et al. (2020). Extended defect change in UO2 during in situ TEM annealing. Acta Mater. 196, 240–251. doi:10.1016/j.actamat.2020.06.038
Picard, E. (2000). First in-pile experimental results of high-plutonium-content oxide fuel for plutonium burning in fast reactors. Nucl. Technol. 129 (1), 1–12. doi:10.13182/nt00-2
Rahman, M. J., Szpunar, B., and Szpunar, J. A. (2019). Molecular dynamics study of primary radiation damage in PuO2 and (U0.5Pu0.5)O2. Comput. Mater. Sci. 166, 193–199. doi:10.1016/j.commatsci.2019.05.013
Raynaud, P. A. C., and Einziger, R. E. (2015). Cladding stress during extended storage of high burnup spent nuclear fuel. J. Nucl. Mater. 464, 304–312. doi:10.1016/j.jnucmat.2015.05.008
Ronchi, C., and Hiernaut, J.-P. (2004). Helium diffusion in uranium and plutonium oxides. J. Nucl. Mater. 325, 1–12. doi:10.1016/j.jnucmat.2003.10.006
Ronchi, C., Sheindlin, M., Musella, M., and Hyland, G. J. (1999). Thermal conductivity of uranium dioxide up to 2900 K from simultaneous measurement of the heat capacity and thermal diffusivity. J. Appl. Phys. 85 (2), 776–789. doi:10.1063/1.369159
Rondinella, V. V., Cobos, J., Matzke, H. J., Wiss, T., Carbol, P., and Solatie, D. (2000a). Leaching behavior and α-decay damage accumulation of UO2 containing short-lived actinides. MRS Online Proc. Libr. Arch., 663.
Rondinella, V., Cobos, J., and Wiss, T. (1999). α-radiolysis and α-radiation damage effects on UO2 dissolution under spent fuel storage conditions. MRS Online Proc. Libr. Arch., 556.
Rondinella, V. V., Wiss, T., Hiernaut, J.-P., and Staicu, D. (2007). “Dose rate effects on the accumulation of radiation damage,” in The 11th international conference on environmental remediation and radioactive waste management (American Society of Mechanical Engineers).
Rondinella, V. V., Matzke, H. J., Cobos, J., and Wiss, T. (2000b). Leaching behaviour of UO2 containing alpha-emitting actinides. Radiochim. Acta 88 (9-11), 527–531. doi:10.1524/ract.2000.88.9-11.527
Rondinella, V. V., Cobos, J., Wiss, T., and Hiernaut, J.-P. (2003). “Studies on spent fuel alterations during storage and radiolysis effects on corrosion behaviour using alpha-doped UO2,” in Proceedings of the international conference on radioactive waste management and environmental remediation, ICEM.
Roof, R. B. (2019). The effects of self-irradiation on the lattice of 238(80%)PuO2, III. Adv. X-ray Analysis 17, 348–353. doi:10.1007/978-1-4613-9975-9_28
Sabathier, C., Martin, G., Michel, A., Carlot, G., Maillard, S., Bachelet, C., et al. (2014). In-situ TEM observation of nano-void formation in UO2 under irradiation. Nucl. Instrum. and Methods Phys. Res. Sect. B-beam Interact. Mater. Atoms 326, 247–250. doi:10.1016/j.nimb.2013.10.055
Sattonnay, G., and Tétot, R. (2013). Bulk, surface and point defect properties in UO2 from a tight-binding variable-charge model. J. Phys. Condens. Matter 25 (12), 125403. doi:10.1088/0953-8984/25/12/125403
Singh, S., Sonvane, Y., Nekrasov, K., Kupryazhkin, A., Gajjar, P., and Gupta, S. K. (2024). A first principles investigation of defect energetics and diffusion in actinide dioxides. J. Nucl. Mater. 591, 154901. doi:10.1016/j.jnucmat.2024.154901
Somers, J. (1999). “Status of the TRABANT1 irradiation experiment,” in Global 99, international conference on future nuclear systems (USA: Jackson Hole).
Soullard, J., and Alamo, A. (1978). Etude du ralentissement des ions dans une cible diatomique: II—calcul du nombre d'atomes deplacés. Radiat. Eff. 38, 133–139. doi:10.1080/00337577808233221
Staicu, D., Somers, J., Fernandez, A., and Konings, R. (2015). Thermal properties of minor actinide targets. Nucl. Mater. Energy 3-4, 6–11. doi:10.1016/j.nme.2015.03.001
Staicu, D., and Wiss, T. (2011). “Effect of auto-radiation damage on the specific heat and thermal diffusivity of (U, Pu)O2 and UO2,” in Deliverable D113, basic research for innovative fuels design for GEN IV systems (F-bridge). Brussels: EURATOM-FISSION project, FP7.
Staicu, D., Wiss, T., and Ronchi, C. (2004). in Int. Meeting on LWR fuel performance. Orlando, USA: ANS.
Staicu, D., Wiss, T., Rondinella, V., Hiernaut, J., Konings, R., and Ronchi, C. (2010). Impact of auto-irradiation on the thermophysical properties of oxide nuclear reactor fuels. J. Nucl. Mater. 397 (1-3), 8–18. doi:10.1016/j.jnucmat.2009.11.024
Talip, Z., Wiss, T., Di Marcello, V., Janssen, A., Colle, J. Y., Van Uffelen, P., et al. (2014a). Thermal diffusion of helium in 238Pu-doped UO2. J. Nucl. Mater. 445, 117–127. doi:10.1016/j.jnucmat.2013.10.066
Talip, Z., Wiss, T., Maugeri, E. A., Colle, J. Y., Raison, P. E., Gilabert, E., et al. (2014b). Helium behaviour in stoichiometric and hyper-stoichiometric UO2. J. Eur. Ceram. Soc. 34 (5), 1265–1277. doi:10.1016/j.jeurceramsoc.2013.11.032
Turcotte, R., and Chikalla, T. (1973). Annealing of self-radiation damage in 238PuO2. Radiat. Eff. 19, 99–108. doi:10.1080/00337577308232226
Turos, A., Fritz, S., and Matzke, H. (1990). Defects in ion-implanted uranium nitride. Phys. Rev. B 41 (7), 3968–3977. doi:10.1103/physrevb.41.3968
Turos, A., Matzke, H., Wielunski, M., and Nowicki, L. (1993). Radiation defects in the oxygen sublattice of UO2 single crystals. Nucl. Instrum. Methods Phys. Res. Sect. B Beam Interact. Mater. Atoms 80-81, 1259–1263. doi:10.1016/0168-583x(93)90779-6
Vălu, S.-O., De Bona, E., Popa, K., Griveau, J. C., Colineau, E., and Konings, R. J. M. (2019). The effect of lattice disorder on the low-temperature heat capacity of (U1−yThy)O2 and 238Pu-doped UO2. Sci. Rep. 9 (1), 15082. doi:10.1038/s41598-019-51476-3
Van Brutzel, L., Fossati, P., and Chartier, A. (2022). Molecular dynamics simulations of microstructural evolution of irradiated (U,Pu)O2 studied via simulated XRD patterns. J. Nucl. Mater. 567, 153834. doi:10.1016/j.jnucmat.2022.153834
Vathonne, E., Wiktor, J., Freyss, M., Jomard, G., and Bertolus, M. (2014). DFT + U investigation of charged point defects and clusters in UO2. J. Phys. Condens. Matter 26 (32), 325501. doi:10.1088/0953-8984/26/32/325501
K. A. Vlasov (1966). Geochemistry and mineralogy of rare elements and genetic types of their deposits (Jerusalem: Israel Program for Scientific Translation), 2.
Weber, W. (1984). Alpha-irradiation damage in CeO2, UO2 and PuO2. Radiat. Eff. 83, 145–156. doi:10.1080/00337578408215798
Weber, W. J. (1981). Ingrowth of lattice defects in alpha irradiated UO2 single crystals. J. Nucl. Mater. 98 (1-2), 206–215. doi:10.1016/0022-3115(81)90400-1
Weber, W. J. (1983). Thermal recovery of lattice defects in alpha-irradiated UO2 crystals. J. Nucl. Mater. 114 (2-3), 213–221. doi:10.1016/0022-3115(83)90259-3
Weber, W. J. (2019). “Plutonium in waste forms,” in Plutonium handbook. Editors D. L. Clark, D. A. Geeson, J. Robert, and J. Hanrahan, 1360–2376. ANS.
Wigner, E. P. (1946). Theoretical physics in the metallurgical laboratory of chicago. J. Appl. Phys. 17, 857–863. doi:10.1063/1.1707653
Willis, B. T. M. (1987). Crystallographic studies of anion-excess uranium oxides. J. Chem. Soc. Faraday Trans. 2, 1073. doi:10.1039/f29878301073
Wiss, T., Dieste, O., De Bona, E., Benedetti, A., Rondinella, V., and Konings, R. (2021). SUPERFACT: a model fuel for studying the evolution of the microstructure of spent nuclear fuel during storage/disposal. Materials 14 (21), 6538. doi:10.3390/ma14216538
Wiss, T., Dieste-Blanco, O., Tacu, A., Janssen, A., Talip, Z., Colle, J. Y., et al. (2015). TEM study of alpha-damaged plutonium and americium dioxides. J. Mater. Res. 30 (9), 1544–1554. doi:10.1557/jmr.2015.37
Wiss, T., Hiernaut, J. P., Roudil, D., Colle, J. Y., Maugeri, E., Talip, Z., et al. (2014). Evolution of spent nuclear fuel in dry storage conditions for millennia and beyond. J. Nucl. Mater. 451, 198–206. doi:10.1016/j.jnucmat.2014.03.055
Wiss, T., and Konings, R. J. M. (2013a). “Radiation damage in actinides compounds with the fluorite structure,” in Properties of fluorite structure materials. Editor P. V. J. M. Costantini (New York: Nova Science Publishers), 153–188.
Wiss, T., and Konings, R. J. M. (2013b). “Radiation effects in actinide compounds with the fluorite structure,” in Properties of fluorite structure materials. Editor P. V. a.J.-M. Costantini (New York: NOVA), 153–188.
Wiss, T., Thiele, H., Janssen, A., Papaioannou, D., Rondinella, V. V., and Konings, R. J. M. (2012). Recent results of microstructural characterization of irradiated light water reactor fuels using scanning and transmission electron microscopy. JOM 64 (12), 1390–1395. doi:10.1007/s11837-012-0483-1
Yun, Y., Eriksson, O., and Oppeneer, P. M. (2009). Theory of He trapping, diffusion, and clustering in UO2. J. Nucl. Mater. 385 (3), 510–516. doi:10.1016/j.jnucmat.2008.12.311
Keywords: heat capacity, alpha-damage, actinide dioxide, stored energy, defects, helium
Citation: Wiss T, Konings RJM, Staicu D, Benedetti A, Colle J-Y, Rondinella VV, Maugeri E, Talip Z, Janssen A, Dieste O, Cognini L, De Bona E, Baldinozzi G and Guéneau C (2025) Impact of alpha-damage and helium production on the heat capacity of actinide oxides. Front. Nucl. Eng. 4:1495360. doi: 10.3389/fnuen.2025.1495360
Received: 12 September 2024; Accepted: 15 January 2025;
Published: 24 February 2025.
Edited by:
Timothy Gerald Lach, Oak Ridge National Laboratory (DOE), United StatesReviewed by:
Romain Vauchy, Japan Atomic Energy Agency, JapanCopyright © 2025 Wiss, Konings, Staicu, Benedetti, Colle, Rondinella, Maugeri, Talip, Janssen, Dieste, Cognini, De Bona, Baldinozzi and Guéneau. This is an open-access article distributed under the terms of the Creative Commons Attribution License (CC BY). The use, distribution or reproduction in other forums is permitted, provided the original author(s) and the copyright owner(s) are credited and that the original publication in this journal is cited, in accordance with accepted academic practice. No use, distribution or reproduction is permitted which does not comply with these terms.
*Correspondence: Thierry Wiss, dGhpZXJyeS53aXNzQGVjLmV1cm9wYS5ldQ==
†Present addresses: Emilio Maugeri, Laboratory for Radiochemistry, Paul Scherrer Institute, Villigen, Switzerland
Zeynep Talip, Laboratory for Radiochemistry, Paul Scherrer Institute, Villigen, Switzerland
Arne Janssen, Department of Microscopy, ZEISS, Oberkochen, Baden-Wuerttemberg, Germany
Disclaimer: All claims expressed in this article are solely those of the authors and do not necessarily represent those of their affiliated organizations, or those of the publisher, the editors and the reviewers. Any product that may be evaluated in this article or claim that may be made by its manufacturer is not guaranteed or endorsed by the publisher.
Research integrity at Frontiers
Learn more about the work of our research integrity team to safeguard the quality of each article we publish.