 Seda Yilmaz
 Paul K. Romano
 Lorenzo Chierici
 Erik B. Knudsen3
 Patrick C. Shriwise
- 1School of Nuclear Engineering, Purdue University, West Lafayette, IN, United States
- 2Computational Science Division, Argonne National Laboratory, Lemont, IL, United States
- 3Copenhagen Atomics, Copenhagen, Denmark
In this study, we present a detailed comparison of two independently developed models of the Molten Salt Reactor Experiment (MSRE) for Monte Carlo particle transport simulations: the constructive solid geometry (CSG) model that was developed in support of the MSRE benchmark in the International Handbook of Evaluated Reactor Physics Benchmark Experiments, and a CAD model that was developed by Copenhagen Atomics. The original Serpent reference CSG model was first converted to OpenMC’s input format so that it could be systematically compared to the CAD model, which was already available as an OpenMC model, using the same Monte Carlo code. Results from simulations using the Serpent and OpenMC CSG models showed that keff agreed within 10 pcm while the flux distribution in space and energy generally agreed within 0.1%. Larger differences were observed between the OpenMC CAD and CSG models; notably, the keff computed for the CAD model was 1.00872, which is more than 1% lower than the value for the CSG model and much closer to experiment. Several areas of the reactor that were modeled differently in the CSG and CAD models were discussed and, in several cases, their impact on keff was quantified. Lastly, we compared the computational performance and memory usage between the CAD and CSG models. Simulation of the CSG model was found to be 1.4–2.3× faster than simulation of the CAD model based on the Embree ray tracer while using 4× less memory, highlighting the need for continued improvements in the CAD-based particle transport ecosystem. Finally, major performance degradation was observed for CAD-based simulations when using the MOAB ray tracer.
1 Introduction
The accurate representation of geometry plays a pivotal role in achieving reliable results for Monte Carlo (MC) particle transport simulations. Historically, most MC codes used for nuclear engineering applications—such as MCNP (Kulesza et al., 2022), Serpent (Leppänen et al., 2015), OpenMC (Romano et al., 2015), Shift (Pandya et al., 2016), KENO (Wieselquist and Lefebvre, 2023), and Geant4 (Agostinelli et al., 2003)—have relied on a constructive solid geometry (CSG) representation based on unbounded primitives defined by inequalities of implicit surfaces. CSG has been preferred for many reasons, including its ability to represent curved surfaces without approximations, ease of modeling repeated geometry units, efficiency of particle tracking operations, and interoperability with existing MC codes. However, there are notable downsides to using CSG. For one, it can be difficult to integrate into computer-aided engineering (CAE) workflows that are built around computer-aided design (CAD) models and meshing tools. CSG also becomes impractical for models with highly irregular shapes (e.g., stellarator components). Consequently, there have been many efforts over the last 20 years aimed at performing MC simulation directly on CAD-based geometries.
There are two predominant approaches for performing MC simulations on CAD models. The first approach involves converting the internal representation of a CAD model (boundary representation) to the native CSG representation used in MC codes. This approach has been around since at least 2005 (Tsige-Tamirat and Fischer, 2005); specific software packages for performing CAD-to-CSG conversion include McCAD (Harb et al., 2023), MCAM (Wang et al., 2014), GEOMIT (Nasif et al., 2012), CMGC (Wang et al., 2020), SuperMC (Wu et al., 2015), and GEOUNED (García et al., 2021). Of these packages, McCAD1 and GEOUNED2 are available under an open-source license. Another approach is to perform particle transport directly on a faceted CAD model. This has been enabled by the Direct Accelerated Geometry Monte Carlo (DAGMC) toolkit (Wilson et al., 2010). DAGMC has been integrated in many MC codes and enjoys first-class support in OpenMC (Shriwise et al., 2020). Starting with version 0.13.0 of OpenMC (Romano et al., 2022), it is also possible to model CAD components through DAGMC in specific sections of a CSG model.
Naturally, most of the research activity related to MC transport on CAD models has happened in the fusion field, where the geometric complexity of systems requires sophisticated modeling. Fission reactors, on the other hand, are inherently simpler from a geometric standpoint—often with repeated arrays of fuel pins and assemblies—and thus can often be modeled using CSG without too much difficulty. However, there are many use cases for fission reactors whereby simulation on a CAD model would be advantageous, such as modeling research and test reactors (Shriwise et al., 2022), detailed or as-built experiments (Talamo et al., 2018), spent fuel installations (Leppänen, 2022), and advanced reactors. In all these cases, the ability to tie into an existing CAE workflow that starts with a CAD model can eliminate most of the redundant effort in constructing a model specifically for MC particle transport and simplify downstream analyses.
In this work, we present a comparative analysis of two independently developed models of the Molten-Salt Reactor Experiment (MSRE): a CAD model developed by Copenhagen Atomics and a CSG model based on the MSRE-MSR-EXP-001 benchmark evaluation from the International Handbook of Evaluated Reactor Physics Benchmark Experiments (IRPhE) (Shen et al., 2019), which was originally developed (Fratoni et al., 2020) at the University of California, Berkeley. The goal of this analysis is to compare accuracy, modeling assumptions, computational performance, memory use, and limitations of the two approaches. In particular, the original Serpent reference model from the IRPhE greatly overestimates the effective multiplication factor, keff, for the critical experiment; a close look at the different modeling assumptions made in the CSG and CAD models can help shed light on details omitted in one model or the other that may be physically important. This comparison also gives us an opportunity to look at the present state of the software stack supporting CSG- and CAD-based workflows and identify opportunities for improvement.
1.1 Molten-Salt Reactor Experiment
The MSRE was a research molten salt reactor (MSR) that was operated at Oak Ridge National Laboratory between 1965 and 1969. The reactor operated by introducing fuel salt through a tangentially arranged fuel inlet, which is then distributed evenly around the reactor vessel’s circumference. The salt flows downward through a wide annulus between the vessel wall and the core can, upward through channels between the graphite stringers, and then exits the core through an outlet pipe situated in the upper head by means of a circulating pump. The core supports the graphite vertical stringers that create channels for the fuel salt. The graphite matrix is carefully designed to prevent blockages and maintain an optimal fuel-to-graphite ratio. The reactor vessel is encased by two thermal shields within a steel containment vessel, all housed by a concrete pit tank.
With the recent worldwide interest in pursuing the MSR as an advanced reactor concept, the MSRE is now treasured as one of the only sources of validation data for MSRs. This interest spurred an effort in the community to develop a benchmark evaluation for a series of zero-power experiments on the MSRE, which was added to the 2018 edition of the IRPhE under identifier MSRE-MSR-EXP-001 and later updated for the 2019 edition. This benchmark was supported by a detailed three-dimensional reference model constructed for the Serpent 2 MC code. The MSRE benchmark has since been modeled in SCALE (Barlow and Clarno, 2020; Bostelmann et al., 2022), MCNP (Clarno et al., 2023), and independently for Serpent (Clarno et al., 2023). Simplified MSRE models have also been created for VERA (Graham et al., 2021) and Shift/Serpent/OpenMC (Hartanto et al., 2023).
Given how much time has elapsed between the original MSRE experiments and the creation of the IRPhE benchmark and associated models for various MC codes, there are details that have either been lost or are not easily accessible, which has resulted in a need for simplifications and approximations. The Serpent reference model from the IRPhE is, to our knowledge, the most detailed CSG model of the MSRE and even for that model many simplifications were made. Further simplifications or approximations were made in the derived SCALE and MCNP models; for example, the lack of a torus surface in SCALE meant that the distributor ring was modeled using cylinders rather than tori (Bostelmann et al., 2022). As with most benchmark evaluations, the evaluators have to find a balance between including the right level of detail while preserving the physical accuracy of the model. Obviously, it is not practical to include every nut and bolt, but any feature that could have a noticeable impact on the eigenvalue or other physical parameters ought to be included.
One of the major issues observed with the Serpent reference model of the MSRE benchmark as well as derived models is a significant overprediction of the benchmark keff, which is 0.99978 after accounting for the bias from simplifications. Using Serpent version 2.1.30 and the ENDF/B-VII.1 (Chadwick et al., 2011) nuclear data library, the benchmark authors reported a keff value of 1.02132 ± 0.00003 (Shen et al., 2021), or more than 2% higher than the experimental value. Derived models for other MC codes reported similarly high keff values; Table 1 shows a summary of the reported k eigenvalues from various papers in the literature. Note that the 2018 edition of the IRPhE included an earlier version of the MSRE benchmark that had an even higher keff at more than 3% higher than experiment. Improvements in modeling thermal expansion and material specifications in the 2019 edition of the benchmark resulted in the slightly improved keff value. The values reported by Barlow and Clarno (2020) were lower than the original Serpent results for the 2018 version of the benchmark due to the use of a different temperature for S(α, β) tables (which represent secondary angle–energy distributions for thermal scattering as a function of unitless momentum and energy transfer variables, α and β, respectively).
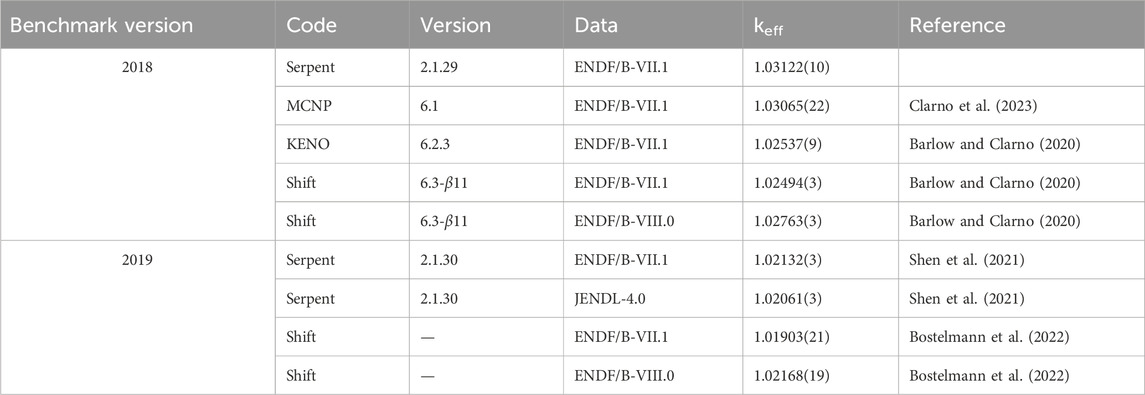
Table 1. Previously reported keff values for the MSRE benchmark from IRPhE. The benchmark model keff is 0.99978 ± 0.00420.
Various explanations have been proposed for why the keff value for the benchmark model is significantly higher than the experimental value. Accounting for experimental uncertainties in the parameters used in the benchmark (material densities, masses, 6Li enrichment, dimensions, temperatures, etc.), Fratoni et al. (2020) found an overall uncertainty on the experimental keff of 420 pcm. Fratoni et al. (2020) point out, furthermore, that other graphite-based systems—such as the HTTR reactor—also experience a 2% overestimation in keff, indicating that the evaluated data for graphite thermal scattering may need improvement. Bostelmann et al. (2022) studied the impact of different nuclear data libraries and propagating nuclear data uncertainty. They found that changing from ENDF/B-VII.1 to ENDF/B-VIII.0 (Brown et al., 2018) only changed keff by 200–300 pcm, while propagating data uncertainties resulted in an eigenvalue uncertainty of about 700 pcm. Based on their results, they go on to list the following as potential reasons for the overestimation in keff: material and geometry uncertainties, differences in fuel salt composition, nuclear data uncertainties, missing thermal scattering data for the salt, and methods approximations. With so many possible causes, there is currently no compelling single argument as to why there is such a significant overestimation.
The recent development of a detailed CAD model of the MSRE experiment by Copenhagen Atomics provides us with an opportunity to reevaluate some of the assumptions made in the MSRE benchmark evaluation. Thus, our first goal here is to use this CAD model as well as the original CSG model upon which the IRPhE benchmark is based to identify simplifications made and understand their impact, adding to the overall understanding of the keff overestimation. At the same time, having two independently developed models of the MSRE, one in CSG and one in CAD, gives us a separate opportunity to assess the state of CAD modeling for MC particle transport, thereby adding to the existing literature (Weinhorst et al., 2015; Valentine et al., 2022).
2 Materials and methods
In order to make a fair comparison between the CSG and CAD models of the MSRE, we have undertaken an effort to utilize the same MC code, OpenMC, for both. As discussed further in Section 2.2, the CAD model was developed in OnShape and converted to a DAGMC h5m file using Coreform Cubit. The h5m file is immediately useable in OpenMC, which has native support for DAGMC geometries. To generate a CSG model for OpenMC, the original Serpent reference model was automatically converted with the aid of a script. Section 2.1 describes the methods used to convert the Serpent CSG model to OpenMC’s format in detail. Section 2.2 describes how the CAD model and its faceted version were created. Then, Section 2.3 describes differences between the two models and outlines modified versions of the original models that are further studied in Section 3.
2.1 CSG model conversion
Our first attempt to create a CSG model of the MSRE benchmark relied on using the benchmark specification itself to manually create an OpenMC geometry using OpenMC’s Python API. However, the benchmark specification itself does not provide quite enough detail to match all the geometry features contained in the Serpent reference model. As a result, this initial effort was abandoned and instead we focused on exactly reproducing the Serpent model. The original Serpent 2 reference model that was used as the basis for the benchmark evaluation in IRPhE was provided to us by the benchmark authors from the University of California, Berkeley. The Serpent model consists of 724 cells, 163 surfaces, and 15 lattices. While it is possible to manually produce a one-to-one match of this model by hand using OpenMC’s Python API, this approach would have been very laborious, and if any further changes were made to the Serpent model, they would have to be manually incorporated in the corresponding OpenMC model. Instead, we chose to write a Python package that automatically converts a generic Serpent model.
The Python package, which is called openmc_serpent_adapter3, is loosely based on the functionality in the openmc_mcnp_adapter project4, which can convert MCNP CSG models into OpenMC’s format. The conversion works by iterating over the lines in a Serpent input file, first collecting information on each material, cell, surface, lattice, and input option, and then generating corresponding OpenMC constructs. In most cases, each construct in Serpent has a matching construct in OpenMC; for example, a surf cylx card in Serpent corresponds to OpenMC’s XCylinder class. However, special handling was needed in several areas:
• Boundary conditions are handled slightly differently between Serpent and OpenMC. In Serpent, the user specifies a generic boundary condition type and tags particular cells as “outside” cells. When a particle enters an outside cell, the boundary condition is applied. In OpenMC, boundary conditions are applied to specific surfaces rather than by identifying outside cells. To determine which surfaces should be used as boundaries in OpenMC, the package selects the set of surfaces that bound the outside cells and then eliminates any of them that have non-outside cells on both sides. This results in a correct assignment of vacuum boundary conditions in the OpenMC model. Note that in the Serpent model, the thermal shield base extends beyond the cylindrical thermal shield itself, resulting in a non-convex geometry. That is, particles that leave the thermal shield base may be terminated by virtue of hitting an outside cell even though their direction is such that they could reenter the core. However, the algorithm for assigning boundary conditions on OpenMC surfaces results in a convex geometry, thereby avoiding this problem.
• Some materials in the Serpent model use the mix card (mixture definition). While OpenMC does have a corresponding construct (the Material.mix_materials method), it does not currently support mixing materials that have thermal scattering data assigned. In order to allow the Serpent mixtures to be converted, the mix cards were converted to normal mat cards by using Serpent’s material decomposition option via the -mix command-line flag.
• Serpent has a vertical stack lattice (lat card with type 9) that has no equivalent in OpenMC. To convert a vertical stack lattice, a function was written that creates a series of cells bounded by planes perpendicular to the z-axis that are filled with the corresponding universes with an appropriate translation to mimic the lattice structure.
The set of input cards and geometry features that are supported in the conversion package are sufficient to handle the MSRE benchmark model as well as a number of other Serpent models we have tested. As of the time of writing, many input cards from Serpent are not yet supported, including source definition (src), detectors (det), and unstructured mesh-based geometry (solid). However, the openmc_serpent_adapter package is publicly available under an open source license, and if there is sufficient interest further improvements can be made over time.
In addition to ensuring the geometry and material definitions are equivalent between Serpent and the converted OpenMC model, we also wanted to ensure that the cross section data being used by the two codes was equivalent. The best way to guarantee this is to have OpenMC use an HDF5 library that was converted from the ACE files that are used by Serpent. To have a consistent set of files, we modified the Serpent model to use ENDF/B-VIII.0 data from the Lib80x library processed by Los Alamos National Laboratory (LANL) (Conlin et al., 2018). Then, the Lib80x library was converted into OpenMC’s HDF5 format. The ENDF/B-VIII.0-based thermal scattering library that is distributed by LANL, ENDF80SaB (Parsons and Toccoli, 2020), is unfortunately not compatible with version 2.1.32 of Serpent because it cannot perform temperature interpolation on S(α, β) data that is continuous for the outgoing neutron energy. To get around this, we generated new ACE files using NJOY2016 for the graphite and light water thermal scattering files from ENDF/B-VIII.0 with the iwt = 1 option in ACER, which produces a discrete distribution of outgoing energies that Serpent is able to interpolate between temperatures. These thermal scattering ACE files were then converted to OpenMC’s HDF5 format for use with OpenMC. For the graphite thermal scattering files, manual modifications were made to ensure the data was only applied to 12C (by default, it would be applied to both 12C and 13C).
The Serpent reference model that we received had two issues that we fixed directly before converting to OpenMC using the openmc_serpent_adapter package. First, the Serpent model had used a temperature of 922 K for the core. As explained by Shen et al. (2021), it was originally estimated that the core would reach criticality at 922 K but actually reached criticality at a temperature of 911 K. Thus, the benchmark specification (Shen et al., 2019) specifies a temperature of 911 K. To match this specification, we modified the temperature in the Serpent model from 922 K to 911 K. Secondly, the Serpent model had all control rods fully withdrawn. According to the benchmark specification, one of the control rods was inserted 4.4 inches at the time the core reached criticality during the zero-power critical experiment. Two trans cards were thus added to the Serpent model to lower rod 2 by the correct amount. The impact of these two changes on keff is discussed further in Section 3.
Several representative vertical and horizontal cross section plots of the resulting autoconverted OpenMC model are shown in Figure 1, Figure 2, and Figure 3. Comparing to similar figures produced from the Serpent model (see references in figure captions), the OpenMC model visually appears to be exactly equivalent to the Serpent model.
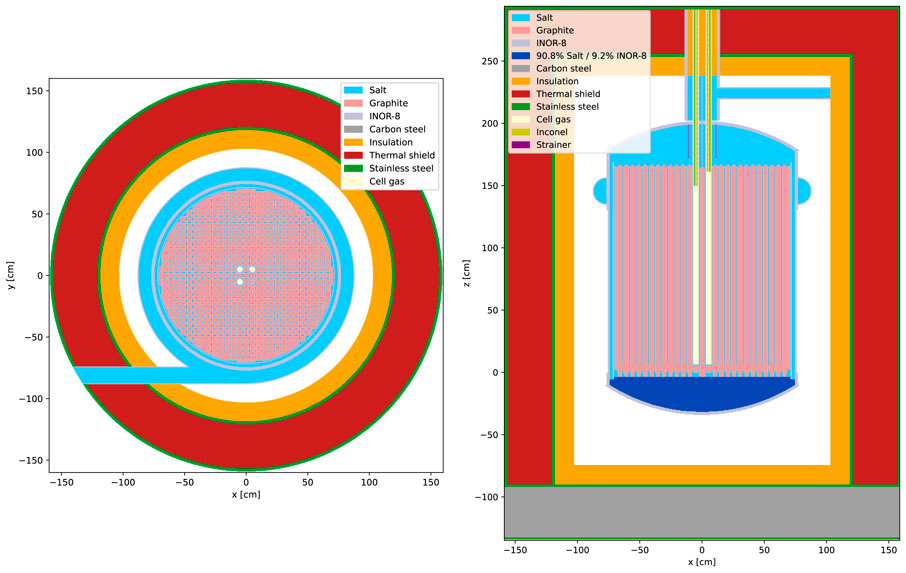
Figure 1. Cross sectional views of the converted OpenMC MSRE model. (left) Horizontal cross section at z = 145.417 cm. (right) Vertical cross section at y = 5.08339 cm. For comparison to Serpent, see Figure 3.1 in Fratoni et al. (2020).
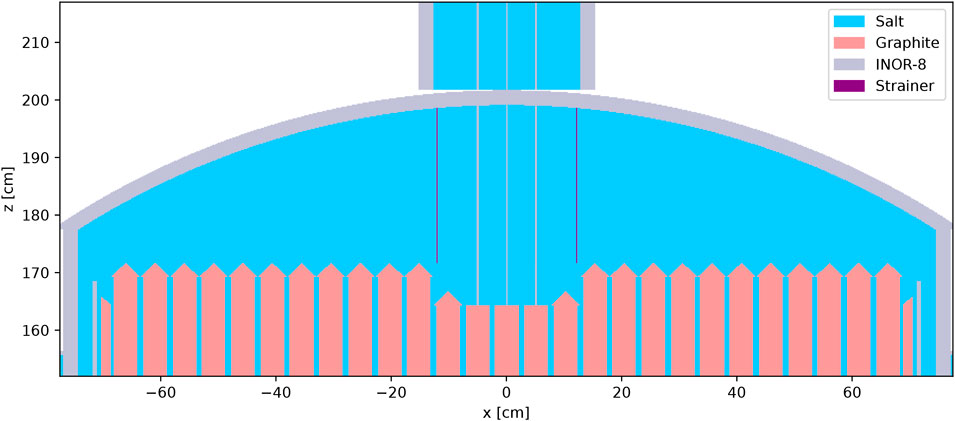
Figure 2. Vertical cross section at y = 0 cm of the converted OpenMC MSRE model showing the centering bridge region. For comparison to Serpent, see Figure 3.7 in Fratoni et al. (2020).
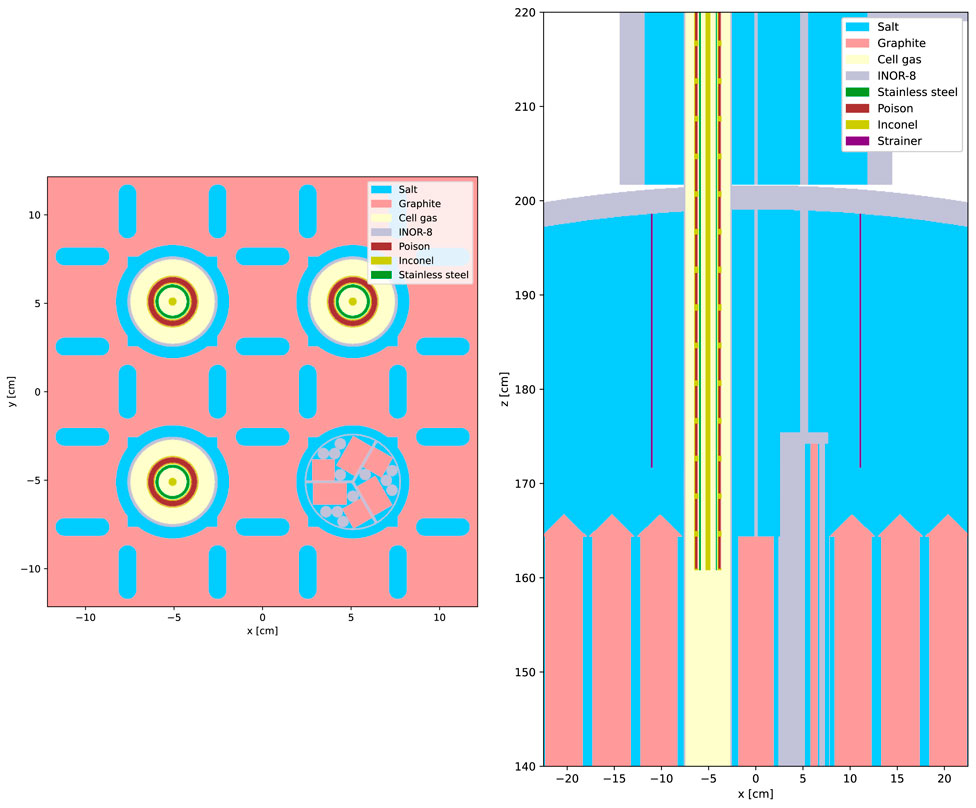
Figure 3. Cross sectional views of the converted OpenMC MSRE model showing the control rods and sample basket. (left) Horizontal cross section at z = 163 cm. (right) Vertical cross section at y = −5.083 cm. For comparison to Serpent, see Figure 3.8 in Fratoni et al. (2020) and Figure 3.18 in Shen et al. (2019).
2.2 CAD model development
A CAD representation of the MSRE core geometry has been accurately designed using the CAE tool Onshape based on official Oak Ridge National Laboratory technical drawings and made available under the GitHub openmsr/msre project5. A three dimensional section view of the CAD model is shown in Figure 4. The model also includes the three control rods and their guide thimbles as well as the surveillance assembly channel for studying materials in the reactor environment. The graphite matrix and the metal components have been expanded from ambient temperature to 911 K with thermal expansion coefficients of 2.7⋅10–6 K−1 and 1.4⋅10–5 K−1, respectively.
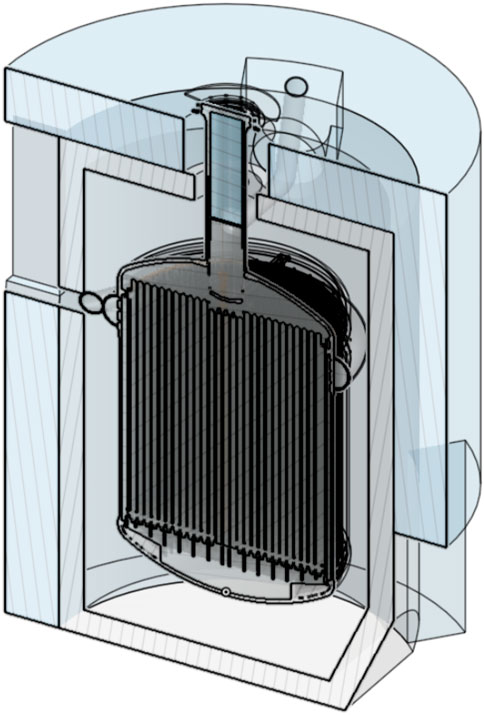
Figure 4. Section view of the CAD model of the MSRE. This view does not show the reactor cell vessel or other external structures that are present in the model.
Two separate STEP files have been exported from the CAD model: one for the reactor core and one for each control rod. In this way, we are able to create a distinct geometry “universe” for the control rod that can be copied and offset to create the other two. This allows a user to conveniently position the control rods within the core according to the simulated scenario. Coreform Cubit with the DAGMC plugin6 was then used with the STEP files to obtain a surface mesh readable by OpenMC with a faceting tolerance of 0.01 cm.
Several checks were performed on the validity of the CAD model. First, we compared the overall dimensions of major components, which are described in Table 3.1 of Fratoni et al. (2020), to the CSG model and found close agreement. While we attempted to carry out volume/mass calculations for the primary materials (salt, graphite, and INOR-8) to compare to data from the original MSRE reports (see Table 2.1 in Fratoni et al. (2020)), this was complicated by the fact that the models do not cover the full salt loop. Nevertheless, we were able to compare the total graphite volume between the CAD and CSG models which also closely agreed. To ensure consistency between the materials used in the CSG and CAD models, the material definitions were taken directly from the IRPhE benchmark description. Thus, the only differences in materials between the two models is for the regions in the CSG model where multiple materials were homogenized together.
2.3 Model differences and variations
The CSG and CAD models of the MSRE were both designed to accurately represent the configuration of the reactor so as to match the experimental measurements through simulation. For the CSG model, which was specifically constructed as part of an IRPhE benchmark, simplifications were sought that would not impact physical quantities like keff. To name a few—control rods and Inconel cables were represented as cylinders, flat geometry was employed for the top and bottom of the control rods, and the centering bridge was modeled as a homogeneous mixture of INOR-8 (Swindeman, 1961) and fuel salt. The CAD model on the other hand was designed to exactly match the experimental configuration with as much detail as possible, limited only by the availability of detailed drawings in the extant technical reports on the MSRE. Consequently, the CAD model in principle allows us to quantify the impact of modeling approximations that were made in the CSG model on simulation results. Upon visually inspecting the CSG and CAD models, several areas showing differences were deemed to be worthy of further investigation.
2.3.1 Thermal shield and outer structures
The first notable difference between the CSG and CAD models is how the structures outside of the reactor vessel were modeled. The CSG model includes an insulation layer, the thermal shield (represented as a homogeneous mixture of water and steel), and the thermal shield base. The thermal shield base itself is also a homogeneous mixture of materials rather than including the actual support structure, which contains fifteen steel I-beams arranged in two layers at right angles to each other (Robertson, 1965). While the CSG model has the cylindrical thermal shield completely covering the reactor, in the actual experiment there was a vertical section that was designed to fit the inside curvature of the reactor cell vessel and that effectively cut out part of the thermal shield as shown in Figure 5. As best as we can tell, this vertical section was not filled with water and steel balls like the thermal shield, meaning that it would provide a preferential path for neutron leakage. For the CAD model, an attempt was made to model the cutout in the thermal shield resulting from this vertical section. To study the impact of this vertical section cutout, a modified CSG model was prepared wherein a 90° segment of the thermal shield was removed up to a height of z = 47.451 cm to match the cutout on the CAD model. Results are provided in Section 3.
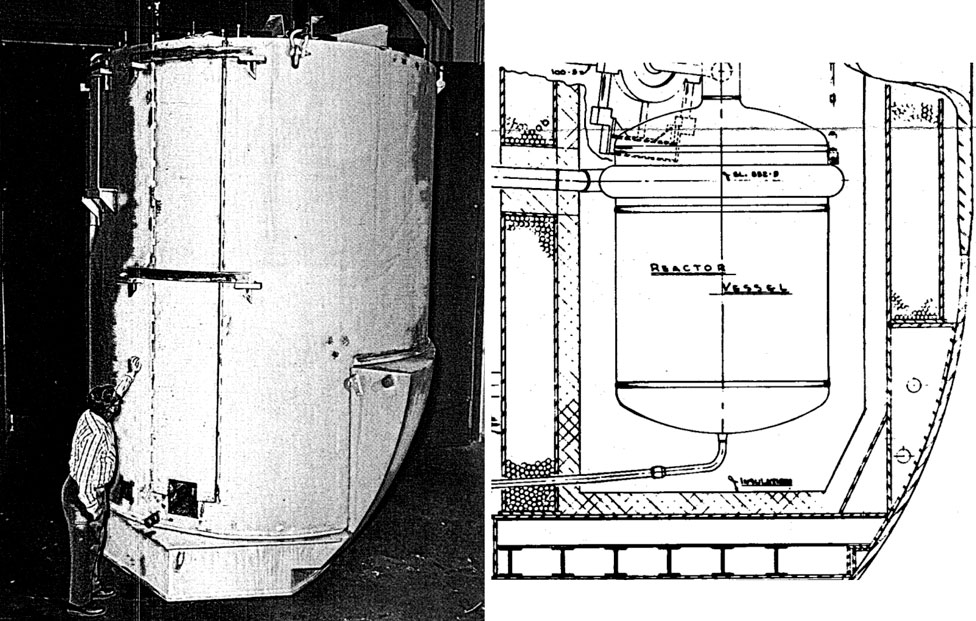
Figure 5. Thermal shield of the MSRE prior to installation. A vertical section that cuts into the shield can be seen at the bottom right. (left) Thermal shield prior to installation. (right) Reactor cell elevation view. Reproduced from Figures 5.2 and 5.20 in Robertson (1965).
Besides the cutout in the thermal shield, we also wanted to understand the impact of how the thermal shield base is modeled. The actual structure, with overlapping steel I-beams, is such that neutrons can easily leak through gaps between the I-beams. In the CSG model, however, the entire thermal shield base is homogenized so there are no preferential leakage pathways. To quantify the maximum impact of this modeling assumption, a modified CSG model was prepared where the thermal shield base was treated as void rather than being filled with a mixture of carbon steel and air. Once again, results are provided in Section 3.
Finally, note that all other structures beyond the thermal shield (such as the reactor cell) are not modeled in the CSG model. These structures are sufficiently far from the core that their omission is not expected to have any impact on neutronics behavior near the core.
2.3.2 Lower head
As in other regions of the reactor, the lower head in the CSG model is modeled with homogeneous materials, with a volume fraction of 90.8% of fuel salt and 9.2% INOR-8. These volume fractions are based on a 20-region model that was used at the time of MSRE operations to perform diffusion calculations (Haubenreich et al., 1965). However, based on the detailed CAD model, the volume fraction of INOR-8 in the lower head was calculated to be 15%; that is, the CSG model over-represents the amount of fuel salt that is present in the lower head, which tends to increase keff. The detailed CAD model for the lower head includes grid support plates and 48 anti-swirl vanes, where salt experiences a loss of its rotational motion; both are fabricated of INOR-8. A modified model was thus prepared wherein the lower head was filled with mixed material with 85% salt and 15% INOR-8 by volume.
3 Results
We present the comparisons of different models in several sections. First, in Section 3.1, we compare results on the OpenMC CSG model of MSRE to results on the original Serpent reference model. Section 3.2 briefly discusses the impact of using different cross section libraries. Then, in Section 3.3 we compare physical results on the OpenMC CSG and CAD models along with the variations on the CSG model described in Section 2.3. Lastly, in Section 3.4, we compare computational performance and memory use between the CSG and CAD models.
For all simulations, it was necessary to choose appropriate run parameters, namely, the number of inactive batches, the number of active batches, and the number of source neutrons per batch. To determine a sufficient number of inactive batches, an initial simulation was carried out with the OpenMC CSG model to measure the Shannon entropy, a metric that can be used to assess source convergence. This initial simulation used 106 source neutrons per batch and 200 total batches with a 30 × 30 × 30 uniform Cartesian mesh over the core to compute Shannon entropy. Figure 6 shows the resulting Shannon entropy normalized to its mean value over the last 100 batches. We see that the fission source converges very quickly for this model, which is expected given the small physical size of the reactor. Based on these results, we chose to run all subsequent simulations with 50 inactive batches.
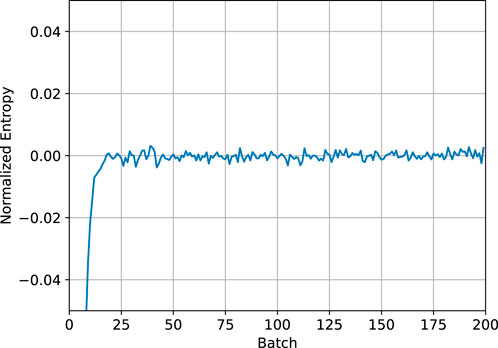
Figure 6. Normalized Shannon entropy for the OpenMC CSG model of the MSRE.
3.1 Serpent to OpenMC CSG comparison
With the original Serpent model autoconverted to an OpenMC model as described in Section 2.1, our first task is to compare the converted model to the Serpent reference model to confirm that it produces equivalent results. While one can compare to the reported keff value from Serpent from previous work (Shen et al., 2021), we have chosen to run Serpent simulations as well since several modifications were made in the Serpent model. Additionally, most of our OpenMC simulations are based on ENDF/B-VIII.0, and no keff value has been reported using Serpent with ENDF/B-VIII.0 data. Running Serpent also allows us to collect specific tallies for direct comparison to OpenMC, such as flux and reaction rate distributions.
The Serpent simulation was executed using Serpent version 2.1.32 on a workstation with two Intel Xeon Platinum 8260 processors. We used 50 inactive batches, 1,000 active batches, and 106 source neutrons per batch for a total of 109 active neutron histories. Tallies were defined for the flux over a 500 × 500 uniform grid in the x-y plane, a 500 group energy spectrum with equal lethargy energy bins, and the flux and fission neutron production rate over a uniform axial grid with 200 bins in the z direction. A developmental version of OpenMC7 was used for the OpenMC simulations (for reasons discussed in Section 4) with identical run parameters and tally definitions. OpenMC was run on the Improv cluster maintained by the Laboratory Computing Resource Center at Argonne National Laboratory using 64 nodes, each of which has two AMD EPYC 7713 processors.
Table 2 shows the reported keff for all simulations; the first two lines are the reference cases for both Serpent and OpenMC. We see that the keff for OpenMC is within 10 pcm of the value reported for Serpent; this is consistent with previous results showing excellent agreement between OpenMC and Serpent (Romano et al., 2021). Figure 7 shows the radial flux distribution as computed by OpenMC along with the relative difference between OpenMC and Serpent for the same distribution. The relative difference plot shows that over the core region, the relative difference is centered on zero with small stochastic noise. Outside of the core, stochastic noise from OpenMC and Serpent result in relative differences up to a few percent, but overall the distribution is still centered on zero.
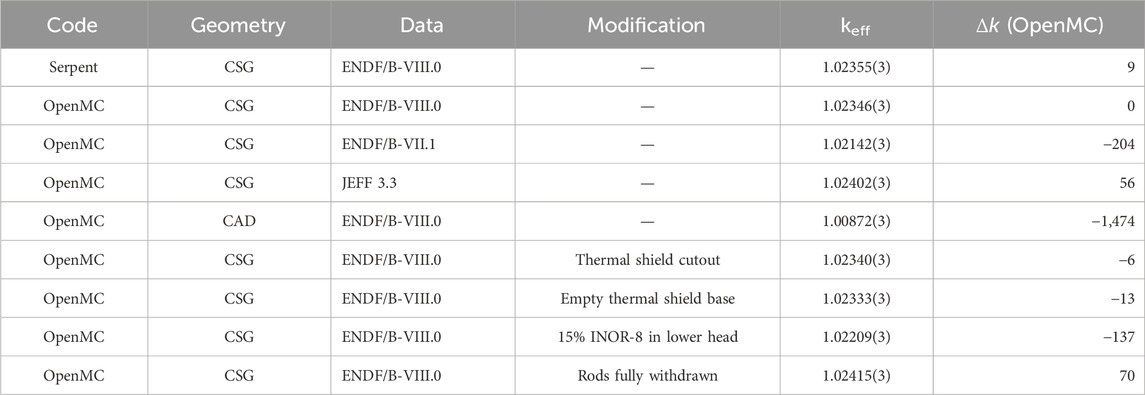
Table 2. Reported keff values for simulations of the MSRE models.
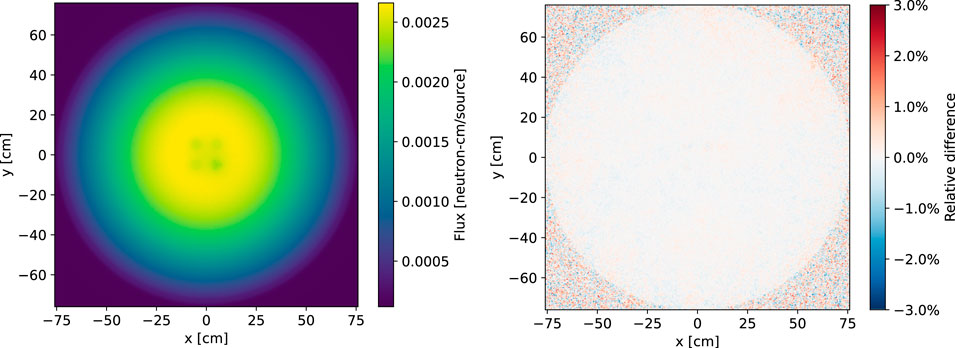
Figure 7. Spatial flux distribution in the x-y plane as computed by OpenMC (left) and the relative difference in flux between OpenMC and Serpent (right).
Figure 8 shows the flux distribution in the axial direction as computed by OpenMC and Serpent. While the distributions look visually identical on top, plotting the relative difference reveals differences of about 0.1% that—while quite small—are outside of the reported uncertainties. Relative differences of this magnitude could be the result of differences in methods between OpenMC and Serpent. It is also possible that the uncertainties themselves are underpredicted since they do not account for correlation between successive tally realizations.
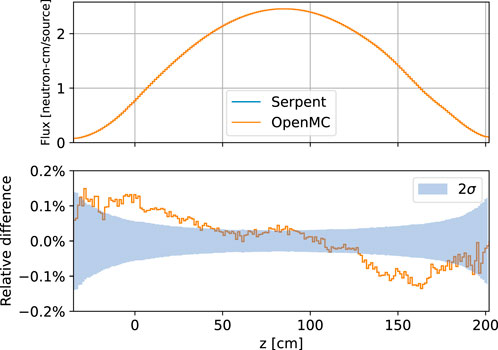
Figure 8. Axial flux distribution as computed by OpenMC and Serpent and the relative difference between them.
Figure 9 shows the energy distribution of the flux as computed by OpenMC and Serpent. Once again, the distributions look visually identical while the relative difference is outside of the reported uncertainties for same energy ranges. The differences are well under 1% over most energies, but larger differences are seen at thermal energies. This is most likely due to differences in how OpenMC and Serpent treat thermal scattering physics.
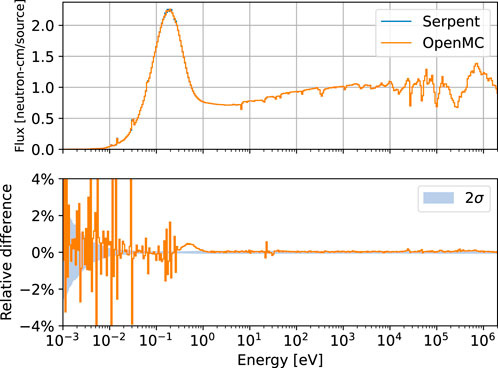
Figure 9. Flux energy spectrum as computed by OpenMC and Serpent and the relative difference between them.
3.2 Impact of different cross section libraries
The OpenMC CSG model of the MSRE was simulated with three different cross section libraries: ENDF/B-VIII.0, ENDF/B-VII.1, and JEFF 3.3. The reported keff values for each case are shown in Table 2. Consistent with previous results from the literature (as shown in Table 1), use of different cross section libraries only results in changes of up to ∼200 pcm.
3.3 OpenMC CSG to OpenMC CAD comparison
An OpenMC simulation of the CAD model was executed with the same run parameters and tally definitions as for the CSG model. The same ENDF/B-VIII.0 cross section data was also used. As listed in Table 2, the observed keff value for the CAD model was 1.00872, which is more than 1,000 pcm lower than the keff value for the CSG model. The impact of the model variations discussed in Section 2.3 was quantified through additional simulations on the modified CSG models; corresponding keff values are also shown in Table 2. None of these model variations had a substantial impact on the keff value; only the case with a 15% volume fraction for INOR-8 in the lower head produced a change of more than 100 pcm.
To study what might be responsible for the difference between the CAD and CSG models, we can look at differences in the radial and axial flux profiles. Figure 10 shows the relative difference in radial flux distribution between the CAD and CSG models. The areas that appear to be most discrepant are the control rods, sample basket, and ex-core regions. For each of these areas, the reported flux for the CAD model is consistently lower than for the CSG model. More revealing is a comparison of the neutron production rate along the axial direction between the two models, shown in Figure 11. Note that the integral of this distribution is keff, and thus it tells us where the difference in keff may originate from. There appears to be a large difference in the neutron production rate in the lower head. Recall that in the CSG model, the lower head is represented as a homogeneous mix of materials whereas the CAD model explicitly represents the structural supports below the graphite stringers. Further investigation is needed to determine whether these differences in the lower head are ultimately responsible for the large difference in keff between the two models.
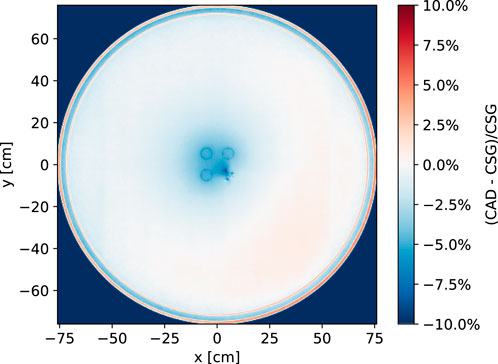
Figure 10. Relative difference in the spatial flux distribution in the x-y plane computed by OpenMC between the CAD and CSG models.
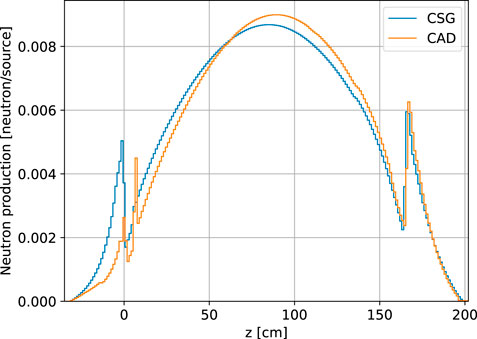
Figure 11. Axial neutron production distribution as computed by OpenMC for the CSG and CAD models.
3.4 Performance
In addition to the physical results obtained on the CSG and CAD OpenMC models of the MSRE, we have also performed simulations to assess performance and memory usage for the respective models. OpenMC handles CSG natively while its capability to handle CAD geometry relies on several software dependencies, namely, DAGMC and MOAB. Additionally, DAGMC has multiple ray tracers, one based on MOAB and another that relies on Embree (Wald et al., 2014) through a wrapper called double-down8. For both the CSG and CAD models, we ran short simulations on a single node of the Improv machine using only one of the AMD EPYC 7713 processors to look at thread scalability where we varied the number of threads from 1 up to 64, increasing by a factor of two each time. Each thread configuration was executed three times and we report the “best of three” performance. For each run, we used 104 source neutrons, 10 inactive batches, and 10 active batches. Two separate builds of OpenMC were used for the CAD model simulations, one that utilizes the Embree ray tracer through the double-down wrapper and one that relies on the ray tracer from MOAB.
Figure 12 shows the observed calculation rate as a function of the number of threads for the CSG and CAD models. Several observations immediately jump out. First, as perhaps one would expect, the CSG model showed the best performance at 1,535 neutrons/sec during inactive batches with 1 thread going up to 8.7 × 10⁴ neutrons/sec with 64 threads. For active batches, the calculation rate was about 30%–40% slower due to the extra computation necessary to accumulate tallies. Overall, when using 64 threads, the parallel efficiency for the CSG model was 88% and 76% for inactive and active batches, respectively. It is important to recognize that attaining perfect parallel efficiency is not possible because the threads have to share physical resources. Next, we see that the performance for the CAD model using the MOAB ray tracer is vastly lower than the CSG model at 55 neutrons/sec during active batches with 1 thread, or a factor of nearly 28× slower. Furthermore, the very poor thread scaling for MOAB means that the calculation rate only increases by a factor of two going from 1 to 64 threads. Consequently, at 64 threads, there is a huge performance gap of 860× and 542× between CSG and CAD with the MOAB ray tracer for inactive and active batches, respectively. However, use of DAGMC with the Embree ray tracer drastically improves the performance for simulations of the CAD model. With 1 thread, the performance in inactive batches is 16.7× higher with the Embree ray tracer than with the MOAB ray tracer. With 64 threads, using Embree is 382× faster than using MOAB. That being said, simulations on the CSG model were still 1.4–2.3× faster than on the CAD model using Embree.
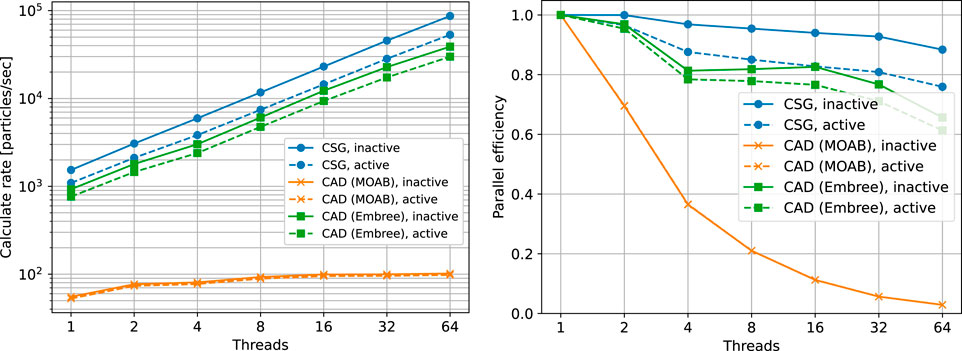
Figure 12. Observed calculation rate (left) and parallel efficiency (right) as a function of the number of OpenMP threads for OpenMC simulations of the CSG model and the CAD model using the MOAB and Embree ray tracers.
In addition to measuring the calculation rate for these models, we also measured initialization time and peak memory usage (resident set size) through short simulations, the results of which are shown in Table 3 along with a summary of the observed calculation rate. Simulations using the CAD model require additional initialization for creating acceleration data structures. When using the DAGMC build of OpenMC based on the MOAB ray tracer, the time for initialization was about 1 minute, whereas it was half a minute when using the Embree ray tracer. The acceleration data structures can also consume a significant amount of memory. While the CSG model required a little over 1 GB of memory, the CAD model required about 3 GB when using the MOAB ray tracer and over 5 GB when using the Embree ray tracer.
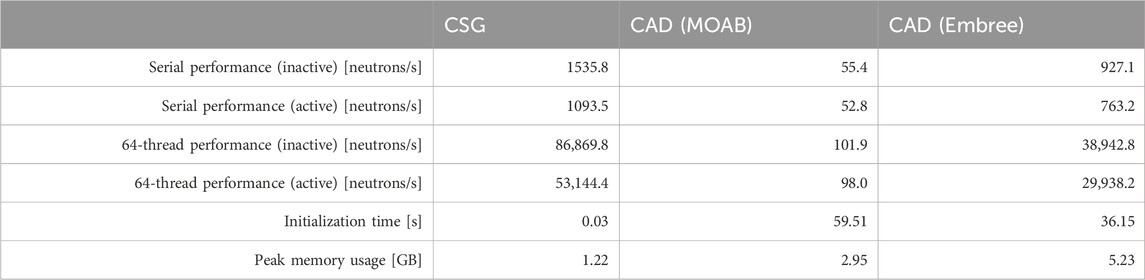
Table 3. Performance and memory usage for the CSG and CAD models.
4 Discussion
The results presented in Section 3 have illustrated a number of important facts. First, the comparison between OpenMC and Serpent on the CSG model of the MSRE shows that (1) the automated geometry conversion provided by the openmc_serpent_adapter package can successfully produce an OpenMC model based on an original Serpent model with very little effort, and (2) the observed keff, spatial flux distributions, and flux energy spectra exhibit very close agreement. With the MSRE reference model in OpenMC, the Python API gives us flexibility in performing further complex model manipulations with relative ease, such as those discussed in Section 2.3.
While the OpenMC CSG model is, by definition, an exact replica of the Serpent CSG model, the CAD model was developed independently (other than material definitions) by different researchers based on the same reports and papers from the literature. Our results show significant differences in both the keff value and flux distributions between the two models. The observed keff value for the CAD model is more than 1% lower than the value for the CSG model and, importantly, it is much closer to the experimental value of unity. It has remained an open question as to why the keff value for the reference model from IRPhE is more than 2% higher than experiment and many possible explanations have been put forward as discussed at length in Section 1.1. Our work shows that detailed modeling of the experimental geometry is a particularly important factor and—assuming the CAD model to be a more accurate representation of the experiment—could explain most of the overprediction in keff.
4.1 Recommendations for IRPhE benchmark
For this work, we were graciously provided the reference Serpent model that was used in support of the IRPhE MSRE-MSR-EXP-001 benchmark by researchers at the University of California, Berkeley. Several small issues were identified in this Serpent model, and we believe it would be in the interest of the community to distribute the model along with the handbook so that all researchers have a common example model to look at, and any issues in the model can be properly documented and incorporated in future editions of the handbook.
Our major finding is that the region of the reactor that seemed to be most different between the CSG and CAD models was the doweled sections at the end of the graphite stringers and the lower head. In the CSG model, this entire region is homogenized whereas it is explicitly modeled in the CAD model. Looking at Figure 11, this difference clearly plays a role in where fission neutrons are being produced and may ultimately be responsible for the substantially lower keff value observed for the CAD model. Further supporting this, we performed several additional simulations (not reported here) where the model was truncated at an elevation slightly above the bottom of the graphite stringers. Simulating only the upper portion of the reactor with the CSG and CAD models yielded similar keff values. We can conclude that the approach for representing the lower portion of the reactor vessel in the CSG model is inconsistent with the CAD model, and therefore recommend that benchmark evaluators pay particularly close attention to this region and further assess which model details are important to include.
4.2 Software needs and recommendations
OpenMC natively supports CSG as do most other MC codes, and this geometry representation has been stress tested on a wide variety of models of varying complexity. Transport on CAD-based geometries through DAGMC on the other hand does not have as wide a user base currently and is comparatively less mature. Nevertheless, being able to perform particle transport directly on CAD models is an important capability and can meet the complex modeling needs for many different systems. The results of the present study highlight some of the outstanding needs for transport on CAD-based geometries. Namely,:
• For the models of the MSRE tested here, we found a significant performance gap between the CSG and CAD representations, with the calculation rate on the CAD model being a factor of 1.4–2.3× slower than the CSG model when using the Embree ray tracer. Dedicated effort toward optimization of ray tracing and spatial searches on CAD geometries could help close this gap.
• For a model of equivalent physical extent, the CAD model required over 5 GB of memory when using the Embree ray tracer while the CSG model required about 1 GB of memory. Some of the memory usage is inherent in the geometry representation itself, while other areas of memory usage (e.g., spatial data structures for acceleration) could potentially be reduced. This is a particularly important point given that the area for which there is the strongest motivation to use CAD over CSG is for very complex models, which by their nature will result in large memory requirements. For DAGMC to remain a viable option for such models, it is important that the memory requirements remain within the limits of a reasonable system.
• Severe performance degradation was observed for simulation of the CAD model when using the MOAB ray tracer, both in terms of the single-thread performance as well as thread scalability, which is particularly important in light of the higher memory requirements for performing transport on CAD geometries. These results are consistent with previous results in the literature (Shriwise et al., 2022). Use of the Embree ray tracer via the double-down wrapper provides much better performance and thread scalability, but this is not widely known nor cleanly integrated in the software ecosystem yet. We recommend that the community move toward integrating a mature ray tracer such as Embree as a first-class feature. Anecdotally, we note that use of the Embree ray tracer by itself is considerably slower than using it in conjunction with double-down, which provides a methodical mixed-precision approach to ray tracing.
• While it is a bit more subjective, the software stack underpinning our simulations of the CAD model felt more fragile than the equivalent functionality for CSG. During the preparation of this work, several bugs in either MOAB, DAGMC, or OpenMC were uncovered and have—thankfully—been resolved. Some of these fixes were made after the most recent version of OpenMC was released, hence the need to use a developmental version of OpenMC for the results in Section 3. Further use of the DAGMC ecosystem for transport will continue to improve its robustness.
Data availability statement
The datasets presented in this study can be found in online repositories. The names of the repository/repositories and accession number(s) can be found below: https://doi.org/10.5281/zenodo.10651929.
Author contributions
SY: Investigation, Software, Writing–original draft. PR: Conceptualization, Funding acquisition, Methodology, Software, Writing–original draft. LC: Methodology, Writing–review and editing. EK: Methodology, Writing–review and editing. PS: Software, Writing–review and editing.
Funding
The author(s) declare that financial support was received for the research, authorship, and/or publication of this article. This research was supported by a strategic partnership project with Copenhagen Atomics, LLC. The material was based upon work supported by the U.S. Department of Energy, Office of Science, under contract DE-AC02-06CH11357.
Acknowledgments
We gratefully acknowledge the computing resources provided on Improv, a high-performance computing cluster operated by the Laboratory Computing Resource Center at Argonne National Laboratory. The authors gratefully acknowledge Prof. Massimiliano Fratoni for providing the Serpent 2 reference model of the MSRE. The first author, SY, would like to acknowledge the Republic of Turkey Ministry of National Education for supporting her graduate studies.
Conflict of interest
The authors declare that the research was conducted in the absence of any commercial or financial relationships that could be construed as a potential conflict of interest.
Publisher’s note
All claims expressed in this article are solely those of the authors and do not necessarily represent those of their affiliated organizations, or those of the publisher, the editors and the reviewers. Any product that may be evaluated in this article, or claim that may be made by its manufacturer, is not guaranteed or endorsed by the publisher.
Footnotes
1https://github.com/inr-kit/McCAD-Library
2https://github.com/GEOUNED-code/GEOUNED
3https://github.com/openmc-dev/openmc_serpent_adapter/
4https://github.com/openmc-dev/openmc_mcnp_adapter/
5https://github.com/openmsr/msre
6https://github.com/svalinn/cubit-plugin
7git SHA1 hash: f14fc55e60463710d3f165b0a9cdc2ef9fee1534.
8https://github.com/pshriwise/double-down
References
Agostinelli, S., Allison, J., Amako, K., Apostolakis, J., Araujo, H., Arce, P., et al. (2003). Geant4—a simulation toolkit. Nucl. Instrum. Methods Phys. Res. Sect. A Accel. Spectrom. Detect. Assoc. Equip. 506, 250–303. doi:10.1016/S0168-9002(03)01368-8
Barlow, J. E., and Clarno, K. T. (2020). Validation of SCALE for molten salt reactors using the MSRE benchmark. Trans. Am. Nucl. Soc. 123, 1467–1470. doi:10.13182/T123-33057
Bostelmann, F., Skutnik, S. E., Walker, E. D., Ilas, G., and Wieselquist, W. A. (2022). Modeling of the molten salt reactor experiment with SCALE. Nucl. Technol. 208, 603–624. doi:10.1080/00295450.2021.1943122
Brown, D. A., Chadwick, M. B., Capote, R., Kahler, A. C., Trkov, A., Herman, M. W., et al. (2018). ENDF/B-VIII.0: the 8th major release of the nuclear reaction data library with CIELO-project cross sections, new standards and thermal scattering data. Nucl. Data Sheets 148, 1–142. doi:10.1016/j.nds.2018.02.001
Chadwick, M. B., Herman, M., Obložinský, P., Dunn, M., Danon, Y., Kahler, A., et al. (2011). ENDF/B-VII.1 nuclear data for science and Technology: cross sections, covariances, fission product yields and decay data. Nucl. Data Sheets 112, 2887–2996. doi:10.1016/j.nds.2011.11.002
Clarno, K. T., Barlow, J. E., Sawyer, T., Scherr, J., Hearne, J., and Tsvetkov, P. (2023). Evaluation of SCALE, Serpent, and MCNP for molten salt reactor applications using the MSRE benchmark. Ann. Nucl. Energy 194, 110092. doi:10.1016/j.anucene.2023.110092
Conlin, J., Haeck, W., Neudecker, D., Parsons, D. K., and White, M. C. (2018). Release of ENDF/B-VIII.0-Based ACE data files. Tech. Rep. LA-UR-18-24034, Los Alamos national laboratory. Los Alamos: New Mexico. doi:10.2172/1438139
Fratoni, M., Shen, D., Ilas, G., and Powers, J. (2020). Molten salt reactor experiment benchmark evaluation. Berkeley: University of California. Tech. Rep. DOE-UCB-8542. doi:10.2172/1617123
García, J., Catalán, J. P., and Sanz, J. (2021). Development of the automatic void generation module in GEOUNED conversion tool. Fusion Eng. Des. 168, 112366. doi:10.1016/j.fusengdes.2021.112366
Graham, A. M., Taylor, Z., Collins, B. S., Salko, R. K., and Poschmann, M. (2021). Multiphysics coupling methods for molten salt reactor modeling and simulation in VERA. Nucl. Sci. Eng. 195, 1065–1086. doi:10.1080/00295639.2021.1901000
Harb, M., Leichtle, D., and Fischer, U. (2023). A novel algorithm for CAD to CSG conversion in McCAD. J. Nucl. Eng. 4, 436–447. doi:10.3390/jne4020031
Hartanto, D., Davidson, E., Godfrey, A., Cao, Y., and Fei, T. (2023). Molten salt reactor experiment simulation using shift/griffin. Oak Ridge, Tennessee: Oak Ridge National Laboratory. Tech. Rep. ORNL/TM-2023/3005. doi:10.2172/1997706
Haubenreich, P. N., Engel, J. R., Prince, B. E., and Claiborne, H. C. (1965). MSRE design and operations report, Part III, nuclear analysis. Oak Ridge, Tennessee: Oak Ridge National Laboratory. Tech. Rep. ORNL-TM-730. doi:10.2172/4114686
Kulesza, J. A., Adams, T. R., Armstrong, J. C., Bolding, S. R., Brown, F. B., Bull, J. S., et al. (2022). MCNP code version 6.3.0 theory & user manual. Los Alamos: New Mexico. Tech. Rep. LA-UR-22-30006, Los Alamos National Laboratory. doi:10.2172/1889957
Leppänen, J. (2022). Methodology, applications and performance of the CAD-based geometry type in the serpent 2 Monte Carlo code. Ann. Nucl. Energy 176, 109259. doi:10.1016/j.anucene.2022.109259
Leppänen, J., Pusa, M., Viitanen, T., Valtavirta, V., and Kaltiaisenaho, T. (2015). The Serpent Monte Carlo code: status, development, and applications in 2013. Ann. Nucl. Energy 82, 142–150. doi:10.1016/j.anucene.2014.08.024
Nasif, H. R., Masuda, F., Morota, H., Iida, H., Sato, S., and Konno, C. (2012). Development of CAD-MCNP interface program GEOMIT and its applicability for ITER neutronics design calculations. Nucl. Technol. 180, 89–102. doi:10.13182/NT12-A14521
Pandya, T. M., Johnson, S. R., Evans, T. M., Davidson, G. G., Hamilton, S. P., and Godfrey, A. T. (2016). Implementation, capabilities, and benchmarking of Shift, a massively parallel Monte Carlo radiation transport code. J. Comput. Phys. 308, 239–272. doi:10.1016/j.jcp.2015.12.037
Parsons, D. K., and Toccoli, C. A. (2020). Re-Release of the ENDF/B-viii.0 S(α, β) data Processed by NJOY2016. Tech. Rep. LA-UR-20-24456. Los Alamos, New Mexico: Los Alamos National Laboratory. doi:10.2172/1634930
Robertson, R. C. (1965). MSRE design and operations report, Part I, description of reactor design. Oak Ridge, Tennessee: Oak Ridge National Laboratory. Tech. Rep. ORNL-TM-728. doi:10.2172/4654707
Romano, P. K., Horelik, N. E., Herman, B. R., Nelson, A. G., Forget, B., and Smith, K. (2015). OpenMC: a state-of-the-art Monte Carlo code for research and development. Ann. Nucl. Energy 82, 90–97. doi:10.1016/j.anucene.2014.07.048
Romano, P. K., Josey, C. J., Johnson, A. E., and Liang, J. (2021). Depletion capabilities in the OpenMC Monte Carlo particle transport code. Ann. Nucl. Energy 152, 107989. doi:10.1016/j.anucene.2020.107989
Romano, P. K., Shriwise, P., Harper, S., Johnson, A., Tramm, J., and Liang, J. (2022). OpenMC 0.13.0. doi:10.5281/zenodo.6079155
Shen, D., Fratoni, M., Ilas, G., and Powers, J. (2019). Molten-salt reactor experiment (MSRE) zero-power first critical experiment with 235U. France: OECD Nuclear Energy Agency. Tech. Rep. NEA/NSC/DOC(2006)1; MSRE-MSR-EXP-001 CRIT.
Shen, D., Ilas, G., Powers, J. J., and Fratoni, M. (2021). Reactor physics benchmark of the first criticality in the molten salt reactor experiment. Nucl. Sci. Eng. 195, 825–837. doi:10.1080/00295639.2021.1880850
Shriwise, P. C., Wilson, P. P. H., Davis, A., and Romano, P. K. (2022). Hardware-accelerated ray tracing of CAD-based geometry for Monte Carlo radiation transport. Comput. Sci. Eng. 24, 52–61. doi:10.1109/MCSE.2022.3154656
Shriwise, P. C., Zhang, X., and Davis, A. (2020). DAG-OpenMC: CAD-based geometry in OpenMC. Trans. Am. Nucl. Soc. 122, 395–398. doi:10.13182/t122-32104
Swindeman, R. W. (1961). The mechanical properties of INOR-8. Oak Ridge, Tennessee: Oak Ridge National Laboratory. Tech. Rep. ORNL-2780.
Talamo, A., Gohar, Y., and Leppänen, J. (2018). SERPENT validation and optimization with mesh adaptive search on stereolithography geometry models. Ann. Nucl. Energy 115, 619–632. doi:10.1016/j.anucene.2018.01.012
Tsige-Tamirat, H., and Fischer, U. (2005). “CAD interface for Monte Carlo particle transport codes,” in The Monte Carlo Method: Versatility Unbounded in a Dynamic Computing World, Chattanooga, Tennessee, 17-21 April 2005.
Valentine, A., Berry, T., Bradnam, S., Hagues, J., and Hodson, J. (2022). Benchmarking of emergent radiation transport codes for fusion neutronics applications. Fusion Eng. Des. 180, 113197. doi:10.1016/j.fusengdes.2022.113197
Wald, I., Woop, S., Benthin, C., Johnson, G. S., and Ernst, M. (2014). Embree: a kernel framework for efficient CPU ray tracing. ACM Trans. Graph. 33, 1–8. doi:10.1145/2601097.2601199
Wang, D., Yu, S., Wang, G., Long, P., Wang, D., Nie, F., et al. (2014). MCAM 5: an advanced interface program for multiple Monte Carlo codes. SNA + MC 2013 (Paris, France), 02508. doi:10.1051/snamc/201402508
Wang, X., Li, J.-L., Wu, Z., Gao, S.-S., Qiu, R., Deng, L., et al. (2020). CMGC: a CAD to Monte Carlo geometry conversion code. Nucl. Sci. Tech. 31, 82. doi:10.1007/s41365-020-00793-8
Weinhorst, B., Fischer, U., Lu, L., Qiu, Y., and Wilson, P. (2015). Comparative assessment of different approaches for the use of CAD geometry in Monte Carlo transport calculations. Fusion Eng. Des. 98–99, 2094–2097. doi:10.1016/j.fusengdes.2015.06.042
Wieselquist, W., and Lefebvre, R. A. (2023). SCALE 6.3.1 user manual. Tech. Rep. ORNL/TM-SCALE-6.3.1. Oak Ridge, Tennessee: Oak Ridge National Laboratory. doi:10.2172/1959594
Wilson, P. P., Tautges, T. J., Kraftcheck, J. A., Smith, B. M., and Henderson, D. L. (2010). Acceleration techniques for the direct use of CAD-based geometry in fusion neutronics analysis. Fusion Eng. Des. 85, 1759–1765. doi:10.1016/j.fusengdes.2010.05.030
Keywords: CAD, constructive solid geometry (CSG), molten salt reactor, MSRE, OpenMC, Serpent
Citation: Yilmaz S, Romano PK, Chierici L, Knudsen EB and Shriwise PC (2024) CAD and constructive solid geometry modeling of the Molten Salt Reactor Experiment with OpenMC. Front. Nucl. Eng. 3:1385478. doi: 10.3389/fnuen.2024.1385478
Received: 12 February 2024; Accepted: 03 April 2024;
Published: 09 May 2024.
Edited by:
Arkady Serikov, Karlsruhe Institute of Technology (KIT), GermanyReviewed by:
Jacques Lechelle, Commissariat à l’Energie Atomique et aux Energies Alternatives (CEA), FranceGert Van den Eynde, Belgian Nuclear Research Centre (SCK CEN), Belgium
William Wieselquist, Oak Ridge National Laboratory (DOE), United States
Copyright © 2024 Yilmaz, Romano, Chierici, Knudsen and Shriwise. This is an open-access article distributed under the terms of the Creative Commons Attribution License (CC BY). The use, distribution or reproduction in other forums is permitted, provided the original author(s) and the copyright owner(s) are credited and that the original publication in this journal is cited, in accordance with accepted academic practice. No use, distribution or reproduction is permitted which does not comply with these terms.
*Correspondence: Seda Yilmaz, c3lpbG1hemtAcHVyZHVlLmVkdQ==