 Eliel Villa-Aleman*
 Jason R. Darvin
- Savannah River National Laboratory, Aiken, SC, United States
Spectroscopic analysis of radiological materials has been historically limited to radiological labs with older or less advanced scientific instrumentation. The development of double-walled cells (DWCs) at the Savannah River National Laboratory (SRNL) has enabled Pu-bearing compounds to be removed from radiological laboratories and studied in our radiologically clean spectroscopy laboratory with state-of-the-art instrumentation. In this manuscript, we discuss the contributions of DWCs that have allowed the application of Raman spectroscopy, diffuse reflectance infrared Fourier transform spectroscopy (DRIFTS), diffuse reflectance spectroscopy (DRS) in the shortwave infrared, and gamma spectroscopy at SRNL. Significant advances have been made in the understanding of the thermal decomposition of Pu(III) and Pu(IV) oxalates, alpha-induced damage to the PuO2 crystal lattice, and the effect of calcination temperatures on the quality of PuO2. These techniques have enabled methods to conduct PuO2 age dating since last calcination and estimate the calcination temperature with Raman spectroscopy and DRS. Additional spectroscopic information measured with DRIFTS has enabled the observation of the evolution of carbon species with calcination temperature, while gamma spectroscopy provides information on age dating since last purification.
1 Introduction
The safe handling of radiological materials, such as plutonium, is conducted in radiological hoods and gloveboxes. This containment of radiological materials is extremely important for avoiding personnel and environmental contamination. The placement of equipment for spectroscopic analysis inside radiological hoods presents significant challenges for instrument operation, cleaning, and repair. In general, the spectroscopic characterization of plutonium-bearing compounds contained within radiological spaces is conducted with fiber optics to deliver the light to the sample and extract spectroscopic information. Light throughput with fiber optics is more limited than with direct light input methodologies. The spectroscopic signal of interest is degraded due to such factors as reduced light transmission, a decrease in throughput between the coupling of free-space optical lenses and fibers, and the creation of Raman scattering from optical fibers. Despite the significant number of challenges in radiological sample handling and the instrumentation available in radiological laboratories, a significant volume of spectroscopic research on plutonium-bearing compounds has been accomplished since the 1940s; however, this research into plutonium-bearing compounds occurred exclusively in radiological laboratories, frequently gloveboxes. However, techniques have been used to contain radiological materials, such as epoxy resins and doubly contained or triply-contained sample holders. Material analysis within a glovebox significantly limits the size and quality of scientific instrumentation for spectroscopic analysis. Containment within epoxy resins can result in unwanted spectroscopic signals that obscure the signal of interest or are opaque in certain spectral regions. Literature describing double- or triple-contained samples are sparse on the specific details of the materials used for containment, although it is unlikely that these sample holders are compatible with to instruments that can perform spectroscopic analysis that range from deep UV to mid-wave infrared. Further spectroscopic advances with new technologies, such as non-linear spectroscopies, are limited by the space available in radiological laboratories. New laser-based technologies are bulky, expensive, and difficult to introduce into radiological facilities. Advanced spectroscopic characterization of actinide materials has required the development of new methodologies to conduct analysis of radiological material outside of radiological gloveboxes and laboratories.
To address this challenge, we developed the double-walled cell (DWC) concept to remove the complexities of conducting spectroscopic analysis in radiological gloveboxes, lower the costs associated with the preparation and handling of radiological material, characterize samples with advanced instrumentation, and provide a path for sample storage for further analysis years later. DWCs enable the investigation of radiological materials in a “clean” laboratory without the use of gloveboxes’ contamination issues; therefore, numerous optical instrumentations are available for spectroscopic analysis. DWCs enable various light sources to be directed onto radiological material enabling analysis of the material with vibrational (Raman and infrared) and luminescence spectroscopy. Our development has enabled mg quantities of a sample to be analyzed in a low-level counting facility for gamma emission spectroscopy or studied with techniques such as electron paramagnetic resonance (EPR). Laser ablation experiments in double-walled containment preserve ejected material for further analysis. Such exciting methods of sample analysis from microgram to milligram quantities with DWCs are opening new dimensions for research, including non-linear spectroscopies.
For a typical DWC-based experiment, radiological material—primarily Pu-bearing compounds—is fixed on a sticky scanning electron microscopy (SEM) tape located in the inner cell. Once the material has been fixed to the bottom of the cell, a lid with a window is screwed to the base to seal the radiological material. The inner cell is handled in a radiologically contaminated hood or a glovebox; it is therefore assumed to be contaminated. The inner cell is then transferred to an outer clean cell (not exposed to the contaminated hood/glovebox). Once the inner cell has been placed inside a secondary container, the lid of the outer cell is screwed in place to isolate the potentially contaminated inner cell. The outer surface of the double-walled cell is checked for contamination prior to relocation to a clean laboratory equipped with advanced spectroscopic instrumentation. BaF2 windows are used in the inner and outer cells; these enable the transmission of light from deep ultraviolet light to infrared (∼800 cm−1). Wide optical transmission enables the characterization of radiological material using a variety of spectroscopic instrumentation.
The design of each cell is dictated by the spectroscopic application employed to characterize a material. Raman, fluorescence, and infrared spectroscopy are conducted in the standard DWC design. In contrast to the standard design, a DWC for laser ablation was designed with a larger gap between the inner window and the material on the sticky tape to ensure that laser pulses are not focused on the window. A multiple port cell (five) has been designed to conduct pump–probe experiments such as monitoring plasma constituents (elemental and molecular) with absorption and fluorescence spectroscopy. Other cells have been designed for laser filamentation to accommodate the interface between non-ionizing and ionizing beams and with multiple windows perpendicular to the ablation beam for interrogation. Figure 1 shows the preliminary DWC design and the standard DWC design used in most characterization experiments.
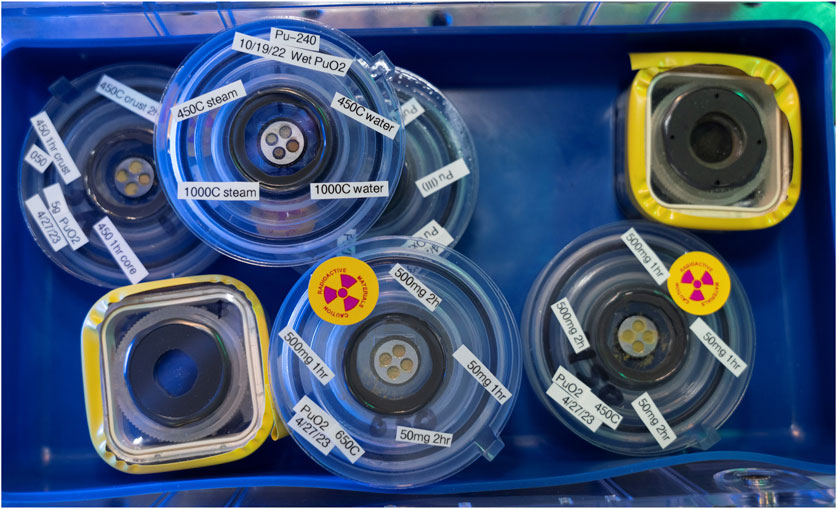
FIGURE 1. Several double-walled cells containing Pu-bearing compounds. The smaller cells, surrounded in yellow tape, are the preliminary design. The round cells are the standard design now used in most characterization experiments. Details of the design can be found in U.S. patent application US17/523,333.
Current work in the analysis of Pu-bearing compounds includes the following techniques:
1. Raman spectroscopy—Raman scattering provides information such as a material’s crystallinity, time elapsed since last calcination, and resonance electronic bands in PuO2.
2. Infrared spectroscopy (800–7,500 cm−1)—This facilitates understanding of the water content in PuO2, carbon species from the thermal decomposition of Pu oxalates in the material at varying calcination temperatures, and electronic bands.
3. Diffuse reflectance spectroscopy (DRS)—DRS is a great tool for understanding electronic transitions. The ligand attached to the Pu atom significantly affects electronic energy levels and provides key signatures for material identification and calcination temperature. DRS has been used to study Pu-bearing compounds from 1,600 nm to 400 nm (shortwave infrared to the ultraviolet spectral region).
4. Gamma emission spectroscopy—Isotope quantities in a sample can be used to understand the age of a material since its last purification. With the use of DWCs, these samples can now be studied in low-level counting facilities.
5. Luminescence spectroscopy—This helps gain an understanding of the age of the material and its impurity content. Samples of aged PuO2 (primarily low calcination temperature) have been observed to show significant fluorescence due to the alpha decay defect in the crystal lattice. Although the sources of the luminescence have not been conclusively identified, defects and impurities are most likely responsible for energy levels in the optical band gap that promote electrons to the conduction band with resultant luminescence.
6. Cryogenic spectroscopic investigations—Raman, luminescence, and DRS can gain significant information from a reduction in the band congestion. Spectroscopy at liquid nitrogen (LN) temperatures can help investigate such things as impurities and alpha-decay-induced chemistry. A double-walled cuvette has been designed and is undergoing a series of tests in our laboratory.
7. Electron paramagnetic resonance (EPR)—EPR signals have been studied to understand ligand–metal interactions. The new approach is to study gamma-irradiated or aged Pu-bearing compounds with EPR using a double-walled tube for EPR studies.
8. Laser-induced thermo-Raman/luminescence studies of Pu-bearing materials—The high light absorptivity of Pu-bearing compounds provides a means of increasing surface temperature. Laser-induced thermal ramps can be used to monitor temperature dependent luminescence, or the material can be thermally treated at a given temperature prior to studies at room temperature. The thermal step approach enables high-resolution calcination of material and the study of impurity energy levels, material crystallinity, water removal, and weak electronic band identification, among other things.
9. Hyper Raman spectroscopy—This spectroscopy technique has been used to understand the far IR bands in CeO2. Current work is underway in the study of PuO2.
10. Laser ablation spectroscopy (LIBS)—LIBS studies of PuO2 in DWC has provided new ways to study the material. Current studies of PuO2 pellets are unique in the field of LIBS. This new approach enables the study of particulate morphologies while identifying plasma temperatures.
In the interest of providing emerging scientists in the nuclear forensics community with a summary of our work and upcoming research areas, we have decided to limit our content in this manuscript to the Raman infrared diffuse reflectance in the shortwave and gamma spectroscopy of PuO2 and organic signatures observed in the conversion of Pu oxalates to PuO2.
2 Materials and methods
2.1 Material synthesis
Plutonium material processing and synthesis was performed in a negative pressure radiological glovebox. The PuO2 used for the experiments detailed in this manuscript was primarily produced from the calcination of Pu(IV) oxalate and is detailed by Christian et al. (2022). A limited number of experiments were performed with PuO2 produced from the calcination of Pu(III) oxalate, with the synthesis detailed by Christian et al. (2023).
2.2 Raman spectroscopy
The Raman spectrometer used for the work presented here has been described previously (Villa-Aleman et al., 2019a; Villa-Aleman et al., 2019b; Villa-Aleman et al., 2020; Villa-Aleman et al., 2021a; Villa-Aleman et al., 2021b; Christian et al., 2022; Villa-Aleman et al., 2022; Villa-Aleman et al., 2023a; Villa-Aleman et al., 2023b; Christian et al., 2023). In brief, a LabRAM HR800 UV Horiba Jobin-Yvon commercial instrument was used for Raman measurements. The spectrometer was modified as necessary for a given experiment. Raman measurements with UV excitation wavelengths were performed using a Newton EMCCD detector (Andor 970N-UVB), and measurements with visible excitation wavelengths were performed using an iDus detector (Andor DU416A-LDC-DD). An 1,800 g/mm grating was used in the spectrometer. The laser was focused onto the sample with a ×50 objective; typical laser powers for measurements ranged from 0.25 to 0.5 mW.
2.3 Infrared spectroscopy
Diffuse reflectance FTIR was performed using a Nicolet 6700 spectrometer coupled to a Continuum IR microscope as described previously (Christian et al., 2021; DeVore et al., 2021; Christian et al., 2022; Christian et al., 2023). Spectra were acquired from 800–4,000 cm−1 and collected with 4 cm−1 resolution. Up to 2,000 spectra were co-added during a single data acquisition period.
2.4 Diffuse reflectance spectroscopy
Diffuse reflectance spectroscopy measurements were made using a Kymera 328i spectrometer coupled to an Olympus microscope as described in detail in Villa-Aleman et al. (2023a). A 600 g/mm grating blazed at 1,200 nm was used to disperse light onto a iDus InGaAs-1.7 detector. Measurements were made in the shortwave infrared from 930 to 1,600 nm and had a spectral resolution of 1.0 nm.
2.5 Gamma spectroscopy
An underground counting facility (UCF) at SRNL was used to measure samples containing ultra-low-level gamma-emitting isotopes (Winn et al., 1988). The facility contains a 4-in-thick vault constructed of pre-WWII steel amour plate from USS Antietam (CV-36) located 48 ft below ground and backfilled with specular hematite, clay, and borated cement for a total water overburden equivalency of 31.7 m. Spectral background contributions attributed to natural background gamma radiation were suppressed by a factor of approximately 300 in the coaxial p-type high-purity germanium (HPGe) and n-type IGLET HPGe detectors housed in the UCF. The HPGe detectors are shielded by a layer of high purity copper to inhibit the intrusion of low-energy X-rays from the outermost layer of unsealed lead bricks which provide further shielding from background radiation sources. Radon daughter pileup, introduced to the system during sample placement, is minimized by a slow purge of off-gassed liquid nitrogen into the detector chamber, and a 24-h waiting period is applied prior to data acquisition. Specialized holders were developed to mount the DWCs directly atop the HPGe detector crystal. These holders provide a reproducible sample geometry for any sample contained within a DWC. Three PuO2 samples, all different ages, were mounted atop a low background detector. Because a representative gamma standard was not available, collected measurements were analyzed using counting efficiencies calculated from a stainless-steel circular (3 mm diameter) disc plated with 239Pu in January 1986.
3 Results and discussion
3.1 Raman spectroscopy
The doubled-walled cells developed at SRNL paved the way for the characterization of limited quantities of PuO2 (<2 mg) with advanced spectroscopic instrumentation. The first study using the DWCs was Raman spectroscopy of PuO2 (Villa-Aleman et al., 2019a). The cells eliminated the hazards of potential contamination to personnel and instrumentation; the consequent reduced costs associated with handling nuclear material led to an increase in productivity. This approach simplified the long-term storage of radiological material and allowed temporal spectroscopic studies to be easily performed (Villa-Aleman et al., 2019b). Indirect methods of sample heating were developed with a laser which allowed the comparison of oven calcined samples (450 °C–1,000 °C) versus laser-induced calcined samples (≥1,125 °C) (Villa-Aleman et al., 2019a; Villa-Aleman et al., 2021a). The dual use of a laser using a fully automated Raman microscope enabled us to conduct automated laser-induced annealing studies of PuO2 (Villa-Aleman et al., 2021a). Software developed in-house controlled the laser power at the sample (temperature), estimated the temperature caused by laser induced annealing with the Stokes and anti-Stokes bands, and measured the effect of the temperature on the PuO2 spectrum. The software we developed enabled us to conduct high-resolution Raman experiments lasting several days without human intervention. Fiduciary points were used to revisit laser annealed spots (10 μm in diameter) and conduct monthly measurements on 240PuO2 over 3 years (Villa-Aleman et al., 2019b). Measurements on the laser-annealed spots were compared with random analyses of 240PuO2 aged ≥ 3 months. Our temporal measurement approach revealed that radiolytic aging of PuO2 measured by Raman spectroscopy follows the same trends observed with X-ray diffraction studies (Weber, 1983). The superimposition of the laser-annealed spots with oven-calcined aged samples made us confident that the data were robust in its characterization of the material. The plethora of laser excitation wavelengths provided a new way to study resonance Raman and the effect of laser wavelength on the Raman spectra. The Raman scattering of PuO2 measured with 405, 457, 488, 514, 561, 633, and 785 nm excitation wavelengths has been published in the literature by our group (Villa-Aleman et al., 2019a). Although the spectra of PuO2 acquired with 355, 325, and 244 nm (at least the T2g band) have been published previously, our non-published work (manuscript under preparation) describes potential new assignments to different band frequencies observed in the spectra to surface modes.
The Raman work conducted since 2015 with DWCs has been extensive and has revolutionized the understanding of PuO2 and other precursors. Previously published and unpublished Raman scattering data are presented to provide a cohesive understanding of our work and introduce young scientists to the use of Raman spectroscopy to aid in understanding PuO2 with the goal of developing potential spectroscopic signatures for nuclear forensics.
3.1.1 Raman spectrum of PuO2
PuO2 possesses a fluorite structure group with a face-centered cubic sublattice (Sarsfield et al., 2012). Group theory analysis predicts one Raman mode, the T2g mode located near 480 cm−1, and two infrared active modes located near 270 and 580 cm−1 (Gilson and Hendra, 1970; Sarsfield et al., 2012). However, the typical Raman spectrum of PuO2 exhibits several bands which are unaccounted for by group theory. Figure 2 shows the typical Raman spectrum of PuO2 calcined at 450, 650, and 1,000 °C (Villa-Aleman et al., 2019a; Villa-Aleman et al., 2021b). Five dominant Raman bands were present in the spectrum at 479, 581, 1,163, 2,135, and 2,635 cm−1, and ten additional bands were consistently observed in the spectra at 300, 450, 625, 1,043, 1,580, 2,045, 2,425, 2,600, 2,740, and 2,940 cm-1. Additional bands in the defect band spectral region (550–670 cm-1) were observed to have emerged in the spectrum with age since last calcination. The T2g mode (1LO1) located near 480 cm-1 is the only Raman allowed transition from a fluorite structure group (Schoenes, 1980; Sarsfield et al., 2012). The defect band located at 581 cm−1 has been suggested to be the 1LO2 mode which is an IR-active band (Schoenes, 1980). The 1,163 cm−1 band is attributed to an overtone band of the 1LO2 mode (i.e., 2LO2) (Livneh and Sterer, 2006; Jégou et al., 2010). Naji et al. (2017) postulated that the band at ∼1,580 cm−1 corresponds to C=C bonds. Unpublished laser annealing work by our group with a PuO2 pellet calcined at 450°C and a comprehensive understanding of our work since 2015 has clearly established that the 1,580 cm−1 corresponds to the graphite band of carbon often observed in graphitic materials and other carbonaceous soots (Sadezky et al., 2005; Villa-Aleman et al., 2022). In the unpublished work, PuO2 calcined at 450 C under laser annealing shows the growth of soot emerging due a significant amount of carbon remaining in the material from the oxalate decomposition (manuscript under preparation). Meanwhile, the bands located at 2,135 and 2,635 cm−1 are identified as electronic bands corresponding to the Γ1 → Γ5 and Γ1 → Γ3 transitions (Naji et al., 2017). We have identified the ∼2,940 cm-1 band as a CH stretch from a sp3 carbon. It is shown in Section 3.2 that CH stretches from sp3 carbon have been observed with infrared spectroscopy. At high calcination temperatures, we have observed that most of the CH stretch band from sp3 carbon is converted to a CH stretch from sp2 carbon geometry as the intensity of the 2,940 cm−1 band decreases and a new band is observed around 3,100 cm−1. The bands in the Raman spectra were consistently observed in samples prepared from different Pu-bearing precursors, such as plutonium oxalates, fluorides, and nitrates, and with different excitation wavelengths. The carbon observed in PuO2 produced from non-carbon-containing precursors is not definitively explained at present. We believe that CO2 absorption from the atmosphere during calcination best explains the observed carbon signatures.
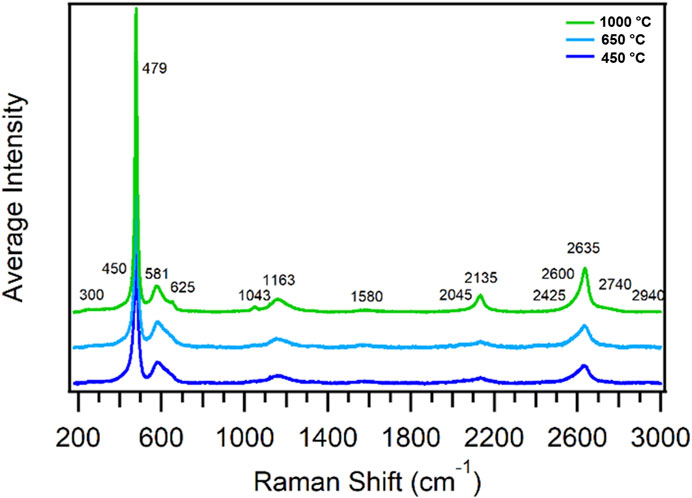
FIGURE 2. Raman spectra of 240PuO2 samples calcined at 1,000, 650, and 450 C (green, light blue, and dark blue spectra, respectively) excited with 514 nm laser light. Spectra are averages of 10 different spots on each sample, normalized to the T2g band at 479 cm−1 and offset to show bands for each calcination condition. Observed defect bands correspond to the material aged for 3 months prior to the analysis.
3.1.2 Low-fired and aged PuO2 band attributes
The band position, intensity, and full width at half maximum (FWHM) of the bands observed in the Raman spectra of PuO2 are highly dependent on the calcination temperature and the age of the material. Low calcination temperatures of a Pu oxalate precursor result in lattice defects during the formation of PuO2. The defects in the crystal lattice are heavily influenced by the impurities of the material, such as Gd2O3-doped CeO2 (Taniguchi et al., 2009; Desgranges et al., 2012; Filtschew et al., 2016; Harker and Puxley, 2016; Villa-Aleman et al., 2019b; Xu et al., 2019). During the thermal decomposition of plutonium oxalates, carbon atoms are found in substitutional and interstitial positions. The FWHM of the Raman T2g band correlates with the disorder in the crystal lattice. The chemical transition from the oxalate to the oxide shows the formation of PuO2 nanoparticulates at low temperatures that exhibit a broad, asymmetric FWHM T2g band corresponding to phonon confinement. PuO2 calcined at 450 C is known to contain significant quantities of carbon and defects as measured with the T2g band properties (Villa-Aleman et al., 2019b; Christian et al., 2022). Calcination at higher temperatures results in the narrowing of the FWHM for the T2g and electronic bands, corresponding to the conversion of an amorphous to crystalline lattice. Stabilization of the crystal lattice occurs in the high-fired regime (>900 C) as observed by the FWHM. Recent laser-induced annealing by our group (unpublished) of 450 C calcined PuO2 demonstrated the presence of large quantities of carbon in the material. During the laser annealing of low-fired PuO2, the emergence of a soot signature with bands near 1,580 (higher frequencies have been observed up to 1,610 cm−1) and 1,350 cm−1 with a broad luminescence is observed to grow, suggesting the coalescence of carbon atoms and reactions within the crystal lattice. The concentration of graphitic and disorder carbon structures and the luminescence are reduced at higher annealing temperatures. PuO2 calcined at 650 °C only shows a weak soot signature and little luminescence. Throughout the manuscript, the FWHM of the T2g band and the electronic bands as well as the defect bands can be used to characterize the crystallinity of the material.
The defect bands for the 450 °C freshly calcined 239PuO2 are very weak, and the intensity of the defect bands relative to the T2g significantly differ from the alpha decay aged material in equilibrium (∼10 years). The different behavior of the defect bands and the FWHM between freshly calcined and aged materials suggests that the defect bands are primarily an effect of alpha-decay or ion bombardment of the crystal lattice.
3.1.3 Band properties of aged PuO2 (position, FWHM, and defect Bands/T2g ratios)
We have been investigating the time-dependent properties of the bands in the Raman spectrum since 2016 (Villa-Aleman et al., 2019b; Villa-Aleman et al., 2021a; Villa-Aleman et al., 2021b). Recent analyses of our data and comparison with published x-ray diffraction (XRD) data of alpha-irradiated UO2, PuO2, and other actinides have provided new insights into the time-dependent Raman data of 240PuO2, the meaning of the FWHM of the T2g band, and the source of the defect bands (Villa-Aleman et al., 2021b). The work presented in this section summarizes our previous work and new insights into the crystal lattice bombarded by alpha particles.
Raman spectroscopy is frequently used to measure how the environment affects the crystal lattice of a material. Changes in oxidation state or damage to the crystal lattice can result in new bands or changes in the band intensity, FWHM, and position. The alpha particle and the recoiling U atom have been found to be the predominant drivers of the time-dependent spectral changes observed in PuO2 (Nellis, 1977; Weber, 1983; Matzke, 1992; Kato et al., 2009; Talip et al., 2018). The spectral changes are indicative of the effect of the alpha decay on the crystal lattice. Although the spectral changes are clearly observed in T2g and the electronic bands at 2,135 (Γ1 → Γ5) and 2,635 cm−1 (Γ1 → Γ3), most work follows the T2g band properties since the band is much narrower than the electronic bands (Villa-Aleman et al., 2021b; Villa-Aleman et al., 2023b).
The T2g phonon mode, located at ∼480 cm−1 for PuO2 calcined at ≥ 900 °C, corresponds to the symmetric stretch of the four oxygen atoms surrounding the Pu atom (Gilson and Hendra, 1970; Sarsfield et al., 2012). As the alpha decay dose increases with time, the bands in the Raman spectrum to shift to lower frequencies, indicative of weakening bonds in the crystal. The FWHM of the T2g band is observed to increase and the relative intensity of the band to decrease. The increase in the FWHM and the decrease in the band intensities are correlated to the distribution of bond energies in the crystal lattice. These signatures are correlated with amorphization of the material. Once it is realized that PuO2 is a dynamic system where the time-dependent properties of the material are driven by the alpha decay, Raman spectroscopy can be used to monitor the changes in the crystal lattice due to alpha particles and the recoil uranium atom.
Figure 3A shows the time-dependent behavior of the T2g band and the two main defect bands located at ∼580 and 650 cm−1 (Villa-Aleman et al., 2021b). The three bands (T2g, 580, and 650 cm−1) seen in Figure 3B are termed bands A, B, and C, respectively, in this section. The observation of the defect bands in the PuO2 system represent a complex evolution of the material which might involve group symmetry changes and the creation of new suboxides (Conradson, 2004; Taniguchi et al., 2009; Filtschew et al., 2016; Villa-Aleman et al., 2019b; Xu et al., 2019). Although we have identified four defect bands in the Raman spectrum, this work concentrates on the intense 580 and 650 cm−1 bands, labeled B and C in Figure 3 (Villa-Aleman et al., 2021b). Numerous researchers have attributed the B band as the LO2 infrared band which emerges in the Raman spectrum due to changes in the symmetry rules caused by the alpha decay of the crystal lattice (Schoenes, 1980; Jégou et al., 2010; Sarsfield et al., 2012; Naji et al., 2017). Although the B band might correspond to the LO2 active in the IR, we have identified three additional bands in the defect region which cannot be assigned to other infrared bands since there are only two infrared bands (∼270 and 580 cm−1) and one Raman band (480 cm−1) in the fluorite structure. It is possible the three bands are the result of suboxide species in the PuO2 system (Villa-Aleman et al., 2019a). The suboxide species hypothesis is supported by the B/A and C/A band ratios and the wavelength-dependent intensity differences among the bands. The Raman spectrum acquired with long excitation wavelengths (561, 633, and 785 nm) shows the 650 cm−1 band with a greater intensity than the 580 cm−1 while short excitation wavelengths (457, 488, 514, and 532 nm) show the 580 cm−1 band with a greater intensity than the 650 cm−1 band.
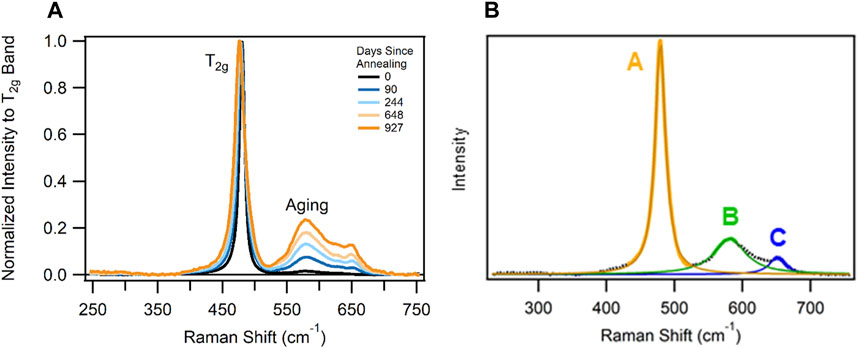
FIGURE 3. (A) Example Raman spectrum of 240PuO2 sample with each band fitted with a Lorentzian. (B) Band A (orange line) is the T2g band near 480 cm−1; band B (green line) is the 1LO2 band near 580 cm−1; and band C (blue line) is an additional aging band near 650 cm−1.
The time-dependent behavior of the Raman spectrum can be understood with knowledge of the alpha decay process. There are 2.3 × 10⁹ alpha decay events per gram per second for 239Pu (Wolfer, 2000). Each 5 MeV alpha particle travels approximately 10 μm in the crystal lattice while the 86 keV 235U recoil nucleus is known to travel ∼12 nm. The alpha particle captures two electrons during the travel, becoming a He atom. A significant number of cation and anion vacancies, known as Frenkel defects, and interstitial defects are created during the alpha particle and uranium recoil. The cationic and anionic Frenkel pairs are representative of the damage to the crystal lattice. Approximately 265 Frenkel pairs are created at the end of the alpha particle range (anions and cations), while 2,300 Frenkel pairs are created during the uranium atom recoil (Wolfer, 2000). Schwartz et al. (2005) calculated that 90% of the Frenkel pairs return to their original site, leaving approximately 10% as free interstitial defects and vacancies or clusters of both. The Frenkel pairs result in crystal lattice swelling—a phenomenon well explained by X-ray diffraction (Nellis, 1977; Weber, 1983; Matzke, 1992; Kato et al., 2009; Talip et al., 2018). Eventually, the exponential behavior of crystal lattice swelling Δa/a plateaus, where the same number of created defects equals the number of defects annealed.
The time-dependent curves of the A, B, and C bands provide information between the creation and annealing of the Frenkel pair defects and possibly the creation of other oxide species in the material. Figure 4 shows different metrics used in the analysis of the crystal lattice. The spectral properties shown in Figure 4 are FWHM band A (T2g), B/A band area ratio (580 cm−1/T2g), C/A band area ratio (650 cm−1/T2g), and C/B band area ratio (650 cm−1/580 cm−1). Each curve provides a different perspective on the effect of alpha decay in the material.
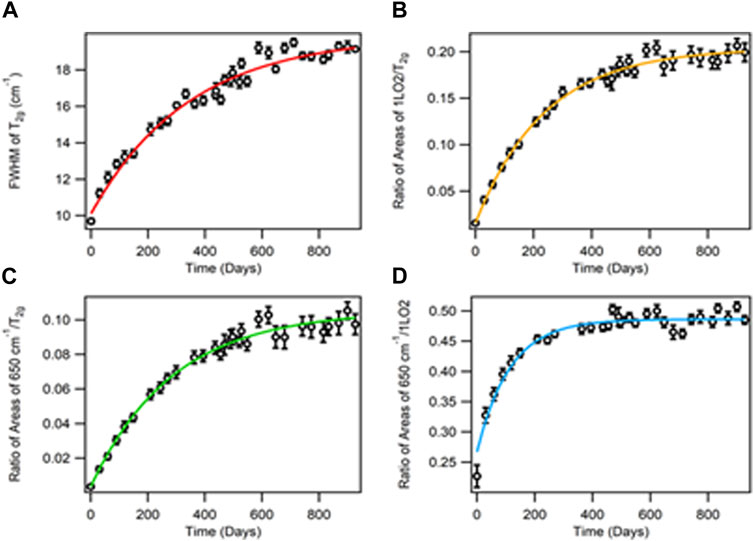
FIGURE 4. Age-dating curves for 240PuO2 calcined at 1,000 C of (A) FWHM of A, (B) ratio of areas of B/A, (C) ratio of areas of C/A, and (D) ratio of areas of C/B. The error bars are estimated uncertainties at the 95% confidence interval.
For a well-ordered crystal lattice of PuO2 (high-fired), the greatest rate of change in the crystal lattice damage occurs early in the aging process. Eventually, the rate of change becomes zero and the curve plateaus indicate an equilibrium state between the creation and annihilation of Frenkel pairs. The time-dependent damage is proportional to the specific activity of the radionuclide composition. Therefore, since 240PuO2 decays 3.67 times faster than 239PuO2, the curve for 240PuO2 should reach the plateau 3.67 times faster than that of 239PuO2. For 238Pu, 239Pu, 240Pu, and 242Pu, the alpha decay has approximately the same energy; thus, the graphs in Figure 4 can be normalized (Nellis, 1977; Browne and Tuli, 2007; Browne and Tuli, 2015).
The lifetimes calculated from the FWHM of A, the ratio of B/A, and the ratio of C/A curves are 344, 238, and 287 days, respectively. In contrast, the age-dating curve corresponding to the C/B ratio has a much shorter lifespan of 113 days. An overview of the graphs in Figure 4 indicates that the FWHM of band A (Figure 4A) and the C/A band area ratio (Figure 4B) are very similar (a 344- and 287-day lifespan, respectively). Unlike the FWHM of band A and the C/A band area ratio, the B/A curve’s (Figure 4B) lifespan (238 days) does not follow the same pattern, suggesting that the intensity of the B band (580 cm−1, probably 1LO2) is caused by a different effect than crystal damage. Meanwhile, the C/B band ratio (Figure 4D) shows a 113-day lifespan, much faster than the other three curves. This indicates that the rate of production of an oxide (band C) rises at a much faster rate than the symmetry change of the LO2 or the formation of a different oxide described by band B (580 cm−1). Our long excitation wavelength Raman data (785, 633, and 561 nm), in contrast to the short excitation wavelength Raman data, clearly show that the intensity of band C is at least twice as intense as band B (Villa-Aleman et al., 2019b). Any differences in the shape of the curves should be indicative of different mechanisms governing the damage caused by the alpha decay to the material. Therefore, the data from Figures 4A and C suggest that the FWHM of the T2g and the area of band C describe the same phenomena, while the B band (580 cm−1) most likely corresponds to a different phenomenon such as symmetry change.
Nellis developed a simple theory for the swelling and annealing of crystal lattice where the interatomic distances can be expressed as:
where a0 is the lattice parameter after preparation, Δa is the change in lattice parameter via self-radiation, A and B are constants, τ is the decay constant of an actinide isotope, and t is storage time (Nellis, 1977). The established relationship is dependent on three different constants: τ (the decay constant associated with the alpha-emitting isotope(s) present), A (the maximum change in lattice parameter), and B (a measure of the rate of change of the lattice parameter, kinetic constant). A and B are intrinsic to the PuO2 lattice and will be the same for each isotope of plutonium. Because τ is different for each plutonium isotope, using the same τ to generate the exponential regressions for each isotope transforms all the regressions onto the same timescale, allowing for direct comparisons. Like the XRD measurements, where the distance between atoms in the crystal lattice and the swelling can be calculated, the Raman spectra suggest that it is possible to estimate the crystal lattice expansion by comparison with the XRD data. This hypothesis was tested with a comparison of the data in Figure 4 to XRD swelling plots obtained by Weber (1983).
Although several studies have been conducted to measure the Δa/a of the crystal lattice for PuO2, mixed oxide fuel, and irradiated UO2 (Rand et al., 1962; Nellis, 1977; Weber, 1983; Matzke, 1992; Kato et al., 2009; Talip et al., 2018), the crystal lattice swelling of UO2 versus alpha particle dose is the most significant data for comparison with our 240PuO2 aging data curves in Figure 4 (Weber, 1983). Weber (1983) irradiated UO2 using 238PuO2 as an alpha particle source and measured the Δa/a for a wide range of doses. The data from Weber were re-created and compared to our curve from Figure 4A and are shown in Figure 5. The curve generated by Weber for the irradiation of UO2 with 238PuO2 is nearly identical to the time-dependent curve of the FWHM of the T2g band (band A) and the C/A band ratio (FWHM—344 days, C/A—287-day lifespan) observed with Raman spectroscopy (Weber, 1983). It is evident that the T2g (symmetric stretch of oxygen atoms surrounding a plutonium atom) can be correlated to the Δa/a of the material and, therefore, is also correlated to Frenkel pairs’ generation and destruction. Similarly, since the C/A band ratio also follows the Δa/a curve, we postulate that the creation of the C band is correlated to crystal lattice swelling and the formation of a suboxide during the alpha decay. On their own, the intensity of the emerging defect bands is meaningless unless the intensities are anchored to another parameter (band ratios) and the C/A ratio curve is different from the B/A and B/C band ratios; we suggest that the B band originates from a different source. The most logical explanation for B band behavior is that the emergence of this band relies on symmetry selection rules and not on the formation of suboxide species.
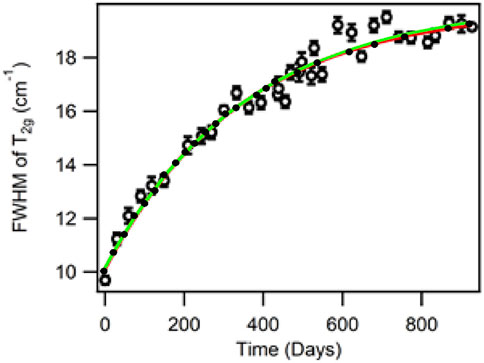
FIGURE 5. Age-dating curve (red curve and hollow circles) for the FWHM of the T2g band of 240PuO2 calcined at 1000 C. The data (green curve and enclosed circles) from Weber were reproduced and overlaid with our data (Weber, 1983).
The production of alpha particles is accompanied by a high energy uranium recoil atom. It is known that the energy of the recoil atom is high enough to produce a significant number of Frenkel pairs while tunneling through the matrix but also to induce annealing. Since the date-aging curve from the FWHM of the T2g band matches the Δa/a data from irradiated UO2 with an alpha source, the recoil uranium atoms do not seem to contribute to the FWHM of A in our 240PuO2 decay experiments. Therefore, the data suggest that either the Frenkel pairs from the recoil atom are not important in the equality due to the high energy and melting of the material or are just another multiplier in the intensity of the curve without affecting the curve’s shape.
The new meaning associating the FWHM of the T2g band with Δa/a (crystal swelling) and the age-dating behavior of band B (580 cm−1) provides a method for differentiating crystal swelling from symmetry group changes. Consequently, the FWHM of the T2g band describes the crystallinity of the material and can provide an estimation of the Δa/a from a calcination experiment or from an aged material affected by the alpha decay. An illustration of this be found in the calcination of Pu2(C2O4)3 and Pu(C2O4)2 at different temperatures to form the oxide from temperatures in the 350 °C–900 °C range (Villa-Aleman et al., 2023a). These experiments showed that the FWHM of the T2g band can be used to describe the crystallinity of PuO2 at different temperatures and can depend on the precursor and only reach an equilibrium at high calcination temperatures.
For high-fired PuO2, the curves in Figure 4 provide the necessary information to estimate the age of the material since the last calcination. The high-fired PuO2 exhibited the highest crystalline state, and the T2g exhibited the narrowest FWHM, with the defect bands showing the lowest intensity. For high-fired PuO2, a single point in time is sufficient to estimate the age since last calcination, with the narrowest FWHM of the T2g attaining approximately 9 cm−1 (Villa-Aleman et al., 2021b; Villa-Aleman et al., 2023a). Low-fired calcination PuO2 results in bands with much wider FWHM, as demonstrated by the FWHM acquired at temperatures as low as 450 C. PuO2 calcined at that temperature shows a FWHM between 18 and 21 cm−1 (Villa-Aleman et al., 2023a); meanwhile, unpublished data show a similar FWHM of the T2g for high-fired 240PuO2 aged for 7 years. Unlike the FWHM, the intensity of the defect bands is highly dependent on the accumulated alpha decay dose and not on the original calcination temperature of the material. The B/A band ratio for PuO2 freshly calcined at 450 C is approximately 0.03 compared to a B/A band ratio of 0.01 for high-fired PuO2. Our age-dating data show a maximum band ratio of 0.20–0.22 for an aged material (Villa-Aleman et al., 2021b). This information can be used to estimate the age of the material since last calcination for any calcination temperature. Two-point measurements, two temporal datasets, can be used to make more accurate age estimates (Villa-Aleman et al., 2021b). Our work has shown that the FWHM of the T2g band is related to radiolytic aging and calcination temperature, and the metric can only be used for age determination from medium (650 C) to high-fired material. Low-fired materials have bands with a FWHM which are a composite of age and calcination temperature which describe the crystallinity of the material; thus, the effect of calcination temperature on the FWHM can obfuscate the increase observed with age. Conversely, we know that the growth of the B and C bands are dictated by the alpha decay process with little contribution from disorder in the crystal. In the worst-case scenario, for PuO2 calcined at 450 C, the contribution from the material crystallinity could be 15% of the total intensity of the B band. In these cases, the error could be reduced significantly by taking two measurements at different times separated by at least 1 month. The B and C bands and their ratios to the FWHM of the T2g band can be used to make accurate age determinations up to ∼10 years for 239PuO2, where an equilibrium between defect creation and annealing reaches steady state.
3.1.4 Laser wavelength-dependent Raman spectra
Figure 6 shows the evolution of the Raman spectrum of PuO2 with wavelengths from 785, 633, 561, 514, 488, 457, 405, and 355 nm (Villa-Aleman et al., 2019a). Additional excitation wavelengths (325 and 244 nm), although not present in Figure 6, were used to probe PuO2. For clarity, the spectra taken with 785, 633, 514, 488, and 457 nm excitations were collected from the same sample with a similar age since the last calcination, while the spectra collected with 405 and 355 nm excitations were taken from PuO2 samples with different aging which exhibited differences in the defect band region and band shifts relative to other laser excitation wavelength spectra. The Raman spectrum observed at 785 nm showed the T2g band, very weak defect bands, and electronic bands. The overtone 2LO2 and the electronic bands were barely visible in the Raman spectrum with the 785 nm excitation wavelength. The Raman spectrum acquired with the 633 nm showed the first clear indication of the 2LO2 and electronic bands. As the excitation wavelength was changed from 561 to 457 nm (561, 514, 488, and 457 nm), the 2LO2 overtone and the electronic bands at 2,135 and 2,635 cm−1 were observed to increase relative to the T2g band. The intensity of these bands from 785 nm to the 457 nm was observed to increase by several orders of magnitude. The evolution of the band intensities relative to the T2g band illustrates the effect of resonance Raman versus excitation energy. The most important observations from the spectra are the growth in intensity of the overtone, electronic bands, and the band associated with soot located at 1,580 cm−1 from the 785 nm to the 457 nm excitation line and the decrease in band intensity for 405 nm and 355 nm. In contrast to laser excitation wavelengths at 405 and beyond, Raman spectra with 355, 325, and 244 nm show the disappearance of the 2LO2 band, while the band at 1,045 cm−1 is significantly stronger with the UV wavelengths than in the visible excitation wavelengths. The disappearance of the overtone band is most likely related to differences between the laser excitation wavelength and the electronic state precluding resonance enhancement. Another possibility for the disappearance of the 2LO2 overtone might be related to the interaction of the UV laser excitation wavelength primarily with the surface, where the structure of PuO2 has been modified to a different molecular structure. It has been shown in the uranium system that the overtone is very sensitive to the molecular structure (Jégou et al., 2010; Elorrieta et al., 2018). Laser-heated UO2 results in the formation of U3O8, while laser-heated UxPuxO2 results in a different molecular structure with primary bands at 465 and 630 cm−1 where the overtone band has disappeared.
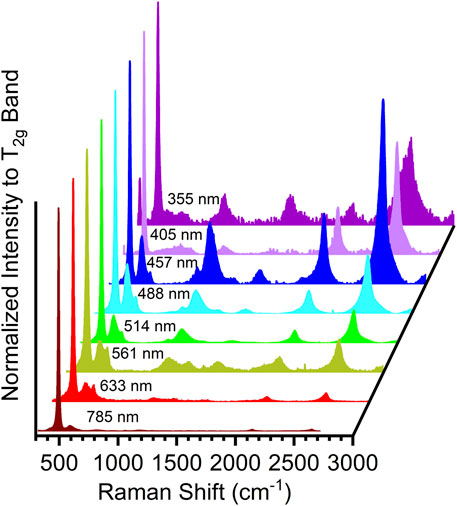
FIGURE 6. Raman spectra of PuO2 recorded with different laser wavelengths (785, 561, 633, 514, 488, 457, 405, and 355 nm).
Resonance Raman has been explained in terms of the Kramer–Heisenberg–Dirac (KHD) theory, which explains the wavelength-dependent behavior of the PuO2 Raman spectrum (Smith and Dent, 2019). The KHD theory predicts the presence of overtones in the Raman spectrum when the energy of an excited state is similar to the laser excitation energy and the possibility of observing numerous overtones in contrast to normal Raman scattering. The optical band gap for PuO2 is located at approximately 442.8 nm (McCleskey et al., 2013; Scott et al., 2014). The proximity of the energy between the conduction band and the excitation wavelength at 457 nm agrees with the enhancement of the bands observed in Figure 6.
In Raman scattering, the intensity of the Raman bands depends on the laser power, the frequency of the incident light radiation, and the polarizability of the electrons in the molecular vibration. To understand the resonance Raman effect observed in the CeO2, UO2, and PuO2 systems, we find it important to review the KHD expression (Smith and Dent, 2019). For our simplistic description of polarizability, we start with the KHD expression and describe the polarizability of the electrons under laser irradiation. The KHD expression is as follows:
where k is a constant, ρ and σ are incident and scattered polarization directions, respectively, and G, I, and F are the ground, intermediate, and final vibronic states, respectively, containing integral mixing waveforms related to the ground, intermediate, and excited vibrational states through dipole operators in the numerator, while energies related to excited states and laser excitation frequency are in the denominator. Bra-ket notation is used to represent integrals where operators modify the wavefunctions of the intermediate, ground, and final states. The integrals describe the mixing of the ground and excited states. The term iΓI describes the lifetime of the excited state and is related to the natural FWHM of the Raman band. It is important to realize that, when the excited state energy is similar to the excitation energy, as shown in the denominator of the first term in the equation, (
The selection rules for Raman spectroscopy can be obtained by separating the electronic, vibrational, and rotational contributions during ground, excited, and final-state transitions. Electronic transitions are known to occur within a picosecond or less. On this timescale, where electrons are excited, the nucleus remains virtually stationary (vibrations occur at ∼10−9s). Therefore, it is feasible to separate the electronic, vibrational, and rotational terms in the KHD expression using the Born–Oppenheimer approach with the wavefunction Ψ= Θ·Φ·r, where Θ, Φ, and r represent the electronic, vibrational, and rotational wavefunctions, respectively. Therefore, the integral in the first term
The two independent effects, wavelength-dependent Raman scattering and wavelength-dependent defect band scattering, present two aspects of the material (the interactions of the laser wavelength with the electronic states near the conduction band and the presence of multiple oxides characterized by the defect bands). The wavelength-dependent Raman scattering was monitored by the relative band intensity of the numerous bands (electronic bands) to the T2g band. The Raman spectrum acquired with the 785 nm excitation line consisted of the T2g band with weakly observed defect bands and electronic bands. Thereafter, the overtone and electronic bands were observed to increase in intensity toward shorter excitation wavelengths.
The wavelength-dependent studies have shown the presence of resonantly enhanced Raman bands and the 2LO2 overtone in the spectrum. Similarly, the bands in the defect spectral region, consisting of four bands (in this study, we only discuss the two most dominant bands in the spectrum, B (580 cm−1) and C (650 cm−1)) show a different excitation wavelength dependence which suggests the presence of distinct oxides.
3.2 Infrared spectroscopy of PuO2 from Pu oxalate thermal decomposition
3.2.1 Thermal decomposition of Pu(C2O4)2 to PuO2
Although Raman spectroscopy provides unique information on the decomposition of the oxalate en route to the formation of PuO2, very little information can be extracted from organic impurities contained in the oxide. In contrast, infrared spectroscopy shows the frequencies of the oxalate ligands and the carbon products from the oxalate decomposition still available at temperatures as high as 900 C. Infrared spectroscopy depends on the change of dipole moment for a vibrational mode to be active. In general, symmetric motions are easily observed in the Raman scattering spectrum while asymmetric motions are predominantly observed in the infrared spectrum. Pu (III) and Pu (IV) oxalates are the primary precursors used in the production of PuO2 via the calcination process (Wick, 1980; Patterson and Parkes, 1996; Bridges and Shehee, 2015). The TO (270 cm−1) and 1LO2 (580 cm−1) corresponding to the PuO2 frequencies are not observable in our data since the BaF2 windows of the DWCs prohibit transmission below 800 cm−1 (Schoenes, 1980; Sarsfield et al., 2012). Figure 7 shows the IR spectrum for Pu(C2O4)2 and several of its thermal decomposition products up to 900 °C (Christian et al., 2022). Plutonium(IV) oxalate can be described by the water band (∼3,600 cm−1) and several bands related to the oxalate group (Myser, 1956; Kartushova et al., 1958; Glasner, 1964; Nissen, 1980; Karelin et al., 1990; Vigier et al., 2007; Orr et al., 2015; South and Roy, 2021; Christian et al., 2022). At 100 °C, a significant amount of water has been removed from the material and the presence of sp3 C-H bonds are observable at ∼2,960 cm−1. By 220 °C, additional water is removed from the oxalate structure and the destruction of the oxalate groups has started; it is noted by the formation of a single band corresponding to CO2 and the baseline rise under the oxalate group region (∼1,250–1,750 cm−1). At 350 °C, the oxalate group has been converted to a carbonate moiety. CO2 trapped within in the material or absorbed on the surface coexists with plutonium carbonate. At 450 °C, even though the Raman spectrum shows the formation of PuO2, the infrared spectrum shows significant quantities of organics remaining after conversion to PuO2. The shape of the bands in the oxalate region suggests a combination of carbonate remnants and additional organics. Thereafter, in the 600 °C–900 °C temperature range, the bands in the organic region are very similar but decrease in intensity with increasing temperature, suggesting the destruction of the organics. Additionally, in the 600 °C–900 °C temperature region, a new set of bands are observed to emerge and sharpen with temperature in the 2,500–2,750 cm−1 spectral region. We believe these bands to be of electronic origin, similar to the electronic bands observed in the Raman spectrum at the 2,135 and 2,635 cm−1 spectral regions (Villa-Aleman et al., 2023b).
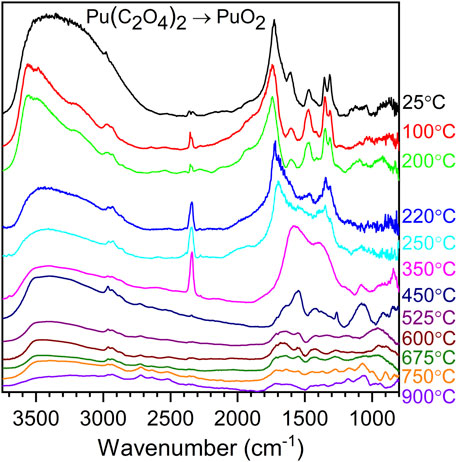
FIGURE 7. Infrared spectra for the decomposition of Pu(IV) oxalate to PuO2 in the 25°C–900°C temperature range.
3.2.2 Thermal decomposition of Pu2(C2O4)3 to PuO2
The thermal decomposition of Pu(III) oxalate to PuO2 (Figure 8) is similar to the thermal decomposition of the Pu(IV) oxalate, although the decomposition of Pu(III) has been observed to occur at lower temperatures (Kartushova et al., 1958; Rao et al., 1963; Karelin et al., 1990; De Almeida et al., 2012; Christian et al., 2023). The Pu2(C2O4)3 infrared spectrum is characterized by the OH stretch in the 3,600 cm−1 region and vibrational modes from the oxalate groups in the 1,250–1,750 cm−1 region. Heating the material at 160 °C results in decomposition of the oxalate group, indicated by the CO2 band, and a rise in the baseline under the oxalate bands. It is known that, at 160 °C, a significant number of water molecules are removed from the plutonium(III) oxalate (De Almeida et al., 2012; Orr et al., 2015; Christian et al., 2023). While Pu(IV) oxalate remains stable until higher temperatures, it is possible that water molecules are required for the stabilization of the Pu(III) oxalate compound. At 200 °C, the oxalate continues to decompose and the transformation to the oxalate–carbonate complex begins to occur. The same process continues at 250 °C, with full conversion to the plutonium carbonate at 300 °C (IR measurements). Significant decomposition of the carbonate is observed at 350 °C (possibly plutonium oxy-carbonate as measured with Raman scattering measurements) with further decomposition of residual carbon species at 450 °C. Thereafter, the fingerprint signatures in the 800–1,750 cm−1 are similar, although the material undergoes further degradation as calcination temperature increases.
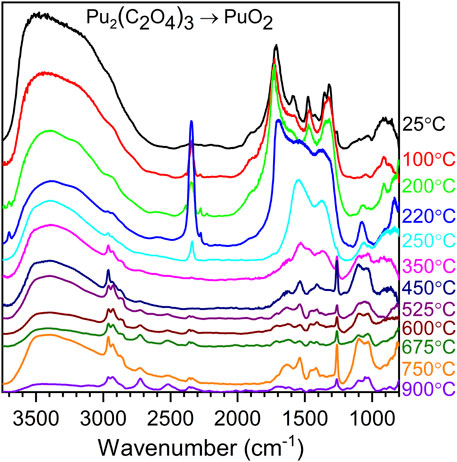
FIGURE 8. Infrared spectra for the decomposition of Pu(III) oxalate to PuO2 in the 25 C–900 C temperature range.
It is important to realize that the carbon signatures observed from the decomposition of Pu(III) and Pu (IV) are different. Unfortunately, the carbon signatures are not necessarily reproduced from batch to batch, and significant work will be required to understand the differences. For instance, the peak observed at 1,263 cm−1 in Figure 8 for thermal decomposition products ≥450 °C has not been reproduced. Batch size, calcination time, location of the sampled material during calcination (core versus crust of the material), and impurities may play a role.
3.3 Diffuse reflectance in the shortwave infrared spectral region
Diffuse reflectance spectroscopy measurements in the shortwave infrared (930–1,600 nm, SWIR) spectral region provide a quick method for the characterization of plutonium-bearing compounds. The thermal decomposition of Pu2(C2O4)3•9H2O and the formation of PuO2 at 300, 350, 450, 525, 600, 675, 750, and 900 °C were studied by monitoring the band shapes in the SWIR spectral region (Villa-Aleman et al., 2023a). As observed in Raman spectroscopy, the crystallinity of PuO2 affects the electronic spectrum. As shown in Figure 9, the spectrum at 300 °C primarily exhibits a broad peak from ∼950–1,200 nm, with weak peaks observed at 939, 958, 966, and 977 nm and a broad peak at 1,435 nm. As the calcination temperature increases to 900 °C, these peaks become very sharp, and the peak at 966 nm is no longer observed or obscured by the increasing intensity of the 958 nm and 977 nm bands, and the band at 1,435 nm shifts to 1,433 nm. Additionally, several electronic bands appear in the ranges 1,050–1,180 nm, 1,325–1,400 nm, and 1,460–1,600 nm. The electronic band observed at 1,433 nm in the diffuse reflectance spectra of PuO2 was found to be a sensitive indicator of crystallinity and was corroborated by our work conducted with Raman spectroscopy. The FWHM of the 1,433 nm band exhibits the same exponential behavior as the FWHM of the T2g band observed with Raman spectroscopy measurements.
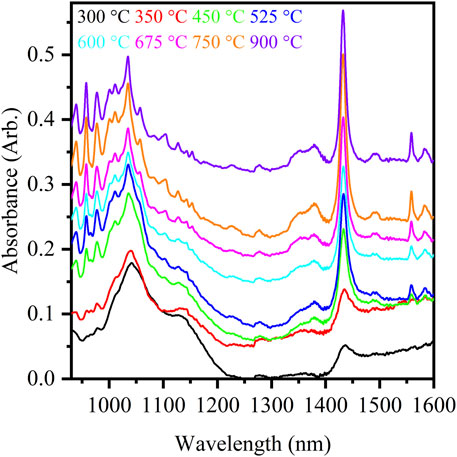
FIGURE 9. Diffuse reflectance spectra of PuO2 produced from the calcination of Pu(III) oxalate at eight calcination temperatures. The spectra are offset for visual clarity.
Changes in the spectra between calcination temperatures within 100 °C of each other were subtle; therefore, principal component analysis was employed to differentiate PuO2 based on its calcination temperature. A model using three principal components was generated which accounted for 99.49% of the variance within the dataset. A score plot of the first three principal components is shown in Figure 10. The model was primarily able to differentiate PuO2 calcined at low, medium, and high calcination temperatures. Calcination temperatures between 300 °C and 450 °C were well separated, while higher calcination temperatures partially overlapped their neighboring calcination temperatures. However, calcination temperatures of 525 °C and 600 °C were clearly separated from 750 °C to 900 °C.
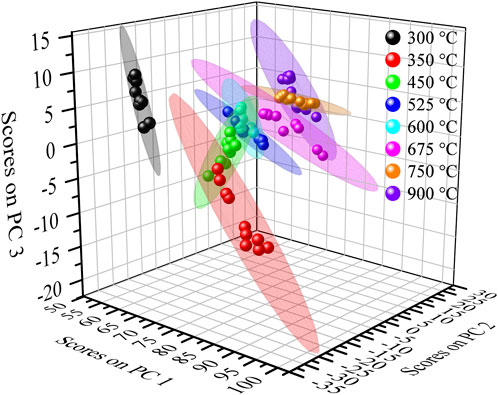
FIGURE 10. Score plot of PC3 vs. PC2 vs. PC1 for the diffuse reflectance spectra of PuO2 produced from the calcination of Pu(III) oxalate at eight calcination temperatures.
3.4 Gamma measurements of 239PuO2
Gamma emission data were assessed for age dating using two methods. The first method estimated the number of atoms for isotopes 239Pu (1) and 235U (2) gamma energy lines. Correlating branching ratios were obtained from the National Nuclear Data Center (NNCD) at Brookhaven National Laboratory, and energy efficiencies were determined by the plated 239Pu disc (Nudat2, 2023). The atom ratios of 235U/239Pu were used to calculate the time elapsed since the last purification of 239PuO2 using the Bateman equation and applied to the 4n+3 expected ratios from Moody et al. (2005); also (Varga et al., 2016).
In the Bateman equation,
where N is the number of atoms, t represents time in days, and λ is the decay constant in inverse days of isotope 1 (239Pu) and isotope 2 (235U).
The second method estimates the age of the sample using the isotopic ratio (equation 3) with the assumption that solid angle terms for the decay factor (λ) and the fractional solid angle of the detector cancel out for measurements acquired on the same detector using the same settings and configurations and the relationship of ε2τ2/ε1τ1 ≈ 1, for gamma and X-rays close in energy (Clark, 1996).
where A1/A2 is the isotopic ratio of 235U and 239Pu obtained using the spectral information of the given gamma intensities, peak energy, branching ratios, and isotope half-lives. This approach was applied to three PuO2 samples in DWCs, where the 235U/239Pu ratios were used to calculate the time elapsed from the last purification of 239Pu oxide, similar to Method 1 (Moody et al., 2005; Varga et al., 2016).
An example gamma spectrum for one of the PuO2 samples is shown in Figure 11, and the estimated date of purification of 239Pu oxide compared to the actual purification date is shown in Figure 12. For two of the three samples, their age was determined to be within 1 month of the actual purification date. In practice, Method 1 was more robust than Method 2, where high sensitivity measurements were required; however, Method 2 provided more accurate age determinations when precise spectral fitting was applicable. Minor impurities and daughter product build-up—241Am and 241Pu—contributed a non-negligible error to the final age estimate but in theory could lead to undue error caused by overlapping energies of gamma emissions and potential self-attenuation. To eliminate geometrical error contribution from disparity between samples to the plutonium plate used for counting efficiencies, one of the three Pu samples was used as a standard for counting efficiency determinations. Shown in Table 1, this self-standard, when applied to the two remaining samples, accurately estimated age within 1% of their last purification date. This demonstrates that gamma spectroscopy is a viable method for age dating PuO2 samples with enhanced sensitivity.
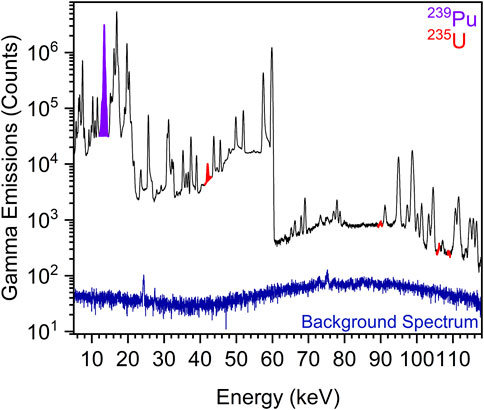
FIGURE 11. Representative gamma emission spectrum, collected over 4.39 days using an IGLET N-Type HPGe detector, of PuO2 aged 4.93 years, measured at 4.71 years using Method 2, using the integrated peak areas for 239Pu and 235U gamma energies. The 239Pu peak appears at 13.6 keV, and the 235U peaks appear at 41.96, 89.96, 105.60 m, 108.58, and 109.19 keV.
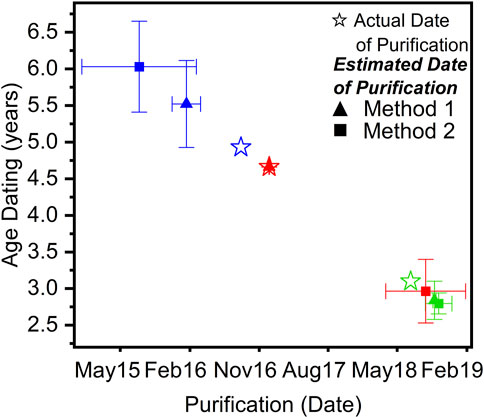
FIGURE 12. Estimated date of the last 239Pu purification from the 235U/239Pu ratio of three PuO2 samples for application via Methods 1 and 2. Error represents the standard deviation between multiple gamma measurements using a coaxial P-Type HPGe detector. Each color represents a unique PuO2 sample.
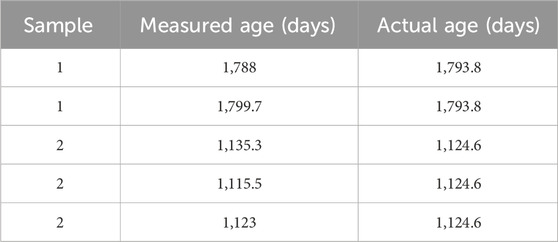
TABLE 1. Estimated date of the last 239Pu purification from the 235U/239Pu ratio of two PuO2 samples using a third sample as a self-standard and collected using a coaxial p-type HPGe detector.
4 Summary
In summary, the DWCs approach enabled us to conduct spectroscopic and gamma measurements with 240PuO2 and 239PuO2. The spectroscopic tools provided an understanding of the molecular structure of the material and provided information on calcination, crystallinity, purity, and age dating since last calcination. Meanwhile, gamma spectroscopy with double-walled cells provided a new method for age dating since the last purification of mg quantities. Over the past several years, we have successfully accomplished the following:
1. Measured the typical Raman spectrum of PuO2.
2. Identified differences in the wavelength-excitation Raman spectra.
3. Identified the formation of four defect bands, with material age and their distinct wavelength dependence suggesting that alpha decay created plutonium dioxide species.
4. Developed automated laser-induced annealing for high-temperature resolution.
5. Developed a methodology for estimating the age of the material since last calcination using the FWHM of the T2g band and the defect band/T2g band ratios.
6. Measured signatures of PuO2 related to calcination temperatures from the thermal decomposition of Pu2(C2O4)3 and Pu(C2O4)2.
7. Developed a library of T2g band FWHM and calcination temperature.
8. Demonstrated highly accurate measurements for age dating since last purification using gamma spectroscopy for mg quantities of material.
Data availability statement
The datasets presented in this article are not readily available because the data are government-owned and can only be released if the requester meets certain guidelines. Requests to access the datasets should be directed to EV-A, ZWxpZWwudmlsbGEtYWxlbWFuQHNybmwuZG9lLmdvdg==.
Author contributions
EV-A: conceptualization, data curation, formal analysis, funding acquisition, methodology, resources, writing–original draft, and writing–review and editing. JD: writing–original draft and writing–review and editing. DD: data curation, formal analysis, and writing–review and editing. MM: conceptualization, resources, and writing–review and editing. AS: data curation, formal analysis, resources, and writing–original draft. BF: resources and writing–review and editing.
Funding
The author(s) declare that financial support was received for the research, authorship, and/or publication of this article. This study was supported by the DOE National Nuclear Security Administration Office of Defense Nuclear Nonproliferation under projects SR15-Pu_Oxide_Studies-NDD3b, SR19-Spec-Signatures NDD3Bb, SR21-OpticalAgeDating-NTNF1Bb, OR19-ML-Fuel Cycle Material-PD1Ab, and PL21-ML-PlutoniumForensicsTestbed-NDD3Bb and the SRNL Laboratory Directed Research & Development under the projects LDRD-2016-00015 and LDRD-2023-00118.
Acknowledgments
This work was produced by Battelle Savannah River Alliance, LLC, under Contract No. 89303321CEM000080 and/or a predecessor contract with the U.S. Department of Energy. The publisher acknowledges the U.S. Government license to provide public access under the DOE Public Access Plan (http://energy.gov/downloads/doe-public-access-plan). The authors would like to thank our sponsor the DOE National Nuclear Security Administration Office of the Defense Nuclear Nonproliferation Research and Development (SR15-Pu_Oxide_Studies-NDD3b, SR19-Spec-Signatures NDD3Bb, SR21-OpticalAgeDating-NTNF1Bb, and PL21-ML-PlutoniumForensicsTestbed-NDD3Bb). The authors also wish to thank the SRNL Laboratory Directed Research & Development under the projects LDRD-2016-00015 for the procurement of some equipment and investment in project development and LDRD-2023-00118 for new development of DWCs for PuO2 pellet research and laser ablation.
Conflict of interest
The authors declare that the research was conducted in the absence of any commercial or financial relationships that could be construed as a potential conflict of interest.
The handling editor KH declared a past co-authorship with the author EV-A.
Publisher’s note
All claims expressed in this article are solely those of the authors and do not necessarily represent those of their affiliated organizations, or those of the publisher, the editors, and the reviewers. Any product that may be evaluated in this article or claim that may be made by its manufacturer, is not guaranteed or endorsed by the publisher.
References
Bridges, N. J., and Shehee, T. C. (2015). Variations in plutonium (III) oxalate synthesis for plutonium oxide production. Aiken, SC.
Browne, E., and Tuli, J. K. (2007). Nuclear data sheets for A = 234. Nucl. Data Sheets 108 (3), 681–772. doi:10.1016/j.nds.2007.02.003
Browne, E., and Tuli, J. K. (2015). Nuclear data sheets for A = 238. Nucl. Data Sheets 127, 191–332. doi:10.1016/j.nds.2015.07.003
Christian, J. H., Foley, B. J., Ciprian, E., Darvin, J., Dick, D. D., Hixon, A. E., et al. (2023). Probing the thermal decomposition of plutonium (III) oxalate with IR and Raman spectroscopy, X-ray diffraction, and electron microscopy. J. Nucl. Mater. 584, 154596. doi:10.1016/j.jnucmat.2023.154596
Christian, J. H., Foley, B. J., Ciprian, E., Dick, D. D., Said, M., Darvin, J., et al. (2022). Raman and infrared spectra of plutonium (IV) oxalate and its thermal degradation products. J. Nucl. Mater. 562, 153574. doi:10.1016/j.jnucmat.2022.153574
Christian, J. H., Klug, C. A., DeVore, M., Villa-Aleman, E., Foley, B. J., Groden, N., et al. (2021). Characterizing the solid hydrolysis product, UF4(H2O)2.5, generated from neat water reactions with UF4 at room temperature. Dalton Trans. 50 (7), 2462–2471. doi:10.1039/D0DT03944F
Clark, D. (1996). U235: a gamma ray analysis code for uranium isotope determination. University of California: Lawrence Livermore National Lab.
Conradson, S. D. (2004). X-ray absorption fine structure spectroscopy determines local structure and bonding in actinide-oxide structural variants Actinide Research Quarterly, 16–24.
De Almeida, L., Grandjean, S., Vigier, N., and Patisson, F. (2012). Insights into the thermal decomposition of lanthanide(III) and actinide(III) oxalates – from neodymium and cerium to plutonium. Eur. J. Inorg. Chem. 2012 (31), 4986–4999. doi:10.1002/ejic.201200469
Desgranges, L., Baldinozzi, G., Simon, P., Guimbretière, G., and Canizares, A. (2012). Raman spectrum of U4O9: a new interpretation of damage lines in UO2. J. Raman Spectrosc. 43 (3), 455–458. doi:10.1002/jrs.3054
DeVore, M. A., Villa-Aleman, E., Felder, J. B., Yeon, J., zur Loye, H.-C., and Wellons, M. S. (2021). Vibrational spectroscopy of uranium tetrafluoride hydrates. Vib. Spectrosc. 115, 103277. doi:10.1016/j.vibspec.2021.103277
Elorrieta, J. M., Bonales, L. J., Naji, M., Manara, D., Baonza, V. G., and Cobos, J. (2018). Laser-induced oxidation of UO2: a Raman study. J. Raman Spectrosc. 49 (5), 878–884. doi:10.1002/jrs.5347
Filtschew, A., Hofmann, K., and Hess, C. (2016). Ceria and its defect structure: new insights from a combined spectroscopic approach. J. Phys. Chem. C 120 (12), 6694–6703. doi:10.1021/acs.jpcc.6b00959
Gilson, T. R., and Hendra, P. J. (1970). Laser Raman spectroscopy: a survey of interest primarily to chemists, and containing a comprehensive discussion of experiments on crystals. Wiley-Interscience.
Glasner, A. (1964). Remarks on the thermal decomposition of plutonium (IV) oxalates. J. Inorg. Nucl. Chem. 26 (8), 1475–1476. doi:10.1016/0022-1902(64)80142-1
Harker, R. M., and Puxley, C. (2016). “Development of point defect Raman signatures in PuO2 through self-irradiation,” in Plutonium futures - the science 2016. Editor R. Caciuffo (Baden-Baden, Germany: European Commission).
Jégou, C., Caraballo, R., Peuget, S., Roudil, D., Desgranges, L., and Magnin, M. (2010). Raman spectroscopy characterization of actinide oxides (U1−yPuy)O2: resistance to oxidation by the laser beam and examination of defects. J. Nucl. Mater. 405 (3), 235–243. doi:10.1016/j.jnucmat.2010.08.005
Karelin, A. I., Krot, N. N., Kozlova, R. D., Lobas, O. P., and Matukha, V. A. (1990). Thermal decomposition of Np(IV) and Pu(III, IV) oxalates. J. Radioanalytical Nucl. Chem. Articles 143 (1), 241–252. doi:10.1007/BF02117565
Kartushova, R. E., Rudenko, T. I., and Fomin, V. V. (1958). Thermal decomposition of tetravalent and trivalent plutonium oxalates. Soviet J. Atomic Energy 5 (1), 831–835. doi:10.1007/BF01505392
Kato, M., Komeno, A., Uno, H., Sugata, H., Nakae, N., Konashi, K., et al. (2009). Self-radiation damage in plutonium and uranium mixed dioxide. J. Nucl. Mater. 393 (1), 134–140. doi:10.1016/j.jnucmat.2009.05.020
Livneh, T., and Sterer, E. (2006). Effect of pressure on the resonant multiphonon Raman scattering in UO2. Phys. Rev. B 73 (8), 085118. doi:10.1103/PhysRevB.73.085118
Matzke, H. (1992). Radiation damage in nuclear materials. Nucl. Instrum. Methods Phys. Res. Sect. B Beam Interact. Mater. Atoms 65 (1), 30–39. doi:10.1016/0168-583X(92)95010-O
McCleskey, T. M., Bauer, E., Jia, Q., Burrell, A. K., Scott, B. L., Conradson, S. D., et al. (2013). Optical band gap of NpO2 and PuO2 from optical absorbance of epitaxial films. J. Appl. Phys. 113 (1). doi:10.1063/1.4772595
Moody, K. J., Grant, P. M., and Hutcheon, I. D. (2005). Nuclear forensics analysis. Boca Raton, Florida: CRC Press.
Morris, M. D., and Wallan, D. J. (1979). Resonance Raman spectroscopy. Current applications and prospects. Anal. Chem. 51 (2), 182A–192A. doi:10.1021/ac50038a001
Myser, M. N. (1956). Thermal decomposition of plutonium(IV) oxalate and hydrofluorination of plutonium(IV) oxalate and oxide. United States: UNT Digital Library. doi:10.2172/4181389
Naji, M., Magnani, N., Bonales, L. J., Mastromarino, S., Colle, J. Y., Cobos, J., et al. (2017). Raman spectrum of plutonium dioxide: vibrational and crystal field modes. Phys. Rev. B 95 (10), 104307. doi:10.1103/PhysRevB.95.104307
Nellis, W. J. (1977). The effect of self-radiation on crystal volume. Inorg. Nucl. Chem. Lett. 13 (8), 393–398. doi:10.1016/0020-1650(77)80116-5
Nissen, D. A. (1980). The thermal decomposition of Plutonium (IV) oxalate hexahydrate. J. Therm. analysis 18 (1), 99–109. doi:10.1007/BF01909457
Nudat2 (2023). National nuclear data center. Available at: https://www.nndc.bnl.gov/nudat3/nudat2.jsp (Accessed July 19, 2023).
Orr, R. M., Sims, H. E., and Taylor, R. J. (2015). A review of plutonium oxalate decomposition reactions and effects of decomposition temperature on the surface area of the plutonium dioxide product. J. Nucl. Mater. 465, 756–773. doi:10.1016/j.jnucmat.2015.06.058
Patterson, J. P., and Parkes, P. (1996). Recycling uranium and plutonium. United Kingdom: Oxford University Press.
Rand, M. H., Fox, A. C., and Street, R. S. (1962). Radiation self-damage in plutonium compounds. Nature 195 (4841), 567–568. doi:10.1038/195567a0
Rao, G. S., Subramanian, M. S., and Welch, G. A. (1963). Thermal decomposition of plutonium oxalates. J. Inorg. Nucl. Chem. 25 (10), 1293–1295. doi:10.1016/0022-1902(63)80395-4
Sadezky, A., Muckenhuber, H., Grothe, H., Niessner, R., and Pöschl, U. (2005). Raman microspectroscopy of soot and related carbonaceous materials: spectral analysis and structural information. Carbon 43 (8), 1731–1742. doi:10.1016/j.carbon.2005.02.018
Sarsfield, M. J., Taylor, R. J., Puxley, C., and Steele, H. M. (2012). Raman spectroscopy of plutonium dioxide and related materials. J. Nucl. Mater. 427 (1), 333–342. doi:10.1016/j.jnucmat.2012.04.034
Schoenes, J. (1980). Electronic transitions, crystal field effects and phonons in UO2. Phys. Rep. 63 (6), 301–336. doi:10.1016/0370-1573(80)90158-1
Schwartz, A. J., Wall, M. A., Zocco, T. G., and Wolfer, W. G. (2005). Characterization and modelling of helium bubbles in self-irradiated plutonium alloys. Philos. Mag. 85 (4-7), 479–488. doi:10.1080/02678370412331320026
Scott, B. L., Joyce, J. J., Durakiewicz, T. D., Martin, R. L., McCleskey, T. M., Bauer, E., et al. (2014). High quality epitaxial thin films of actinide oxides, carbides, and nitrides: advancing understanding of electronic structure of f-element materials. Coord. Chem. Rev. 266-267, 137–154. doi:10.1016/j.ccr.2013.09.019
Smith, E., and Dent, G. (2019). “The theory of Raman spectroscopy,” in Modern Raman spectroscopy. Editors E. Smith, and G. Dent (John Wiley & Sons), 77–99.
South, C. J., and Roy, L. E. (2021). Insights into the thermal decomposition of plutonium(IV) oxalate – a DFT study of the intermediate structures. J. Nucl. Mater. 549, 152864. doi:10.1016/j.jnucmat.2021.152864
Talip, Z., Peuget, S., Magnin, M., Tribet, M., Valot, C., Vauchy, R., et al. (2018). Characterization of un-irradiated MIMAS MOX fuel by Raman spectroscopy and EPMA. J. Nucl. Mater. 499, 88–97. doi:10.1016/j.jnucmat.2017.11.014
Taniguchi, T., Watanabe, T., Sugiyama, N., Subramani, A. K., Wagata, H., Matsushita, N., et al. (2009). Identifying defects in ceria-based nanocrystals by UV resonance Raman spectroscopy. J. Phys. Chem. C 113 (46), 19789–19793. doi:10.1021/jp9049457
Varga, Z., Nicholl, A., Wallenius, M., and Mayer, K. (2016). Plutonium age dating (production date measurement) by inductively coupled plasma mass spectrometry. J. Radioanalytical Nucl. Chem. 307 (3), 1919–1926. doi:10.1007/s10967-015-4418-5
Vigier, N., Grandjean, S., Arab-Chapelet, B., and Abraham, F. (2007). Reaction mechanisms of the thermal conversion of Pu(IV) oxalate into plutonium oxide. J. Alloys Compd. 444-445, 594–597. doi:10.1016/j.jallcom.2007.01.057
Villa-Aleman, E., Bridges, N. J., Shehee, T. C., and Houk, A. L. (2019a). Raman microspectroscopy of PuO2 particulate aggregates. J. Nucl. Mater. 515, 140–149. doi:10.1016/j.jnucmat.2018.12.022
Villa-Aleman, E., Christian, J. H., Darvin, J. R., Foley, B. J., Dick, D. D., Fallin, B., et al. (2023a). Diffuse reflectance spectroscopy and principal component analysis to retrospectively determine production history of plutonium dioxide. Appl. Spectrosc. 77 (5), 449–456. doi:10.1177/00037028221145724
Villa-Aleman, E., Darvin, J. R., Nielsen, M. H., and Willey, T. M. (2022). Raman signatures of detonation soot. J. Raman Spectrosc. 53, 1571–1579. doi:10.1002/jrs.6401
Villa-Aleman, E., Dick, D. D., Christian, J. H., and Foley, B. J. (2021a). Laser-induced annealing of aged PuO2. J. Raman Spectrosc. 52 (8), 1486–1489. doi:10.1002/jrs.6185
Villa-Aleman, E., Dick, D. D., Christian, J. H., Foley, B. J., and Roy, L. E. (2023b). The electronic Raman scattering spectrum of PuO2. J. Raman Spectrosc. 54 (3), 324–332. doi:10.1002/jrs.6477
Villa-Aleman, E., Houk, A. L., Bridges, N. J., and Shehee, T. C. (2019b). Raman spectroscopy: a tool to investigate alpha decay damage in a PuO2 crystal lattice and determining sample age since calcination. J. Raman Spectrosc. 50 (6), 899–901. doi:10.1002/jrs.5591
Villa-Aleman, E., Houk, A. L., Dick, D. D., and Hunyadi Murph, S. E. (2020). Hyper-Raman spectroscopy of CeO2. J. Raman Spectrosc. 51 (7), 1260–1263. doi:10.1002/jrs.5886
Villa-Aleman, E., Houk, A. L., Shehee, T. C., and Bridges, N. J. (2021b). Raman signatures from age-dating PuO2 since last calcination. J. Nucl. Mater. 551, 152969. doi:10.1016/j.jnucmat.2021.152969
Weber, W. J. (1983). Thermal recovery of lattice defects in alpha-irradiated UO2 crystals. J. Nucl. Mater. 114 (2), 213–221. doi:10.1016/0022-3115(83)90259-3
Wick, O. J. (1980). Plutonium handbook: a guide to the technology. La Grange Park, IL: American Nucear Society.
Winn, W. G., Bowman, W. W., and Boni, A. L. (1988). Ultra-clean underground counting facility for low-level environmental samples. Sci. Total Environ. 69, 107–144. doi:10.1016/0048-9697(88)90339-7
Keywords: Raman spectroscopy, FTIR, diffuse reflectance spectroscopy, plutonium, gamma spectroscopy
Citation: Villa-Aleman E, Darvin JR, Dick DD, Maxwell MC, Swindle AR and Foley BJ (2024) Spectroscopic analysis of Pu-bearing compounds in double-walled cells. Front. Nucl. Eng. 3:1355374. doi: 10.3389/fnuen.2024.1355374
Received: 13 December 2023; Accepted: 18 January 2024;
Published: 16 February 2024.
Edited by:
Kyle Hartig, University of Florida, United StatesReviewed by:
Mateusz Dembowski, Los Alamos National Laboratory (DOE), United StatesDaniel Felton, Oak Ridge National Laboratory (DOE), United States
Copyright © 2024 Villa-Aleman, Darvin, Dick, Maxwell, Swindle and Foley. This is an open-access article distributed under the terms of the Creative Commons Attribution License (CC BY). The use, distribution or reproduction in other forums is permitted, provided the original author(s) and the copyright owner(s) are credited and that the original publication in this journal is cited, in accordance with accepted academic practice. No use, distribution or reproduction is permitted which does not comply with these terms.
*Correspondence: Eliel Villa-Aleman, RWxpZWwudmlsbGEtYWxlbWFuQHNybmwuZG9lLmdvdg==