
94% of researchers rate our articles as excellent or good
Learn more about the work of our research integrity team to safeguard the quality of each article we publish.
Find out more
ORIGINAL RESEARCH article
Front. Nucl. Eng., 22 January 2024
Sec. Nuclear Materials
Volume 2 - 2023 | https://doi.org/10.3389/fnuen.2023.1340426
This article is part of the Research TopicWomen in Nuclear Engineering ResearchView all 15 articles
 Tashiema L. Ulrich*†
 Theodore M. Besmann
The phases in uranium-silicide binary system were evaluated in regards to their stabilities, phase boundaries, crystal structures, and phase transitions. The results from this study were used in combination with a well assessed literature to optimize the U-Si phase diagram using the CALPHAD method. A thermodynamic database was developed, which could be used to guide nuclear fuel fabrication, could be incorporated into other nuclear fuel thermodynamic databases, or could be used to generate data required by fuel performance codes to model fuel behavior in normal or off-normal reactor operations. The U3Si2 and U3Si5 phases were modeled using the Compound Energy Formalism model with 3 sublattices to account for the variation in composition. The crystal structure used for the USi phase was the tetragonal with an I4/mmm space. Above 450°C, the U3Si5 phase was modeled. The composition of the USi2 phase was adjusted to USi1.84. The calculated invariant reactions and the enthalpy of formation for the stoichiometric phases were in agreement with experimental data.
The tsunami-initiated nuclear accident that occurred at Fukushima, Japan a decade ago was the impetus behind the world’s renewed interest in alternative fuel concepts with enhanced accident tolerance for the current fleet of commercial power reactors (U.S. Nuclear Regulatory Commission, 2011; Kim et al., 2016; Zinkle and Was, 2013; Karoutas et al., 2018; Kurata, 2016). In the United States, the Department of Energy’s Office of Nuclear Energy initiated the accident tolerant fuel (ATF) development program, within the Advanced Fuels Campaign (AFC), to identify alternative fuel technologies to further enhance the safety and competitiveness of commercial nuclear power (U.S Department of Energy, 2015; Carmack et al., 2013; Bragg-Sitton et al., 2014; Terrani, 2018).
The U-Si system contains several compounds that are of interest as either a monolithic replacement for the current UO2 fuel (White et al., 2015; Goddard et al., 2016; World Nuclear News, 2019; Johnson et al., 2020; Westinghouse, 2023), a composite fuel with UN (Johnson et al., 2016; White et al., 2017; Wilson et al., 2018) or metal fuel (Dwight, 1982; Kim and Konings, 2012). The U-Si system has been the subject of various studies detailing thermophysical properties (White et al., 2014; White et al., 2015; White et al., 2015; White et al., 2016). The phase equilibria and thermodynamic properties of the U-Si system has been assessed by Berche et al. (2009) and Wang et al. (2016) however there are concerns regarding the accuracy and completeness of the phase diagram (Remschnig et al., 1992; Berche et al., 2009; White et al., 2015; Middleburgh et al., 2016; Noordhoek et al., 2016; Wang et al., 2016; Lopes et al., 2018; Wilson et al., 2018; Kocevski et al., 2019; Ulrich et al., 2020a; Ulrich et al., 2020b). Companion compositions to U3Si2 and U3Si5 require further study for a fuller understanding of compositional changes expected to occur in silicide fuel during reactor operation. These include compositions in the range of the USi and USi1.88 phases which lie within the 40–66 at% Si region of the phase diagram and can be considered as potential high burn-up phases. Questions remain concerning phase transition, homogeneity range, crystal structure, and potentially new equilibrium phases. As such, further experimental efforts have been suggested (Berche et al., 2009; White et al., 2015; Wilson et al., 2018).
The aim of this project was to develop a self-consistent thermodynamic database for the uranium-silicon system by 1) performing targeted experimental analyses of the potential U3Si5 phase transition, homogeneity range for the U3Si2, U3Si5 and the USi1.88 phases, the crystal structure of USi and the stability of the U5Si4 and U2Si3 phases; 2) using density functional theory (DFT) and molecular dynamics (MD) simulations to predict the energetically and dynamically stable phases in the U-Si system; 3) coupling the computational and experimental results with data from a critically assessed literature to optimize the U-Si system using the CALculation of PHAse Diagram (CALPHAD) method; 4) building and validating a U-Si thermodynamic model. The database generated from this work could be used with other fuel performance codes to predict silicide fuel behavior during normal or off-normal reactor operations, optimize fuel fabrication processes, and support licensing efforts. The focus of this paper is the optimized U-Si phase diagram from the theoretical and experimental data generated from this project as well as literature data.
The first compositional diagram for the uranium-silicon system was based on studies performed by Kaufmann et al., in the 1940s at the Massachusetts Institute of Technology (Cullity, 1945). The original phases reported were U10Si3, U5Si3, USi, U2Si3, USi2, and USi3 (Katz and Rabinowitch, 1951). In 1949, Zachariasen (1949) further refined the original composition diagram by correcting the identification of several compounds; U10Si3 was actually U3Si, U5Si3 was U3Si2, and U2Si3 (β-USi2) was an isostructural form of USi2 (α-USi2).
Later, in 1957, Kaufmann et al. (1957) published the phase diagram shown in Figure 1A, which contains the compounds U3Si (ε), U3Si2 (δ), USi (ζ), U2Si3 (η), USi2 (θ) and USi3 (ι). Kaufmann et al. (1957) claimed that the ε phase has a very narrow composition range near 23 at% Si, rather than a stoichiometric ratio of U3Si and also that the α-USi2 phase did not transform at high temperature to β-USi2 and formed the compound U2Si3 in its place. U3Si forms at 1203 K through the peritectic reaction between U3Si2 and γ-uranium-silicon solid solution. A eutectic exists between γ-uranium and U3Si2 at 9 at% Si and a temperature of 1258 K. The compound U3Si2 congruently melts at 1938 K. The USi compound incongruently melts at 1848 K and there is a eutectic between U3Si2 and USi at 1843 K. The U2Si3 compound incongruently melts at 1883 K and the USi2 compound is reported to melt congruently at approximately 1973 K. USi3 is shown to have an incongruent melting point at 1783 K. There is a eutectic at 87 at% Si between USi3 and silicon at 1588 K. There was appreciable solid solubility of silicon in uranium.
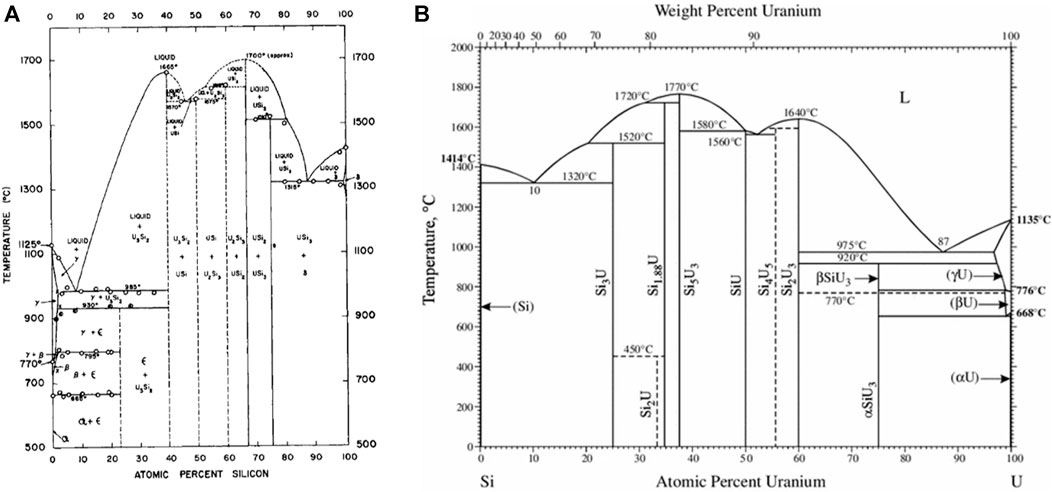
FIGURE 1. Illustration of the 1957 U-Si phase diagram (A) compared to the U-Si phase diagram currently referenced (B) (Kaufmann et al., 1957; Massalski, 1990).
The phase diagram that is currently referenced is shown in Figure 1B and was published in 1990 in ASM international (Massalski, 1990). This phase diagram is characterized by seven intermetallic phases, U3Si, U3Si2, USi, U3Si5, USi1.88, USi2, and USi3. The 0–50 at% Si region remained as previously reported by Kaufmann et al. (1957) except for the temperature where the eutectic reaction occurs between U3Si2 and USi. The phase identified as U2Si3 by Kaufmann, or β-USi2 by Zachariasen (1949), is represented as U3Si5. In 1959 Brown and Norreys (1959) reported that the U2Si3 phase was in fact a modification of the α-USi2 compound; however, the composition was located between 62–63 at% Si (U3Si5). Brown and Norreys (1961) also reported that the phase considered as α-USi2 is actually USi1.88, forming at 65 at% Si and has high melting point. They further claimed that the compound at exact 1:2 stoichiometry does not exist above 723 K.
In an attempt to elucidate the controversy regarding the phases between the 40 to70 at% silicon region of the U-Si system, Vaugoyeau et al. (1972) reexamined the system within this region. The existence of compounds USi, U3Si5, U3Si2 and USi1.88 were confirmed (Vaugoyeau et al., 1972). Vaugoyeau et al. (1972) reported: The USi phase forms at 1853 ± 10 K from a peritectic reaction between liquid and U3Si5. The temperature of the eutectic reaction between USi and U3Si2 was 1813 ± 10 K, which is approximately 20 K lower than that reported by Kaufmann et al., (Kaufmann et al., 1957). The melting of U3Si5 occurred congruently at 2043 ± 10 K instead of incongruently at 1883 K. The USi1.88, reported by Brown and Norreys (1961) forms through a peritectic reaction between liquid and U3Si5 at 1983 ± 10 K. The stoichiometric USi2 compound was not observed by Vaugoyeau et al. (1972).
Additional research since the publication of the phase diagram in Figure 1B shows the need for updates. The U3Si phase was reported to undergo an allotropic transition at 1043 K (Dwight, 1982). A new phase, U5Si4, was reported by Noёl et al. (1998) and Berche et al. (2009) claimed that the phase is formed through a peritectic reaction between the liquid phase and U3Si2 at 1840 ± 10 K and participates in the eutectic reaction between the liquid phase and the USi phase at 1820 ± 10 K. The stoichiometric USi2 phase was reported as metastable (Sasa and Uda, 1976; Dwight, 1982; Remschnig et al., 1992; Noordhoek et al., 2016) and the U3Si5, U3Si2, and USi1.88 phases were each reported to have a narrow composition range (Dwight, 1982). A phase transition at 773 K was noted for the U3Si5 phase (White et al., 2015).
The crystal structure properties including the structure types, space groups, prototypes, lattice parameters for the various uranium silicide phases are summarized Table 1. The U3Si crystal structure reported by Zachariasen (1949) in 1949 was often reproduced (Kaufmann et al., 1957; Dwight, 1982; Remschnig et al., 1992). Kimmel et al. (Kimmel et al., 1980), established that the space group reported earlier (Zachariasen, 1949) was correct; but the assignment of the uranium and silicon lattice sites was incorrect. Noël et al. (2023) also reported that the tetragonal structure undergoes an orthorhombic distortion at 120 K. Dwight, (1982) reported that the tetragonal U3Si transforms to a cubic Cu3Au-type structure at 1038 K.
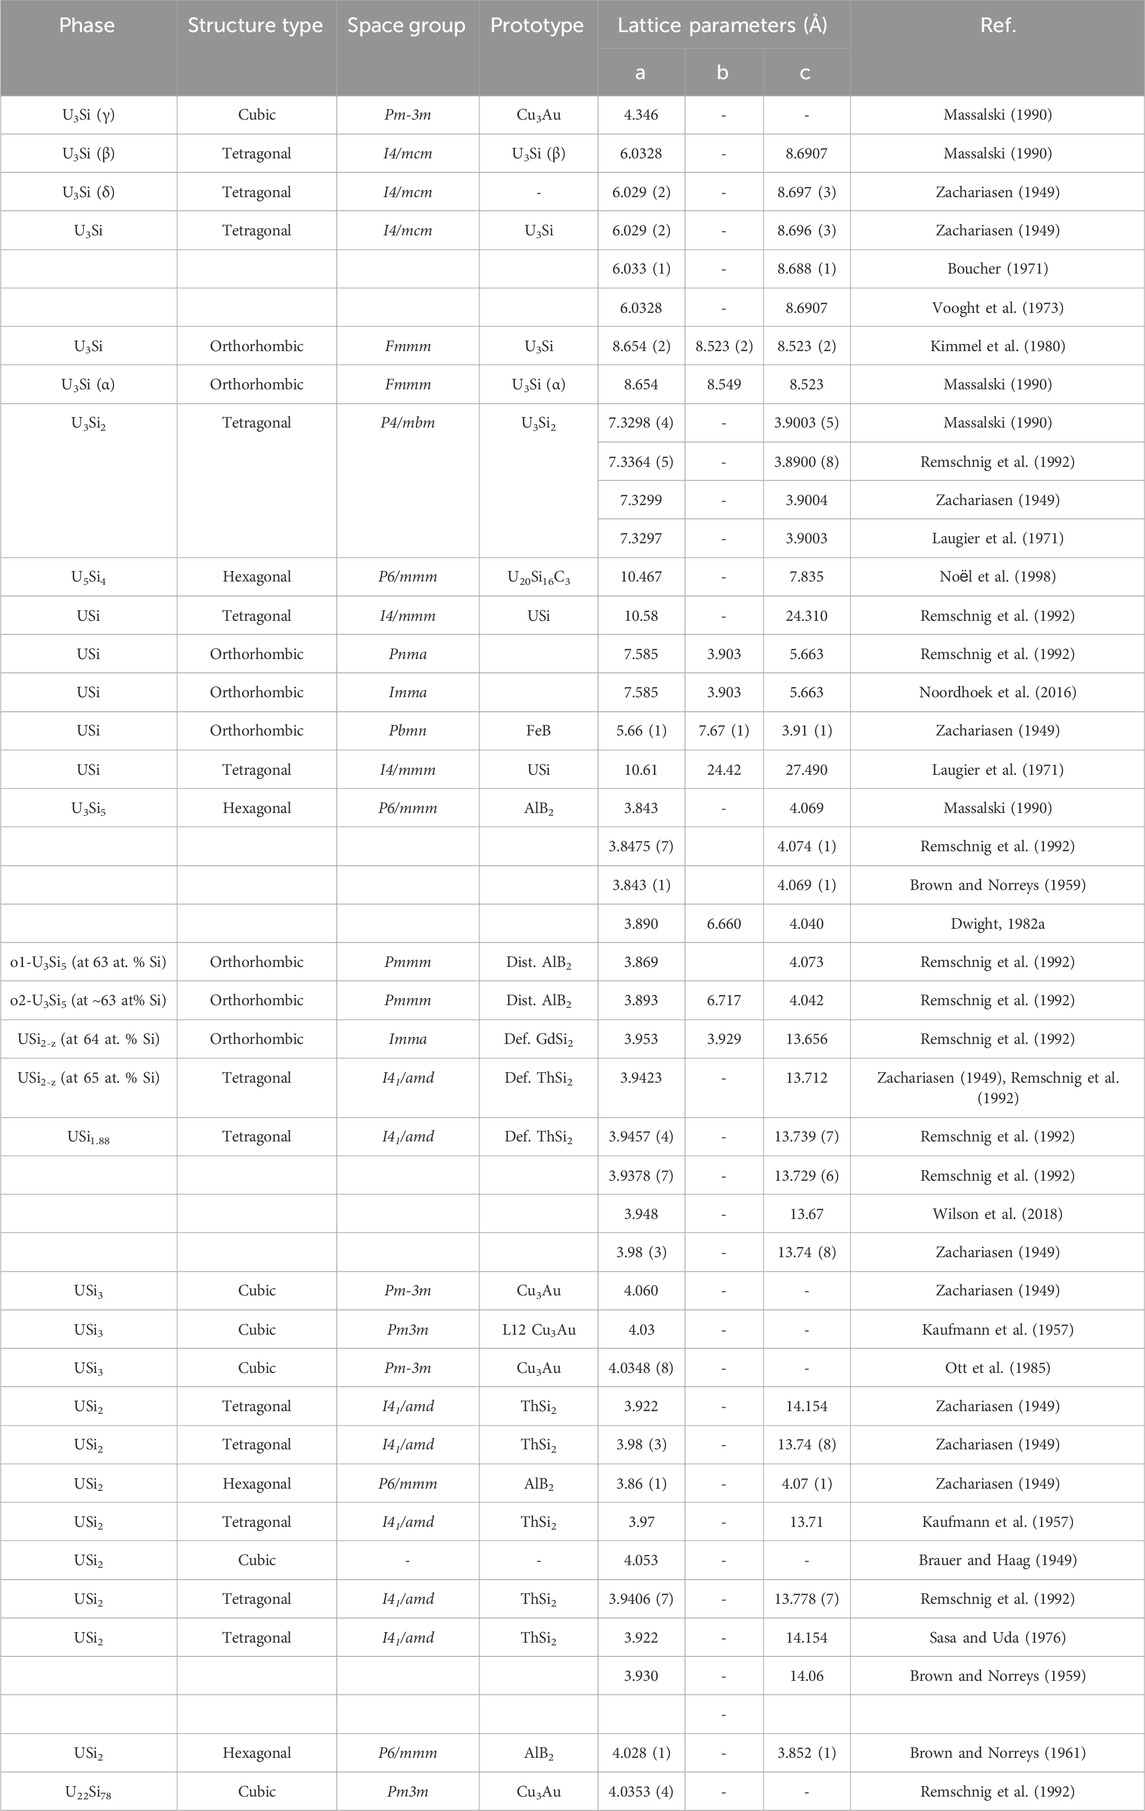
TABLE 1. Summary of crystallographic properties for the U-Si phases including structure type, space group, prototype, and lattice parameters found in the literature.
The U3Si2 compound has a primitive tetragonal structure belonging to the P4/mbm space group and is a prototype for binary ternary rare earth compounds (Pöttgen, 1994; Lukachuk and Pöttgen, 2003). While all published experimental data are in agreement with the early work of Zachariasen (1949), DFT calculations fail to predict the experimental P4/mbm as the most stable structure (Noordhoek et al., 2016).
The U5Si4 phase reported in 1998 by Noёl et al. (1998) has a hexagonal unit cell, P6/mmm space group, with lattice parameters a = 10.468 Å and c = 3.912 Å and is isostructural to the U20Si16C3 ternary phase (Lopes et al., 2019; Noël et al., 2023). The crystal structure of the equiatomic compound, USi, is the most controversial of the binary silicides. The compound was reported by Zachariasen (1949) to be orthorhombic of the FeB structure type. His results were based on diffractometer data taken on a powder sample. In later work, Bihan et al. (1996) reported that pure USi has a tetragonal structure with an I4/mmm space group as determined from a Weissenberg pattern on a small single crystal. Bihan et al. (1996) further state that the orthorhombic structure by found by Zachariasen (1949) is stabilized by 0.5–1.0 wt% oxygen. Remschnig et al. (1992) and Noordhoek et al. (2016) also reported an orthorhombic structure; however, both differ from the work of Zachariasen, (1949) and each other as the structure by Remschnig et al. (1992) belongs to the Pnma space group while the one by Noordhoek et al. (2016) belongs to the Imma Space group.
The compound USi2 with exact 1:2 stoichiometry has all silicon sites occupied and exists in one of two structure types, either AlB2 or ThSi2, belonging to the P6/mmm or the I41/amd space group. The compound U3Si5 is hexagonal, hP3, A1B2-type structure which was reported to undergo an orthorhombic distortion when slightly rich in silicon (63 at% Si) to form the structure belonging to the Pmmm space group (Remschnig et al., 1992). The USi1.88 phase is tetragonal of the ThSi2-type and experiences an orthorhombic distortion when slightly silicon poor (64 at% Si) (Remschnig et al., 1992).
The silicon-rich compound USi3 has the cubic Cu3Au-type structure.
The tabulated enthalpies of formation for the different U-Si phases are summarized in Table 2. The enthalpies of formation of USi3, USi2, USi and U3Si2 were measured as −33.05 kJ mol-1, -43.51 kJ mol-1, -40.17 kJ mol-1 and -33.89 kJ mol-1 by Gross et al. (1962) by measuring the heats evolved in the direct combination of the elements. The enthalpies of formation for USi3, USi2, and USi were verified by measuring the heats of reaction of tellurium with the preformed compounds and comparing them with those obtained from reacting equivalent quantities of the uncombined elements with tellurium. The enthalpy of formation for USi3, USi2, and USi were measured as −32.22, −42.69, and −43.52 kJ mol -1, respectively (Gross et al., 1962). Alcock and Grieveson (1961) measured silicon vapor pressure above the mixtures USi-U3Si5, U3Si5–USi2, USi2–USi3 and USi3–Si from the weight loss of a Knudsen cell. From these measurements, the Gibbs energy of U3Si5, USi2 and USi3 were directly derived. Activities of uranium and silicon for the U–U3Si2 mixture were determined from the chemical analysis of the condensate formed from the vapor effusing from the cell. Because of small associated values of uranium activity, a solid/liquid equilibration method using liquid gold–uranium alloys were used for the U3Si2–USi mixture. The Gibbs energies of formation of the compounds were derived from the silicon and uranium activity measurements. The results reported by Gross et al. (1962) and Alcock and Grieveson (1961) are in good agreement. OHare et al. (1974) reported the enthalpy of formation of U3Si as −26.05 ± 4.8 kJ mol-atom-1 using fluorine bomb calorimetry. The enthalpy of formation for U3Si5 and the tetragonal USi were measured as −43.8 ± 9.0 kJ mol -1 and −43.2 ± 6.2 kJ mol -1 for using oxidative drop calorimetry (Chung et al., 2018). The heat capacity as a function of temperature for U3Si, U3Si2, USi and U3Si5 were measured by White et al. (2015); White et al. (2016) using differential scanning calorimetry from room temperature to 1150 K, 1773 K, 1673 K, and 1773 K, respectively. To the authors knowledge, there are no experimental efforts reported for obtaining the thermodynamic properties of the liquid phase.
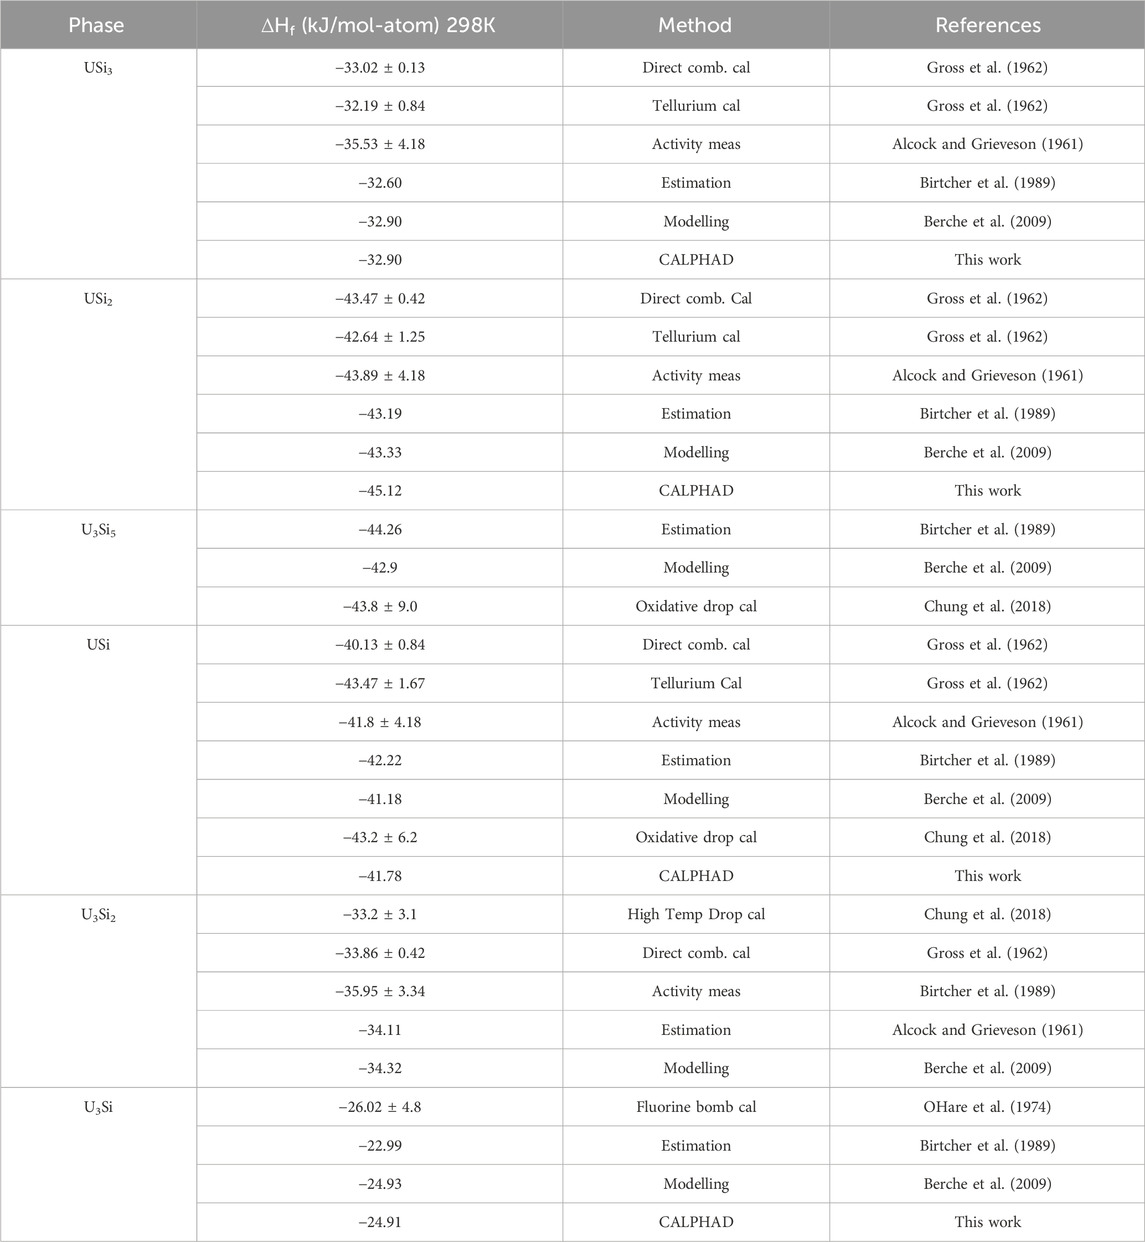
TABLE 2. Summary of the enthalpy of formation for the various U-Si phases from the literature compared to the values calculated in this work.
The CALPHAD method is commonly used for calculating phase diagrams and predicting thermodynamic properties of a given system through critical assessment of available experimental and/or theoretical data. The CALPHAD method uses mathematical models with adjustable parameters to represent Gibbs energy functions of the phases as a function of temperature, pressure, and composition and calculates the thermodynamic equilibrium by minimizing the Gibbs energy of the system (Kaufman and Bernstein, 1970; Lukas et al., 2007). These functions are stored in a database and are used to calculate phase diagrams and thermodynamic properties. These databases are constructed by incorporating phase diagram data, thermochemical data, and physical and crystallographic properties of the phases (Perrut, 2015).
The first step in the CALPHAD method is to perform a thorough literature search and critically evaluate all the available data. The type of data to search for include; i) experimentally measured thermodynamic quantities such as enthalpies and heat capacity data, ii) the phase diagram data such as the liquidus temperatures and the phase transition reactions, iii) crystallographic information of solid phases (Ferro and Cacciamani, 2002), and first-principles calculations of total energies (Liu, 2009). When evaluating the experimental data, critical attention is paid to the experimental technique, experimental conditions, sample purity, quantities measured, phases present within the system, and accuracy of the measurements as there are many types of equipment utilized to collect the same information. First-principles data are normally used when there are no available experimental data. During the literature search, the possibility of finding previous assessments for the system of interest exists. In such cases, careful examination of the Gibbs energy models used for describing the system is necessary as it may be possible to improve the system. The second step is to develop a mathematical model for G (T, P, composition) for each phase (liquid, solid phases, gas … ) and to optimize model parameters simultaneously using all available thermodynamic and phase equilibrium data obtained from the first step. The third step is to use the models to calculate phase diagrams and other thermodynamic properties by minimization of the Gibbs energy. The fourth and final step is to use the calculated phase equilibria to develop a database.
The Gibbs energy of a phase can be expressed as follows in Eqs 1, 2:
Where
The gases in the U-Si system are Sig, Ug, Si(2g) and Si(3g) gases. The Gibbs energy functions for the gases are taken from the Scientific Group Thermodata Europe (SGTE) database complied by Dinsdale for pure elements (Dinsdale, 1991).
The molar Gibbs energy °Gi of a pure element i in a phase at temperature and pressure of 105 Pa, relative to the “Standard Element Reference”
a0, a1, a2, a3, … are coefficients,
The molar Gibbs energies for stoichiometric phases can be described by using Eq. 4 where the standard Gibbs energy is equal to the standard enthalpy (see Eq. 5) minus the temperature times the standard entropy (see Eq. 6).
The partially ionic two sublattice model (Lukas et al., 2007) is used to model liquid phases as:
vA and yA are the charge and site fractions of the anion species, Aj, and vC and yC are the charge and site fraction of the cation species, Ci, respectively. In Eq. 9, the Gibbs energy of the ionic liquid is expressed as:
Where
The compound energy formalism (CEF) was introduced by Hillert (2001) to describe the Gibbs energy of solid phases with sublattices. These phases have two or more sublattices and at least one of these sublattices has a variable composition. Ideal entropy of mixing is assumed on each sublattice. This model is generally used to model crystalline solids; but it can also be extended to model ionic liquids.
Here, a solution phases with two sublattices, (A,B)a (C,D)b, will be used as an example to illustrate the compound energy formalism. In this model, components A and B can mix randomly on the first sublattice, as do the components C and D on the second sublattice. a and b are the corresponding stoichiometric coefficients. Site fraction
When each sublattice is only occupied by one component, then end-members of the phase are produced. In the present case, four end-members exist. They are AaCb, AaDb, BaCb and BaDb. The surface of reference refGm is expressed as in Eq. 13:
The ideal entropy (idSm) and the excess free energy are expressed as follows in Eqs 14, 15, respectively:
The binary interaction parameters Li,:k represent the interaction between the constituents i and j in the first sublattice when the second sublattice is only occupied by constituent k. These parameters can be further expanded with Redlich-Kister polynomial as follows in Eq. 16:
In the case of a three sublattice model the Gibbs energy is written in Eq. 17 and the excess energy is given in Eq. 18:
The FactSage thermochemical software (Bale et al., 2016) was used to perform the optimization of the uranium-silicon binary system. Summarized in Table 3 are the phases, with their crystal structure, space groups, prototypes, composition, and the thermodynamic model of the U-Si phases studied in this work. Unlike the previous two models (Berche et al., 2009; Wang et al., 2016), the liquid phase is modeled using the TSPIL model, where the first sublattice contains the U+4 and Si+4 cations and the second sublattice is occupied by a neutral vacancy as depicted by Eq. 19.
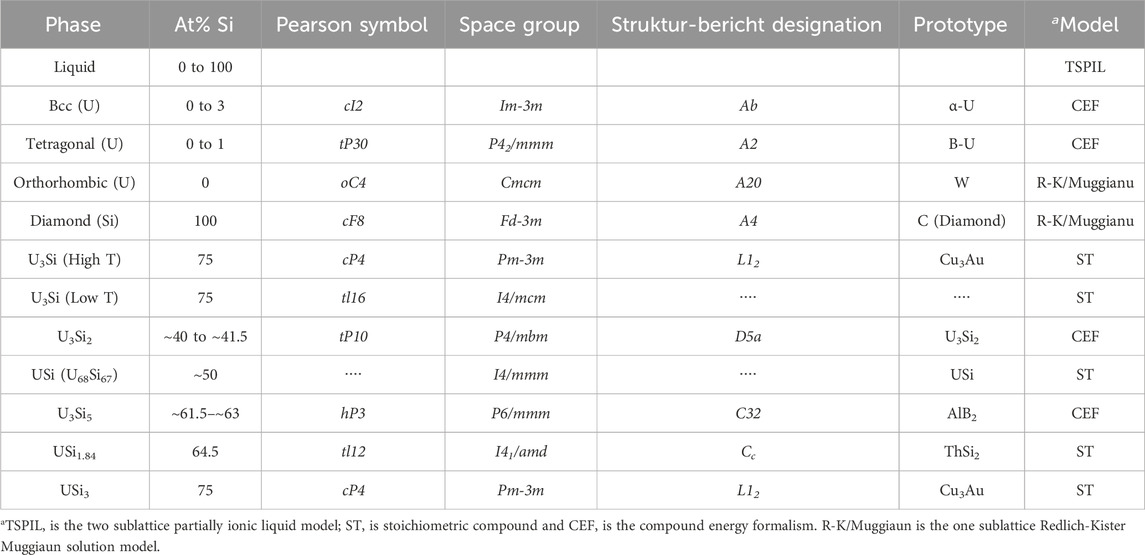
TABLE 3. Phases, composition, crystal structure, and thermodynamic model used for the optimization of the U-Si phase diagram.
This model was chosen because it is the mostly commonly used for modeling liquid phases and will therefore make incorporation of other elements into the U-Si database (e.g., fission product) a straightforward process. The excess energy parameters from Berche et al. (2009) were used for the initial point and adjusted as necessary.
The USi3, USi1.84, U68Si67, and U3Si compositions were modeled as stoichiometric phases. The USi phase was previously assessed with the FeB-type structure; however, neutron diffraction confirmed that the phase has a tetragonal structure with I4/mmm space group. Therefore, the phase was modeled based on the recent findings. The recent enthalpy of formation data collected in 2018 (Chung et al., 2018) for the USi phase with tetragonal structure was used in the optimization. The composition of the USi2-x phase was adjusted from USi1.88 to USi1.84 to reflect the experimental findings (Remschnig et al., 1992).
The U3Si5 and U3Si2 phases were modeled as a solid solution using the CEF model. The U3Si2 phase was modeled with 3 sublattices
The U3Si5 phase was also modeled using CEF model with 3 sublattices,
The optimized parameters for the compounds and solid solutions are provided in Table 4 and the phase diagram is provided in Figure 2.
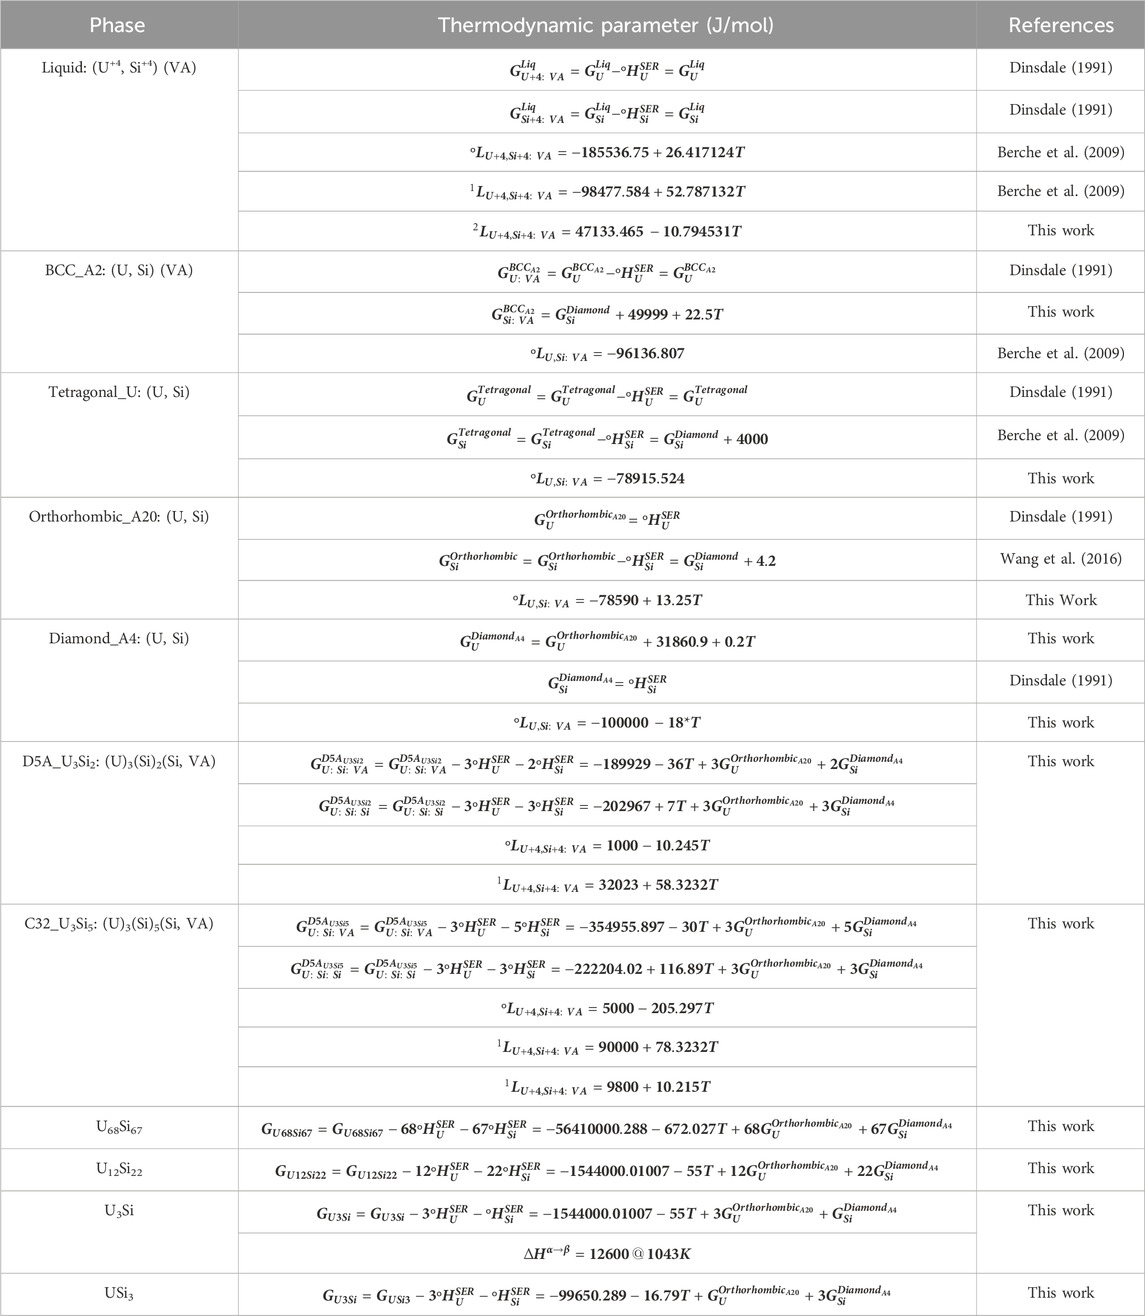
TABLE 4. Optimized thermodynamic parameters for the U-Si system.
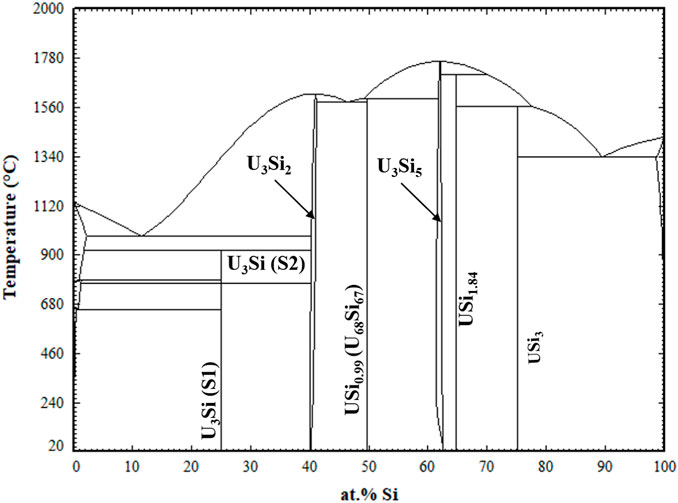
FIGURE 2. Optimized U-Si Phase Diagram. Arrows are pointing to the U3Si2 and U3Si5 homogeneity range.
The U-Si phase equilibria was modeled using the CALPHAD methodology and for the first time the U3Si2 and U3Si5 phases were modeled as nonstoichiometric phases using the 3 sublattice CEF model. The optimized diagram is displayed in Figure 3 and is compared to experimental data and calculated diagram by Berche el. al. (Berche et al., 2009). The diagram is in good agreement with respect to melting point and the terminal solutions.
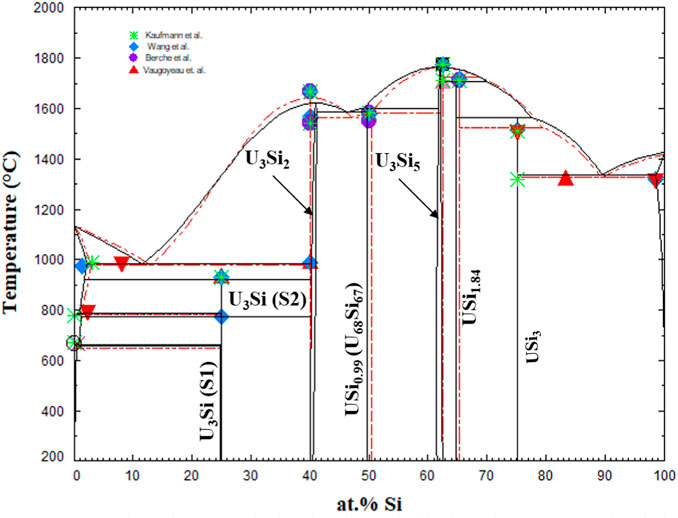
FIGURE 3. U-Si phase diagram calculated in the work (black) and super-imposed with the one from Berche et al., (Berche et al., 2009). The markers are experimental data from (Vaugoyeau et al., 1972; Dwight, 1982; Massalski, 1990; Wang et al., 2016).
Displayed in Figure 4 is a zoomed in region of the U3Si2 a) and U3Si5 b) phases. The U3Si2 phase is modeled with a homogeneity range of U3Si1.95 to U3Si2.05, which is in agreement with the neutron and experimental results from this project (Ulrich et al., 2020b); however, it disagrees with the work of Middleburg et al. (Middleburgh et al., 2016), at low temperatures (i.e., any temperature below 1,000°C). Further experimental work is suggested on samples with a wider homogeneity range to determine the exact width of the solubility range. However, this work shows that modeling the U3Si2 phase with the 3 sublattice model is sufficient enough to mimic the experimental composition. Furthermore, it will serve as a starting point for incorporating elements with the affinity for dissolving into U3Si2.
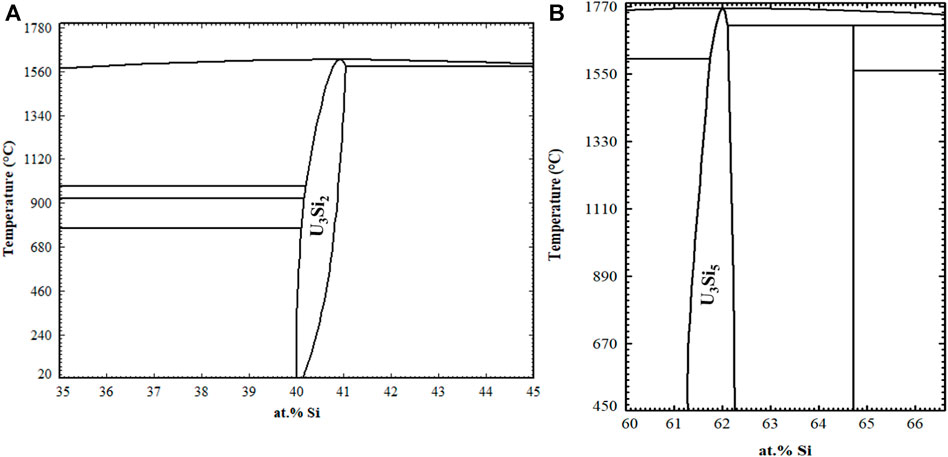
FIGURE 4. Zoomed in region of the U3Si2 (A) and U3Si5 (B) phase regions.
Experimentally, it has been shown that the U3Si5 phase can exist between the 62.5–63.4 at.% Si phase region; however, since it exists with an unknow, the exact composition of the phase is unknown. Although the phase diagram showed an overall good agreement with experimental data, the model for this phase could use further optimizing as the calculated composition region is narrower than the experimental composition. However, before further optimization of the phase, further experiments and computational analysis would prove useful for understanding the nature of the phase transition associated with the composition. The calculated enthalpy of formation for the stoichiometric compounds and the different invariant reactions are in agreement with literature values, see Table 2 and Table 5, respectively.
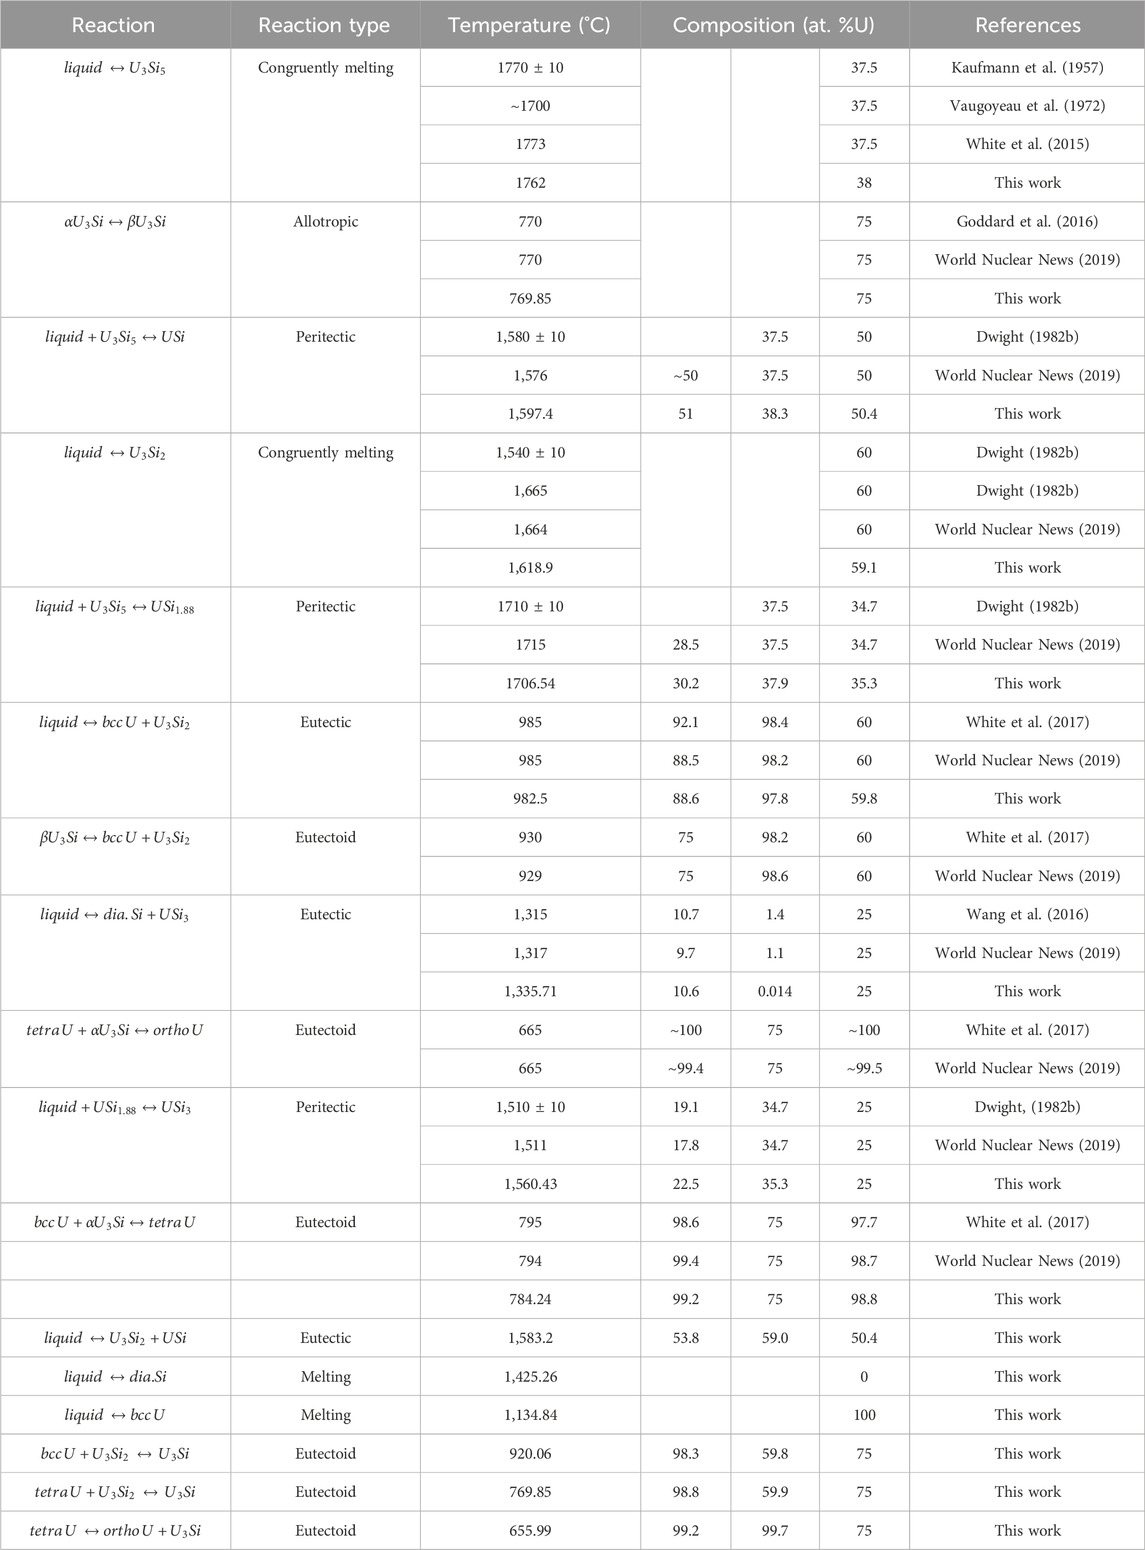
TABLE 5. Invariant reactions in the U-Si system calculated in the work and compared to literature values.
The aim of this work was to develop a self-consistent thermodynamic database for the uranium-silicon system that can be used to predict silicide fuel behavior during normal or off-normal reactor operations, optimize fuel fabrication processes, and support licensing efforts. To achieve this, the 40–66 at% Si region of the U-Si system had to be investigated for the phases, phase transitions, homogeneity ranges, and crystal structures.
A thermodynamic database for the U-Si phase containing the optimized parameters has been developed and an overall good agreement between the calculated diagram and the experimental phase diagram data was achieved. Representing the U3Si2 phase as a 3 sublattice model accurately accounts for Si interstitial defects, which are the primary defects found in this structure. The CALPHAD results for the phase diagram from 40–66 at% Si are summarized below.
• The U3Si2 phase exhibits a homogeneity range from room temperature to its melting point.
• U5Si4 (P6/mmm space group) should not be considered as an equilibrium phase in the U-Si system. The phase could potentially be metastable with negative energy of formation located 2 meV above the U-Si convex hull and has a stable isostructural ternary phase, U20Si16C3 (P6/mmm). This suggests that the binary could be stabilized by a third element (Lopes et al., 2018; Kocevski et al., 2019; Ulrich et al., 2020a).
• The crystal structure of the USi phase was confirmed as having a tetragonal supercell with an I4/mmm space group and invariant stoichiometry of USi0.99 (Ulrich et al., 2020a).
• Above 450°C, the U3Si5 phase was found to exhibit a homogeneity range. Below 450°C, U3Si5 was found to exist with another unidentified phase. Regarding the equilibrium phase diagram, it is recommended that this phase transition not be included until more knowledge is acquired.
• The composition of the tetragonal α-USi2 phase was found to be ∼USi1.84 after annealing for 72 h at 1,200°C.
• The Molar mass of USi and USi1.88 were adjusted to represent change in composition, U68Si67 and USi1.84, respectively.
The original contributions presented in the study are included in the article/Supplementary material, further inquiries can be directed to the corresponding author.
TU: Conceptualization, Data curation, Formal Analysis, Investigation, Methodology, Visualization, Writing–original draft, Writing–review and editing. TB: Conceptualization, Funding acquisition, Project administration, Resources, Writing–review and editing.
The author(s) declare financial support was received for the research, authorship, and/or publication of this article. The work done in this paper contributes to the project: Phase Equilibria and Thermochemistry of Advance Fuel: Modelling Burnup Behavior. This work was funded by the Department of Energy Nuclear Energy University Program (NEUP).
The authors would also like to acknowledge Sven C. Vogel, Joshua T. White, David A. Andersson, Elizabeth Sooby, Denise A. Lopes, Vancho Kocevski, and Emily Moore for their significant contribution to the project that helped to generate the data needed in order to perform a CALPHAD optimization.
The authors declare that the research was conducted in the absence of any commercial or financial relationships that could be construed as a potential conflict of interest.
All claims expressed in this article are solely those of the authors and do not necessarily represent those of their affiliated organizations, or those of the publisher, the editors and the reviewers. Any product that may be evaluated in this article, or claim that may be made by its manufacturer, is not guaranteed or endorsed by the publisher.
Alcock, C. B., and Grieveson, P. (1961). A thermodynamic study of the compounds of uranium with silicon, germanium, tin, and lead. J. Inst. Metals 90, 304–310.
Bale, C. W., Bélisle, E., Chartrand, P., Decterov, S. A., Eriksson, G., Gheribi, A. E., et al. (2016). FactSage thermochemical software and databases, 2010–2016. CALPHAD 54, 35–53. doi:10.1016/j.calphad.2016.05.002
Berche, A., Rado, C., Rapaud, O., Guéneau, C., and Rogez, J. (2009). Thermodynamic study of the U-Si system. J. Nucl. Mater. 389, 101–107. doi:10.1016/j.jnucmat.2009.01.014
Bihan, T. L., Noel, H., and Rogl, P. F. (1996). Crystal Structure of the uranium monosilicide (USi). J. Alloys Compd. 240, 128–133. doi:10.1016/0925-8388(96)02273-6
Birtcher, R. C., Mueller, M. H., Richardson, J. W., and Faber, J. (1989). Neutron irradiated uranium silicides studied by neutron diffraction and Rietveld analysis. MRS Online Proc. Libr. Arch. 166, 437. doi:10.1557/proc-166-437
Boucher, R. R. (1971). X-ray diffraction on U3Si. J. Acta Crystallogr. 4, 326–328. doi:10.1107/S0021889871007088
Bragg-Sitton, S., Merrill, B., Teague, M., Ott, L., Robb, K., Farmer, M., et al. (2014). Advanced fuels campaign: enhanced LWR accident tolerant fuel performance metrics. United States: Idaho National Laboratory. Technical Report INL/EXT-13-29957.
Brauer, G., and Haag, H. (1949). Notiz über die Kristallstruktur von Uransilicid. Z. Fur Anorg. Chem. 259, 197–200. doi:10.1002/zaac.19492590117
Brown, A., and Norreys, J. J. (1959). Beta-polymorphs of uranium and thorium disilicides. Nature 183, 673. doi:10.1038/183673a0
Carmack, J., Goldner, F., Bragg-Sitton, S. M., and Snead, L. L. (2013). Overview of the U.S. DOE accident tolerant fuel development program, TopFuel 2013 Charlotte. United States: Idaho National Lab. (INL), Idaho Falls.
Chung, C.-K., Guo, X., Wang, G., Wilson, T. L., White, J. T., Nelson, A. T., et al. (2018). Enthalpies of formation and phase stability relations of USi, U3Si5 and U3Si2. J. Nucl. Mater. 523, 101–110. doi:10.1016/j.jnucmat.2019.05.052
Cullity, B. D. (1945). Alloys of uranium and silicon. I. The uranium-silicon phase diagram. U.S.A.E., Report No. CT-3310.
Dinsdale, A. (1991). SGTE data for pure elements. CALPHAD 15, 317–425. doi:10.1016/0364-5916(91)90030-N
Dwight, A. (1982a). Study of the uranium–aluminum–silicon system. IL, USA: Argonne National Lab. doi:10.2172/6753243
Dwight, A. E. (1982b). Study of the uranium-aluminum-silicon system. United States: Argonne National Lab. doi:10.2172/6753243
Ferro, R., and Cacciamani, G. (2002). Remarks on crystallochemical aspects in thermodynamic modeling. CALPHAD 26, 439–458. doi:10.1016/S0364-5916(02)00056-1
Goddard, D. T., Mathers, D. P., Eaves, D. G., Xu, P., Lahoda, E. J., and Harp, J. M. (2016). Manufacturability of U3Si2 and its high temperature oxidation behavior. USA: Boise, Idaho.
Gross, T., Hayman, C., and Clayton, M. H. (1962). Thermodynamic of nuclear materials. Process Symp. 1963, 653–665.
Hillert, M. (2001). The compound energy formalism. J. Alloys Compd. 320, 161–176. doi:10.1016/S0925-8388(00)01481-X
Johnson, K. D., Raftery, A. M., Lopes, D. A., and Wallenius, J. (2016). Fabrication and microstructural analysis of UN-U3Si2 composites for accident tolerant fuel applications. J. Nucl. Mater. 477, 18–23. doi:10.1016/j.jnucmat.2016.05.004
Johnson, K. E., Adorno, D. L., Kocevski, V., Ulrich, T. L., White, J. T., Claisse, A., et al. (2020). Impact of fission product inclusion on phase development in U3Si2 fuel. J. Nucl. Material 537, 152235. doi:10.1016/j.jnucmat.2020.152235
Karoutas, Z., Brown, J., Atwood, A., Hallstadius, L., Lahoda, E., Ray, S., et al. (2018). The maturing of nuclear fuel: past to accident tolerant fuel. Prog. Nucl. Energy 102, 68–78. doi:10.1016/j.pnucene.2017.07.016
Katz, J. J., and Rabinowitch, E. (1951). The chemistry of uranium – Part 1, the element, its binary and related compounds. New York: McGraw-Hill Book Company, Inc., 226–229.
Kaufman, L., and Bernstein, H. (1970). Computer calculations of phase diagrams. New York: Academic Press.
Kaufmann, A. R., Cullity, B. D., and Bitsianes, G. (1957). Uranium silicon alloys. J. Metals 9, 23–27. doi:10.1007/BF03398440
Kim, H. G., Yang, J. H., Kim, W. J., and Koo, Y. H. (2016). Development status of accident tolerant fuel for light water reactors in Korea. Nucl. Eng. Technol. 48, 1–15. doi:10.1016/j.net.2015.11.011
Kim, Y. S. (2012). “Uranium intermetallic fuels (U-Al, U-Si, U-Mo),” in Comprehensive nuclear materials. Editor R. Konings, 3, 391–422.
Kimmel, G., Sharon, B., and Rosen, M. (1980). Structure and phase stability of uranium-silicon U3Si at low temperatures. Acta Crystallogr. B36, 2386–2389. doi:10.1107/S0567740880008783
Kocevski, V., Lopes, D. A., and Besmann, T. M. (2019). Investigation of the on-site Coulomb correction and temperature dependence of the stability of U–Si phases using DFT+U. J. Nucl. Mater. 524, 157–163. doi:10.1016/j.jnucmat.2019.07.003
Kurata, M. (2016). Research and development methodology for practical use of accident tolerant fuel in light water reactors. Nucl. Eng. Technol. 48, 26–32. doi:10.1016/j.net.2015.12.004
Laugier, J., Blum, P. L., and de Tournemine, R. (1971). Sur la veritable structure du compose USi. J. Nucl. Mater. 41, 106–108. doi:10.1016/0022-3115(71)90205-4
Liu, Z. K. (2009). First principles calculations and calphad modeling of thermodynamics. J. Phase Equilibria 30, 517–534. doi:10.1007/s11669-009-9570-6
Lopes, D. A., Kocevski, V., Wilson, T. L., and Besmann, T. M. (2018). Stability of U5Si4 phase in U-Si system: crystal structure prediction and phonon properties using first-principles calculations. J. Nucl. Mater. 510, 331–336. doi:10.1016/j.jnucmat.2018.08.026
Lopes, D. A., Wilson, T. L., Kocevski, V., Moore, E. E., Besmann, T. M., Sooby Wood, E., et al. (2019). Experimental and computational assessment of USiN ternary phases. J. Nucl. Mater. 516, 194–201. doi:10.1016/j.jnucmat.2019.01.008
Lukachuk, M., and Pöttgen, R. (2003). Intermetallic compounds with ordered U3Si2 and Zr3Al2 type structure – crystal chemistry, chemical bonding and physical properties. Z. für Kristallogr. 218, 767–787. doi:10.1524/zkri.218.12.767.20545
Lukas, H., Fries, S. G., and Sundman, B. (2007). Computational thermodynamics: the calphad method. Cambridge: Cambridge University Press.
Massalski, B. T. (1990). Binary alloy phase diagrams. second Ed. (Materials Park, OH: ASM), 3374–3375.
Middleburgh, S. C., Grimes, R. W., Lahoda, E. J., Stanek, C. R., and Andersson, D. A. (2016). Non-stoichiometry in U3Si2. J. Nucl. Mater. 482, 300–305. doi:10.1016/j.jnucmat.2016.10.016
Noël, H., Chatain, S., Alpettaz, T., Guéneau, C., Duguay, C., and Léchelle, J. (2023). Experimental determination of (U-Si-C) ternary phase diagram at 1000°C and experimental points in the quaternary (U-Pu-Si-C) system. F-BRIDGE, Report No. D-151.
Noordhoek, M. J., Besmann, T. M., Andersson, D., Middleburgh, S. C., and Chernatynskiy, A. (2016). Phase Equilibria in the U-Si system from first-principles calculations. J. Nucl. Mater. 479, 216–223. doi:10.1016/j.jnucmat.2016.07.006
Noёl, H., Queneau, V., Durand, J. P., and Colomb, P. (1998). Abstract of a paper at the international conference on strongly correlated electron systems-SCSES98, 92.
OHare, P. A. G., Hubbard, W. N., Johnson, G. K., and Settle, J. L. (1974). Thermodynamic of nuclear materials. Process Symp. Vienna 1975, 452.
Ott, H. R., Hulliger, F., Rudigier, H., and Fisk, Z. (1985). Superconductivity in uranium compounds with Cu3Au structure. Phys. Rev. B 31, 1329–1333. doi:10.1103/physrevb.31.1329
Otto, R., and Kister, A. T. (1948). Algebraic representation of thermodynamic properties and the classification of solutions. Industrial Eng. Chem. 40 (2), 345–348. doi:10.1021/ie50458a036
Perrut, M. (2015). Thermodynamic modeling by the calphad method and its applications to innovative materials. AerospaceLab 9, 1–11.
Pöttgen, R. (1994). Ternary rare earth metal gold stannides and indides with ordered U3Si2 and Zr3Al2-type structure. Verl. Z. für Naturforsch. 49, 1525–1530. doi:10.1515/znb-1994-1112
Remschnig, K., LeBihan, T., Noёl, H., and Rogl, P. (1992). Structural chemistry and magnetic behavior of binary uranium silicides. J. Solid State Chem. 97, 391–399. doi:10.1016/0022-4596(92)90048-Z
Sasa, Y., and Uda, M. (1976). Structure of stoichiometric USi2. J. Solid State Chem. 18, 63–68. doi:10.1016/0022-4596(76)90079-7
Schindelin, J., Arganda-Carreras, I., Frise, E., Kaynig, V., Longair, M., Pietzsch, T., et al. (2012). Fiji: an open-source platform for biological-image analysis. Nat. Methods 9, 676–682. doi:10.1038/nmeth.2019
Terrani, K. (2018). Accident tolerant fuel cladding development: promise, status, and challenges. J. Nucl. Mater. 501, 13–30. doi:10.1016/j.jnucmat.2017.12.043
Toby, B. H., and Von Dreele, R. B. (2013). GSAS-II: the genesis of a modern open-source all-purpose crystallography software package. J. Appl. Crystallogr. 46, 544–549. doi:10.1107/S0021889813003531
Ulrich, T. L. (2019). “Modeling the uranium-silicon phase equilibria based on computational and experimental analysis,” (South Carolina: University of South Carolina). (Doctoral dissertation).
Ulrich, T. L., Vogel, S. C., Lopes, D. A., Kocevski, V., White, J. T., Sooby, E. S., et al. (2020a). Phase stability of U5Si4, USi, and U2Si3 in the uranium–silicon system. J. Nucl. Mater. 540, 152353. doi:10.1016/j.jnucmat.2020.152353
Ulrich, T. L., Vogel, S. C., White, J. T., Andersson, D. A., Sooby Wood, E., and Besmann, T. M. (2020b). High temperature neutron diffraction investigation of U3Si2. Materialia 9, 100580. doi:10.1016/j.mtla.2019.100580
U.S Department of Energy (2015). Development of Light Water Reactor fuels with enhanced accident tolerance. Report to Congress.
US Nuclear Regulatory Commission (2011). Special report on the accident at the Fukushima Diiachi nuclear power station. Report No. INP0 11-005.
Vaugoyeau, H., Lombard, L., and Morlevat, J. (1972). A contribution to the study of the uranium–silicon equilibrium diagram. Report No. AECL-4151.
Vooght, D.De., Verniers, G., and Meester, P.De. (1973). Counter-diffractometer parameter determination of polycrystalline U3Si. J. Nucl. Mater. 46, 303–308. doi:10.1016/0022-3115(73)90045-7
Wang, J., Wang, K., Chunhua, M., and Xie, L. (2016). Critical Evaluation and thermodynamic optimization of the (U+Bi), (U+Si) and (U+Sn) binary systems. J. Chem. Thermodyn. 92, 158–167. doi:10.1016/j.jct.2015.08.029
Westinghouse (2023). Westinghouse’s Encore fuel inserted in Exelon generation’s Byron unit 2. Available at: http://www.westinghousenuclear.com/uknuclear/about/news/view/westinghouse-s-encore-fuel-inserted-in-exelon-generation-s-byron-unit-2.
White, J. T., Nelson, A. T., Byler, D. D., Valdez, J. A., and McClellan, K. J. (2014). Thermophysical properties of U3Si to 1150 K. J. Nucl. Mater. 452, 304–310. doi:10.1016/j.jnucmat.2014.05.037
White, J. T., Nelson, A. T., Dunwoody, J. T., Byler, D. D., and McClellan, K. J. (2016). Thermophysical properties of USi to 1673 K. J. Nucl. Mater. 471, 129–135. doi:10.1016/j.jnucmat.2016.01.013
White, J. T., Nelson, A. T., Dunwoody, J. T., Byler, D. D., Safarik, D. J., and McClellan, K. J. (2015). Thermophysical properties of U3Si2 to 1773 K. J. Nucl. Mater. 464, 275–280. doi:10.1016/j.jnucmat.2015.04.031
White, J. T., Travis, A. W., Dunwoody, J. T., and Nelson, A. T. (2017). Fabrication and thermophysical property characterization of UN/U3Si2 composite fuel forms. J. Nucl. Mater. 495, 463–474. doi:10.1016/j.jnucmat.2017.08.041
Wilson, T. L., Moore, E. E., Lopes, D. A., KocevskiSooby Wood, V. E., White, J. T., Nelson, A. T., et al. (2018). Uranium nitride-silicide advanced nuclear fuel: higher efficiency and greater safety. Adv. Appl. Ceram. 117, S76–S81. doi:10.1080/17436753.2018.1521607
World Nuclear News (2019). US begins first commercial testing of silicide fuel. Available at: http://world-nuclear-news.org/Articles/US-begins-first-commercial-testing-of-silicide-fuel.
Zachariasen, W. H. (1949). Crystal chemical studies of the 5f-series of elements. VIII. Crystal structure studies of uranium silicides and of CeSi2, NpSi2, and PuSi2. Acta Crystallogr. 2, 94–99. doi:10.1107/s0365110x49000217
Keywords: uranium silicides, phase diagram, CALPHAD, nuclear fuel, U3Si2, U3Si5
Citation: Ulrich TL and Besmann TM (2024) Phase equilibria of advanced technology uranium silicide-based nuclear fuel. Front. Nucl. Eng. 2:1340426. doi: 10.3389/fnuen.2023.1340426
Received: 17 November 2023; Accepted: 28 December 2023;
Published: 22 January 2024.
Edited by:
Tonya Vitova, Karlsruhe Institute of Technology (KIT), GermanyReviewed by:
Charles M. Folden, Texas A&M University, United StatesCopyright © 2024 Ulrich and Besmann. This is an open-access article distributed under the terms of the Creative Commons Attribution License (CC BY). The use, distribution or reproduction in other forums is permitted, provided the original author(s) and the copyright owner(s) are credited and that the original publication in this journal is cited, in accordance with accepted academic practice. No use, distribution or reproduction is permitted which does not comply with these terms.
*Correspondence: Tashiema L. Ulrich, dWxyaWNodGxAb3JubC5nb3Y=
†Present address:
Tashiema L. Ulrich, Nuclear Energy and Fuel Cycle Division, Nuclear Fuel Development Section, Nuclear Fuel Performance Group, Oak Ridge National Laboratory, Oak Ridge, TN, United States
Disclaimer: All claims expressed in this article are solely those of the authors and do not necessarily represent those of their affiliated organizations, or those of the publisher, the editors and the reviewers. Any product that may be evaluated in this article or claim that may be made by its manufacturer is not guaranteed or endorsed by the publisher.
Research integrity at Frontiers
Learn more about the work of our research integrity team to safeguard the quality of each article we publish.