 Jordan Stone
 Mira Khair
 Steven Cavazos
 Elizabeth Sooby
94% of researchers rate our articles as excellent or good
Learn more about the work of our research integrity team to safeguard the quality of each article we publish.
Find out more
ORIGINAL RESEARCH article
Front. Nucl. Eng. , 12 January 2024
Sec. Nuclear Materials
Volume 2 - 2023 | https://doi.org/10.3389/fnuen.2023.1322209
This article is part of the Research Topic Women in Nuclear Engineering Research View all 15 articles
The advancement of nuclear energy technology necessitates the development of novel materials and synthesis methods to produce materials which enable new fuel cycles. Alongside the maturation of R&D scale technologies to produce these materials, there is an ongoing effort to develop in situ monitoring capabilities to reduce the time to the discovery and development of these fuels. Monitoring data can be leveraged in artificial intelligence platforms to detect phenomena which lead to varied macro- and microstructural features which impact the application and performance of samples synthesized. The present study presents early-stage findings of the implementation of high-temperature, high-frame-rate infrared thermal imaging to monitor the arc-melt synthesis of novel fuels and compounds relevant to advanced nuclear reactors. The study illustrates both the challenges and opportunities of this methodology, highlighting the importance of internal standards while determining emissivity and transmission values as well as visualizing volatilization during melt synthesis.
Researchers across the globe are advancing clean energy solutions (nuclear energy, renewables, and energy storage materials) with the goal of reducing our carbon footprint. The advancement of nuclear energy technologies, such as the introduction of novel fuels and reactor types, and manufacturing capabilities are at the forefront of these efforts. The present investigation provides early-stage findings in a study to assess the feasibility of high-temperature thermal imaging to inform the melt synthesis of compounds and alloys in situ. The investigators argue that the development of this novel methodology will enable a capability to shorten the time to material discovery by visualizing the melt and solidification phenomena of high-temperature compounds during synthesis. In situ monitoring coupled with computer vision methods (a sub-field of artificial intelligence) will allow researchers to identify melt phenomena and then predict sample homogeneity following fabrication. This effort aims to shortcut the characterization time which traditionally involves labor- and time-intensive sample preparation for diffraction and electron microscopy characterization. Furthermore, the identification of high-temperature phase formation, segregation, solid-state phase transitions, and volatility are critical for thermodynamic modeling of these fuel-cycle material systems, where structure and property data remain scarce. Pairing melting and solidification behavior observations with post-melt characterization will facilitate the discovery of high-temperature crystalline phases not observed in conventional alloy development without extensive post-synthesis microstructural characterization. The methods developed in this study are readily applicable to other melt synthesis methods, including additive manufacturing (AM) techniques used for conventional structural materials.
Research into actinide compound synthesis presents several challenges, including but not limited to safe handling of radiological materials, pyrophoricity, sourcing high-purity precursors, and a general lack of well-defined thermodynamic and thermochemical information. While oxide compounds have seen historic interest due to their application and relevance to civilian nuclear power systems, intermetallic compounds and alloys have been far less investigated. Uranium binary and ternary compounds present a wide range of melt temperatures and thermal properties, and additionally have complex melt and nucleation phenomena, leading to several unexplored material systems for testing the methods developed here (Sooby Wood et al., 2016; Sooby Wood et al., 2017; Lopes et al., 2019; Sooby Wo et al., 2020; Wilson et al., 2020; Gonzales et al., 2021; Watkins et al., 2021; Moczygemba et al., 2022). Furthermore, there are several inconsistencies among experimentally observed phase structures and thermodynamically predicted phase diagrams (Sooby Wood et al., 2017; Moczygemba et al., 2022). These discrepancies provide a material testbed with ample material systems which can meaningfully contribute to the current state of knowledge while concurrently developing a capability applicable to a broader array of material systems.
There does not exist a formal methodology in a research and development (R&D) setting that can collect high-frame-rate thermal images of arc-melt pools during the synthesis of actinide compounds. However, thermal imaging paired with high-speed image capture has been employed to study direct energy deposition (DED) AM melt pool dynamics, as explored in Arrizubieta et al. (2017), Calta et al. (2017), Cheng et al. (2018), Heigel and Lane (2018), Wirth et al. (2018), and Mazzoleni et al. (2019). The challenges of using thermal imaging to resolve microstructural defects originating in melt dynamics include the high-speed dynamics of the melt pool (limitations of the camera frame rate) as well as the spatial resolution required for the imaging technology (Mazzoleni et al., 2019). Cheng et al. (2018) used a near-IR camera to measure melt pool dimensions as a function of build height and found little correlation between the melt pool dimensions (length and width) and the height of the build for nickel-based super alloys. The challenge they encountered was the spatial resolution of the imaging technique, as they were only able to measure the overall dimension of the melt pool rather than the dynamics within the melt pool that would cause microstructural defects. Infrared (IR) camera developers recommend using a 3 × 3 pixel grid to accurately measure the temperature of a spatially resolved feature. While conventionally manufactured materials fabricated through forging, cold-working, and/or sintering produce small crystalline grains (nm to μm sizes), arc-melting is capable of producing materials with tens to hundreds of micrometer size grains. It is argued here that, to resolve microstructural feature formation in the methods presented, each pixel must be in the order of at least 10 μm. Cheng et al. (2018) demonstrated pixel sizes of 47–80 μm, limiting the ability to detect microstructural defect-causing dynamics such as key holing or spatter. A similar pixel size limitation is clear in Wirth et al. (2018), where the melt dynamics, specifically the surface flow field, were studied spatially using a high-speed IR camera.
Mazzoleni et al. (2019) presented the spatial, temporal, and wavelength resolution criteria to observe melt pool dynamics using CMOS imaging techniques. Their analysis settled on a frame acquisition rate of 1,200 frames per second (1.2 kHz), a 4.3 × 4.3 mm field of view, and a 14 μm/pixel spatial resolution. They concluded that the near-IR range was able to provide the most information on melt pool size, and the 1.2 kHz capture frequency proved adequate for resolving the melt pool evolution. However, CMOS detectors cannot be directly calibrated to quantify temperature. At these imaging parameters, microstructural effects were still unobservable using this technology. Instead, a dynamic study of the molten region was presented (Mazzoleni et al., 2019).
These studies investigated bulk (feature size on the order of 100 μm) melt dynamics. To meet the objectives of our broader study, the research team must observe microstructural features during melt and solidification. We recognize a trade-off in the cost of the technology employed to study melt dynamics and the scale of observable phenomena. In situ X-ray imaging, employing a synchrotron X-ray source, was utilized to resolve microstructural features, including features such as depressions and pores. (Martin et al., 2019). From a process monitoring perspective, placing AM equipment (or an arc-melt furnace) in a synchrotron facility is impractical for day-to-day process monitoring, although significant information about laser-metal dynamics can be obtained. Therefore, the present study employed an IR camera capable of resolving microstructural features forming in the melt pool of an arc-melt-synthesized sample. The Broadband InSb, 1.5–5.0 µm detector was used to allow for a 1280 × 1024 pixel resolution with a 181 Hz frequency for the full frame that can be windowed to 6 kHz. The extended 1.5–5.0 µm range is necessary to observe dynamics of the melt through the fused quartz observation tube (furnace tube/window). Thermographic calibration filters included with the IR camera facilitate temperature data to be accurately acquired to 3,000°C. However, the study presented here displays the challenges, specifically emissivity and transmission, to accurate calibration, given the physical barriers necessary for the arc-melting process. Emissivity and transmission relate to the ability of the sample to emit infrared radiation. However, as demonstrated in Figure 1, two lenses are placed between the IR camera and the melted sample. A previous study has highlighted the importance of luminance maps for IR observations of arc-melting materials (Hafid El Mir et al., 2010). The protective quartz glass of the arc furnace and the UV shield are in place to prevent intense UV rays emitted from the arc-melting process—an occupational hazard.
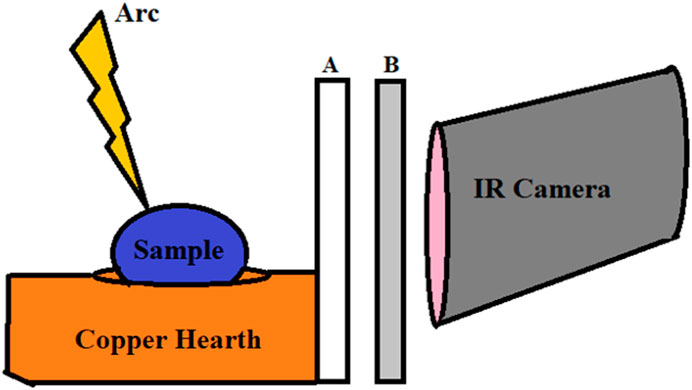
FIGURE 1. Simplified diagram of arc furnace setup with (A) the quartz glass of the arc furnace and (B) the UV protective film in front of the camera.
Presented here are the findings from three monitored melts, observing the melt behavior of titanium (Ti), palladium silicide (PdSi), and uranium mononitride (UN). These three melts display the challenges as well as the opportunities of this IR observation method. Ti is a pure metal with well-defined and well-behaved melt (minimal to no volatilization). Molten Ti is often used as an internal oxygen “getter” in arc-melt furnaces to scrub ultra-high-purity (UHP) argon (Ar) gas of trace amounts of oxygen (O2). Palladium silicides are observed in post-irradiation examination (PIE) of particle fuel forms (Tiegs, 1982; Wen et al., 2018; Liu et al., 2023) fabricated by collaborating investigators, with the authoring team observing the melt behavior through the thermal imaging camera. Lastly, uranium mononitride (UN) is an advanced reactor fuel form proposed for reactors which require high temperature stability, high uranium density, and improved thermal transport properties compared to conventional uranium dioxide (Matthews, 1993; Rogozkin et al., 2003; Jaques et al., 2008; Arai, 2012; Brown et al., 2014; Nunez et al., 2014; Jaques et al., 2015; Yang et al., 2015; Johnson et al., 2016; Ortega et al., 2016; Uygur, 2016; Wallenius et al., 2020; Sooby et al., 2021; Watkins et al., 2021). UN, unlike Ti and PdSi, has a high vapor pressure at the melt point, exhibiting volatilization during melt (Nunez et al., 2014).
A tri-arc-melting furnace (Centorr Vacuum Industries Model 5 TA) capable of achieving temperatures exceeding 3,000°C was used for the present study. The melting of conductive samples is achieved by resistively heating samples to and often beyond the melt point of the sample. Three independent power supplies provided up to 100 amps (A) of current per electrode to the sample at 8.5–12 volts (V). The current was increased until melting was observed. While samples were in the molten state, they typically exhibited a “pinwheeling” phenomenon observed through the UV shield of the melt furnace. The pinwheeling movement was created by molten material convection within a sample. In the setup described above, each electrode was at an angle to sample on the hearth. As voltage was applied, one side of the sample heated before the other, creating a gradient of heat across the surface of the sample. When liquidation occurred, this temperature gradient caused swirling of the sample, creating the illusion of a completely moving molten ingot that appears like a pin wheel. As displayed in Figure 2, the samples were placed within a cavity of the water-cooled copper hearth. The hearth and Ar atmosphere required to maintain the arc of the electrode were encased in a fused quartz (quartz glass) chamber. While an electric arc resistively heated samples to temperatures in excess of 1,000°C, the copper hearth was actively cooled to prevent fusing of the furnace structural materials. The active cooling quenched the bottom of samples once the arc was removed.
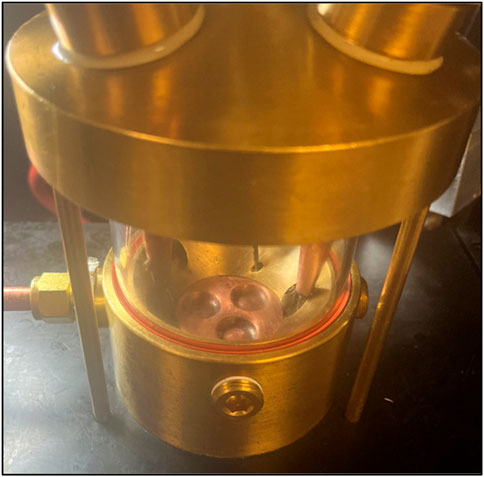
FIGURE 2. Downward angled view into the inside of the arc-melter holding chamber: a dimpled copper hearth can be seen below brass fittings which is incased in the fused quartz glass chamber.
An IR camera (FLIR X8580) was employed to monitor the melt of each sample presented here. Thermal imaging with FLIR X8580 combined a high-definition resolution of 1280 × 1024 pixels with fast frame rates and integration times to allow the recording of fast-moving subjects or, in this case, features such as rapid temperature changes, phase segregation, and cracking. The FLIR X8580 and arc furnace assembly is shown in Figure 3A.
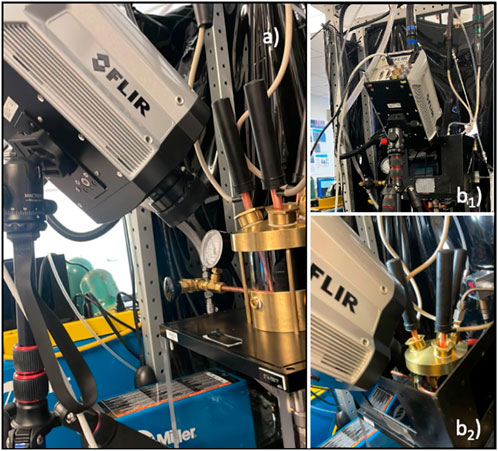
FIGURE 3. (A) Arc-melt furnace and IR camera assembly without UV shielding. (B1-2) Arc-melt furnace and IR camera assembly with UV shielding for researcher safety only; no IR images were taken looking through UV shielding.
The camera and the data collection were controlled using a desktop PC and commercially available software known as FLIR Research Studio. Multiple parameters were considered when using it: distance from the object of observation (in this case, the wall of the quartz chamber), the atmospheric temperature, emissivity, reflected temperature, and relative humidity. In addition, the setup described above contained a fused quartz chamber acting as an external optical lens (EOL), leading to the inclusion of additional parameters of EOL transmission and EOL temperature. To maintain the consistency of results, each of these parameters was evaluated:
1. Distance from the object of observation. The camera was positioned at a fixed distance of 12 cm (0.12 m) from the wall of the fused quartz chamber to the lens of the camera during Ti and PdSi investigation. Recent techniques were developed to reduce this distance to 7 cm (0.07 m) from the wall of the chamber to the lens, which was employed in dU (depleted uranium) refinement and UN synthesis. This value represented the minimum allowable distance in our IR measurement to minimize potential interference. During refinement and compound synthesis, samples were displaced from their initial position inside the chamber. Future research will include a factor for this change in position during IR data collection. To create a consistent observation methodology, physical lines were placed on the camera tripod to ensure that the setup was assembled so that the camera would be brought to the proper height to ensure a view into the chamber prior to filming. Prior to each filming, the space between the quartz chamber wall and camera was reconfirmed with the values stated above.
2. Atmospheric temperature and relative humidity. The ambient temperature of the system was taken from the room’s temperature using a handheld probe (Omega HH802U). The measured temperature was then compared to the ambient temperature of the quartz glass chamber prior melting to establish temperature equilibrium before inducing temperature change via arc heating. Due to the inability to measure humidity in the room of observation, relative humidity measurements were taken from local weather reports and evaluated for accuracy against the relative standard humidity ranges of 30%–50% for ideal indoor humidity from the United States Environmental Protection Agency (US EPA, 2023). High outdoor humidity rates were then correlated to high indoor humidity rates within this range.
3. Emissivity. The emissivity of an object at room temperature ranges from a reflector, emissivity = 0, to a blackbody or absorber, emissivity = 1 (Claudson, 1958; FPI, 2023). At room temperature, approximately 25°C, most objects have a relative emissivity range of 0.9–1. Thus, an emissivity of 0.95 was employed while positioning the camera and for recordings at room temperature. However, emissivity changes inversely as the temperature of a material increases (Baker et al., 1963). Emissivity data are limited for nuclear materials, like UN, due to the recent development of UN for use as a nuclear fuel in experimental reactors. Therefore, inferred ranges of emissivity were taken from the emissive properties of pure uranium to compare temperature ranges. In addition, oxidation can tarnish a surface, causing the reflectivity to decrease and, in turn, affecting the emissivity of the surface. To prevent oxidation during the melt process, the crystal chamber of the furnace was flushed with high-purity argon gas until the oxygen content of the chamber reached a magnitude of
4. Reflected temperature. The metal components which comprise the arc-melting assembly are reflective, polished metals (Figure 2). When ignited with an arc, the IR radiation transmits in an isotropic manner around a sample. These rays reflect off the metallic surface of the chamber, leading to inference by rays encountering the camera lens. This inference can misrepresent the temperature of the sample, leading to a data error. A thermal image of the setup was taken at room temperature using frame image subtraction to prevent reflections caused by lighting and human manipulation of the arc-melting setup. The room temperature reading is discussed further in comparison to molten uranium and UN synthesis in the results. To decrease the number of reflections during refinement, a second thermal image was taken once the sample melted. This subtraction displayed changes to the sample once melt was reached.
5. External optic properties of fused quartz. Research conducted on fused quartz (fused silica and quartz glass) has shown it to have a transmission rate of approximately 0.94 for the IR wavelength range of 700–1,000 nm (Nürnberg et al., 2016). The temperature of the EOL was measured during the refinement of the uranium and UN synthesis process using a handheld thermometer (Omega HH802U) when the sample was observed to have melted and was re-measured for each respective trial.
Titanium was sourced commercially (Thermo Scientific Chemicals, 99.99% metal basis purity, 12.7 mm rod form), and samples were segmented from this rod stock using electronic discharge machining (EDM). Minimal preparation is required for this type of sample, although EDM residue was removed via grinding with SiC paper and cleaned thoroughly prior to melting using methanol and acetone.
Stoichiometric PdSi was of interest due to its stable high-temperature phase between ∼820–890
UN synthesis was used in this study to highlight an opportunity of this method: observing volatilization during melt synthesis. Synthesis of UN in an arc-melt furnace is novel, as are the resulting microstructures, and the detailed experimental procedure as well as resulting microstructural and compositional analysis will be presented in a subsequent publication by the investigative team. The sample observed in the present study was prepared by segmenting ∼0.25 g of depleted uranium (dU) from metal feedstock received from Idaho National Laboratory. Since the compounding with nitrogen occurred in a liquid–gas phase interaction, the polished, cleaned uranium metal was the only precursor material placed in the furnace. No internal getter was used in the synthesis of UN due to the nitridization of all available common internal, oxygen-gettering metals. The chamber was subsequently purged using UHP Ar, purified by an external getter assembly comprised of a jeweler’s furnace (ProCast, PMC supplies) containing a Zr getter sponge held at 600°C. Once an oxygen level of
After precisely 60 s, a calculated introduction of 2 LPM of N2 gas occurred (purified of trace O2 using a separate jeweler’s furnace, SG-RRL, ToAuto, with an internal Cu getter), coinciding with an increase in current to 89 A. This step led to the formation of a distinct solid phase. Subsequently, the flow of N2 was terminated, allowing the metal to undergo a pinwheeling motion. N2 gas was then introduced into the chamber along with argon at a pressure of 2 psi for a duration of 1 min, with an arc of 89 A. Afterward, both the argon and nitrogen were arrested, and the system was allowed to cool to room temperature before removing the sample.
The earliest experimental efforts of this work were conducted on Ti. The experiments were conducted on heritage samples used by the investigators, typically as oxygen scrubbing materials commonly referred to as “getters.” Ti is a common getter employed in the arc-melt synthesis of oxygen-sensitive materials, and thereby is often co-located in the furnace chamber with the actinide or nuclear materials of interest and provides an additional thermal signature during fabrication. A Ti getter was placed in the hearth and brought to melt temperature, reportedly at 1,660°C. Since the getter experienced a phase change (solid to liquid), the temperature of the sample plateaued at 1,660°C, allowing a temperature that could be used to calibrate the IR camera. Figure 4A highlights an uncalibrated measurement of temperatures across the getter with a low temperature range between 31°C and 61°C. Although the calibration is inaccurate, the dramatic change in temperature from the top and bottom of the sample aligns with a reading consistent with a cooled hearth and heated electrode.
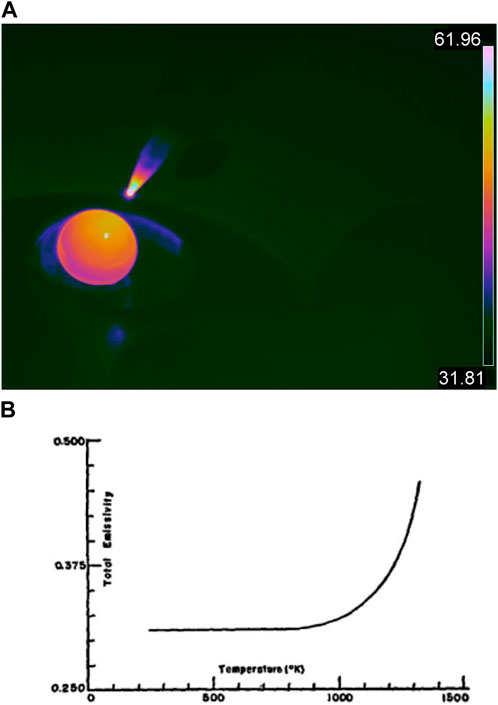
FIGURE 4. (A) Uncalibrated radiometric image of a Ti getter at a liquid state inside an arc furnace, taken with an IR camera, with a temperature range of 31.81°C–61.81°C, showcasing a temperature range that is not reflective of the real temperatures of the surfaces depicted. (B) Michels and Wilford’s plot of Ti total emissivity vs. temperature (Michels and Wilford, 1949).
Although the emissivity of Ti at 1,660°C has been thoroughly researched, Michels and Wilford (1949) showed that the total emissivity of Ti increases exponentially as heat is applied (Figure 4B). Therefore, it can be implied that the emissivity of Ti at 1,660°C is 0.35. The transmittance rate of quartz glass is 90%, and the transmittance rate of a standard UV shield is 49.1%. This allows for a total transmittance rate of 44.91%. In Figure 5A, the calibrated image of the calibration run shows the temperature range of the sample as 45°C–89°C, with the highest temperature of the getter measured at 78.7°C. This value is then corrected using an offset of 1,581.3°C applied to the image (Figure 5C).
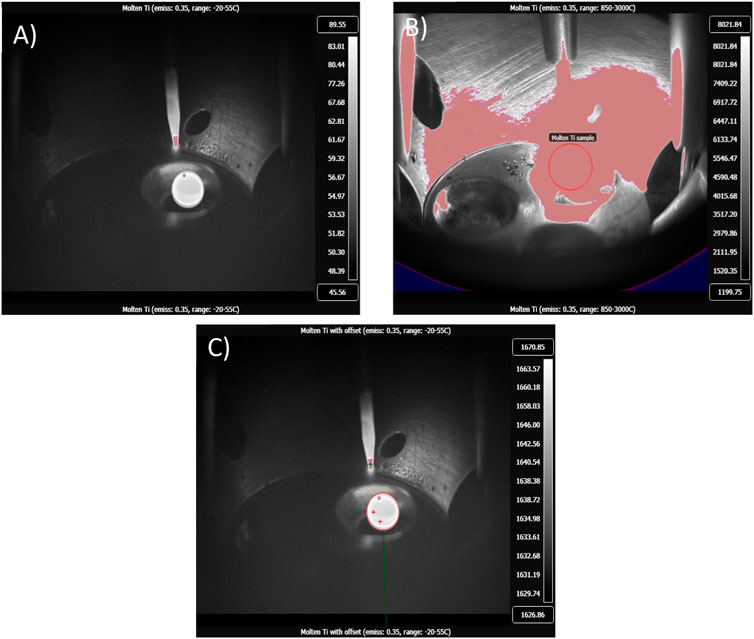
FIGURE 5. (A) Calibrated radiometric image of molten Ti getter with a temperature range of 45.56°C–89.55°C taken in the low-range calibration filter: –20°C to 50°C. (B) Calibrated radiometric image of molten Ti with a temperature range of 1,199.75°C–8,021.84°C, taken in the high-range filter: 850°C–3,000°C. A shroud can be seen covering the sample, making it undefinable; therefore, the low range is commonly used to showcase sample position within the chamber during arc-melting. (C) Calibrated radiometric image of melted Ti getter with an offset of 1,604°C and a temperature range of 1,626.86°C–1,670.85°C.
PdSi has a melt temperature of 897°C (Zhenmin Du et al., 2006). When the melt stage of both the Ti getter and PdSi sample was visually checked, the IR camera was set up as in Figure 3B and the UV shield lifted. As shown in Figure 6A, without an offset applied there is an observable difference in temperature between the PdSi sample and the Ti getter. However, the theoretical difference between the two melted materials is greater than the difference between the samples displayed. Therefore, the offset, as shown in Figure 6B, is also inaccurate. Another notable observation for Figure 6A is the increased temperature range of 267°C–328°C. The offset was also recalculated to accommodate the lack of UV shield. With the primary reading of the Ti getter as 300°C, the offset was set to 1,330°C.
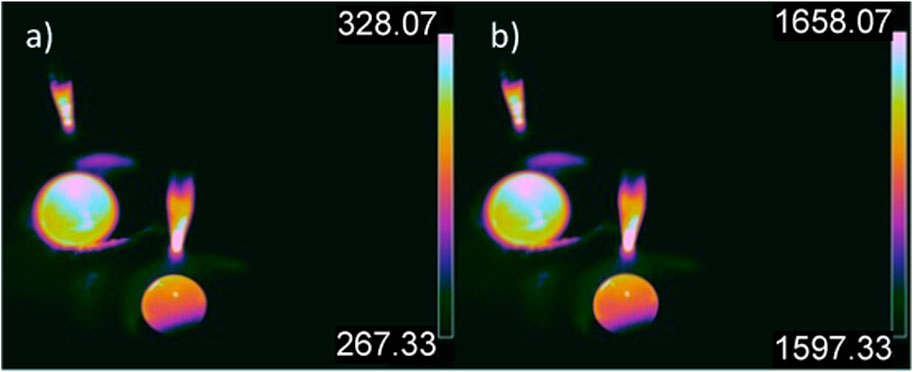
FIGURE 6. (A) Calibrated radiometric image of molten Ti (in the background) and PdSi (in the foreground) ingots inside an arc furnace with a temperature range of 328.07°C–328.07°C, no offset applied. (B) Calibrated radiometric image of Ti getter and PdSi ingots with a temperature range of 1,597°C–1,658°C.
Unlike in the PdSi experiment, an internal getter cannot be used to synthesize UN as Ti, and several other conventional gettering materials like Zr will nitride and react during the synthesis experiment. Therefore, there is no internal IR standard to be used as a correction factor. The pure metallic uranium sample is melted alone in the furnace, and IR data are collected on the sample, furnace, and electrodes. Stills recorded during the melt process using the IR camera are presented in Figure 8. Figure 8A presents the thermal image of a cooling arc-melt chamber post uranium refinement, allowing a view of the inside of the hearth; an emissivity of 0.3 is employed for the clarity of the reader. Figure 8B provides an image of the observed molten dU during refinement with a thermal range of 1,098.34°C–6,438.61°C. Furthermore, Figure 8C provides a thermal image of observed molten dU during refinement with a data subtraction of the room temperature hearth overlaid; a thermal range of 1,070.34°C–6,439.17°C is displayed. While the lower end of the temperature range displayed some decrease, the upper end remained significantly higher than what was experimentally possible. Finally, Figure 8D presents the thermal image of observed dU in the molten state with a data subtraction of the molten dU— furnace setup to highlight reflections and operator movement—a thermal range of −453.58°C to 1,453.20°C. Although this final high temperature range is more representative of the process, the low temperature range is unphysical, and therefore the true temperature range is not captured, as with the PdSi melt. What is not considered in the approximations of the actual melt temperature are the reaction energies during UN formation, which would result in higher temperatures than what is characteristic of molten U and UN. While the temperature calibration failed to capture the true temperature of the melt, what was observed was a continuous, high temperature phenomenon that extended from the sample to the electrode. The authors argue that this is the visualization of volatilization in the chamber. Volatilization is confirmed in the mass measurement following the experiment where the sample lost approximately half of its mass.
It is important to mention that, due to limited visibility within the furnace chamber during the operation of the heating system, one could only observe a small, confined area measuring just a few square centimeters through a small window (Figure 3B). In addition, it must be noted that UN volatilizes at high temperatures. This volatilization surrounds the sample, depositing material on the hearth as well as the electrode due to the decomposition of UN to U and 1/2N2 (g). In the present study, up to 70% of the original uranium sample was lost in some cases. The decomposition reaction was described in Olson and Mulford (1963). This brilliant light source not only reflects within the metal and gas melt chamber but also off the reflective U/UN sample. As current is increased in the chamber, there is an increase in the intensity of light emitted. Therefore, when melting occurs, reflections form on the hearth’s metallic chamber (Figures 8B–D, highlighted in red). The light and reflections interfere with IR data collection by flooding the chamber with light and a creating false reading on actively cooled surfaces. Future research aims to limit the field of view to decrease emissivity interference caused by the electrode during synthesis and reflections.
X-ray diffraction (XRD) and scanning electron microscopy (SEM) analyses revealed the creation of a UN sample characterized by a dendritic microstructure with islands of α-uranium (Figure 7). The camera successfully captured the entire process of melting uranium and the subsequent diffusion of nitrogen into the sample. The recorded temperature reached approximately 4,000°C, a value significantly distant from the actual melting point of UN. Several factors, including the camera’s distance from the sample inside of the furnace, considerations such as the glass’s transmission rates, and the emissivity properties of UN, should be addressed to enhance temperature accuracy detection. Importantly, as shown in Figures 5, 8, a shroud can be observed forming over a heated sample. This phenomenon is observed in both volatile, UN, and non-volatile samples, PdSi, and Ti. It must also be noted that the shroud can change in size when the temperature range is changed, as demonstrated in Figures 4A, B. To decrease shroud size, further research on volatizing vs. non-volatizing samples must be done in both the low and high temperature range to fully understand the factors affecting shroud size and shape inside the arc furnace environment.
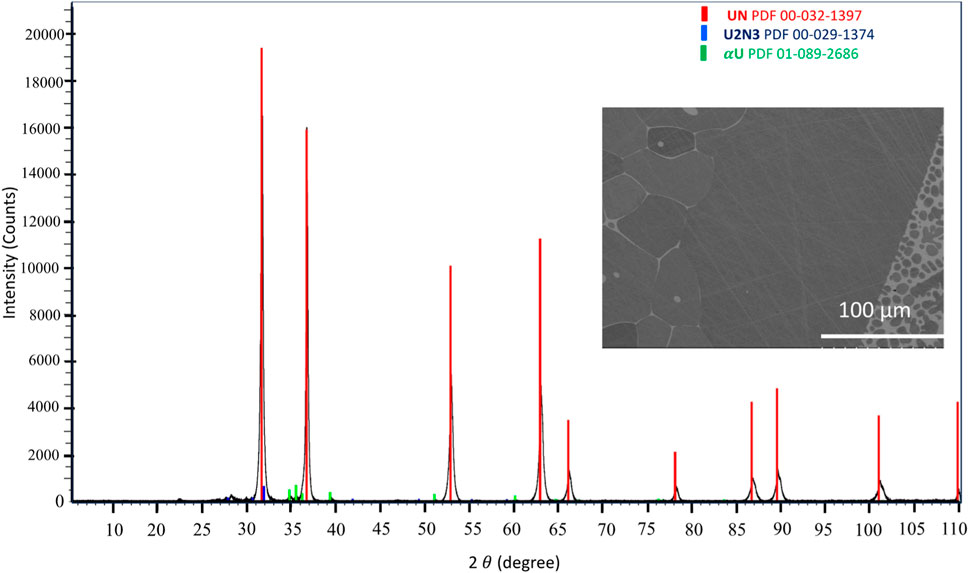
FIGURE 7. X-ray diffraction pattern and SEM micrograph displaying a largely UN sample with some segregated α-U (lighter phase in SEM micrograph) following the melt synthesis.
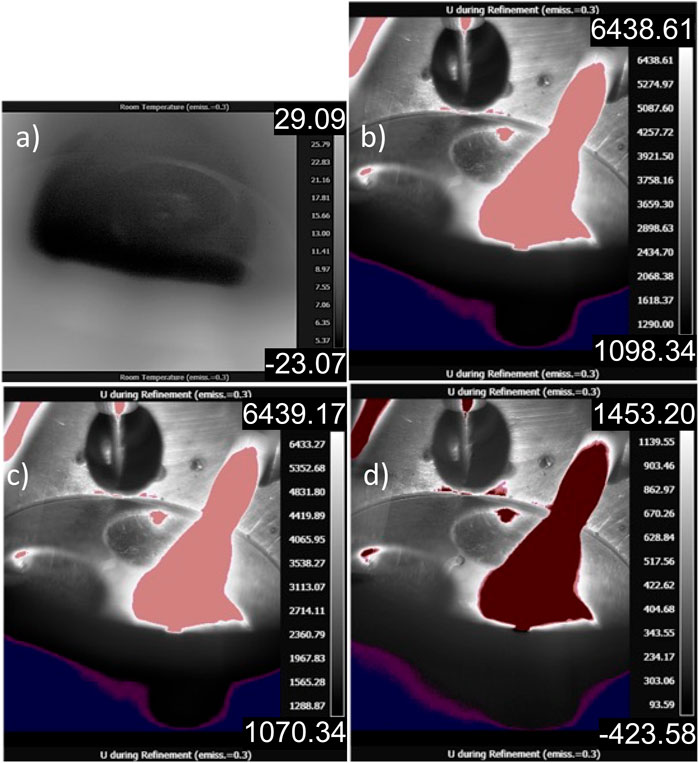
FIGURE 8. (A) Thermal image of a cooling arc-melting chamber post-refinement, allowing a view of the inside of the hearth (emissivity of 0.3 is employed for the clarity of the reader). (B) Thermal image of observed molten dU during refinement with a thermal range of 1,098.34°C–6,438.61°C. (C) Thermal image of observed molten of dU during refinement with a data subtraction of the room temperature hearth overlaid, thermal range of 1,070.34°C–6,439.17°C displayed. (D) Thermal image of observed dU in the molten state with a data subtraction of the molten dU—arc furnace assembly to highlight reflections and operator movement, with a thermal range of −453.58°C to 1,453.20°C.
The present study demonstrates the challenges and opportunities to thermal imaging during melt synthesis of novel materials of relevance to advanced nuclear reactor fuels. The melt of pure Ti demonstrates that a linear offset can be applied to correct IR readings to produce near-accurate thermal data for molten samples. While both melts of PdSi and UN produced the targeted compounds with some U segregation for UN alongside some U2N3, challenges to determining emissivity and transmission values and the inaccuracy of calibration filters provided by the camera manufacturer produces inaccurate melt readings. Further complications are presented by reflections within the melt furnace. It must be noted that, due to these reflections and continued research into calibration methods, temperature ranges seen in IR images showcase ongoing efforts to increase the accuracy of IR filmography within arc furnace environments in real time. In future research, nonlinear offsets as well as smaller fields of view will be applied to enhance the accuracy and utility of this approach.
The original contributions presented in the study are included in the article/Supplementary Material; further inquiries can be directed to the corresponding author.
JS: data curation, formal analysis, investigation, methodology, writing–original draft, and writing–review and editing. MK: data curation, formal analysis, investigation, methodology, writing–original draft, and writing–review and editing. SC: investigation and writing–review and editing. ES: conceptualization, funding acquisition, investigation, methodology, project administration, resources, supervision, validation, writing–original draft, and writing–review and editing.
The author(s) declare that financial support was received for the research, authorship, and/or publication of this article. This material is based upon work supported by the US Department of Energy, Office of Science, Office of Basic Energy Sciences, under the Synthesis and Processing Science Early Career Award “Integration of in situ Monitoring and Artificial Intelligence in the Synthesis of Uranium Alloys and Compounds to inform Performance Following Melt Fabrication Processes,” Award Number DE-SC0022882. Further support for the fabrication of UN was provided by DOE-Office of Science, Basic Energy Science, Energy Frontiers of Research Center, entitled “Thermal Energy Transport Under Irradiation (TETI).” Lastly, PdSi fabrication was partially funded by a US Department of Energy Integrated Research Project (20-22094) entitled “Multi-physics fuel performance modeling of TRISO-bearing fuel in advanced reactor environments” under Award Number DE-NE0008998.
The authors declare that the research was conducted in the absence of any commercial or financial relationships that could be construed as a potential conflict of interest.
All claims expressed in this article are solely those of the authors and do not necessarily represent those of their affiliated organizations, or those of the publisher, the editors, and the reviewers. Any product that may be evaluated in this article, or claim that may be made by its manufacturer, is not guaranteed or endorsed by the publisher.
This report was prepared as an account of work sponsored by an agency of the United States government. Neither the United States government nor any agency thereof, nor any of their employees, makes any warranty, express or implied, or assumes any legal liability or responsibility for the accuracy, completeness, or usefulness of any information, apparatus, product, or process disclosed, or represents that its use would not infringe privately owned rights. Reference herein to any specific commercial product, process, or service by trade name, trademark, manufacturer, or otherwise does not necessarily constitute or imply its endorsement, recommendation, or favoring by the United States government or any agency thereof. The views and opinions of authors expressed herein do not necessarily state or reflect those of the United States government or any agency thereof.
Arai, Y. (2012). 3.02 - nitride fuel A2 - konings, rudy J.M, comprehensive nuclear materials. Oxford: Elsevier, 41–54.
Arrizubieta, J. I., Lamikiz, A., Klocke, F., Martínez, S., Arntz, K., and Ukar, E. (2017). Evaluation of the relevance of melt pool dynamics in Laser Material Deposition process modeling. Int. J. Heat Mass Transf. 115, 80–91. doi:10.1016/j.ijheatmasstransfer.2017.07.011
Baker, L., Mouradian, E., and Bingle, J. (1963). Determinations of the total emissivity of polished and oxidized uranium surfaces. Nucl. Sci. Eng. 15 (2), 218–220. doi:10.13182/nse63-a26423
Blumenthal, B. (1960). The transformation temperatures of high-purity uranium. J. Nucl. Mater. 2 (1), 23–30. doi:10.1016/0022-3115(60)90020-9
Brown, N. R., Aronson, A., Todosow, M., Brito, R., and McClellan, K. J. (2014). Neutronic performance of uranium nitride composite fuels in a PWR. Nucl. Eng. Des. 275, 393–407. doi:10.1016/j.nucengdes.2014.04.040
Calta, N. P., Guss, G., Wu, S., Ly, S., Deane, D., Crumb, M. F., et al. (2017). “High speed hyperspectral thermal imaging of the melt pool dynamics during metal additive manufacturing,” in 2017 Conference on Lasers and Electro-Optics (CLEO), San Jose, CA, USA, 14-19 May 2017 (IEEE), 1–2.
Cheng, B., Lydon, J., Cooper, K., Cole, V., Northrop, P., and Chou, K. (2018). Infrared thermal imaging for melt pool analysis in SLM: a feasibility investigation. Virtual Phys. Prototyp. 13 (1), 8–13. doi:10.1080/17452759.2017.1392685
Claudson, T. T. (1958). Emissivity data for uranium dioxide. Master of Science (Oregon: Oregon State University).
FPI (2023). Emissivity - metals, infrared technology: emissivity - metals. Fluke Process Instruments. Available at: https://www.flukeprocessinstruments.com/en-us/service-and-support/knowledge-center/infrared-technology/emissivity-metals.
Gonzales, A., Watkins, J. K., Wagner, A. R., Jaques, B. J., and Sooby, E. S. (2021). Challenges and opportunities to alloyed and composite fuel architectures to mitigate high uranium density fuel oxidation: uranium silicide. J. Nucl. Mater. 533, 153026. doi:10.1016/j.jnucmat.2021.153026
Hafid El Mir, A. J., Bellot, J.-P., Chapelle, P., Lasalmonie, D., Jean, S., and Senevat, J. (2010). Thermal behaviour of the consumable electrode in the vacuum arc remelting process. J. Mater. Process. Technol. 210 (3), 564–572. doi:10.1016/j.jmatprotec.2009.11.008
Heigel, J. C., and Lane, B. M. (2018). Measurement of the melt pool length during single scan tracks in a commercial laser powder bed fusion process. J. Manuf. Sci. Eng. 140 (5). doi:10.1115/1.4037571
Hole, W., and Wright, R. (1939). Emissive and thermionic characteristics of uranium. Phys. Rev. 56 (8), 785–787. doi:10.1103/physrev.56.785
Jaques, B. J., Marx, B. M., Hamdy, A. S., and Butt, D. P. (2008). Synthesis of uranium nitride by a mechanically induced gas-solid reaction. J. Nucl. Mater. 381 (3), 309–311. doi:10.1016/j.jnucmat.2008.07.043
Jaques, B. J., Watkins, J., Croteau, J. R., Alanko, G. A., Tyburska-Pueschel, B., Meyer, M., et al. (2015). Synthesis and sintering of UN-UO2 fuel composites. J. Nucl. Mater. 466, 745–754. doi:10.1016/j.jnucmat.2015.06.029
Johnson, K. D., Wallenius, J., Jolkkonen, M., and Claisse, A. (2016). Spark plasma sintering and porosity studies of uranium nitride. J. Nucl. Mater. 473, 13–17. doi:10.1016/j.jnucmat.2016.01.037
Liu, H., Chen, Y., Gao, Z., Rohbeck, N., and Xiao, P. (2023). A study of reaction between palladium, palladium silver alloy and silicon carbide ceramics at high temperature. J. Eur. Ceram. Soc. 43 (8), 3077–3089. doi:10.1016/j.jeurceramsoc.2023.02.032
Lopes, D., Wilson, T., Kocevski, V., Moore, E., Besmann, T., Wood, E. S., et al. (2019). Experimental and computational assessment of USiN ternary phases. J. Nucl. Mater. 516, 194–201. doi:10.1016/j.jnucmat.2019.01.008
Martin, A. A., Calta, N. P., Hammons, J. A., Khairallah, S. A., Nielsen, M. H., Shuttlesworth, R. M., et al. (2019). Ultrafast dynamics of laser-metal interactions in additive manufacturing alloys captured by in situ X-ray imaging. Mater. Today Adv. 1, 100002. doi:10.1016/j.mtadv.2019.01.001
Matthews, R. B. (1993). Irradiation performance of nitride fuels. NM (United States): Los Alamos National Lab.
Mazzoleni, L., Demir, A. G., Caprio, L., Pacher, M., and Previtali, B. (2019). Real-time observation of melt pool in selective laser melting: spatial, temporal, and wavelength resolution criteria. IEEE Trans. Instrum. Meas. 69 (4), 1179–1190. doi:10.1109/tim.2019.2912236
Michels, W. C., and Wilford, S. (1949). The physical properties of titanium. I. Emissivity and resistivity of the commercial metal. J. Appl. Phys. 20 (12), 1223–1226. doi:10.1063/1.1698312
Moczygemba, C., George, J., Montoya, E., Kim, E., Robles, G., and Sooby, E. (2022). Structure characterization and steam oxidation performance of U3Si2 with Zr alloying additions. J. Nucl. Mater. 570, 153951. doi:10.1016/j.jnucmat.2022.153951
Nunez, U. C., Prieur, D., Bohler, R., and Manara, D. (2014). Melting point determination of uranium nitride and uranium plutonium nitride: a laser heating study. J. Nucl. Mater. 449 (1-3), 1–8. doi:10.1016/j.jnucmat.2014.02.021
Nürnberg, F., Kühn, B., and Rollmann, K. (2016). “Metrology of fused silica, laser-induced damage in optical materials 2016,” in Laser-Induced Damage in Optical Materials 2016, Boulder, Colorado, United States, 06 December, 2016 (SPIE), 42–54.
Olson, W., and Mulford, R. (1963). The decomposition pressure and melting point of uranium mononitride1. J. Phys. Chem. 67 (4), 952–954. doi:10.1021/j100798a525
Ortega, L. H., Blamer, B. J., Evans, J. A., and McDeavitt, S. M. (2016). Development of an accident-tolerant fuel composite from uranium mononitride (UN) and uranium sesquisilicide (U3Si2) with increased uranium loading. J. Nucl. Mater. 471, 116–121. doi:10.1016/j.jnucmat.2016.01.014
Rogozkin, B., Stepennova, N., and Proshkin, A. (2003). Mononitride fuel for fast reactors. At. Energy 95 (3), 624–636. doi:10.1023/b:aten.0000007886.86817.32
Sooby, E. S., Brigham, B. A., Robles, G., White, J. T., Paisner, S. W., Kardoulaki, E., et al. (2021). Steam oxidation of uranium mononitride in pure and reducing steam atmospheres to 1200 °C. J. Nucl. Mater. 560, 153487. doi:10.1016/j.jnucmat.2021.153487
Sooby Wood, E., Moczygemba, C., Robles, G., Brigham, B., Grote, C. J., Metzger, K., et al. (2020). High temperature steam oxidation dynamics of U3Si2 with alloying additions: Al, Cr, and Y. J. Nucl. Mater. 533, 152072. doi:10.1016/j.jnucmat.2020.152072
Sooby Wood, E., White, J. T., and Nelson, A. T. (2016). “The synthesis and air oxidation behavior of U-Si-Al and U-Si-B compositions,” in TopFuel2016 (North Kensington Avenue, La Grange Park, IL: Transactions of the American Nuclear Society).
Sooby Wood, E., White, J. T., and Nelson, A. T. (2017). The effect of aluminum additions on the oxidation resistance of U3Si2. J. Nucl. Mater. 489, 84–90. doi:10.1016/j.jnucmat.2017.02.045
Tiegs, T. (1982). Fission product Pd-SiC interaction in irradiated coated-particle fuels. Nucl. Technol. 57 (3), 389–398. doi:10.13182/nt82-a26305
US EPA (2023). Why and where mold grows. United States: United States Environmental Protection Agency.
Uygur, S. (2016). Degradation mechanisms of UN and UN–10U3Si2 pellets of varying microstructure by comparative steam oxidation experiments. Stockholm: TRITA-FYS, 48.
Wallenius, J. (2020). “Nitride fuels,” in Comprehensive nuclear materials. Editors R. J. Konings, and R. Stoller (Netherlands: Elsevier).
Watkins, J. K., Gonzales, A., Wagner, A. R., Sooby, E. S., and Jaques, B. J. (2021). Challenges and opportunities to alloyed and composite fuel architectures to mitigate high uranium density fuel oxidation: uranium mononitride. J. Nucl. Mater. 553 (153048), 153048. doi:10.1016/j.jnucmat.2021.153048
Wen, H., van Rooyen, I. J., Hunn, J. D., and Gerczak, T. J. (2018). Electron microscopy study of Pd, Ag, and Cs in carbon areas in the locally corroded SiC layer in a neutron-irradiated TRISO fuel particle. J. Eur. Ceram. Soc. 38 (12), 4173–4188. doi:10.1016/j.jeurceramsoc.2018.05.003
Wilson, T., Vogel, S., Lopes, D., Kocevski, V., White, J., Wood, E. S., et al. (2020). Phase stability of U5Si4, USi, and U2Si3 in the uranium-silicon system. J. Nucl. Mater. 540, 152353. doi:10.1016/j.jnucmat.2020.152353
Wirth, F., Arpagaus, S., and Wegener, K. (2018). Analysis of melt pool dynamics in laser cladding and direct metal deposition by automated high-speed camera image evaluation. Addit. Manuf. 21, 369–382. doi:10.1016/j.addma.2018.03.025
Yang, J. H., Kim, D.-J., Kim, K. S., and Koo, Y.-H. (2015). UO2–UN composites with enhanced uranium density and thermal conductivity. J. Nucl. Mater. 465, 509–515. doi:10.1016/j.jnucmat.2015.06.039
Keywords: uranium chemistry, melt synthesis, thermal imaging, uranium nitride, palladium silicide
Citation: Stone J, Khair M, Cavazos S and Sooby E (2024) High-temperature thermal imaging to inform the arc-melt synthesis of nuclear materials. Front. Nucl. Eng. 2:1322209. doi: 10.3389/fnuen.2023.1322209
Received: 16 October 2023; Accepted: 15 December 2023;
Published: 12 January 2024.
Edited by:
Edgar C. Buck, Pacific Northwest National Laboratory (DOE), United StatesReviewed by:
Jacques Lechelle, Commissariat à l’Energie Atomique et aux Energies Alternatives (CEA), FranceCopyright © 2024 Stone, Khair, Cavazos and Sooby. This is an open-access article distributed under the terms of the Creative Commons Attribution License (CC BY). The use, distribution or reproduction in other forums is permitted, provided the original author(s) and the copyright owner(s) are credited and that the original publication in this journal is cited, in accordance with accepted academic practice. No use, distribution or reproduction is permitted which does not comply with these terms.
*Correspondence: Elizabeth Sooby, RWxpemFiZXRoLlNvb2J5QHV0c2EuZWR1
Disclaimer: All claims expressed in this article are solely those of the authors and do not necessarily represent those of their affiliated organizations, or those of the publisher, the editors and the reviewers. Any product that may be evaluated in this article or claim that may be made by its manufacturer is not guaranteed or endorsed by the publisher.
Research integrity at Frontiers
Learn more about the work of our research integrity team to safeguard the quality of each article we publish.