 Haydn C. Bryan
 Katherine W. Jesse
 Charles A. Miller
 Jeren M. Browning
- Idaho National Laboratory, Idaho Falls, ID, United States
The nuclear energy industry is looking to next-generation reactor designs to augment, diversify, and expand generation capacity in an increasingly complex and varied energy landscape. A key element in this objective is microreactors—small nuclear reactors which can provide flexible capacity at a reduced scale compared to traditional large-scale nuclear reactors. Specifically, microreactors could be used to provide clean, reliable combined heat and power to remote communities, worksites, or facilities. However, the construction and operations and maintenance costs to supply the required operator staffing and physical supporting assets, such as control rooms, could be a limiting factor for first adopters of the technology. Opportunities to reduce the cost of monitoring and control activities could enable early adoption, allowing economies of learning to take effect, spurring further adoption. A reduction in the number and cost intensity of control rooms and operators per deployed microreactor could significantly decrease the overall cost for a fleet of microreactors. To optimize microreactor economic competitiveness, one solution would be to establish an off-site operation facility for centralized monitoring and control (CM&C) of a fleet of microreactors. Leveraging advances in digital instrumentation and control systems could bolster the safety, reliability, and security of the remote communication architecture inherently required to operate remotely. Digital twins (DTs) are virtual replicas of physical assets which can be used for a variety of applications, including analyzing I&C signals against a validated model to perform several analysis and prediction functions. When implemented properly, DTs can potentially detect anomalies and component failures, and serve as a diagnostic tool for operators. These technologies can enhance operator understanding and awareness, reduce the management demand time on operators, and increase asset uptime by providing early alerts for failures alongside insights to aid in predictive maintenance. Furthermore, a DT system could enhance the secure and reliable communication architecture necessary for remote microreactor operation by verifying signals and suggesting or automating controls, thereby boosting their economic viability. This research examines the economic effects of various control strategies ranging from many individually and on-site controlled reactors to co-management of all microreactors in a system from a single, off-site control center. Results from the analysis are positive, revealing significant cost-reduction opportunities.
1 Introduction
The successful operation of complex systems, such as a nuclear microreactor, requires careful monitoring and analysis with timely adjustments as needed. Control of a complex system has the simultaneous goals of optimizing the desired state (e.g., uptime and energy output) while minimizing non-desirable states (e.g., failures or time spent offline for maintenance). Digital tools, models, and systems may help achieve this balance. Additionally, human interaction is often desired to maximize the realization of these goals or to satisfy regulatory requirements. However, on-site human monitoring, control, and manual physical maintenance of microreactors can be costly–particularly when the microreactor is in an isolated, inhospitable, or otherwise challenging location.
Microreactors are a category of advanced nuclear power technology defined as producing less than 10 megawatts electric (MWe) (Office of Nuclear Energy, 2021) with high levels of reliability. Their form factor, technological capabilities, and transportability (whether from a manufacturing center to a final operational location–or even mobility between multiple locations of operation) make them great candidates for a variety of scenarios. Microreactors are expected to be more competitive in applications that currently experience high energy costs and specific geographical or technological needs–like isolated energy users including communities, industrial sites, or mines.
Decisions for the design, construction, application, and location of a microreactor should be based on the most up-to-date and accurate information available to ensure optimal deployment. Several changes and advancements are required to make the broad deployment of microreactors a reality, but a central concern is that the capital and operational costs to monitor and control microreactors must be minimized for expected first adopters of the technology. This target will help achieve economic competitiveness against alternatives to justify microreactor utilization. Overcoming the cost intensity of human operation while capturing its benefits can greatly increase the overall effectiveness of the technology.
New digital tools and systems that aid operators in managing a microreactor or even a fleet of microreactors may help to ensure proper performance. A digital twin (DT) is defined herein as a digital system that contains a virtual representation of a physical resource and bidirectionally communicates with that resource during operations (Browning et al., 2022). This virtual representation may be comprised of models that predict future operations, detect anomalies, and suggest changes that support the optimal operation of the resource. This type of DT may reduce costs by reducing the level of effort required by human operators to manage a single microreactor or a system of many. With the support of a digital twin, operators could more fully understand microreactor operation, see predictions, and test the predicted results of control inputs before committing to them.
A DT can understand the standard or average characteristics of a system such as a given type of microreactor. Importantly, a DT also understands the intricacies and deviations of an individual microreactor over time and how it might differ from the average. This understanding allows a DT to analyze, predict, and suggest controls for an individual microreactor that are best suited to its unique operation, not just to average operation conditions. Upgrades can be scheduled, maintenance can be coordinated, and outages can be predicted when the lifetime of components is understood. The ability to predict and schedule maintenance and replacement is particularly beneficial when the microreactor is deployed in an isolated area.
1.1 Nuclear power technologies
Nuclear power technologies are broadly classified into three categories based on the capacity of energy production, measured either in megawatts electric (MWe) or megawatts thermal (MWth). Traditional, large-scale NPPs produce anything greater than 300 MWe (Liou, 2023), with the largest plants producing multiple thousands of MWe across multiple reactors. Small modular nuclear reactors (SMNRs) are defined as having a capacity of up to 300 MWe per unit. On the smallest end of the scale, microreactors (MRs) are designed to produce a maximum of 10 MWe–though it must be noted that different organizations list different capacities for these categorical classifications. “Fission batteries”, which will be discussed in more detail in the next section, refers to reactors of any capacity that achieve specific qualities.
Traditional-scale NPPs operate across the world today, and next-generation designs with new types of fuel and cooling technologies are being built globally. Very few SMNRs are currently operational, but more than 70 commercial SMNRs are currently in development. Similarly, no microreactors currently exist in a production capacity, but many designs are currently in development with planned testing and deployment happening in upcoming years.
Microreactors are a unique nuclear power technology due, in part, to their physical size. Some are designed to be small enough to be transportable by truck, plane, shipping vessel, or railcar (Office of Nuclear Energy, 2021). This allows nuclear power to be used in ways and reach locations that were previously impractical or impossible. Additional potential use cases may include emergency response to areas damaged by natural disasters, use in military bases, or as an energy source for facilities that are off the grid, in addition to remote or inhospitable locations, which have been discussed previously.
1.2 Fission batteries
The term “fission battery” (FB) envisions a future type of nuclear energy system that could be used in a battery-like operation (Agarwal et al., 2021). The system would be deliverable as an unattended “plug-and-play” service. Five key attributes are used to define a fission battery, the definitions here are sourced from (Forsberg and Foss, 2023):
1. Economic–Cost competitive with other distributed energy sources (electricity and heat). The FB becomes a replacement for oil and natural gas in many applications.
2. Standardized–Developed in standardized sizes and power outputs that enable large-scale factory production; that, in turn, enable low-cost reliable systems. Production would be on the scale of commercial jet engines.
3. Modular and transportable–Readily and easily installed and removed after use. The FB is sent back to the factory for refurbishment or decommissioning. This moves major reactor maintenance, fuel cycle and other operations from the customer site to a central factory site.
4. Unattended–Operated securely and safely in an unattended manner to minimize the burden of operations on the customer.
5. Reliable–Equipped with systems and technologies that have a high level of reliability to support the mission life and enable deployment for all required applications.
Note that the classification is capacity agnostic–meaning that the term “fission battery” could hypothetically be utilized for a small-scale MR up to a traditional-scale NPP. However, the term is typically used in relation to SMNRs and particularly MRs. Current work is focused on developing, building, and demonstrating next-generation advanced reactors and microreactors, but additional research is needed to create the systems, technologies, and paradigms that will support the realization of fission batteries.
Fission batteries will require technology that supports the reliability of individual units, while also helping operators understand any deviations that might exist between a given unit and the average or standard operation for that type of unit. Systems will provide functionality such as predicting behavior ahead of time, finding and alerting on potential or impending anomalies, and aiding in the optimization and maintenance of individual fission battery units. These capabilities would help fulfill several fission battery attributes, including economic, reliable, standardized, and unattended. A DT of a fission battery could provide these capabilities, making DTs a critical element in enabling the remote operation of nuclear energy systems. Overall, DT technology supports steps toward the desired states of economic, reliable, and unattended fission batteries.
1.3 Digital twins
As discussed above, DTs are a digital replicant of a physical asset and all its component entities. Individual sensors, components, and materials are aggregated as well as the relationships and dependencies between them. This collection of a united dataset allows for advanced data analytics processes, such as machine learning and artificial intelligence (AI), to be used in the generation of predictive models. With a fully realized DT, relevant human and machine inputs to a system can be simulated. This allows for an understanding of what expensive error and failure scenarios look like without enduring the associated costs and risks, enabling users to devise optimal strategies for the avoidance of such failures. Ordinary operational levels can be established and understood across the asset and, when data levels are outside of the norm, the root cause can be more easily identified whether in a live or a simulated scenario.
The term “digital twin” has been in use since the early 2000s (Grieves, 2002). The concept of a digital system that acts as a twin of a physical asset has been growing in popularity and use over recent years (Grieves, 2005; Grieves, 2006; Grieves, 2011; Grieves, 2014; Jones et al., 2020). General Electric, for example, lists several beneficial outcomes that have been enabled by DTs utilized across multiple types of assets, including pumps, turbines, and power stations (Parris, 2023). These benefits include increased reliability, reduced reactive maintenance, and avoidance of lost production by detecting and preventing failures (Glaessgen and Stargel, 1818; Tuegel et al., 2011; Boschert and Rosen, 2016; Schluse et al., 2018; Tao et al., 2019; Rasheed et al., 2020; Kochunas and Huan, 2021; Lin et al., 2021). While existing NPPs do make use of modeling and simulation to help validate reactor operations and make some level of predictions, such modeling and simulation is currently done in an offline, disconnected, and siloed manner (Yadav et al., 2023). A DT that is integrated across the various sources of data produced by a microreactor includes an appropriate and validated set of predictive models and has bidirectional communication, which may be a primary enabling element to the successful remote operation of microreactors.
Remote communication is critical for DTs that enable remote operation and control. Remote operation and control of physical assets requires bidirectional wireless transmission of data to and from an off-site location (Yadav et al., 2021a). These communication challenges apply both within and outside the microreactor vessel. Within the microreactor vessel, wireless digital sensors of microreactors are exposed to harsh, high-radiation fields that raise concerns about the survivability of the electronics system. For ex-vessel applications, (those outside the microreactor and local hardware), the network architecture needs to be developed to integrate multiband and multifrequency requirements with existing mature wireless communication technologies when wireless transmission is to be employed. Specifically, microreactor locations must install the infrastructure for utilizing the wireless communication protocol, such as wide area network (WAN), radio frequency, long-term evolution (LTE) broadband cellular communication, and other wireless technologies that will meet the data requirements for a DT.
The alternative is on-site operation of the microreactor through wired communication that uses traditional electric cables. These cables offer limited communication bandwidth, speed, transmission distance, and signal quality, but are considered more desirable for cybersecurity, operating experience, reliability, and compliance with regulatory guidelines (Yadav et al., 2021b). Although they are considered passive, long-lived components with high historical reliability, these cables are exposed to environmental stressors (e.g., temperature, radiation, vibration, moisture, and humidity) and operational issues (e.g., external interference, voltage stress, material defects, electrical transients) that can lead to cable failures.
Data storage and processing are additional concerns for the remote operation of microreactors using DTs. If operation is to be performed on-site, the data would have to be stored on premises with computational resources provided for data analytics and DT operation. The amount of data will most likely be large, approaching terabyte- and even petabyte-scale over the course of months and years. The bandwidth required for transferring these data or a subset would be a concern for remote locations which likely lack the requisite infrastructure for such intensive operations. Expansions of communications infrastructure, if required, would add costs to remotely operated systems. Future work is needed to examine architectures best suited for reliable and timely remote operation of microreactors. Architectures that make use of both a local DT on-premises and a remote DT run off-site, could aid in producing reliable and validated DT predictions and decisions through the comparison of outputs from each DT. This type of architecture could provide a data subset to the remote DT, and therefore provide a cost-effective solution by mitigating communication costs.
1.4 Early commercial adopters
Multiple studies have examined potential early commercial adopter spaces for microreactors, with the general determination that the technology will initially be best suited for niche spaces with unique economic and technological contexts and needs (Abou-Jaoude et al., 2021). Various potential use cases have been described, including applications of microreactors to replace diesel generators at mines, municipalities, or facilities in remote areas of Alaska (Shropshire et al., 2021). Because these large energy users are separated from primary electric grids, they rely on local energy generation assets to supply the energy for operations.
This report assumes remote applications to be the likely first adopters, and therefore are utilized as the use case for the study. Large, off-grid, isolated energy users have both economic and technical motivations to adopt microreactors, as their diesel consumption is expensive, and their operations require a high degree of reliability from generation assets. Additionally, utilization of microreactors would reduce reliance on multinational diesel supply chains and international politics that can impact the price and accessibility of the fuel.
Another potential motivator for microreactor adoption is carbon emission reductions. Different entities have varying motivations for the decarbonization of operations—including regulatory requirements and corporate commitments. For example, the International Council on Mining and Metals, a consortium including some of the largest mining companies in the world, announced a plan to reach “net zero direct and indirect carbon emissions by 2050 or sooner” (Reuters, 2021). Continuing the example of a remote mine in Alaska, decarbonization may be economically and technically difficult or infeasible solely using common low-carbon technologies, namely wind and solar. Mining operations generally have steady energy needs with high reliability requirements, meaning that variable renewable energy (VRE) powered systems would require both significantly overbuilt capacity and thermal or battery storage to meet the user’s requirements. MRs are better suited to meet the needs of mines and many other industrial processes due to their consistent energy output and high reliability. Nuclear microreactors could be integrated with VREs and energy storage in some applications to improve economic and technical performance—the technologies can be complimentary as opposed to exclusive.
2 Materials and methods
Impacts on capital and operating expenditures are an important factor to consider in the potential adoption of remote operation strategies as enabled by CM&C and DTs. Cost-saving potential, if significant, can provide further motivation beyond the expected technical benefits to study and implement these technologies. To examine the effects of CM&C on capital and operating costs, this section conducts and discusses a differential cost analysis between varying possible operational strategies, creating a generalized model that can estimate costs for both hypothetical edge cases and core cases. Due to the lack of experiential knowledge of microreactor deployment and operation–and given the evolving nature of relevant regulations–this report focuses on establishing the model and bounding edge cases, setting a path for future examination of use cases under specific operational and regulatory environments.
By constructing unique operational cases and establishing realistic input parameters within a Monte Carlo model, this research allows for the estimation of the capital and operating costs of monitoring and control of NPPs. By differentially comparing cases, impacts on overall costs can be established to determine the magnitude of cost-saving opportunities specifically enabled by remote operation capabilities.
As opposed to other research that calculates overall cost values for microreactors in given scenarios (e.g., an overnight capital cost value of $/kW capacity or a $/MWh levelized cost of energy), this report considers only the costs directly attributable to and impacted by operational strategy and holds all other factors constant (the “ceteris paribus” assumption). Because the analysis is differential, any costs not attributable to the monitoring and control of microreactors (any costs that are identical between cases) are dropped from the model. This approach allows for a specific focus on the potential cost savings that can be captured through remote operation strategies as compared to on-site monitoring and control.
This research examines applications of microreactors, for which the production capacity is not an accurate proxy variable for underlying operational complexity. Because of this, the costs of remote monitoring and control are not modeled as a function of reactor capacity or capacity factor. Operational requirements and, by extension, costs are determined more so by their regulatory environment, which is currently in flux for advanced nuclear technologies. Due to this uncertainty, prognostication of any specific regulatory framework is avoided in this research. The current regulatory environment is designed for traditional NPPs and is quite restrictive towards co-operation of multiple or many reactors, especially remotely. As such, both the current regulatory environment and an unregulated environment are considered to examine both extremes. As regulations adapt to technological advancements, more specific regulatory frameworks can be examined within the methodology presented in this report.
The reactors managed within the study’s examined “system” can be viewed as capacity, capacity factor, and technology agnostic. Because these factors are removed, traditional economic measures, such as $/MWh, are not presented. Additionally, because reactor lifetimes differ between concepts and are impacted by regulatory decisions regarding lifetime extension, this factor is also ignored. Instead of using metrics such as weighted average cost of capital to construct discounted costs or net present values, the monitoring and control project capital expenditures (CAPEX) and a single representative year’s operational expenditures (OPEX) are presented as results. CAPEX refers to expenditures involved in the purchase or upgrade of physical or intangible assets, for example, a building, machinery piece, or the purchase of a training program. OPEX refers to recurring costs, such as labor and machine maintenance.
This approach further increases the generalizability of the results; however, the Monte Carlo methodology, which will be described in the following section, was utilized to additionally accommodate future design-specific research by including–but not using–some parameters.
2.1 Monte Carlo method
To date, advanced nuclear microreactors have not been utilized in commercial applications, meaning that experiential data is limited. Additionally, the regulatory space for advanced nuclear reactors is in flux–with requirements undergoing updates to match the unique characteristics of emergent technologies. Because of the layered uncertainties, it is difficult to provide reliable cost estimates for monitoring and control activities. As such, it is appropriate to utilize the Monte Carlo methodology which randomly selects values from user-defined ranges, allowing for both baseline and sensitivity analyses.
For a detailed discussion of Monte Carlo methodology, readers are directed towards the multitude of literature on the subject, including (Metropolis and Ulam, 1949; Doubilet et al., 1985; Rubinstein and Kroese, 2016). While useful for modeling and describing the cost components of reactor monitoring and control, this preliminary research is a simple application of Monte Carlo, utilizing only uniform continuous or discrete distributions to model parameters. This approach allows for intuitive understanding of how inputs impact results, and examination of the relative magnitude of each component cost reduction opportunity. The analysis was run in the Palisade @RISK program (v7.5) with 10,000 iterations.
2.2 Study cases
To examine the cost reduction between on-site and off-site operation of MRs, three cases are constructed. Details about the cases are presented in Table 1 but will also be discussed here. The number of microreactors in the system is modeled as a uniform integer distribution between 10 and 200 and a number from this distribution is selected for each iteration. As MR technology progresses and the expected level of adoption becomes clearer, the range of this parameter can be adjusted to match market conditions. Case 1 represents a conservative case where each microreactor is sited individually and managed on-site from a dedicated control room. Case 2 is more moderate, co-siting three microreactors per site, which are co-managed on-site from two control rooms in a shared control center. This case represents the system taking advantage of flexibility in current NRC regulations, which allow for reduced personnel and control rooms when multiple reactors operate from the same location. These adjustments are expected to reduce costs as compared to Case 1. Case 3 represents an extreme case where all microreactors are remotely operated from a single, unified control center. In this case, economies of scale, a phenomenon where each subsequent unit added to a system requires fewer resources to operate than the unit that precedes it, are utilized as the determinant of staffing level as opposed to regulatory requirements. The number of control rooms in the control center is then determined by the reduced number of staff.
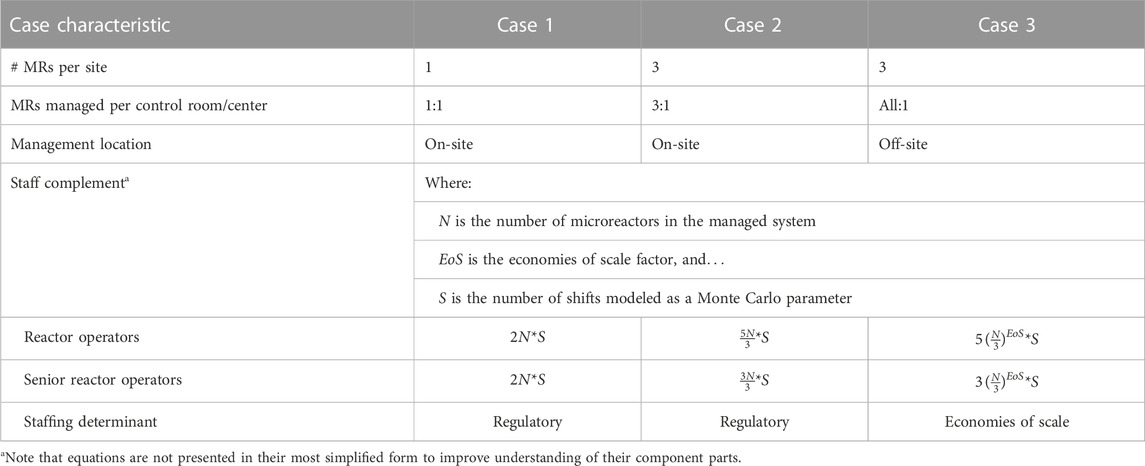
TABLE 1. Characteristics of each study case.
Case 3 is the only off-site management case, and thus the only to use remote monitoring and control. As such, Cases 1 and 2 are the “base” cases, used as comparison points to the “study” case, Case 3. The cost profiles of each of the cases are compared within a Monte Carlo methodology to determine the relative CAPEX and OPEX under study assumptions. Figure 1 also presents each of the cases and expected differences in costs.
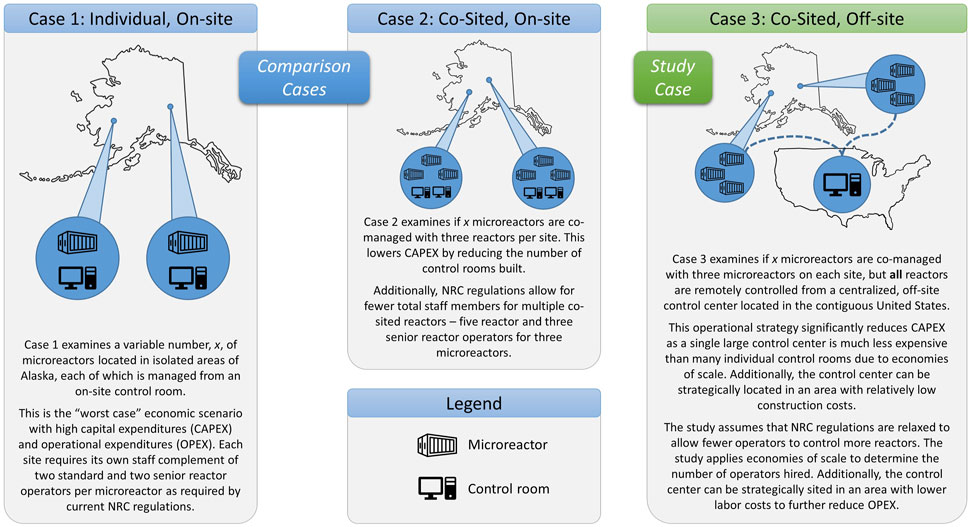
FIGURE 1. Description of the study base and comparison cases.
2.3 Inputs, parameters, and assumptions
The following subsections describe the costs that comprise CAPEX and OPEX for monitoring and control of microreactors–the static and variable parameters that form the comparative cost Monte Carlo analysis. Additionally, factors that influence the costs are presented and discussed.
2.3.1 Capital expenditures (CAPEX)
CAPEX estimates were sourced from the Economic Energy Data Base (EEDB) which was published by the United States Department of Energy (DOE) in 1978 and updated until 1990 (Nuclear Energy Agency, 2020). The EEDB data was accessed through the TIMCAT-hosted Nuclear Cost Estimation Tool (NCET) which contains cost estimates for, among other generation technologies, a 1,143MWe pressurized water reactor (PWR) (Stewart and Shirvan, 2021; Stewart and Shirvan, 2022).
NCET divides each cost component into three parts: off-site factory, on-site labor, and on-site material (Stewart and Shirvan, 2021). Relevant line items from the EEDB were used to estimate the costs for monitoring and controlling microreactors. “Median experience” and “best experience” data are provided within the dataset; this research uses the median experience (relatively higher) costs. Two categories were selected for consideration: A.218A (Control Room and Diesel Generator Building) and A.227 (Reactor Instrumentation and Control). Because these cost estimates are for traditional-scale nuclear reactors, which have a larger staffing need than the microreactors examined in this analysis, the costs must be adjusted downward to reflect smaller control rooms with fewer operators.
The following equation is used to adjust control room costs while accounting for economies of scale, with the assumption that the control room for the EEDB PWR employs a crew of seven operators. This adjustment additionally makes the simplifying assumption that the cost of a control room is determined by the number of staff present at any given time. Because the size of the considered asset is decreasing, the economies of scale factor actually limits the amount of cost reduction, because the adjustment experiences negative economies of scale. Put another way, the cost of the control room still decreases as the staff level decreases from seven to four, but at a decreasing rate.
As a second cost adjustment to the EEDB data, nuclear control rooms have increasingly adopted digitalization which can significantly reduce the cost of the physical systems needed to monitor and control reactors (Kochunas and Huan, 2021; Yadav et al., 2022). This adjustment is reflected by scaling instrumentation and control (I&C) costs by one-fifth (based on internal expert estimates which are not intended to prognosticate future savings from the strategy). The adjustment for digitalization is completed in addition to the scaling adjustment discussed previously. Table 2 shows the original costs for each line item of the microreactor’s control system alongside the costs after adjusting for both scaling and digitalization.
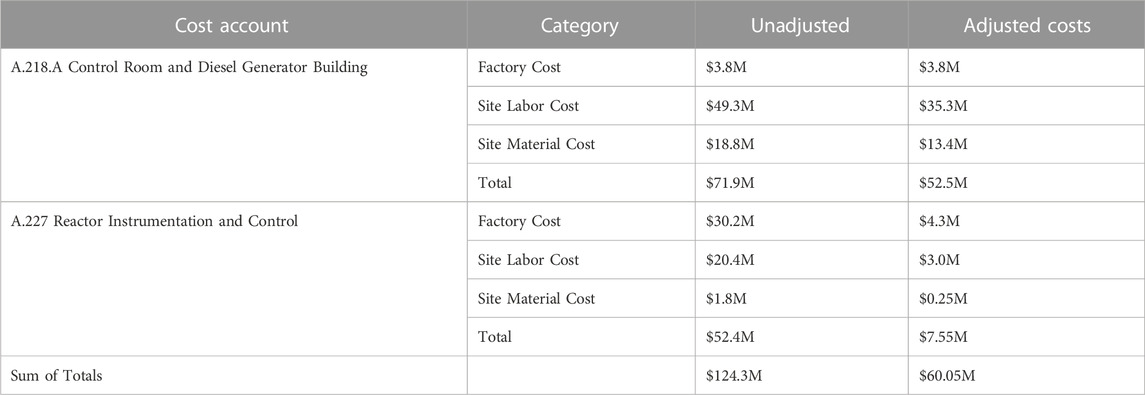
TABLE 2. Base and adjusted costs of reactor monitoring and control systems.
One additional CAPEX category is added: employee housing for Cases 1 and 2. In these cases, microreactors and control rooms are assumed to be located in isolated regions of Alaska. As is common in other industries, such as mining, the hosting facility is assumed to provide housing for employees who may either live elsewhere and travel for multi-week shifts or live on the worksite full time. As a simplifying assumption, the employer is assumed to bear the costs of room and board for employees, which contributes to both the CAPEX and OPEX of the microreactor. Cost estimates for room and board were sourced from (Metz and Campbell, 1982), and values were adjusted from December 1982 USD to December 2018 USD. The three cost components used are shown in Table 3. Note that only the “Housing Construction” item in Table 3 is CAPEX, the rows below in the Room and Board Costs category are OPEX and will be discussed in the next section. These housing costs are not experienced in Case 3 as the control center is sited in an urban area; it is assumed that no geographic adjustments need be provided by the operation company.
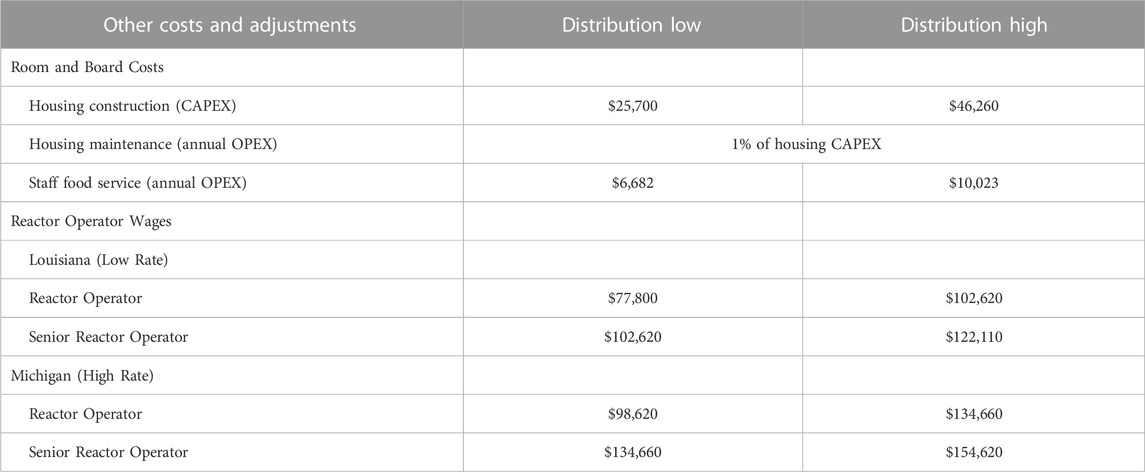
TABLE 3. Cost distributions for room and board and reactor operator wages.
Labor and material costs vary across geographies, meaning that otherwise identical projects could have significantly different costs depending on siting. While Cases 1 and 2 are constrained to have the control room and requisite staff co-located with the microreactor(s), the control room for Case 3 is not geographically constrained and can thus be sited strategically to minimize costs.
Construction material and labor cost adjustments were sourced from the 2021 RSMEANS City Cost Indexes (V2) (The Gordian Group Inc, 2021). To create a reasonable range of locational adjustments, New Orleans, Louisiana, was used as the low-cost adjustment while Anchorage, Alaska, was used for high costs. Note that the city selections were based on the relative difference in costs, not a prognostication that reactors will be sited in these locations. These adjustments were applied to the line item costs from TIMCAT, with Cases 1 and 2 experiencing high costs while Case 3 experienced low costs. Table 4 shows the locational cost adjustment factors (The Gordian Group Inc., 2021).
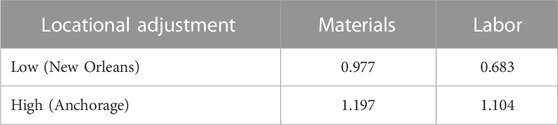
TABLE 4. Locational adjustments for construction costs.
2.3.2 Operational expenditures (OPEX)
The primary operational cost for monitoring and control of microreactors is labor–the wages and associated costs from reactor operators (RO) and senior reactor operators (SRO). This section discusses these expenditures, as well as the recurring costs associated with housing and feeding employees in Cases 1 and 2.
In Cases 1 and 2, reactor operators must either live on-site or use rotational schedules—similar to other industries such as offshore oil drilling. Because of the labor skill requirements of reactor operators, the lack of a labor pipeline in the area, the difficulties associated with transportation and logistics, and other factors, reactor operator wages can be assumed to be higher than for those in the contiguous United States. As such, locational adjustments are applied to account for this factor. Data from O*NET is used to estimate wages, with ranges for reactor operator wages sourced from Louisiana (low-wage state) and Michigan (high-wage state) (National Center for O*NET Development, 2023). Data from Michigan was used in lieu of Alaska because no data exists for reactor operator wages in the area (there are no operating reactors in Alaska). Senior reactor operators are assumed to have a wage range in the 75th percentile and above, while standard reactor operator wages are constrained to below the 75th percentile. Base wages are then multiplied by a wrap rate of 2.1x to estimate the “all-in” costs of each position (Thornton, 2017) which includes non-wage costs to the company like health insurance, administration, and benefits. The Reactor Operator Wages section in Table 3 shows the base wage ranges of ROs and SROs in high-rate (used for Cases 1 and 2) and low-rate (used in Case 3) geographies.
Returning to the Room and Board Costs section of Table 3, the last two rows show the OPEX ranges for housing maintenance and staff food. Housing CAPEX is determined by its own range within the Monte Carlo model–housing maintenance is calculated as 1% of the total CAPEX, annually. The staff food cost range was sourced from (Metz and Campbell, 1982) and converted to 2018 USD.
2.3.3 Economies of scale
The central consideration of this analysis is how costs vary between individual versus communal control strategies of many microreactors. Put simply, costs of monitoring and control scale linearly with the number of microreactors in a system when each is individually controlled (Case 1); each reactor requires the same amount of resources to run, and there is no synergy for management of multiple reactors. Centrally controlled reactors, on the other hand, are expected to require a less-than-linear increase in resources to manage each additional reactor added to the system due to the economies of scale (EoS) phenomenon.
In the context of this analysis, EoS refers to the decreases in cost intensity per unit that occur as the level of production increases. “Production”, here, is the required monitoring and control activities for microreactors–as the number of microreactors in a system increases, the amount of total production required increases. However, while the total level of “production” is expected to increase as the number of microreactors in a system increases, the intensity of production per microreactor is expected to decrease. This effect is realized, in part, because some activities shared by multiple microreactors can be completed in parallel by a single operator as opposed to serially. For example, monitoring multiple reactors for abnormal states can be completed simultaneously, especially when operators are assisted by automated systems. As such, the efficiency of operators can be expected to increase as the size of the managed system increases and more processes are completed in tandem. For a deeper discussion of technology-enabled economies of scale, see (Büchi et al., 2018).
Case 2 experiences some, but very limited, effects of economies of scale by managing three reactors from the one control center, while Case 3 takes full advantage of EoS by managing all reactors in the system from one control center.
This EoS for remote operation of microreactors is similar to the EoS experienced by offshore oil drilling activities when some staff are moved onshore for remote work. Experience in this area has shown that the strategy can reduce operational costs and take advantage of the EoS phenomenon (Forster, 2018).
A traditional economies of scale factor is the “rule of six-tenths,” which states that the unknown cost of a process at a given capacity can be estimated by scaling from a known cost and capacity using the following formula (Berthouex, 1972):
Where:Y2 is the unknown cost of a process at capacity Q2Y1 is the known cost of a process at capacity Q1x is the scaling factor, traditionally 0.6 (Rule of Six-Tenths).
For the Monte Carlo analysis, the economies of scale (EoS) factor is a uniform range between 0.6 and 1 to demonstrate the effects of EoS on the overall savings. When the EoS factor has a value of one, there are no economies of scale, removing the benefits of managing many reactors from the same control center. While there are no savings from EoS in this case, other savings are still experienced. The EoS factor will be held static at 0.6 for some charts to illustrate “base” results, as will be discussed in more detail later in this report.
3 Results
The Monte Carlo model outputs reveal the sources and magnitude of expenditure reduction experienced by adjusting the operational strategy of the microreactors system. This section describes the results in two categories: static results and sensitivity results. The static case displays the magnitude of the overall savings effects—its usefulness is expanded when viewed in the context of the sensitivity analysis. For static results, all model inputs are held static at their average values and the EoS factor is held at 0.6 (as per the “Rule of Six-Tenths”). For the sensitivity results, study parameters, including the EoS factor, are allowed to vary randomly along a uniform distribution within their defined ranges. Because EoS are beneficial to the cost-reduction potential, the sensitivity case will necessarily show lower savings potential than the static case. This breakdown of static versus sensitivity cases is used to both respect the “Rule of Six-Tenths” in the static case and show the sensitivity of results to (and thus importance of) the EoS factor in the sensitivity case.
Table 5 shows static results, the cost savings experienced moving from one case to another at the average values of each of the inputs and 0.6 for the EoS factor. Changing from Case 1 to Case 2 (C1→C2) allows three microreactors to be managed from a control center with two control rooms and results in reductions of CAPEX by one-third and OPEX by one-half. Transitioning from C2→C3 reduces CAPEX and OPEX by four-fifths and three-quarters, respectively. C1→C3 has even more significant reductions and can be seen as a combination of the reductions from C1→C2 and C2→C3.
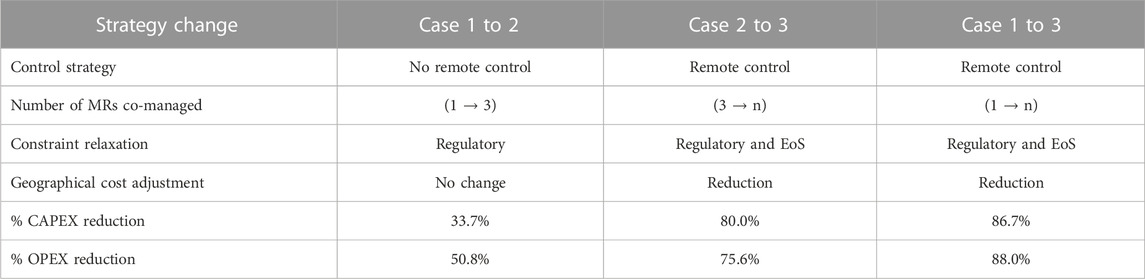
TABLE 5. Static cost reductions and differences by strategy change.
Figure 2 shows CAPEX and OPEX across cases, showing the magnitude of expenditure reductions as operational strategies change. Note that the costs are displayed relative to Case 1, which is shown as 100%. The control room accounts for a majority of the CAPEX across cases, but the total capital is reduced significantly across cases—an effect also experienced by the I&C line item. For OPEX, costs are somewhat evenly split between ROs and SROs, with SROs accounting for the majority in Case 1 and ROs accounting for the majority in Cases 2 and 3. For both CAPEX and OPEX, housing costs comprise the smallest portion of total expenditures in Cases 1 and 2, and the category is removed entirely in Case 3.
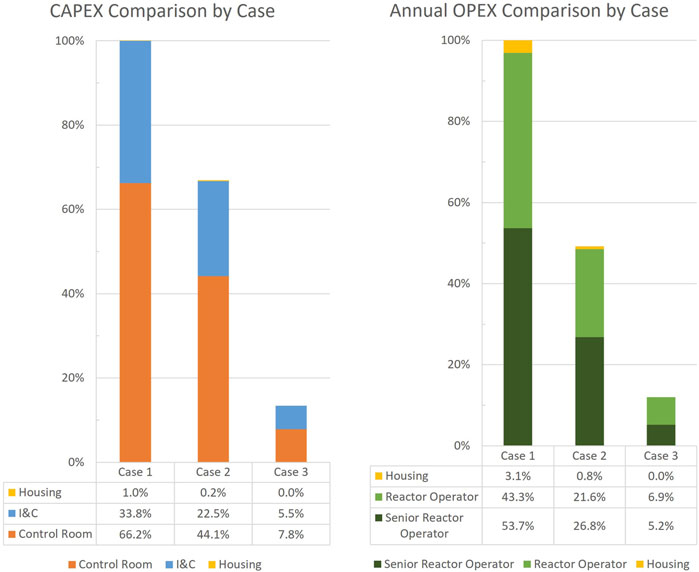
FIGURE 2. Expenditures by category and case using Case 1 as baseline.
The following sensitivity analyses are based on a Monte Carlo run with the previously described parameter ranges and 10,000 iterations. Figure 3 through Figure 6 (not including Figure 4, which will be described separately) show the sensitivities of CAPEX reduction effects to various inputs between cases, while Figure 7 through Figure 9 show the same for OPEX. The bounded box area in the tornado diagrams show output values that fall within a 90% confidence interval.
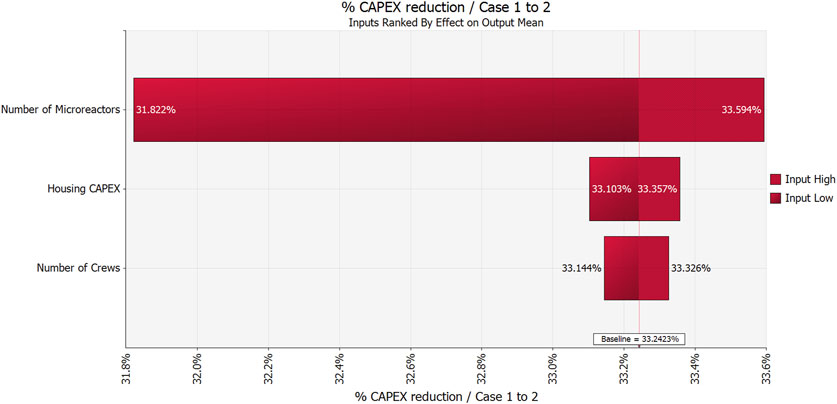
FIGURE 3. Sensitivity of CAPEX reduction from Case 1 to Case 2.
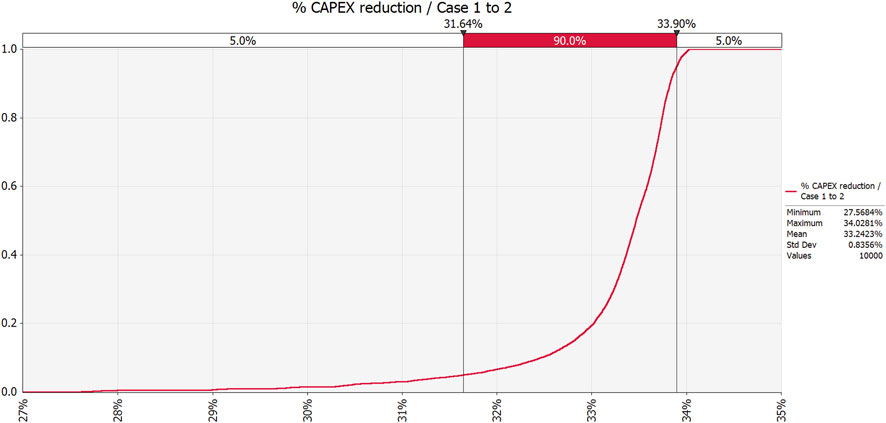
FIGURE 4. Cumulative distribution of CAPEX reduction results from transitioning from Case 1 to Case 2.
3.1 CAPEX reduction and sensitivities
Figure 3 shows CAPEX reduction as the operational strategy is changed from C1→C2, with a baseline savings of 33.2%. The chart reveals that the primary driver of cost savings is the number of microreactors in the controlled system. This result is expected because the only differences between the cases is the number of microreactors co-controlled on each site, varying between one and three. Co-controlling three reactors is less CAPEX-intensive than controlling each individually; however, it is important to note that this sensitivity is based on only the divisibility of the number of reactors by three. If the system has an “extra” one or two reactors after grouping all other reactors into groups of three, the system incurs additional costs as a result. Because the additional CAPEX is divided amongst the microreactors in the system, the per reactor additional cost diminishes as the number of reactors in the system increases.
Figure 4 shows the cumulative distribution of C1→C2 results, showing that the CAPEX reduction has a strong skewness of −3.26, meaning that the results are clustered near greater cost savings. This is due to the N+1 effect, and the sensitivity results should be interpreted as such. In this context, the N+1 effect refers to the fact that the system of microreactors is most economically efficient when the total number of MRs is divisible by three (maximizing the benefits of co-sitedness). When the total number of MRs is not divisible by three, a control room and staff contingent controls only one or two microreactors, which is relatively more expensive–raising the overall cost of the system. If the N+1 effect was to be removed; the CAPEX reduction would have little-to-no sensitivity to study parameters. The reduction of CAPEX for C1→C2 is the only one to experience strong skewness.
Figure 5 depicts CAPEX reduction from C2→C3, with a baseline savings of 56%. The baseline savings’ sensitivity is dominated by the interrelated effects of EoS and the number of microreactors in the system. As would be expected, the effects of the EoS are magnified when there are many microreactors in the system, and the number of microreactors is made less impactful when EoS are minimal. Allowing such a wide range of economies of scale (1–0.6) reveals the sensitivity of the overall result to this metric—when EoS is near one the total reduction is only near 27%, while the reduction is around 76% as EoS approaches 0.6.
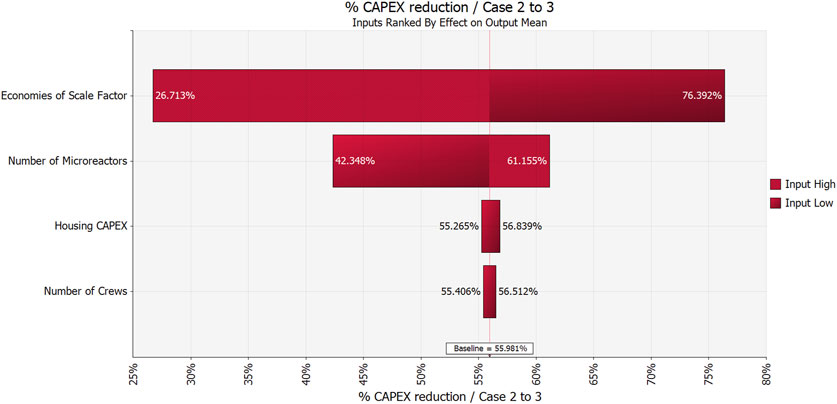
FIGURE 5. Sensitivity of CAPEX reduction from Case 2 to Case 3.
As shown in Figure 3, the sensitivity of the overall CAPEX reduction to the housing CAPEX per person and number of crews is relatively minimal as compared to above mentioned factors. Figure 6 shows the CAPEX reduction from C1→C3 and can be interpreted as a combination of the expenditure reduction effects shown in Figure 3 and Figure 5. The baseline reduction in CAPEX for this operational strategy change is 70.6%.
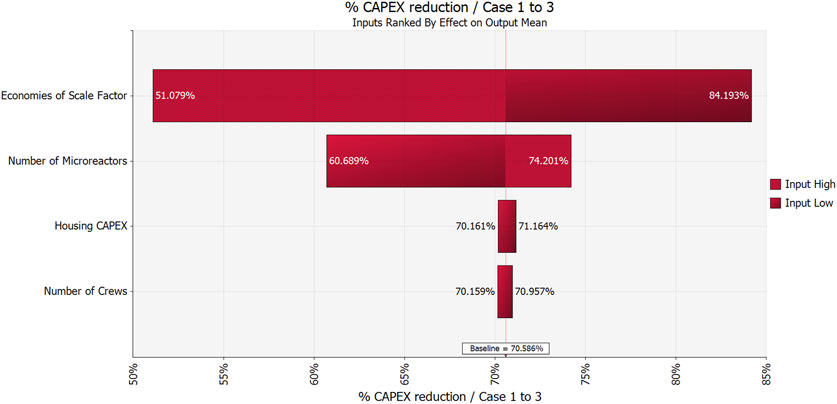
FIGURE 6. Sensitivity of CAPEX reduction from Case 1 to Case 3.
3.2 OPEX reduction and sensitivities
Figure 7 shows the sensitivity of the OPEX reduction for C1→C2 to various input parameters. It is important to note that the sensitivities shown in this chart are minimal, with even the most extreme sensitivities only moving from the baseline ±0.13%.

FIGURE 7. Sensitivity of OPEX reduction from Case 1 to Case 2.
Figure 8 shows the sensitivity of the OPEX reduction for C2→C3 to various study parameters. The baseline reduction is 44.2%, which is much lower than for the static case reduction value of 75.6% because the EoS is allowed to vary from 0.6, which is by nature purely detrimental to the reduction potential. As expected, the reduction value is highly sensitive to economies of scale, as the only savings experienced when EoS = 1 (no economies of scale) are from geographic savings and removing housing and food costs, which are relatively minimal.
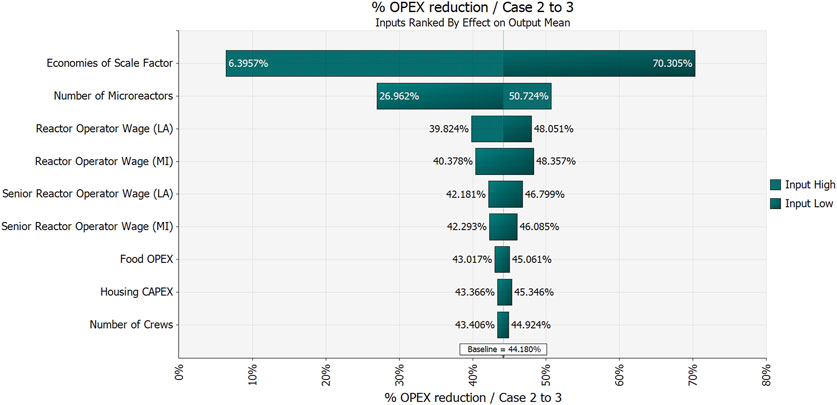
FIGURE 8. Sensitivity of OPEX reduction from Case 2 to Case 3.
An interesting factor for this case comparison is the geographic savings effects. Given that there is overlap in the ranges for low- and high-wage states and that these values are independently generated in the Monte Carlo analysis, it is possible for the low-wage distribution to draw a higher value than the high-wage distribution, meaning that the geographic savings is negative. In cases when EoS is close to 1, it is possible for Case 2 to experience lower OPEX than Case 3. This phenomenon helps explain the sensitivity of OPEX reduction results to study parameters.
The OPEX reduction results show less sensitivity to study parameters, including the number of crews (which impacts each case simultaneously), the cost of food for staff, and housing CAPEX (which is used to determine the housing upkeep).
Figure 9 shows the sensitivities of OPEX reduction for C1→C3. As with Figures 6, 9 can be interpreted as a combination of the two figures that precede it. As with the other sensitivity results, the impacts are dominated by the interrelated effects of EoS and the number of microreactors, with other parameters having more muted effects. Again, the baseline of 72.5% is lower than the static case reduction value of 88% because the EoS factor is allowed to vary detrimentally to the OPEX reduction potential.
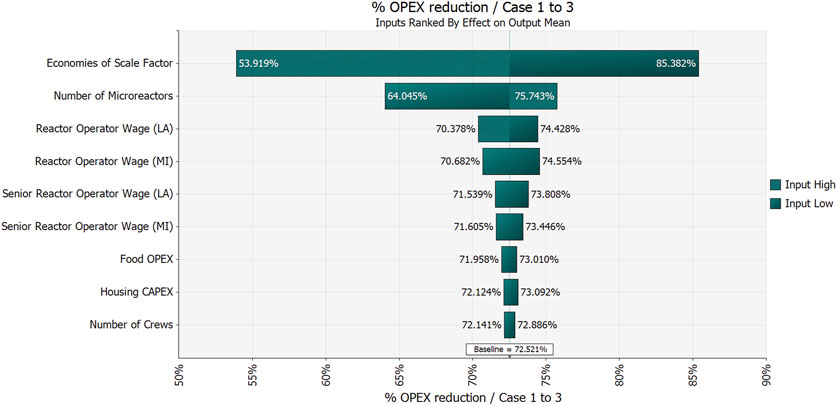
FIGURE 9. Sensitivity of OPEX reduction from Case 1 to Case 3.
Table 6 provides details for the cost breakdown and case-to-case reduction of CAPEX and OPEX by cost category. This information is valuable to understand where the largest savings are captured as operational strategies are changed. For example, while housing costs are reduced either significantly or completely by moving from C1→C2 or C1→C3, the impact on the overall costs is minimal given that housing only accounts for 1% of CAPEX and 3% of OPEX, respectively in Case 1.
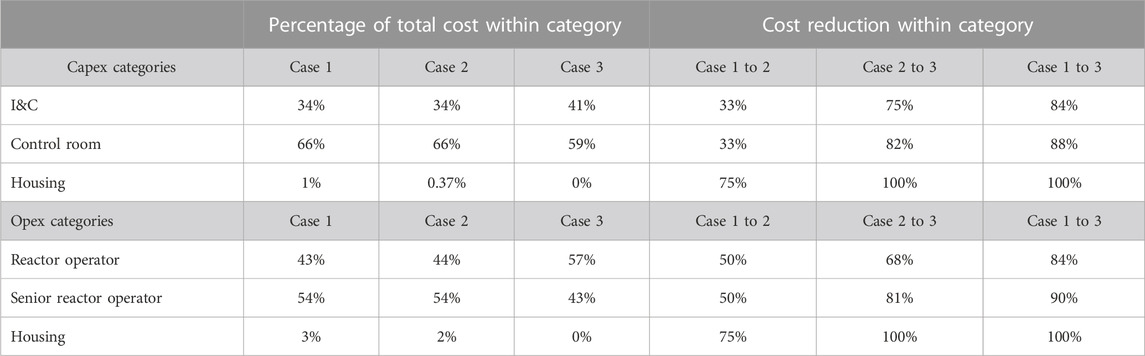
TABLE 6. CAPEX and OPEX disaggregation and reduction by case.
4 Discussion
The cost savings opportunities enabled by remote operation of microreactors presented in this report are substantial. It is important to view the results with the context that Case 1 represents a very unfavorable economic case while Case 3 represents a very favorable economic case. Because these cases are “edge” cases, it is unlikely that either will exist in the real world; the analysis is instead intended to show the overall magnitude of the savings potential, the areas in which cost reduction progress can be made, and the sensitivity of cost reduction to various inputs. Examining specific cases within this range allows for finer comparison between the cases–a topic which is planned for future research.
Additional areas for future research include conducting a bottom-up cost estimate for the components required to ensure reliable and secure digital communications to and from a remotely controlled reactor. Although all reactors, whether managed onsite or remotely, need some degree of communication to an outside entity, it is likely that fully remotely controlled reactors will require more significant communication infrastructure which will add to overall costs.
Overall cost reduction opportunities are determined both by each category’s percentage of overall costs and the cost reduction within the category. While the housing and food category experiences a 100% reduction in Case 3, (the housing cost category is removed in its entirety), the overall impact on monitoring and control costs are minimal simply because this category comprises a minimal percentage of overall costs. While the percentage of CAPEX reductions within the control room category is smaller, its overall effects on CAPEX reduction are larger given that control room CAPEX is the largest category. These results are helpful to focus cost-reduction efforts to the most effective areas, realizing savings more quickly and efficiently.
Many expected first adopters for microreactor technologies are applications that already experience high labor and construction costs due to challenging locations or other factors. As such, it is critical to focus on cost reduction opportunities that can be enabled by remote operation–any savings can help price additional potential users into the market for microreactors. Early adoption is critical for any technology, but especially those which have a large potential for economies of learning. Encouraging early adoption by lowering OPEX and CAPEX will help increase early adoption, increasing economies of learning, increasing further adoption–creating a self-supporting cycle and strengthening the nuclear microreactor industry as a whole.
Because no experiential economic data exists for remote centralized monitoring and control of microreactors, this study has inherent limitations which include the following. First, this research focuses primarily on cost reductions enabled by CM&C, not the potential cost increases systems may experience by adopting this management strategy. As an example, the redundancy and technical qualities (large, constant data transfer with high sensitivity to reliability) required for CM&C may necessitate more expensive systems.
Another added cost not explored in this research is the cost of “visits” to the reactor for planned or unplanned reasons. Cases 1 and 2 would not experience this cost category due to the presence of staff onsite. Included in this category are the costs associated with having maintenance, operation, or response teams on standby to visit reactors if needed. Reasons to travel to a reactor include planned maintenance, unplanned events, or disaster response. If response time requirements are mandated in the regulatory space, shorter response time requirements would be expected to increase overall costs the most due to the need for greater staff sizes more closely located to reactor locations.
Future research with higher cost granularity is planned to examine these topics. Additionally, because this research focuses on economic implications of CM&C, it does not capture benefits and challenges of the strategy that are not directly financial.
This research shows the significant cost reductions for operation activities–up to 87% and 88% for relevant CAPEX and OPEX, respectively–made possible by DT-enabled remote operation of a system of microreactors. Large-scale, remote co-management and its associated savings are only possible when both the regulatory environment and DT technological readiness are satisfactorily developed–making these topics incredibly important for the initial and ongoing economic adoption of microreactor technologies. Because many expected early adopters are expected to be those which will also benefit the most from remote operation capabilities, the continuance and expansion of DT-related research is even more timely as microreactor concepts reach higher technological readiness levels. Future research in this area will examine the cost savings made possible in specific operational cases and under varying assumptions, especially as more data becomes available and the regulatory environment adapts to emergent technologies.
Data availability statement
The raw data supporting the conclusions of this article will be made available by the authors, without undue reservation.
Author contributions
HB: Writing–original draft, Writing–review and editing. KJ: Writing–original draft, Writing–review and editing. CM: Writing–original draft, Writing–review and editing. JB: Writing–original draft, Writing–review and editing.
Funding
The author(s) declare financial support was received for the research, authorship, and/or publication of this article. This work is supported through the Idaho National Laboratory Directed Research & Development Program (LDRD) under Department of Energy Idaho Operations Office contract no. DE-AC07-05ID14517. The U.S. Government and the publisher, by accepting the article for publication, acknowledges that the U.S. Government retains a nonexclusive, paid-up, irrevocable, worldwide license to publish or reproduce the published form of this manuscript, or allow others to do so, for U.S. Government purposes. Neither the U.S. Government, nor any agency thereof, nor any of their employees makes any warranty, express or implied, or assumes any legal liability or responsibility for the accuracy, completeness, or usefulness of any information, apparatus, product, or process disclosed, or represents that its use would not infringe privately owned rights.
Conflict of interest
The authors declare that the research was conducted in the absence of any commercial or financial relationships that could be construed as a potential conflict of interest.
Publisher’s note
All claims expressed in this article are solely those of the authors and do not necessarily represent those of their affiliated organizations, or those of the publisher, the editors and the reviewers. Any product that may be evaluated in this article, or claim that may be made by its manufacturer, is not guaranteed or endorsed by the publisher.
References
Abou-Jaoude, A., Arafat, Y., Foss, A. W., and Dixon, B. W. (2021). An economics-by-design approach applied to a heat pipe microreactor concept. Idaho Falls, ID: Idaho National Lab.(INL. (United States)).
Agarwal, V., Gehin, J. C., and Ballout, Y. A. (2021). Fission battery initiative: research and development plan. Idaho Falls: Idaho National Lab.
Boschert, S., and Rosen, R. (2016). Digital twin—the simulation aspect. Mechatron. Futur. Challenges solutions Mechatron. Syst. their Des., 59–74. doi:10.1007/978-3-319-32156-1_5
Browning, J., Slaughter, A., Kunz, R., Hansel, J., Rolston, B., Wilsdon, K., et al. (2022). Foundations for a fission battery digital twin. Nucl. Technol. 208 (7), 1089–1101. doi:10.1080/00295450.2021.2011574
Büchi, G., Cugno, M., and Castagnoli, R. (2018). Economies of scale and network economies in Industry 4.0. Symphonya. Emerg. Issues Manag. (2), 66–76. doi:10.4468/2018.2.06buchi.cugno.castagnoli
Doubilet, P., Begg, C. B., Weinstein, M. C., Braun, P., and McNeil, B. J. (1985). Probabilistic sensitivity analysis using Monte Carlo simulation: a practical approach. Med. Decis. Mak. 5 (2), 157–177. doi:10.1177/0272989x8500500205
Forsberg, C., and Foss, A. W. (2023). Fission battery markets and economic requirements. Appl. Energy 329, 120266. doi:10.1016/j.apenergy.2022.120266
Forster, L. (2018). Offshore facilities and remote operations: a way to reduce costs, improve performance, and embrace the future. Endeavor Manag. Available at: https://www.endeavormgmt.com/blog/offshore-facilities-and-remote-operations.
Glaessgen, E., and Stargel, D. (1818). “The digital twin paradigm for future NASA and US Air Force vehicles,” in 53rd AIAA/ASME/ASCE/AHS/ASC structures, structural dynamics and materials conference 20th AIAA/ASME/AHS adaptive structures conference 14th AIAA) (USA: IEEE).
Grieves, M. W. (2002). “Product lifecycle management special meeting,” in PLM initiatives. (Ann Arbor, MI: University of Michigan Lurie Engineering Center).
Grieves, M. W. (2005). Product lifecycle management: the new paradigm for enterprises. Int. J. Prod. Dev. 2 (1-2), 71–84. doi:10.1504/ijpd.2005.006669
Grieves, M. W. (2011). Virtually perfect: driving innovative and lean products through product lifecycle management. Germany: Space Coast Press Cocoa Beach.
Grieves, M. W. (2014). Digital twin: manufacturing excellence through virtual factory replication. White Pap. 1, 1–7.
Jones, D., Snider, C., Nassehi, A., Yon, J., and Hicks, B. (2020). Characterising the digital twin: a systematic literature review. CIRP J. Manuf. Sci. Technol. 29, 36–52. doi:10.1016/j.cirpj.2020.02.002
Kochunas, B., and Huan, X. (2021). Digital twin concepts with uncertainty for nuclear power applications. Energies 14 (14), 4235. doi:10.3390/en14144235
Lin, L., Bao, H., and Dinh, N. (2021). Uncertainty quantification and software risk analysis for digital twins in the nearly autonomous management and control systems: a review. Ann. Nucl. Energy 160, 108362. doi:10.1016/j.anucene.2021.108362
Liou, J. (2023). What are small modular reactors (SMRs)? Available at: https://www.iaea.org/newscenter/news/what-are-small-modular-reactors-smrs.
Metropolis, N., and Ulam, S. (1949). The Monte Carlo method. J. Am. Stat. Assoc. 44 (247), 335–341. doi:10.1080/01621459.1949.10483310
Metz, P. A., and Campbell, B. W. (1982). Cost of exploration for metallic minerals in Alaska-1982. USA: University of Alaska Mineral Industry Research Laboratory.
National Center for O*Net Development, (2023). Nuclear power reactor operators 51-8011.00. Available at: https://www.onetonline.org/link/summary/51-8011.00.
Nuclear Energy Agency (2020). The energy economic data base. Available at: https://www.oecd-nea.org/tools/abstract/detail/psr-0531/.
Office of Nuclear Energy (2021). What is a nuclear microreactor? Available at: https://www.energy.gov/ne/articles/what-nuclear-microreactor.
Parris, C. (2023). What is a digital twin? Available at: https://www.ge.com/digital/blog/what-digital-twin.
Rasheed, A., San, O., and Kvamsdal, T. (2020). Digital twin: values, challenges and enablers from a modeling perspective. Ieee Access 8, 21980–22012. doi:10.1109/access.2020.2970143
Reuters, (2021). World’s largest miners pledge net zero carbon emissions by 2050. Available at: https://www.reuters.com/business/sustainable-business/worlds-largest-miners-pledge-net-zero-carbon-emissions-by-2050-2021-10-05/.
Rubinstein, R. Y., and Kroese, D. P. (2016). Simulation and the Monte Carlo method. China: John Wiley and Sons.
Schluse, M., Priggemeyer, M., Atorf, L., and Rossmann, J. (2018). Experimentable digital twins—streamlining simulation-based systems engineering for industry 4.0. IEEE Trans. industrial Inf. 14 (4), 1722–1731. doi:10.1109/tii.2018.2804917
Shropshire, D. E., Black, G., and Araújo, K. (2021). Global market analysis of microreactors. Idaho Falls, ID: Idaho National Lab.(INL. (United States)).
Stewart, W. R., and Shirvan, K. (2021). TIMCAT hosted nuclear cost estimation tool (NCET). Available at: https://github.com/mit-crpg/TIMCAT.
Stewart, W. R., and Shirvan, K. (2022). Capital cost estimation for advanced nuclear power plants. Renew. Sustain. Energy Rev. 155, 111880. doi:10.1016/j.rser.2021.111880
Tao, F., Qi, Q., Wang, L., and Nee, A. (2019). Digital twins and cyber–physical systems toward smart manufacturing and industry 4.0: correlation and comparison. Engineering 5 (4), 653–661. doi:10.1016/j.eng.2019.01.014
The Gordian Group Inc (2021). City cost Indexes - V2. Available at: https://www.rsmeans.com/media/wysiwyg/quarterly_updates/2021-CCI-LocationFactors-V2.pdf.
Tuegel, E. J., Ingraffea, A. R., Eason, T. G., and Spottswood, S. M. (2011). Reengineering aircraft structural life prediction using a digital twin. Int. J. Aerosp. Eng. 2011, 1–14. doi:10.1155/2011/154798
Yadav, V., Agarwal, V., Gribok, A. V., Hays, R. D., Pluth, A. J., Ritter, C. S., et al. (2021a). Technical challenges and gaps in digital-twin-enabling technologies for nuclear reactor applications. Idaho Falls, Idaho, USA: Idaho National Laboratory.
Yadav, V., Agarwal, V., Jain, P., Ramuhalli, P., Zhao, X., Ulmer, C., et al. (2023). State-of-Technology and technical challenges in advanced sensors, instrumentation, and communication to support digital twin for nuclear energy application.
Yadav, V., Wells, A., Pope, C. L., Andrus, J. P., Chwasz, C. P., Trask, T., et al. (2022). Regulatory considerations in use of digital twin for nuclear reactor application. Idaho Falls, ID: Idaho National Laboratory (INL. (United States)).
Keywords: digital twin, remote operation, economics, microreactor, fission battery
Citation: Bryan HC, Jesse KW, Miller CA and Browning JM (2023) Remote nuclear microreactors: a preliminary economic evaluation of digital twins and centralized offsite control. Front. Nucl. Eng. 2:1293908. doi: 10.3389/fnuen.2023.1293908
Received: 13 September 2023; Accepted: 29 November 2023;
Published: 21 December 2023.
Edited by:
Wenxi Tian, Xi’an Jiaotong University, ChinaCopyright © 2023 Bryan, Jesse, Miller and Browning. This is an open-access article distributed under the terms of the Creative Commons Attribution License (CC BY). The use, distribution or reproduction in other forums is permitted, provided the original author(s) and the copyright owner(s) are credited and that the original publication in this journal is cited, in accordance with accepted academic practice. No use, distribution or reproduction is permitted which does not comply with these terms.
*Correspondence: Haydn C. Bryan, aGF5ZG4uYnJ5YW5AaW5sLmdvdg==