 Leonid Burakovsky
 Scott D. Ramsey
94% of researchers rate our articles as excellent or good
Learn more about the work of our research integrity team to safeguard the quality of each article we publish.
Find out more
ORIGINAL RESEARCH article
Front. Nucl. Eng., 03 January 2024
Sec. Nuclear Materials
Volume 2 - 2023 | https://doi.org/10.3389/fnuen.2023.1215418
This article is part of the Research TopicStructures and Properties of Fluorite-related Systems for Nuclear ApplicationsView all 6 articles
As UO2 is easily oxidized during the nuclear fuel cycle it is important to have a detailed understanding of the structures and properties of the oxidation products. Experimental work over the years has revealed many stable uranium oxides including UO2, U4O9 (UO2.25), U3O7 (UO2.33), U2O5 (UO2.5), U3O8 (UO2.67), and UO3, all with a number of different polymorphs. These oxides are broadly split into two categories, fluorite-based structures with stoichiometries in the range of UO2 to UO2.5 and less dense layered-type structures with stoichiometries in the range of UO2.5 to UO3. While UO2 is well characterized, both experimentally and computationally, there is a paucity of data concerning higher stoichiometry oxides in the literature. In this work we determine the ambient melting points of all the six stoichiometric uranium oxides listed above and compare them to the available experimental and/or theoretical data. We demonstrate that a family of the six ambient melting points map out a solid-liquid transition boundary consistent with the high-temperature portion of the phase diagram of uranium-oxygen system suggested by Babelot et al.
Nuclear fuels are almost exclusively actinide-based, with thorium, uranium and plutonium being the most common elements used to provide the fissile material. Of the three, the most abundant substance is uranium, a relatively common mineral in the Earth’s crust, which occurs in low concentrations in most rocks, soils and sea water, while it is primarily found in uraninite or pitchblende deposits. Uranium exists in U4+, U5+, and U6+ oxidation states when in combination with oxygen, thus UO2 forms the lowest available stoichiometry and UO3 the highest. However, as shown in Figure 1, the uranium-oxygen system is complex, with a large number of intermediate oxides between these two compositions and a number of different polymorphs at each stoichiometry. These include U4O9 and U3O7, which are closely related to the cubic fluorite structure of UO2, as well as U3O8 and UO3 which adopt distinct layered-type structures. Bridging the gap between these is U2O5 reported to have a mixture of fluorite-type and layered-type polymorphs. Over the years a considerable body of research has amassed that deals with fluorite structured UO2, due to its role as the primary fuel material in nuclear reactors. However, the literature is lacking on fundamental research into the higher uranium oxides which also play crucial roles in the fuel cycle and, in the case of both U3O8 and UO3, could soon be used as fuels themselves (Hopper et al., 2002). Although more work is starting to emerge on these two materials, there is still a significant paucity of data on the less stable U4O9, U3O7 and U2O5 oxides, which could provide valuable insight into the process of oxidation in UO2 and fluorite-based structures. Thus, there is broad scope for more detailed investigation of the different polymorphs at each stoichiometry to improve our understanding of their structures and properties.
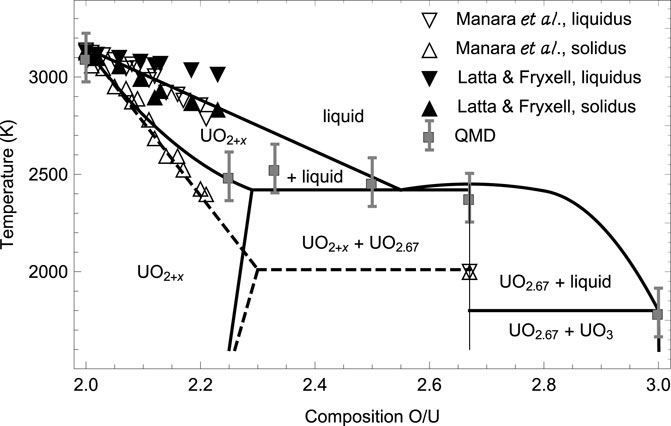
FIGURE 1. The high-temperature portion of the phase diagram of the U-O system from Babelot et al. (1986) (solid lines) subsequently modified by Manara et al. (2005) (dashed lines) vs. both the experimental data of Manara et al. (2005), Latta and Fryxell (1970), and the QMD melting simulations of this work.
A systematic study of the phase diagrams of light actinide oxides was initiated at Los Alamos National Laboratory in 2017, and considerable progress has been made since then. Specifically, the melting curves of all the six stable stoichiometric uranium oxides, UO2, U4O9, U3O7, U2O5, U3O8 and UO3, were calculated using ab initio quantum molecular dynamics (QMD) simulations implemented with VASP (Vienna Ab initio Simulation Package), as well as one complete phase diagram in one case (UO2). Some information on the location of solid-solid phase boundaries has been generated in a few other cases. This study is in progress, and its results will be reported elsewhere as they become available. In this work we present the systematics of the ambient melting temperatures of the stoichiometric uranium oxides. This systematics is aimed at bridging a gap between different versions of the ambient phase diagram of uranium-oxygen system. The determination of the phase-transition boundaries for the U-O system is of great importance in the nuclear industry. Knowledge of the melting transition in the nuclear fuel is particularly important in the analysis of hypothetical meltdown accidents, as it defines the structural limit of a combustible element. Moreover, due to a possible failure of the cladding during an accident, the fuel could come into contact with the coolant. If the latter is water, as in most reactors, strongly oxidizing conditions can be produced, under which the oxygen content of the fuel can be significantly increased. Hence, a precise knowledge of the fuel melting point dependence on the oxygen content is also of primary importance for the analysis of hypothetical mishaps.
Although a number of stable stoichiometric U-O compounds can be formed, only three of them are prevalent: UO2, U3O8 and UO3. U3O8 is the first isolatable layered oxide; all of the fluorite-type ones, U4O9, U3O7 and U2O5 oxidize and convert to U3O8 over time, or disproportionate to UO2 + U3O8 depending on the conditions. U3O8 is commonly produced from UO2 oxidation as a kinetically controlled product (Rousseau et al., 2006), via the reaction 3 UO2 + O2 → U3O8, but can also be formed from reduction of UO3 at high T (Wen et al., 2013), via 6 UO3 → 2 U3O8 + O2. UO3, the third prevalent uranium oxide, as a thermodynamically controlled product (Loopstra et al., 1977). Assuming that it is dominated by these three stable prevalent oxides, the high-T portion of the phase diagram of the U-O system was modeled by Babelot et al. (1986) and is shown in Figure 1. Specifically, the values of the ambient congruent melting points of U3O8 and UO3 obtained in 5) are 2450 K and 1800 K, respectively. The only available corresponding experimental datum is that for U3O8 (as UO2.66), 2010 ± 100 K (Manara et al., 2005),
In this work we present the results of ab initio quantum molecular dynamics (QMD) simulations on the ambient melting points of all the six stable stoichiometric uranium oxides. As already mentioned above, at high T the three fluorite-type oxides oxidize and decompose, which makes the corresponding high-T melting experiments very challenging. Another factor contributing to difficulty with high-T experiments is the sensitivity of the corresponding stoichiometry to oxygen content in the atmosphere and (most importantly) the lack of inert (unreactive) container material. For this reason, experimental melting results of 6) may not be accurate enough. In contrast, computer simulations are free from these difficulties: any stoichiometric (as well as non-stoichiometric) oxide can be simulated and studied as regards its thermal stability, melting curve (including the ambient melting point as the starting point of its melting curve), relative solid-solid phase stability, etc.
The ambient melting points the systematics of which is presented in this work should be understood as the starting (zero pressure) points of the corresponding melting curves. Each melting curve has been calculated using the Z method implemented with VASP. The Z method was developed in Refs. (Belonoshko et al., 2006; Belonoshko et al., 2008), and its practical use is described in detail in (10). In each case, the electronic structure of U was represented by [Xe 4f14 5d10] 5f3 6s2 6p6 6d1 7s2 (14 valence electrons), and that of O by [He] 2s2 2p4 (6 valence electrons). Localization of the f-electrons of U was achieved by using the DFT + U methodology (Dorado et al., 2009) following the Dudarev scheme (Dudarev et al., 1998a) for which only the difference in the values of Hubbard coefficients U and J matters rather than each of them individually. The use of DFT + U methodology to achieve f-electron localization prevents the appearance of delocalized f-electrons which would have resulted in non-integer uranium oxidation states, a nonphysical result considering recent experimental observations (Kvashnina et al., 2013). We used the generalized gradient approximation (GGA) with the Perdew-Burke-Ernzerhof (PBE) exchange-correlation functional (Perdew et al., 1996). Of all the GGA formulations that we tried for UO2, PBEsol + U predicts lattice parameters closest to experiment, while PBE + U gives the formation energy (Eform) closest to experiment. PBE (with no Hubbard coefficients) overestimates Eform by almost 1.5 eV, PBE + U underestimates by
The proper choice of U is also important for the system under consideration to have the correct physical properties: the FM, AFM, or NM ground state, the values of the magnetic moment per atom and the band gap in agreement with experiment, the correct lattice constant (or density), etc. We used the occupation matrix control (OCM) method which allows one to study the physical properties of systems of either of the three magnetic states as a function of U. OCM for VASP was suggested by (Allen and Watson, 2014) and has become available in VASP starting with the version vasp5.3.5. (Our present study was carried out using vasp5.4.4.) Its use for both UO2 and PuO2 was very recently demonstrated by Chen and Kaltsoyannis (2022). Employing their approach, we studies the properties of UO2 as a function of U using the Dudarev scheme (which is equivalent to U–J in the standard DFT + U formulation). In this case, imposing (Chen and Kaltsoyannis, 2022) i) the AF ground state, ii) magnetic moment of 1.8 μB, iii) the ground state lattice constant of 5.470 Å, and iv) the band gap of 2.25 ± 0.25 eV leads to (in eV) i)
In each of the six cases of the stoichiometric uranium oxides considered here, we first prepared the suprecell that was used for melting simulations with the Z method. The supercell was prepared by relaxing the solid structure that the corresponding uranium oxide melts from, with the convergence of total energy to 10–6 eV/atom and that of Hellmann-Feynman forces on each atom to 0.01 eV/Å. Size of the supercell varied from
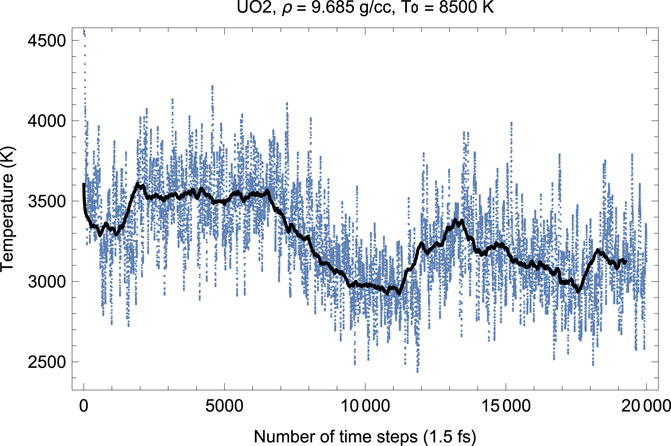
FIGURE 2. Time evolution of temperature in the Fm
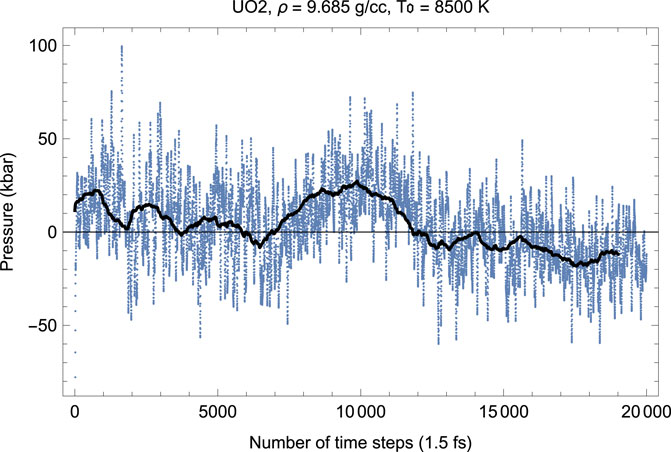
FIGURE 3. The same as in Figure 2 for the time evolution of pressure (in kbar; 10 kbar = 1 GPa).
Thus, the results of our QMD simulations of the ambient Tm are expected to be quite accurate overall. Now we discuss these results in more detail for each of the six stoichiometric uranium oxides.
In contrast to UO2 for which crystallographic data exist in the entire T range from 0 to Tm (Christensen, 1963; Hutchings, 1987; Guthrie et al., 2016), the literature discussing the thermal expansion of other stoichiometric uranium oxides is scarse and virtually non-existent. In any event, the temperature extent of the crystallographic data on higher-stoichiometry oxides that can be found in the literature is nowhere near the corresponding Tms. Information on the high-T crystallographic properties of these oxides can be found in Hoekstra et al. (1970). In the following, “ambient conditions” stand for p = 0 and the T at which the corresponding crystal structure is observed in experiment, according to Allen and Holmes (1995).
To test the validity of our approach to the melting of uranium oxides, we first determine the ambient melting point of uranium dioxide, which is known very reliably from numerous experimental studies.
UO2 maintains its ambient cubic fluorite structure (Fm
For the simulations of the melting curve of Fm
Before simulating this large 324-atom supercell, we first determine the supercell dimensions that correspond to P ∼ 0 at T ∼ 3000 K, by running a 96-atom (2 × 2 × 2) supercell. Although such a small supercell cannot be used for the simulations of Tm because of potential size effects, it is perfectly suited for test runs to estimate the dimensions of larger supercell for the actual simulations of Tm, and these test runs take very little computational time. In each of the remaining five cases we do similar test runs of small systems of 50–150 atoms to estimate the supercell dimensions that correspond to P ∼ 0 at T ∼ 2500–3000 K.
Figures 2, 3 show the melting run (Burakovsky et al., 2015) of Fm
As seen in Figures 2, 3, since the beginning of the run, after
Thus, the first drop in T (increase in P) corresponds to the activation of the oxygen flow. This process takes
UO3 is another example of a superionic transition preceding melting. As seen in Figures 6, 7 which show the time evolution of, respectively, T and P in this case, T drops and P increases after
We note that this signature of a superionic phase transition (drop in T/increase in P not accompanied by a complete lattice disorder) is observed in our QMD simulations on each of the six stoichiometric uranium oxides. In some cases approach to melting may include a number of (small) decreases in T and increases in P. In any event, only after we make sure every atom in the computational cell is mobile, we associate the corresponding state of the simulated system with liquid and identify the corresponding P-T melting conditions. The mobility of the whole lattice can be easily verified by looking at a file containing the coordinates of all the atoms after every time step of a QMD run (XDATCAR file in VASP). Atoms moving around their equilibrium lattice nodes correspond to a quasi-static lattice, or one of its sub-lattices, while those flowing further away from their equilibrium lattice nodes are associated with a state of disorder. True melting corresponds to the state of disorder of the whole system.
We now switch to the determination of the melting points of the remaining five stoichiometric uranium oxides. We will show two additional examples of the time evolution of T and P in the corresponding QMD run, namely, the cases of U3O8 and UO3, two of the three prevalent uranium oxides, including UO2.
The high-T solid structure of U4O9 is β-U4O9, with cubic I-43d structure which is associated with a 4 × 4 × 4 expansion of the parent UO2 cubic fluorite cell. At ambient conditions β-U4O9 has ρ = 11.3 g/cm3, a = b = c = 5.438 Å (Allen and Holmes, 1995).
There is a difficulty with simulating β-U4O9 using QMD because its unit cell contains 832 atoms (64 formula units), so to simulate even the unit cell itself takes prohibitevely long. To finesse this difficulty, we chose to use the approach adopted by Andersson et al. (2009) which consists in adding oxygen to a UO2 supercell as interstitial defects to ensure the correct stoichiometry. The approach uses a clustering model based on split interstitial clusters (Andersson et al., 2009) that correspond to the most stable configuration. As it turns out, a smaller 48-atom unit cell (2 × 2 × 1) UO2 supercell) with the appropriate number of oxygen interstitials reproduces the basic physical properties of β-U4O9 correctly. Thus, a 768-atom (2 × 2 × 4) supercell with 64 oxygen interstitials was used, for a total of 832 atoms (64 formula units).
In our QMD simulations, at the ambient melting point of 2490 K, β-U4O9 has ρ = 10.2 g/cm3, lattice constant 5.63 Å.
It is interesting to compare our findings to Ref. (Grønvold, 1955) in which the thermal expansion of U4O9 is studied to 960 °C (1233 K). According to (Grønvold, 1955), the lattice constant of β-U4O9 increases linearly from 86°C to 960°C with a linear expansion coefficient of α = 11.6 ⋅ 10–6°C−1. We then expect that the specific volume as a function of T exhibits nearly linear behavior V(T) = V (300) (1 + β (T − 300), with β ≈ 3α ≃ 3.5 ⋅ 10–5°C−1. Then, ρ(T) can be approximated by [ρ(300) = 11.3 g/cm3) ρ(T) = ρ(300) (1 − β (T − 300)] which, with Tm = 2490 ± 125 K, gives ρ(Tm) ≈ 10.4 g/cm3, consistent with our value of 10.2. The above formula gives 10.2 with β ≃ 4.5 ⋅ 10–5°C−1, which implies that the actual high-T thermal expansion is faster than linear (e.g., quadratic). In fact, the presence of quadratic, and even high-order terms in the powers of T is not unusual; for example, for UO2 between 0°C and 2800°C (3073 K) V(T) = V (0) (1 + 9 ⋅ 10–6 T + 6 ⋅ 10–9 T2 + 3 ⋅ 10–12 T3) (Christensen, 1963).
The high-T solid structure of U3O7 is β-U3O7, with tetragonal I-42d structure which represents tetragonally distorted cubic fluorite. At ambient conditions it has ρ = 11.5 g/cm3 (the highest of all the six stoichiometric uranium oxides), a = b = 5.363 Å, c = 5.531 Å (Allen and Holmes, 1995).
As for U4O9, the unit cell of β-U3O7 is prohibitely large to simulate using DFT-based methods, so the defective supercell approach used for U4O9 was employed once again. In this case, a 36-atom unit cell (3 × 1 × 1 UO2 supercell) with the appropriate number of oxygen interstitials reproduces the basic physical properties of β-U3O7 correctly. Since this unit cell only features a double layer of U and O atoms in two dimensions, a concern of possible (size) effects due to small periodic boundary conditions is eliminated by the proper choice of a supercell for QMD simulations. Thus, a 720-atom (2 × 2 × 5 times 36-atom UO2) supercell with 80 oxygen interstitials was used, for a total of 800 atoms (80 formula units).
In our QMD simulations, at the ambient melting point of 2530 K, β-U3O7 has ρ = 10.3 g/cm3, a = b = 5.56 Å, c = 5.74 Å.
The high-T solid structure of U2O5 is δ-U2O5, orthorhombic Pnma structure with 22 formula units per unit cell. At ambient conditions it has ρ = 8.4 g/cm3, a = 8.29 Å, b = 31.71 Å, c = 6.73 Å.
The same difficulty exists with simulating δ-U2O5 using QMD as for both β-U4O9 and β-U3O7 discussed above, which we overcame the following way this time. As a careful analysis by Molinari et al. (2017) reveals, the structure of δ-U2O5 simulated using PBE + U closely resembles the oxygen-deficient α-U3O8. The latter also has orthorhombic structure, a = 6.715 Å, b = 11.96 Å, c = 4.146 Å at ambient conditions (Allen and Holmes, 1995), with 22 atoms (2 formula units) per unit cell. Thus, δ-U2O5 was simulated as a 660-atom (3 × 2 × 5) α-U3O8 supercell with 30 oxygen atoms taken away to ensure the correct stoichiometry, for a total of a 630-atom δ-U2O5 supercell (180 U + 450 O, 90 formula units).
In our QMD simulations, at the ambient melting point of 2460 K, δ-U2O5 has ρ = 7.57 g/cm3, a = 8.5 Å, b = 32.8 Å, c = 7.0 Å.
The high-T solid structure of U3O8 is β-U3O8 which is orthorhombic (Cmcm) with 44 atoms (4 formula units) per unit cell; at ambient conditions ρ = 8.325 g/cm3, a = 7.07 Å, b = 11.45 Å, c = 8.30 Å (Allen and Holmes, 1995). For the corresponding melting simulations, a 792-atom (3 × 2 × 3) supercell was used.
Figures 4, 5 show the melting run of β-U3O8 at a density of 7.55 g/cc. It is seen that P equilibrates at zero, and T at ≈ 2380 K. Thus, the U3O8 ambient melting point is 2380 K, at which ρ = 7.55 g/cm3, a = 7.3 Å, b = 11.8 Å, c = 8.6 Å.
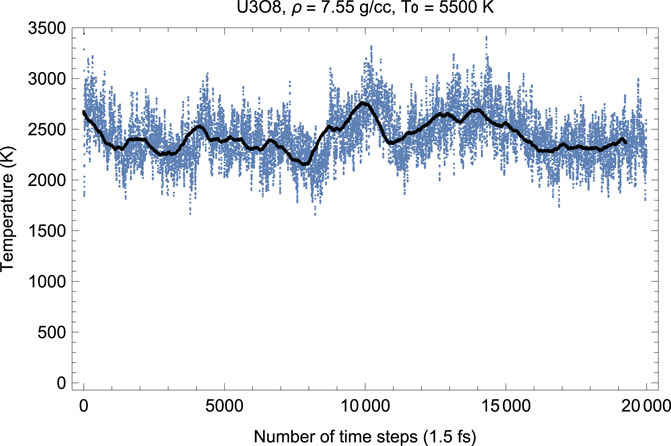
FIGURE 4. Time evolution of temperature in the β-U3O8 melting run at ρ = 7.55 g/cc; the initial temperature is 5,500 K.
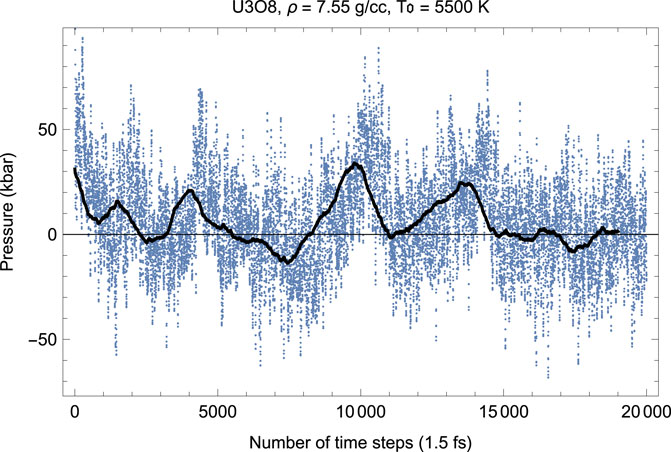
FIGURE 5. The same as in Figure 4 for the time evolution of pressure (in kbar; 10 kbar = 1 GPa).
We note that, taking into account Tm uncertainty, 2340 ± 125 K is consistent with 2450 K predicted theoretically by (Babelot et al., 1986).
The high-T solid structure of UO3 is δ-UO3 which is cubic (Pm
In our QMD simulations, at the ambient melting point UO3 has ρ = 5.81 g/cm3, lattice constant 4.34 Å.
Figures 6, 7 show the melting run of δ-UO3 at a density of 5.81 g/cc. It is seen that P equilibrates at
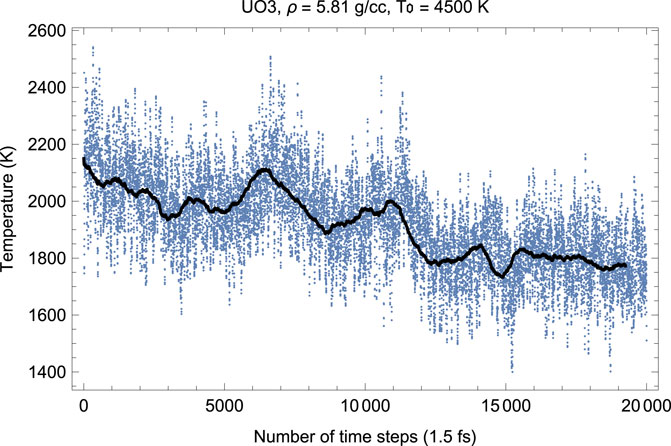
FIGURE 6. Time evolution of temperature in the δ-UO3 melting run at ρ = 5.81 g/cc; the initial temperature is 4,500 K.
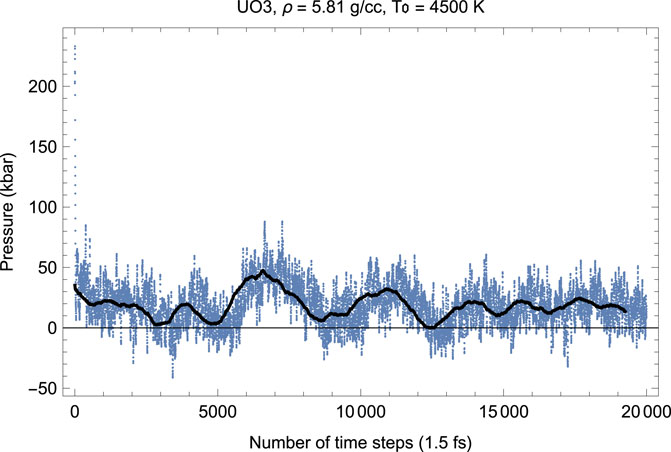
FIGURE 7. The same as in Figure 6 for the time evolution of pressure (in kbar; 10 kbar = 1 GPa).
The findings of our work are summarized in Table 1.
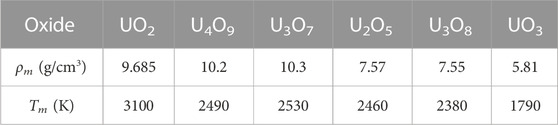
TABLE 1. The ambient melting points of the six stoichiometric uranium oxides, along with the corresponding ambient melting densities, ρm, obtained from the ab initio Z method implemented with VASP. The error bars of Tm are ± 125 K in each case.
As Figures 2–7 clearly demonstrate, although the Z-method simulations of uranium oxides exhibit some basic features of those of monatomic substances, e.g., during melting T goes down while P goes up, unlike the case of a monatomic substance, the plots of the time evolution of T and P are not exact mirror images of each other (for a monatomic substance, they are exact mirror images of each other because they oscillate in anti-phase and their oscillations are of similar amplitudes since the total energy, ∼ P V + kB T, is conserved). Moreover, comparison of the corresponding pairs of the plots of the time evolution of T and P show that over some intervals of running time both T and P increase (or decrease). For example, in Figures 2, 3 for UO2 both T and P increase over the 15,500–17,500 interval of running time. Let us dwell upon this issue in some more detail.
Upon the comletion of the superionic transition, the system consists of two subsystems: the fast one (“f”) composed of light (oxygen) ions, and the slow one (“s”) composed of heavy (uranium) ions. As such, the total energy of the system if E = Ef + Es; Ef ∼ PfVf + kBTf, Es ∼ PsVs + kBTs. In a general case, the temperature and pressure of such a complex system is T = tfTf + tsTs and P = pfPf + psPs, where the weights tf, ts, pf and ps depend on the corresponding equations of state, the ionic mass ratio, etc. During the equilibration stage Tf → Ts → T and Pf → Ps → P. However, the corresponding time evolution of T and P is directly related to the time evolution of, respectively, Tf and Ts, and Pf and Ps which, in turn, depend on the corresponding weights tf and ts, and pf and ps. Thus, it is in principle possible that during the equilibration stage T and P go up or down in anti-phase, as well as that T and P increase or decrease simultaneously. But in our QMD simulations, the effect of a simultaneous T-P increase/decrease may be an artifact related to the size of the computational cell. Based on general grounds, we expect this effect to depend on the P-T balance for the fast subsystem which may be shifted towards P for a smaller system. Indeed, for a smaller supercell, the VASP periodic boundary conditions introduce additional “walls” inside the bulk of a system, which enhances Pf, in the assumption that the fast subsystem is approximated by a liquid or gas taking the entire system volume. With increasing size of the supercell, these additional “walls” will gradually disappear; correspondingly, the effect itself will diminish and eventually disappear altogether.
To test this hypothesis, we carried out another suite of QMD simulations of UO2 in cubic fluorite structure choosing a larger 4 × 4 × 5 supercell of 960 atoms (320 U plus 640 O). Choosing a larger supercell is unfeasible, since for the 960-atom system the corresponding total number of valence electrons is Ne = 8320, on the verge of the current VASP capability of 104 atoms; VASP simulations of systems with larger Ne become virtually endless. Figures 8, 9 demonstrate, respectively, the time evolution of T and P of this system. As clearly seen in these figures, i) the effect of a simultaneous T-P increase/decrease is now absent, and ii) the plots of T and P are virtually the mirror images of each other. In other words, increasing the size of the computational cell virtually eliminates the effects related to the appearance of a fast subsystem. Finally, we note that the numerical value of the ambient Tm for a larger system is virtually identical to that for a smaller system (i.e.,
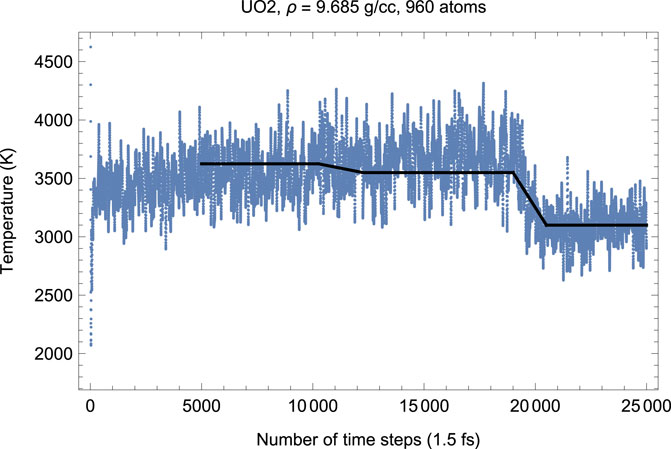
FIGURE 8. Time evolution of temperature in the Fm
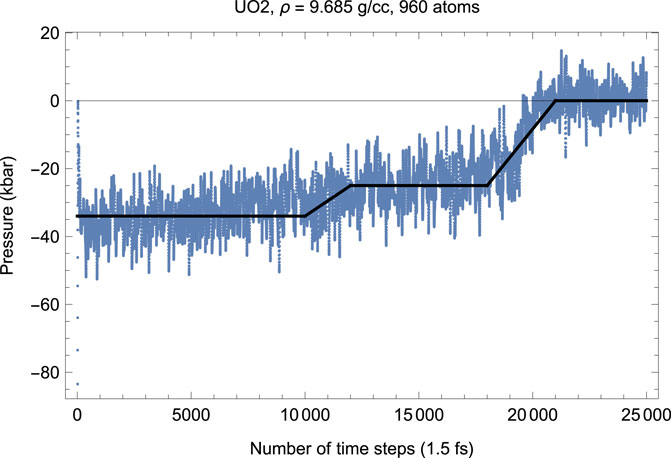
FIGURE 9. The same as in Figure 8 for the time evolution of pressure (in kbar; 10 kbar = 1 GPa).
Another point, worth of dwelling upon, is the discrepancy between our theoretical results and some experimental results, e.g., those of (Manara et al., 2005), as well as the discrepancy between different experimental results themselves, e.g., those of (Manara et al., 2005; Latta and Fryxell, 1970), as seen in Figure 1. The possible explanation for this discrepancy that readily suggests itself is the oxidation of the original substance, in terms of the accommodation of additional oxygen atoms (interstitial defects) in the crystal lattice of the original structure during experiments which may influence their outcome. To characterize this effect quantitatively, a through theoretical study of the oxydation process is required which goes far beyond the scope of our work. Specifically, at low concentrations these defects take the form of single oxygen atoms, however, as more oxygen is added to the original lattice, the defects aggregate to form clusters, such that the knowledge of the clustering scheme is required for the quantitative characteristics of the discrepancy between the theoretical and experimental melting points.
Thorough combined experimental and theoretical studies of the factors that may be responsible for the observed discrepancies in the values of Tm in different experiments were recently conducted by two research groups (Efipano et al., 2020; Fouquet-Métivier et al., 2023). In (35) the melting behavior of americium-uranium MOX under different atmospheres was investigated, and it was concluded that uranium-rich samples melt at temperatures significantly lower (around 2700 K) when they are laser-heated in a strongly oxidizing atmosphere (compressed air) compared to the melting points (beyond 3000 K) registered for the same compositions in an inert environment (pressurised Ar). This behavior was interpreted on the basis of the strong oxidation of such samples in air, leading to lower Tms in the corresponding experiments. The results of 6) shown in Figure 1 are obtained using laser heating in pressurized (up to 300 MPa) atmosphere aimed at suppressing as much as possible the evaporation from the heated surface. In (36) the phase diagram of U-Pu-O system was studied. For uranium-rich samples, strong interaction with tungsten crucibles, and some interaction with rhenium crucibles was detected which explains why lower Tms are systematically obtained using thermal arrest technique used in older experiments. The results of (7) shown in Figure 1 are obtained using this technique. The influence of the atmosphere in the laser heating tests was also highlighted. Specifically, uranium-rich samples tend to oxidize in air, which leads to a progressive decrease of the corresponding Tms, and those that result from melting in argon atmosphere were recommended as more reliable.
Here we briefly summarize the main results of this work.
We have calculated the ambient melting points of the six stable stoichiometric uranium oxides via ab initio QMD simulations using the Z method implemented with VASP. The six melting points are listed in Table 1, along with the corresponding ambient melting densities. Because experimental values of the ambient melting densities are not available in the literature yet, our theoretical results should serve as a guideline for future experiments.
Both the melting transition and the superionic transition preceding melting can be characterized quantitatively in each of the six cases of QMD simulations.
The ab initio ambient melting points of the three prevalent uranium oxides, UO2, U3O8 and UO3, obtained in our work are in good agreement with the corresponding experimental and/or theoretical data. Those of the remaining three, U4O9, U3O7 and U2O5, as well as that of U3O8, can be assigned a common value of 2465 ± 65 K. This is consistent with the 3-phase (horizontal) equilibrium line on the U-O phase diagram at 2450 K shown in Figure 1. This figure clearly demonstrates that a family of the six ambient melting points map out a solid-liquid transition boundary consistent with the high-temperature portion of the phase diagram of uranium-oxygen system suggested by Babelot et al. (1986) rather than that of Manara et al. (2005).
In view of our findings of the values of the congruent melting points of the three less prevalent stoichiometric uranium oxides, the uranium-oxygen phase digram shown in Figure 1 should be reconsidered appropriately. This will be discussed in more detail in one of our future publications.
The original contributions presented in the study are included in the article, further inquiries can be directed to the corresponding author.
Methodology: LB, SR, and RB; investigation (QMD simulations): LB, writing–original draft preparation: LB; writing–review and editing: SR and RB; project administration: RB; funding acquisition: SR. All authors contributed to the article and approved the submitted version.
This research was carried out under the auspices of the US DOE/NNSA.
The QMD simulations have been performed on the LANL cluster Badger as part of the Institutional Computing projects w20−phadiagurox and w22−phadiagractox.
The authors declare that the research was conducted in the absence of any commercial or financial relationships that could be construed as a potential conflict of interest.
All claims expressed in this article are solely those of the authors and do not necessarily represent those of their affiliated organizations, or those of the publisher, the editors and the reviewers. Any product that may be evaluated in this article, or claim that may be made by its manufacturer, is not guaranteed or endorsed by the publisher.
Allen, G. C., and Holmes, N. R., A mechanism for the UO2 to α-U3O8 phase transformation. Journal of Nuclear Materials, 1995, 223(3), 231–237. doi:10.1016/0022-3115(95)00025-9
Allen, J. P., and Watson, G. W. (2014). Occupation matrix control of d- and f-electron localisations using DFT + U. Phys. Chem. Chem. Phys. 16, 21016–21031. doi:10.1039/c4cp01083c
Andersson, D. A., Lezama, J., Uberuaga, B. P., Deo, C., and Conradson, S. D. (2009). Cooperativity among defect sites in AO2+x and A4O9 (A=U,Np,Pu): density functional calculations. Phys. Rev. B 79, 024110–024112. doi:10.1103/physrevb.79.024110
Babelot, J.-F., Ohse, R. W., and Hoch, M. (1986). The system U-UO3: phase diagram and oxygen potential. J. Nucl. Mater. 137 (2), 144–153. doi:10.1016/0022-3115(86)90044-9
Belonoshko, A. B., Burakovsky, L., Chen, S. P., Johansson, B., Mikhaylushkin, A. S., Preston, D. L., et al. (2008). Molybdenum at high pressure and temperature: melting from another solid phase. Phys. Rev. Lett. 100, 135701. doi:10.1103/physrevlett.100.135701
Belonoshko, A. B., Skorodumova, N. V., Rosengren, A., and Johansson, B. (2006). Melting and critical superheating. Phys. Rev. B 73, 012201. doi:10.1103/physrevb.73.012201
Burakovsky, L., Burakovsky, N., and Preston, D. L. (2015). Ab initio melting curve of osmium. Phys. Rev. B 92, 174105–174107. doi:10.1103/physrevb.92.174105
Chen, J.-L., and Kaltsoyannis, N. (2022). DFT + U Study of uranium dioxide and plutonium dioxide with occupation matrix control. J. Phys. Chem. C 126, 11426–11435. doi:10.1021/acs.jpcc.2c03804
Christensen, J. A. (1963). Thermal expansion and change in volume of uranium dioxide on melting. J. Am. Ceram. Soc. 46 (12), 607–608. doi:10.1111/j.1151-2916.1963.tb14628.x
Dorado, B., Amadon, B., Freyss, M., and Bertolus, M. (2009). DFT + U calculations of the ground state and metastable states of uranium dioxide. Phys. Rev. B 79, 235125–235125-8. doi:10.1103/physrevb.79.235125
Dorado, B., and Garcia, P. (2013). First-principles DFT + U modeling of actinide-based alloys: application to paramagnetic phases of UO2 and (U,Pu) mixed oxides. Phys. Rev. B 87, 195139. doi:10.1103/physrevb.87.195139
Dudarev, S. L., Botton, G. A., Savrasov, S. Y., Humphreys, C. J., and Sutton, A. P. (1998a). Electron-energy-loss spectra and the structural stability of nickel oxide: an LSDA+U study. Phys. Rev. B 57 (3), 1505–1509. doi:10.1103/physrevb.57.1505
Dudarev, S. L., Botton, G. A., Savrasov, S. Y., Szotek, Z., Temmerman, W. M., and Sutton, A. P. (1998b). Electronic structure and elastic properties of strongly correlated metal oxides from first principles: LSDA + U, SIC-LSDA and EELS study of UO2 and NiO. Phys. Stat. Sol. 166, 429–443. doi:10.1002/(sici)1521-396x(199803)166:1<429::aid-pssa429>3.0.co;2-f
Dworkin, A. S., and Bredig, M. A. (1968). Diffuse transition and melting in fluorite and antifluorite type of compounds. Heat content of potassium sulfide from 298 to 1260.degree.K. J. Phys. Chem. 72 (4), 1277–1281. doi:10.1021/j100850a035
Efipano, E., Prieur, D., Martin, P., Guéneau, C., Dardenne, K., Rothe, J., et al. (2020). Melting behaviour of uranium-americium mixed oxides under different atmospheres. J. Chem. Thermodyn. 140, 105896. doi:10.1016/j.jct.2019.105896
Fouquet-Métivier, P., Martin, P., Manara, D., Dardenne, K., Rothe, J., Fossati, P., et al. (2023). Investigation of the solid/liquid phase transitions in the U-Pu-O system. Calphad 80, 102523. doi:10.1016/j.calphad.2022.102523
Grønvold, F. (1955). High-temperature x-ray study of uranium oxides in the UO2-U3O8 region. J. Inorg. Nucl. Chem. 1, 357–370. doi:10.1016/0022-1902(55)80046-2
Guéneau, C., Baichi, M., Labroche, D., Chatillon, C., and Sundman, B. (2002). Thermodynamic assessment of the uranium–oxygen system. J. Nucl. Mater 304, 161–175. doi:10.1016/s0022-3115(02)00878-4
Guthrie, M., Benmore, C., Skinner, L., Alderman, O., Weber, J., Parise, J., et al. (2016). Thermal expansion in UO2 determined by high-energy X-ray diffraction. J. Nucl. Mater 479, 19–22. doi:10.1016/j.jnucmat.2016.06.042
Hoekstra, H. R., Siegel, S., and Gallagher, F. X. (1970). The uranium-oxygen system at high pressure. J. Inorg. Nucl. Chem. 32, 3237–3248. doi:10.1016/0022-1902(70)80206-8
Hopper, C. M., Petrie, L. M., Ott, L. J., and Parks, C. V. (2002). Design parameters for a natural uranium UO3- or U3O8-fueled nuclear reactor. ORNL/TM-2002/240, Oak Ridge, Tenn. doi:10.2172/814464
Hutchings, M. T. (1987). High-temperature studies of UO2 and ThO2 using neutron scattering techniques. J. Chem. Soc. Faraday Trans. 83, 1083. doi:10.1039/f29878301083
Kotani, A., and Yamazaki, T. (1992). Systematic analysis of core photoemission spectra for actinide di-oxides and rare-earth sesqui-oxides. Prog. Theor. Phys. Suppl. 108, 117–131. doi:10.1143/ptps.108.117
Kvashnina, K. O., Butorin, S. M., Martin, P., and Glatzel, P. (2013). Chemical state of complex uranium oxides. Phys. Rev. Lett. 111, 253002–253005. doi:10.1103/physrevlett.111.253002
Latta, R. E., and Fryxell, R. E. (1970). Determination of solidus-liquidus temperatures in the UO2+x system (−0.50 < x < 0.20). J. Nucl. Mater. 35 (2), 195–210. doi:10.1016/0022-3115(70)90100-5
Loopstra, B. O., Taylor, J. C., and Waugh, A. B. (1977). Neutron powder profile studies of the gamma uranium trioxide phases. J. Solid State Chem. 20 (1), 9–19. doi:10.1016/0022-4596(77)90046-9
Manara, D., Pflieger, R., and Sheindlin, M. (2005). Advances in the experimental determination of the uranium-oxygen phase diagram at high temperature. Int. J. Thermophys. 26 (4), 1193–1206. doi:10.1007/s10765-005-6711-y
Manara, D., Ronchi, C., Sheindlin, M., Lewis, M., and Brykin, M. (2010). Melting of stoichiometric and hyperstoichiometric uranium dioxide. J. Nucl. Mater. 342 (1-3), 148–163. doi:10.1016/j.jnucmat.2005.04.002
Molinari, M., Brincat, N. A., Allen, G. C., and Parker, S. C. (2017). Structure and properties of some layered U2O5 phases: a density functional theory study. Inorg. Chem. 56 (8), 4468–4473. doi:10.1021/acs.inorgchem.7b00014
Njifon, I. C., Bertolus, M., Hayn, R., and Freyss, M. (2018). Electronic structure investigation of the bulk properties of uranium-plutonium mixed oxides (U,Pu)O2. Inorg. Chem. 57, 10974–10983. doi:10.1021/acs.inorgchem.8b01561
Njifor, I. C., and Torres, E. (2020). Phonons and thermophysical properties of U1−yPuyO2 mixed oxide (MOX) fuels. J. Nucl. Mater 537, 152158.
Perdew, J. P., Burke, K., and Ernzerhof, M. (1996). Generalized gradient approximation made simple. Phys. Rev. Lett. 77 (18), 3865–3868. doi:10.1103/physrevlett.77.3865
Rousseau, G., Desgranges, L., Charlot, F., Millot, N., Niepce, J. C., Pijolat, M., et al. (2006). A detailed study of UO2 to U3O8 oxidation phases and the associated rate-limiting steps. J. Nucl. Mater. 355 (1-3), 10–20. doi:10.1016/j.jnucmat.2006.03.015
Vathonne, E., Wiktor, J., Freyss, M., Jomard, G., and Bertolus, M. (2014). DFT + U investigation of charged point defects and clusters in UO2. J. Phys. Condens. Mat. 26, 325501. doi:10.1088/0953-8984/26/32/325501
Wen, X. D., Martin, R. L., Scuseria, G. E., Rudin, S. P., Batista, E. R., and Burrell, A. K. (2013). Screened hybrid and DFT plus U studies of the structural, electronic, and optical properties of U3O8. J. Physics–Condensed Matter 25 (2), 025501–025510. doi:10.1088/0953-8984/25/2/025501
Keywords: actinide oxides, uranium oxides, phase diagram, quantum molecular dynamics, density functional theory
Citation: Burakovsky L, Ramsey SD and Baty RS (2024) Ambient melting behavior of stoichiometric uranium oxides. Front. Nucl. Eng. 2:1215418. doi: 10.3389/fnuen.2023.1215418
Received: 01 May 2023; Accepted: 06 December 2023;
Published: 03 January 2024.
Edited by:
Jacob Bair, Oklahoma State University, United StatesReviewed by:
Ashley E. Shields, Oak Ridge National Laboratory (DOE), United StatesCopyright © 2024 Burakovsky, Ramsey and Baty. This is an open-access article distributed under the terms of the Creative Commons Attribution License (CC BY). The use, distribution or reproduction in other forums is permitted, provided the original author(s) and the copyright owner(s) are credited and that the original publication in this journal is cited, in accordance with accepted academic practice. No use, distribution or reproduction is permitted which does not comply with these terms.
*Correspondence: Leonid Burakovsky, YnVyYWtvdkBsYW5sLmdvdg==
Disclaimer: All claims expressed in this article are solely those of the authors and do not necessarily represent those of their affiliated organizations, or those of the publisher, the editors and the reviewers. Any product that may be evaluated in this article or claim that may be made by its manufacturer is not guaranteed or endorsed by the publisher.
Research integrity at Frontiers
Learn more about the work of our research integrity team to safeguard the quality of each article we publish.