 Wolfgang Voigt
 Daniela Freyer
94% of researchers rate our articles as excellent or good
Learn more about the work of our research integrity team to safeguard the quality of each article we publish.
Find out more
REVIEW article
Front. Nucl. Eng., 21 September 2023
Sec. Radioactive Waste Management
Volume 2 - 2023 | https://doi.org/10.3389/fnuen.2023.1208582
This article is part of the Research TopicSolubility Phenomena in The Context of Nuclear Waste DisposalView all 10 articles
Anhydrite and gypsum are omnipresent in sedimentary rocks of all types. They occur as massive layers or are distributed within other geological formations as in clays. Understanding the conditions of formation and the stability of the hydrated and anhydrous form of calcium sulfate is crucial in an elucidation of the genesis of the geological formations envisaged as potential host rock for radioactive waste disposal. Estimations of the temperature, where gypsum is dehydrated to anhydrite in water vary between 30°C and 60°C. The extremely slow crystallization kinetics of anhydrite at T < 90°C prevents a direct determination of this transition temperature. In the present work the different approaches to fix this temperature are discussed. It is shown that careful assessment of solubility data and calorimetric measurements yields a transition temperature of 42°C ± 1°C. For results essentially deviating from this value methodic deficiencies are revealed and discussed. Thus, a long-standing discussion about the thermodynamic aspect of the gypsum-anhydrite conversion can be closed, not the kinetic part.
Calcium sulfate occurs in several forms: as dihydrate (mineral: gypsum), as hemi-hydrate (mineral: bassanite) and anhydrous (mineral: anhydrite). Anhydrite occurs for instance in the important Zechstein formation as “Hauptanhydrit” within evaporitic geological formations and is omnipresent in other sedimentary rocks like clays. The occurrence of the different forms of calcium sulfate in various environments can be an indication for certain processes in the genesis of the geological formation. Geochemists have to answer various questions as: are these minerals of primary or secondary origin? At which temperature they have been formed? Which remineralization reactions could form the mineral assembly found in the geological zone. Naturally, answers to these questions will be part of the safety assessment for a potential nuclear disposal in a geological host in rock salt or in clay.
The answer, how anhydrite could be formed at T < 50°C or 60°C is still open, since in the lab in time scales of years no primary precipitation has been observed. When saturating an aqueous solution with CaSO4 at ambient temperatures gypsum (CaSO4·2H2O) represents the thermodynamically stable phase. Enhancing the temperature at a certain point the anhydrous phase, anhydrite, becomes the stable phase and gypsum the metastable phase. The temperature, where both phases can co-exist represents the transition temperature. For this point the solubility of both phases is equal. The experimental difficulty to fix the transition temperature more accurate is caused by the very slow kinetics of crystallization and dissolution of anhydrite in water at T < 100°C.
In our review on crystallization and stability of CaSO4-containing phases (Freyer and Voigt, 2003) we summarized the various opinions on the transition temperature gypsum-anhydrite without critical assessing solubility and other data. Thus, a broad interval of 42°C–60°C was left for discussion.
In the mean-time a series of papers appeared related to the transition temperature gypsum-anhydrite. Krumgalz published a collection of solubility data of gypsum, anhydrite and hemi-hydrate of CaSO4 in water and performed empirical fits of the temperature dependence (Krumgalz, 2018). According to these equations the crossing-point of the gypsum and anhydrite solubility curve is at 45.6°C and m(CaSO4) = 0.01545 mol/kgw. Shen et al. (2019) assessed solubility data in the system CaSO4-H2O to establish a Pitzer model. Their solubility-based model gives the gypsum-anhydrite transition at 42.8°C. An electrolyte—NRTL model to describe the solubilities in the system CaSO4–H+-PO43−-SO42−-H2O was developed by Messnaoui and Bounahmidi (2006). Their model (adapted thermodynamic data of the CaSO4 phases) yield a transition temperature near 28°C (read off from their Figure 5). Berdugo et al. gave an extensive review of the phase diagram CaSO4–H2O covering most of the available literature without a conclusion to a preferred transition temperature gypsum-anhydrite (Berdugo et al., 2008). Van Driessche et al. (2011) while analyzing the possible growth rates of the giant gypsum crystals in the Naica mine (Mexico) assume a transition temperature of 58°C. Zeng et al. established thermodynamic models of the systems CaSO4–H2O and CaSO4-H2SO4–MSO4–H2O (M = Cu, Zn, Ni. Mn) within a temperature range of 25°C–90°C (Zeng and Wang, 2011; Wang et al., 2012; Wang et al., 2013). For the system CaSO4–H2SO4-H2O solubility data were determined for gypsum and anhydrite (Wang et al., 2013). According to their model the transition temperature is 41.8°C. A paper entitled “the gypsum—anhydrite paradox revisited” appeared in year 2014 (Ossorio et al., 2014). In this work kinetic experiments and arguments are discussed for finding primary anhydrite crystallized below 60°C in geological time scales.
The purpose of the following work is to fix the transition temperature gypsum-anhydrite as accurate as possible by re-assessing published solubility data in water and electrolyte solutions as well as calorimetric data.
The general Eq. 1 connects reaction quantities as the standard Gibbs energy
For the gypsum-anhydrite conversion reactions (I–III) are of interest.
Reactions (II) and (III) represent the solubility constants of anhydrite (Eq. 2) and gypsum (Eq. 3).
with mi and γ± the corresponding molalities and mean activity coefficients. Combining Eqs 2, 3 yields the equilibrium constant
Applying these equations several strategies can be derived to determine the conditions (T, solution composition) for the simultaneous solubility equilibrium of gypsum and anhydrite (I).
The most widely applied method represents the determination of the solubility of anhydrite and gypsum in dependence on temperature in pure water within the stable and metastable region. At the temperature, where the two solubility curves cross each other the constants
In electrolyte solutions the transition temperature will decrease, since aw < 1. This is easily shown by combining Eqs 1, 4 and solving for T (Eq. 4a). The standard data
are independent on electrolyte composition and ln(aw) becomes negative. Thus, a positive value is added in the denominator, which requires a reduced T to maintain equality in Eq. 4a. The crossing-point of the solubility curves of gypsum and anhydrite as a function of electrolyte concentration at T < T (transition, water) yields the electrolyte concentration, where at the chosen temperature both solids are in equilibrium. If the water activity is known at the given electrolyte concentration and solution temperature then through Eq. 4a a relation between water activity and transition temperature can be established. The relation is independent on the type of electrolyte.
At the transition temperature in pure water or dilute solutions the water aw can be set to 1.0, which according to Eq. 4 gives
The right-hand side contains only quantities, which can be determined calorimetrically and thus are independent on kinetics of crystallization. When the reaction enthalpy and entropy of reaction (I) are determined as function of T, then through Eq. 5 the Ttrans can be calculated.
A diversity of thermodynamic and equilibrium data can be combined using an activity model within a framework of Eqs 1–4. The success depends on an appropriate data assessment and a compromise between number of adjustable parameters and accuracy of data description.
In Table 1 references are listed in which the transition temperature was predicted using the different methods.
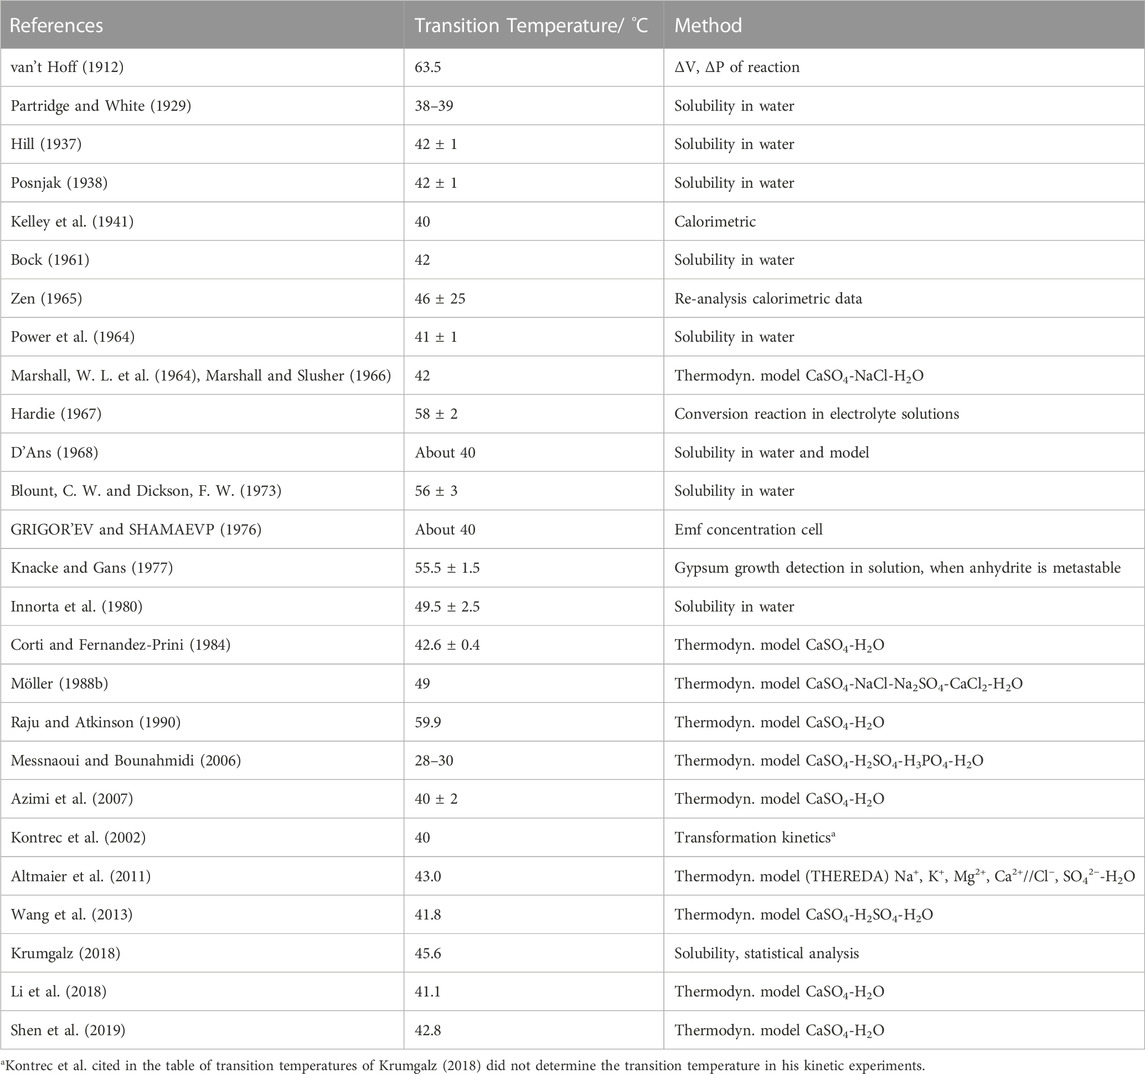
TABLE 1. Methods applied in estimation of the transition temperature gypsum-anhydrite.
The most direct way to determine the transition temperature is to determine experimentally the solubility of gypsum and anhydrite in dependence on temperature. Due to the slow kinetics of anhydrite crystallization gypsum can exist metastable for long time in aqueous suspension considerable above the transition temperature. Vice versa anhydrite can exist metastable below the transition temperature due to low rates of gypsum nucleation under conditions of not too high supersaturation (Lancia et al., 1999; Fu et al., 2012; Otalora and Garcia-Ruiz, 2014). Thus, the determination of the crossing point is experimentally feasible. The more difficult part in such an investigation represents the solubility curve of anhydrite. In water below 80°C it is practically not possible to achieve saturation by crystallizing anhydrite from a supersaturated solution. Saturating water by dissolving anhydrite is also a slow process. Thus, the experimenter is not sure whether saturation was reached or not after a certain time. Other factors are also important for the observed solubility values of anhydrite, these are:
■ Purity of natural anhydrite
■ Preparation method of anhydrous calcium sulfate from gypsum (particularly temperature/time profile of dewatering)
■ Crystal size and the surface energy
■ Purity of substances for gypsum preparation (soluble impurities)
■ Analytical and sampling technique
■ Mechanical attrition due to stirring
These factors are more important for anhydrite than for gypsum, since for instance tiny anhydrite crystals will have a higher solubility and because crystallization does not occur the dissolved part from these crystals remains in solution and causes a higher solubility. On the other side, using samples with large crystals separated from fines, the dissolution kinetics becomes extremely slow.
In order to eliminate effects of fines in solubility experiments with anhydrite D'Ans (1968) applied a 3-week boiling for aging natural, grinded anhydrite samples. Hill prepared anhydrite by boiling gypsum in 20% sulfuric acid for 3 days (Hill, 1934; Hill, 1937).
Krumgalz (2018) collected data of solubility of calcium sulfate in water from 110 papers. From these he extracted 190 data points for anhydrite up to 408°C. 83 data points of anhydrite solubility were at T ≤ 100°C, from which he accepted 64. As outliers he treated points located outside of an 80% confidence (corresponds approx. 1.3 σ) interval without giving the interval for his functions. For the interval 0°C–200°C he gave the fitting function Eq. 6
T in °C, m in mol/kgw, kgw = kg H2O N = 125 σ = 8.48E-4
Using Eq. 6 and the data set data set of N points (Tmax = 200°C) accepted by Krumgalz we calculated a std. deviation given above as σ. In Figure 1 the data for anhydrite accepted by Krumgalz are plotted up to 100°C with an identification of the authors. His fitted curve (Eq. 6) turns down below 25°C, which is a consequence particularly of the data from Poggiale (1843). Inspection of the original papers revealed that some data had been misinterpreted by Krumgalz, for example, Poggiale determined the solubility of gypsum, not of anhydrite. Table 2 lists the data, which were identified as wrong or outliers in this work for the temperature range up to 100°C.
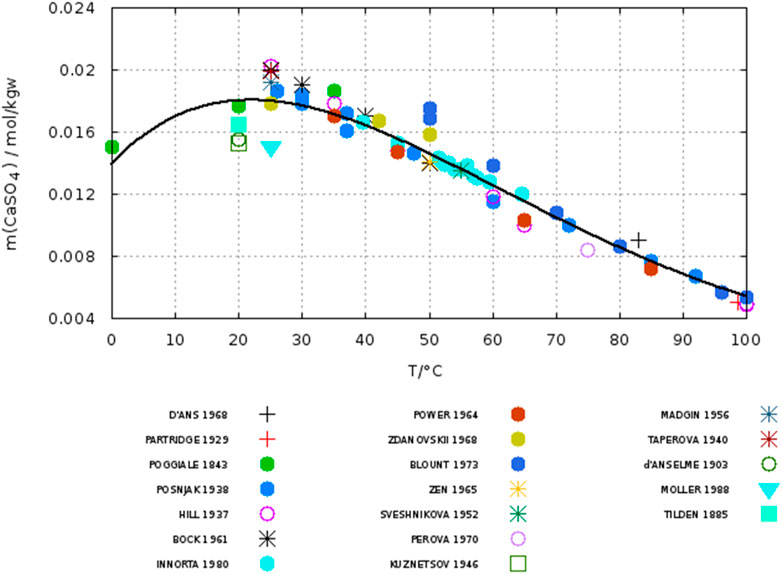
FIGURE 1. Solubility of anhydrite. Symbols: data of different authors as listed and accepted by Krumgalz (2018) line: fit by Krumgalz (2018). Citations see Krumgalz.
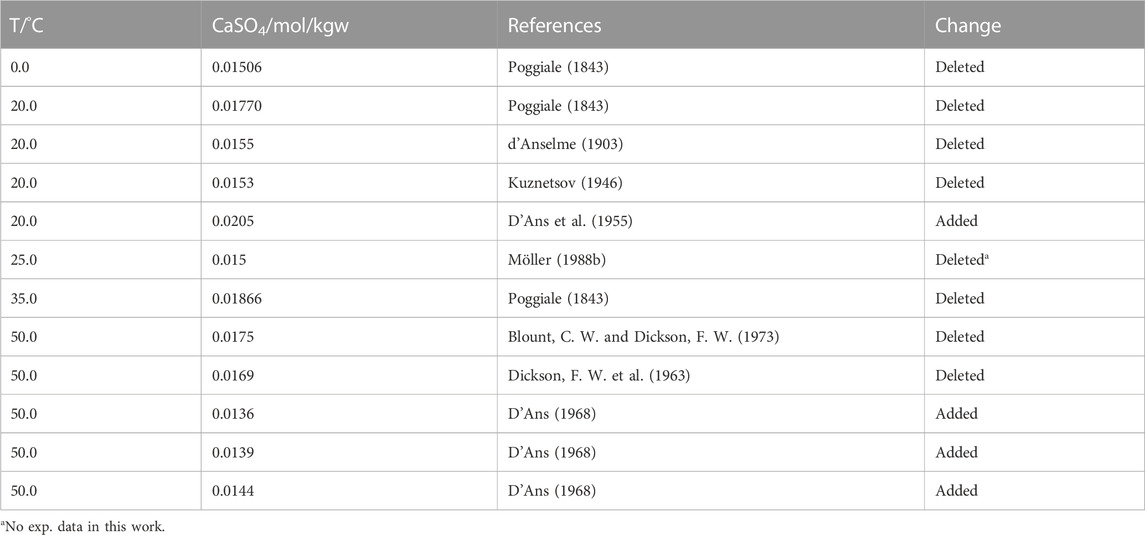
TABLE 2. Changes made in this work in respect to the data list (Krumgalz, 2018).
Figure 2 shows a plot of the corrected data list (changed data list Table 2) with a fit as a quadratic function (Eq. 7) and the original curve from Krumgalz. The difference within the range 40°C–60°C is small, but is significant in respect to the temperature of crossing the solubility curve of gypsum as will be shown later. The behavior below 25°C seems to be more realistic with the new function.
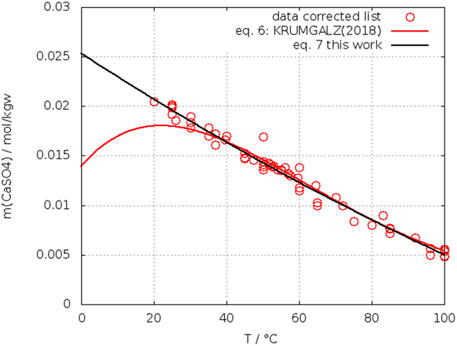
FIGURE 2. Solubility of anhydrite in water: comparison of the fit in this work with Krumgalz (2018).
T in °C N = 59 σ = 6.63E-4
A third set of data was considered from the authors (Hill, 1937; Posnjak, 1938; Bock, 1961; Power et al., 1964), who particularly investigated the solubility of anhydrite in parallel to the one of gypsum to fix the temperature of crossing of the solubility curves. The fit of their anhydrite data yields Eq. 8—plot in comparison to all others see below in Section 2.2.2.
T in °C N = 24 σ = 4.8E-4
It is remarkable that Eq. 8 shows the lowest std. deviation in comparison with the previous fits.
Due to the large amount of data for gypsum, initially we assumed, that it is unnecessary to select or unselect certain points. However, the data reported by 62 different authors or author groups contain a large number of single point determinations in water, while the authors interest was focused to systems with the presence of other electrolytes. The data accepted by Krumgalz for gypsum are plotted in Figure 3. All the data accepted by Krumgalz are represented by stars. To distinguish several authors other symbols are overlayed. The red curve represents the fit of Krumgalz (2018) (Eq. 9). Using his Eq. 9 and the data of his accepted list we calculated a std. deviation as given below.
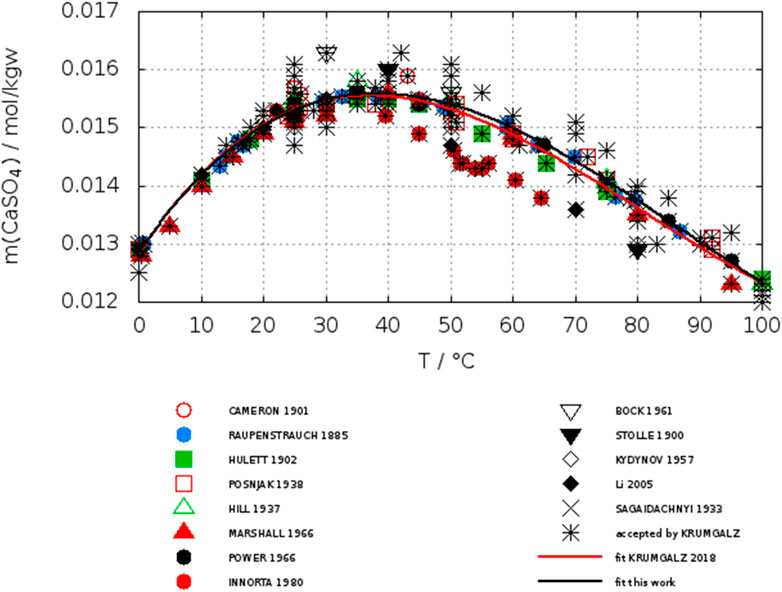
FIGURE 3. Solubility data of gypsum in water as accepted by Krumgalz (2018), his fit (red line), our fit (black line) with reduced data set (see Table 3).
T in °C N = 206 σ = 3.07E-4
For most of the data the scatter is smaller than in case of anhydrite. The data of Innorta et al. (1980) are highlighted as red closed circles in Figure 3. These data are significant lower than the majority of data of other authors, when T ≥ 40°C. A reason for this deviation can be found in a notice in the text of their paper, where it was stated, in case they detected gypsum in the suspension (quantitatively by calibrated XRD) the solubility datum was considered as belonging to the gypsum equilibrium due to its faster crystallization kinetics.
Unfortunately, although a calibration curve for solid mixtures anhydrite/gypsum was shown, no quantitative statement was made about the portion of gypsum if present in the suspension. Because Innorta et al. emphasize to had been able to check the presence of each of the solid phases down to 0.05%, one can assume that the gypsum content was quite low in these cases. Thus, it becomes understandable that in the region, where anhydrite is expected to present the stable phase (T > 40°C), gypsum was present in an amount not large enough to reach its higher metastable saturation concentration. There are a few low-lying points of Stolle (1900), Kydynov (1957) and Li and Demopoulos, (2005) for which no particular reason can be found in the original paper. However, these points are also considered as outliers (see Table 3). Even in the large data set of Krumgalz for gypsum the effect of low-lying data of Innorta et al. is evident. A fit (Eq. 10) with a reduced set of data (see Table 3) shifts the curve significantly as can be seen comparing the red (Krumgalz) and black (this work) curves and decreases the std. deviation.
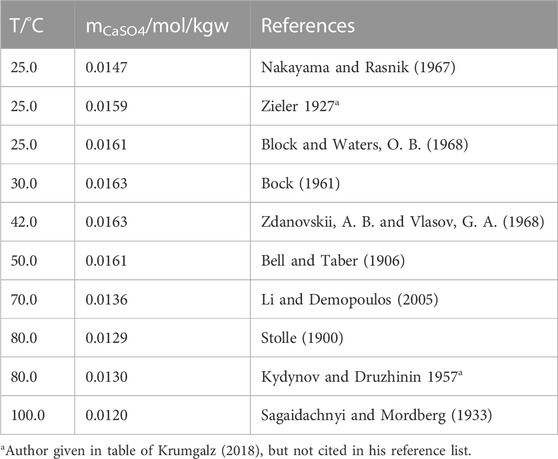
TABLE 3. Deleted data from the gypsum data set of Krumgalz (2018).
T in °C N = 182 σ = 2.05E-4
Analogous to anhydrite a separate fit of the data given by the authors (Hill, 1937; Posnjak, 1938; Bock, 1961; Power et al., 1964) was performed (Eq. 11), which yielded a std. deviation nearly identical to our reduced data set (Eq. 10).
T in °C N = 37 σ = 2.02E-4.
The purely statistically fitted curves of the data by Krumgalz (Eqs 6, 9) yield a crossing point of the gypsum-anhydrite solubility curve at 45.6°C (Figure 4). This value looks like a compromise between the low and high valued estimations. However, considering the std. deviation of the functions the limits are between 40.4°C and 51.1°C. Considering our fits with the corrected data sets for gypsum and anhydrite (Eqs 7, 10) gives a temperature of 43.9°C (Figure 4) with lower and upper limits of 40.4°C and 48.6°C. The numerical values are listed in Table 4.
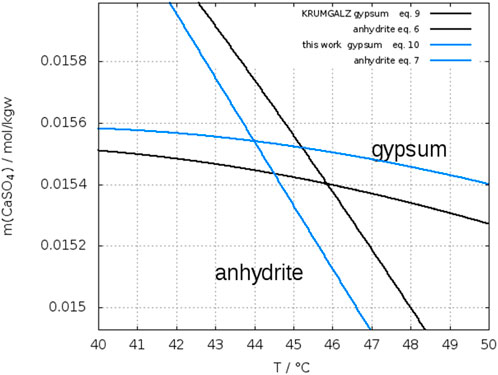
FIGURE 4. Crossing-points of fitted curves of the gypsum and anhydrite solubility according to Krumgalz (2018) black lines and this work blue lines.
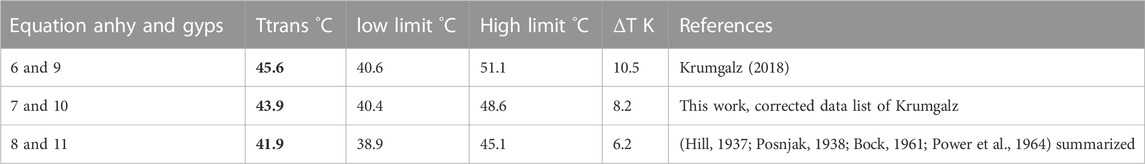
TABLE 4. Transition temperatures gypsum-anhydrite according to fits of different data selections.
Figure 5 shows a plot of the Eqs 8, 11 from the fit of the data sets of authors, who investigated particularly both gypsum and anhydrite to determine the crossing point. In this case a transition temperature of 41.9°C is obtained with narrower error limits between 38.9°C and 45.1°C.
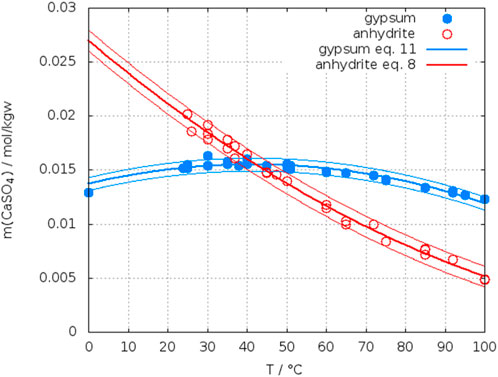
FIGURE 5. Crossing-point of solubility curve of gypsum and anhydrite from data of Hill (1937), Posnjak (1938), Bock (1961), and Power et al. (1964); symbols: exp. data; lines: fit of their data, red anhydrite (Eq. 8) blue gypsum (Eq. 11); thin lines: fit ± σ.
As one can see from Figure 4, the transition temperature shifts to lower values, when correcting the data set of Krumgalz and even lower (Figure 5), if one selects and combines the data of the authors (Hill, 1937; Posnjak, 1938; Bock, 1961; Power et al., 1964), who had been dealing with the subject particularly. The same is valid for the uncertainty, which is lowest in the last row of Table 4. The results of the authors mentioned above, are plotted separately in Figure 6. Locating the crossing points in enlarged plots yields
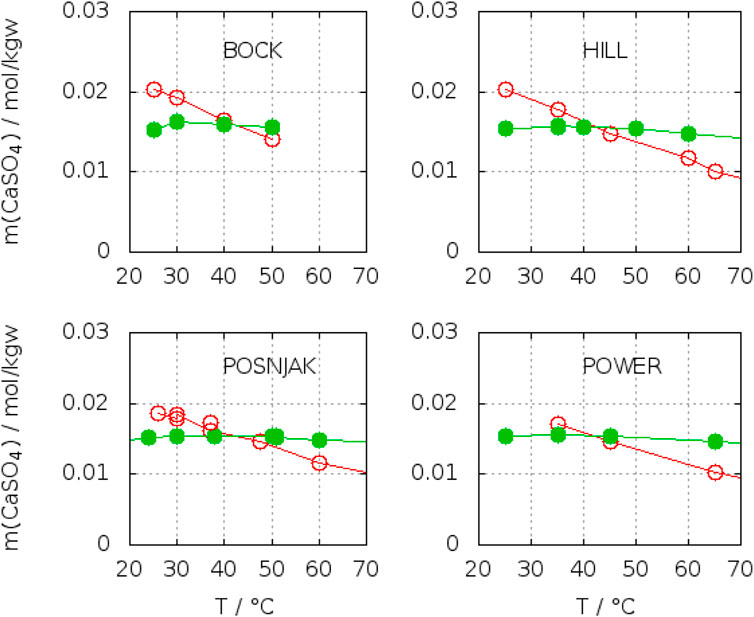
FIGURE 6. Experimentally determined crossing points of gypsum and anhydrite solubility curves in water according to Hill (1937), Posnjak (1938), Bock (1961), and Power et al. (1964).
(Hill, 1937) 42.4°C
(Bock, 1961) 42.4°C
(Power et al., 1964) 41.6°C
(Posnjak, 1938) 42.0°C, 44.5°C (this point was from a non-aged anhydrite)
The variation is very much smaller than from the statistical fits of the individual solubility curves of gypsum and anhydrite from different authors, who have investigated the solubility of either gypsum or anhydrite. The two values from Posnjak originate from two qualities of anhydrite he had used. The higher temperature results from the solubility of an anhydrite prepared by heating gypsum for a few hours at 500°C without aging, the lower is from a natural sample, which Posnjak himself assigns as the more reliable datum. The conclusion from all these considerations is that pure statistical treatment of assumed reliable data yield a transition temperature between 42°C and 45°C with a broad confidence interval of ±8°C. The particular designed experiments to determine the transition temperature by solubility determinations of both solid phases by the respective authors gave 42°C with a scatter of only ±1°C. Separate fitting of their results for gypsum and anhydrite gave the same transition temperature, but a wider scatter (±3°C). These facts hint on methodic differences (errors), which are compensated, when investigating both phases with the same (analytical, sampling) technique. From our personal experience we know, that beside other factors, sampling techniques have a large effect on the results of solubility determinations. They are quite individual and a detailed description would be too lengthy for a publication in scientific journal. In conclusion, 42°C ± 1°C should be considered as the correct transition temperature in water.
By the way, a thorough discussion, why the high value of the transition temperature of van’t Hoff (1912) is wrong can be found by Posnjak (1938). In brief, the conclusions of van’t Hoff are based on misinterpretations of tedious dilatometric and tensiometric measurements of hydration/dehydration reactions of gypsum into hemi-hydrate and anhydrite in water and electrolyte solutions.
Several authors supposed that equilibration times to reach the solubility equilibrium with anhydrite are shorter in electrolyte solutions than in pure water, particularly in solutions of sulfuric acid. To the knowledge of the present authors no quantitative examination of this effect was published until now. However, about 20 years ago, occasionally we made an observation, which underlines this kinetic effect. A company producing electrolytic copper from baths of CuSO4 in solutions of sulfuric acid at about 40°C asked us to identify the type of scale on the electrodes forming regularly after about one to 2 weeks. This scale was pure anhydrite (determined by means of XRD patterns) deposited from impurities in the electrolytic baths. In pure water gypsum would form at these temperatures. Unfortunately, that time we did not further examine the phenomenon. The preferred preparation method of Hill (1937) to obtain well-crystallized anhydrite was boiling in 20% sulfuric acid. He reported crystal sizes of 20–30 μm (Hill, 1934). Doubtless, this points also to an improved crystallization kinetics of anhydrite in electrolyte solutions.
Bearing in mind these observations one could expect more precise determinations of the crossing-points of the anhydrite and gypsum solubility curves in electrolyte solutions. On the other side, accurate analytical determination of low concentrations of calcium and sulfate is more difficult in presence of a large excess electrolytes. Whereas the gypsum solubility was investigated in a large number of electrolyte solutions, this is not true for anhydrite. Zdanovskii, A. B. and Vlasov, G. A. (1968) determined the solubility of both phases in solutions of H2SO4 at T = 10°C, 25°C, 35°C, 42°C, and 50°C. Wang et al. (2013) reported such investigations for T = 25°C, 50°C, 75°C, and 90°C. The results for 25°C are shown in Figure 7. The black curves represent the data of Zdanovskii, A. B. and Vlasov, G. A. (1968). They cross each between 2.4–2.6 mol/kgw H2SO4. The data for anhydrite of Wang et al. (2013) are considerably higher, whereas both authors data agree for gypsum at mH2SO4 ≤ 1.5 mol/kgw. At higher concentration of H2SO4 the data of Wang et al. fall below the curve of Zdanovskii and Vlasov. Unfortunately, Wang et al. did not continue the investigation of gypsum up to the crossing point with anhydrite. Extrapolating their gypsum curve crosses that of anhydrite at approx. 4 mol/kgw H2SO4. The data of Zdanovskii and Vlasov at 35°C are plotted in Figure 8. The solubility of anhydrite and gypsum equals at m(H2SO4) = 1.4 mol/kgw. Figure 9 shows the analogous plot for 42°C. Here the crossing point is located at about 0.35 mol/kgw. Figure 10 shows the results for T = 10°C, the only data available below 25°C. In this case the crossing-point is at 5.5 mol/kgw with an uncertainty of about ±0.5 mol/kgw. As expected, the data show that the crossing point shifts to lower H2SO4 concentrations with increasing temperature. All the data at temperatures higher than 42°C showed lower solubility for anhydrite than for gypsum in line with the results on the gypsum-anhydrite equilibrium in pure water.
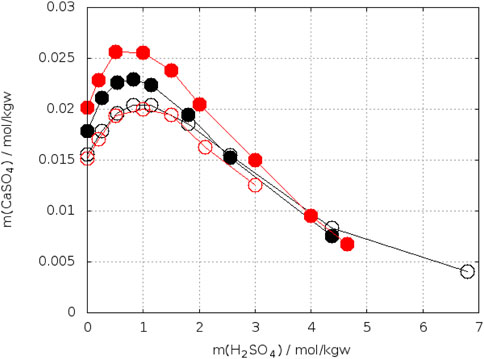
FIGURE 7. Solubility of gypsum (open circles) and anhydrite (close circles) in H2SO4–H2O at 25°C. Zdanovskii, A. B. and Vlasov, G. A. (1968) in black, Wang et al. (2013) in red.
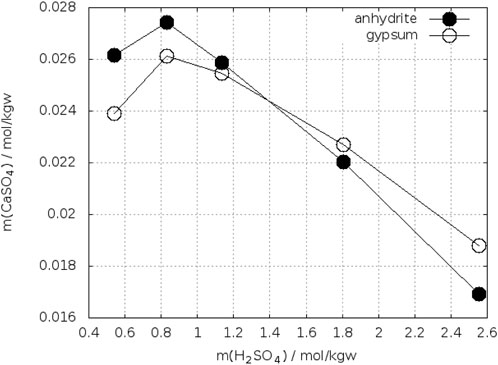
FIGURE 8. Solubility of gypsum and anhydrite in H2SO4–H2O at 35°C (Zdanovskii, A. B. and Vlasov, G. A., 1968).
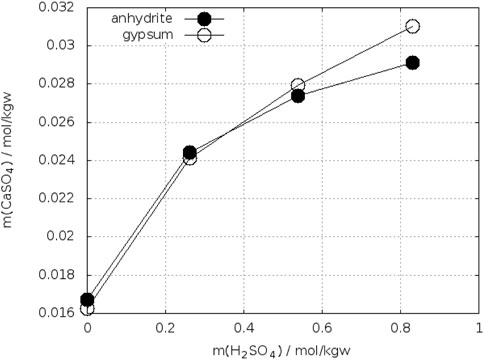
FIGURE 9. Solubility of gypsum and anhydrite in H2SO4–H2O at 42°C (Zdanovskii, A. B. and Vlasov, G. A., 1968).
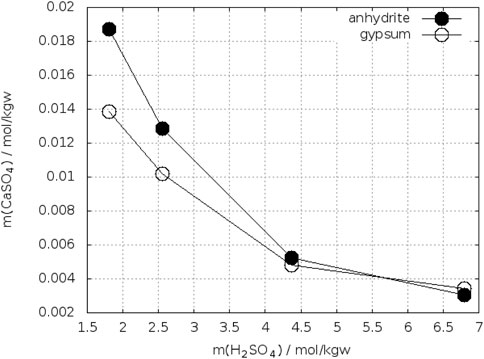
FIGURE 10. Solubility of gypsum and anhydrite in H2SO4–H2O at 10°C (Zdanovskii, A. B. and Vlasov, G. A., 1968).
Kruchenko and Beremzhanov, B. A. (1976) determined the solubility of gypsum and anhydrite in solutions of HCl at 25°C. From the plot (Figure 11) the solubility of both phases is equal between 3.8–4.0 mol/kgw HCl.
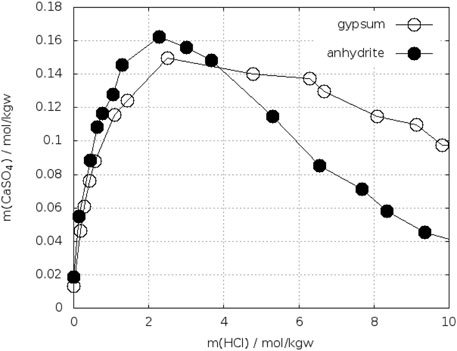
FIGURE 11. Solubility of gypsum and anhydrite in HCl-H2O at 25°C (Kruchenko, V. P. and Beremzhanov, B. A., 1976).
Figure 12 shows the solubility of gypsum and anhydrite in CaCl2-H2O at 25°C according to Mel’nikova et al. (1971). From this diagram a crossing-point between 2.3–2.7 mol/kgw CaCl2 can be estimated.
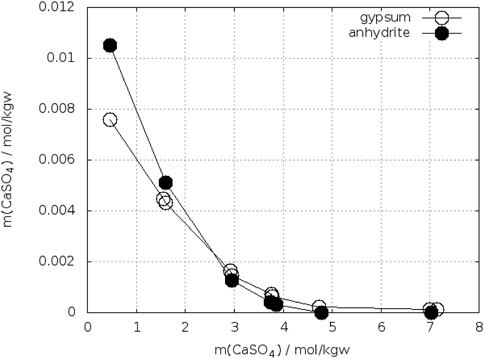
FIGURE 12. Solubility of gypsum and anhydrite in CaCl2-H2O at 25°C (Mel’nikova et al., 1971).
In sodium chloride solutions corresponding solubilities for gypsum and anhydrite were reported at different temperatures. Figure 13 shows plots for 25°C. In order to fix the crossing-point, data near this point were linearly fitted (see insert in Figure 13). Another plot is shown in Figure 14 for T = 40°C. The data for anhydrite are from Bock (1961), whereas for gypsum also other data have been added (Sborgi, 1926; Marshall, W. L. et al., 1964; Marshall and Slusher, 1966; Block and Waters, O. B., 1968). Up to 2 mol/kgw NaCl the results for gypsum agree, at higher concentrations the data diverge. The crossing-point with the anhydrite curve of Bock can be located between 1.1 and 1.8 mol/kgw NaCl. Data at 50°C gave higher solubilities for gypsum in the entire concentration range (Bock, 1961; Zen, 1965).
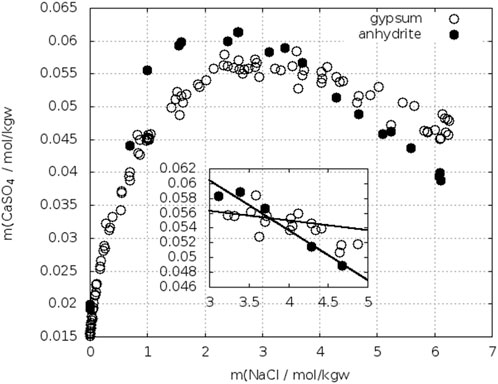
FIGURE 13. Solubility of gypsum (Cameron, 1901; Madgin and Swales, 1956; Bock, 1961; Denman, 1961; Marshall and Slusher, 1966; Power et al., 1966; Block and Waters, O. B., 1968) (Shchukarev 1939, 1950; Shternina 1949 cited in Pelsh (1973) and anhydrite (Madgin and Swales, 1956; Bock, 1961; Mel’nikova et al., 1971) cited in Pelsh (1973) in NaCl–H2O at 25°C.
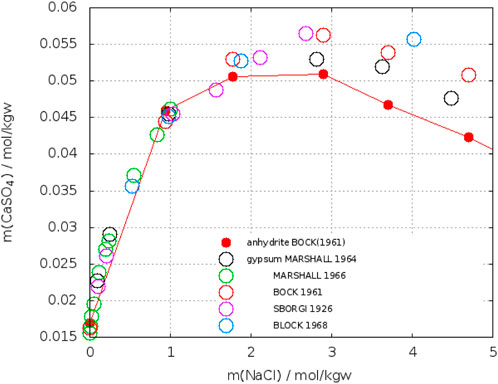
FIGURE 14. Solubility of gypsum (open circles) and anhydrite (closed red circles) in NaCl–H2O at 40°C.
In Table 5 the data for the crossing-points in the electrolyte solutions mentioned above are summarized and complemented with the corresponding water activities. According to Eq. 4 and Eq. 4a all data should be located on a common curve T = f(lnaw). In Figure 15 the data from Table 5 are plotted together with the theoretical curve (see Section 2.3). The latter is obtained when applying the caloric equation Eq. 21 from Robie et al. (1989). As can be seen from Figure 15, the transition temperatures determined from solubilities in different electrolyte solutions scatter around the theoretical curve. For every experimental datum the two symbols connected by a line reflect the uncertainty for that datum as can be read-off as mmin and mmax from Table 5. Thus, the transition temperatures determined from solubility curves in electrolyte solutions are in accordance with the calorimetric result (Section 2.3), but do not reduce the uncertainty. Although one could hope for improved crystallization and dissolution kinetics of anhydrite other factors like analytics at high electrolyte concentration obviously effect the precision of results.
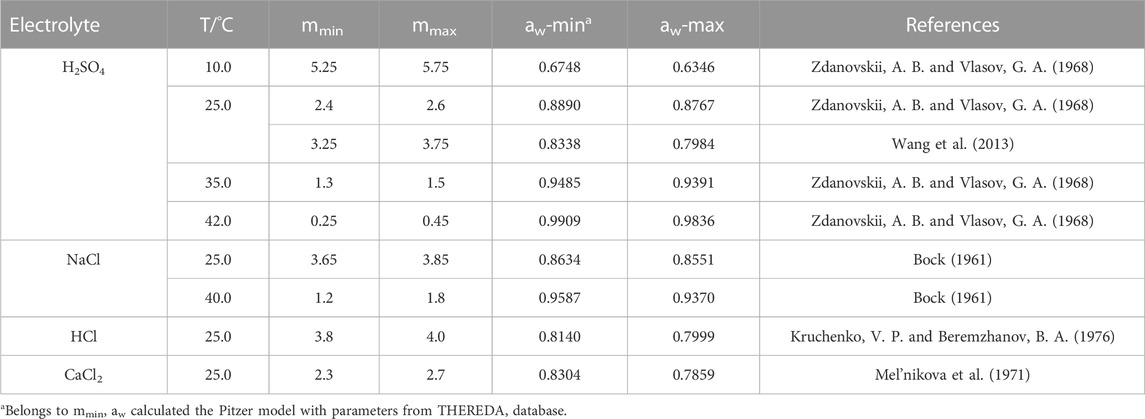
TABLE 5. Concentrations and water activities at intersection of gypsum and anhydrite solubility curves in different electrolytes at different temperatures.
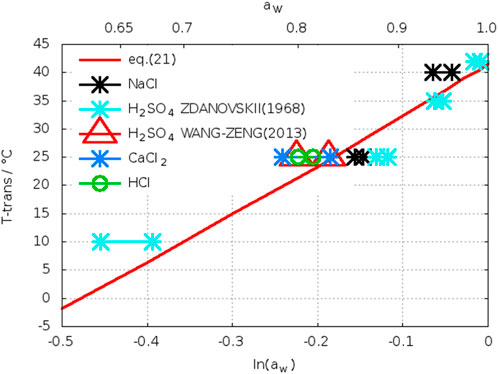
FIGURE 15. Relationship between water activity and transition temperature gypsum-anhydrite in different electrolytes (two symbols, some connected by a line, reflect the uncertainty as can be read-off as mmin and mmax from Table 5).
The Gibbs energy of reaction in Eq. 1 is fixed through the quantities ΔRSØ and ΔRHØ. The latter can be determined by purely calorimetric methods. These methods are not dependent on the crystallization or dissolution kinetics of the solids. ΔRSØ can be calculated from absolute entropy determinations for gypsum and anhydrite by measuring the heat capacities Cp from 0 K (−273°C) to about 333 K (60°C) and integrating Cp over this temperature range (Eq. 12)
ΔRHØ can be determined from the difference of heat of dissolutions of gypsum and anhydrite at 298.15 (25°C).
Kelley et al. (1941) reported such results (Eq. 13–15) for the reaction (IV), which is the reverse of eq. (I).
The thermochemical conversion factor 1 cal = 4.184 J/mol was applied.
For the limited temperature range 25°C–60°C the linear approximations Eqs 16, 17 were made and Cp(H2O,liq.) was set to 18.02 cal/(mol K) by Kelley et al. (1941).
Solving Eq. 15 for T yields a transition temperature of 313 K (=40°C) when
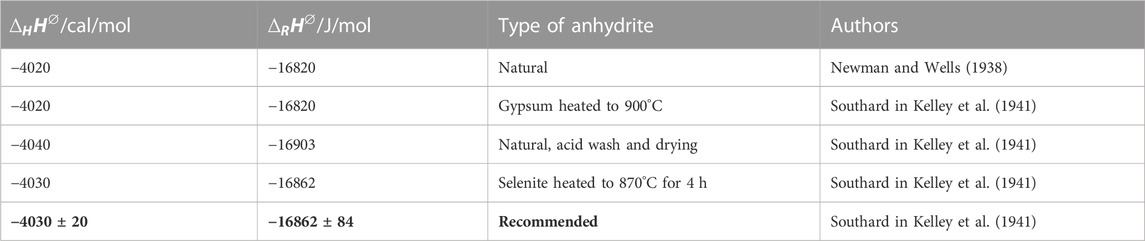
TABLE 6. Listing of caloric quantities from Kelley (1941).
For the entropies at 25°C Anderson in Kelley et al. (1941) listed the following values from his Cp measurements for anhydrite and gypsum (Table 7):
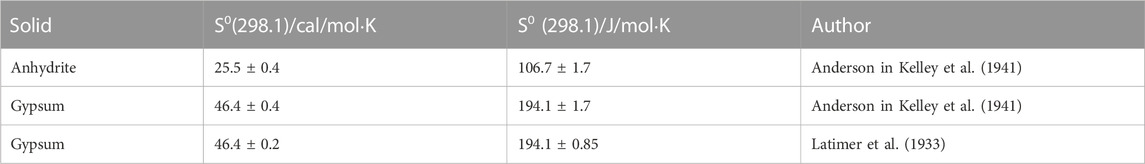
TABLE 7. Absolute entropy data given in Kelley et al. and Latimer et al.
From the recommended data of Kelley et al. and Eqs 16, 17 one can write Eq. 18 including the uncertainties:
with
The upper and lower limit of Eq. 18 yields a broad interval of uncertainty of ±25 K, which had been pointed out by Zen (1965). In Kelley’s Gibbs energy function also the solid-gas decomposition pressure measurements gypsum-anhydrite were incorporated. Zen criticized this, modified the equation of Kelley by introducing more new entropy data of water and neglecting the decomposition data of gypsum. Zen also introduced a more new Cp function for anhydrite from Kelley (1960). However, this Cp function is linear for anhydrite up to 1,400 K, which cannot be an improvement for the application discussed here. Zen’s revised equation (Eq. 20) shifts the transition temperature to 45°C but cannot be considered as an improvement. The large uncertainty remained.
Robie, R. A. et al. (1989) repeated heat capacity measurements of anhydrite and gypsum and could reduce the uncertainty in the reaction entropy from 3.32 (Kelley et al., 1941) to 0.39 J/(mol K). Their Gibbs energy function (Eq. 21) for reaction (IV) crosses the zero value at 314.7 K (=41.5°C). Their estimated error of ±3.5 K is composed of ±1.4 K using the uncertainty of the hydration enthalpy of ±20 cal/mol (=± 84 J/mol/K) (Kelley et al., 1941) and ±2.1 K from their uncertainty in
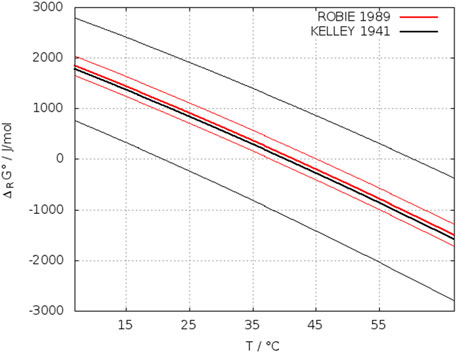
FIGURE 16. Temperature dependence of the standard Gibbs energy of reaction (IV). Thin lines: upper and lower limit of ΔRGØ.
However, in our opinion the uncertainty of the reaction enthalpy was set too high by Kelley. Considering the values given in Table 6, it should be half as large that is ±42 J/mol instead of 84. With the estimation described above this reduces the uncertainty to ±2.8 K.
More recent Cp measurements applying a DSC technique (Majzlan et al., 2002) show a larger scatter and thus could not improve the accuracy of Cp for anhydrite.
Precipitation of calcium sulfate from various aqueous solutions is of equal interest in geochemistry and hydrometallurgy. Therefore, several thermodynamic models had been established to describe precipitation processes in both fields of application at various conditions. Within the framework of such models also the transition temperature gypsum-anhydrite had been discussed. Sometimes the authors raised the hope to enhance the reliability of that value by thermodynamic modelling. However, it has to be emphasized that in case of calcium sulfate (compound with low solubility) a calculated transition temperature from a thermodynamic model is not an independent proof. The benefit of a thermodynamic model consists in combining different types of data (activity, caloric data, solubility), which support each other in a description of these properties as function of composition and temperature. If for a system only a few experimental solubility data are available the inclusion of a model for activity coefficients of unsaturated solutions and some caloric data (dissolution enthalpy, heat capacities) can enable a calculation of solubility curves, which could not be estimated with spare solubility data alone. However, for calcium sulfate this situation does not apply. There exists a plenty of solubility data in water within the interesting temperature range and it possess a low solubility.
Solubility and thermodynamic data are related through the solubility constant and the calculation of the latter requires the activity coefficient
The solubility constants as well as the activity coefficients depend on temperature. From Eq. 2–4 follows Eq. 23
The schematic solubility diagram in Figure 17 illustrates the situation with Eq. 23. Below and above (T1, T2) the transition temperature Ttrans the saturation molality for gypsum and anhydrite is different, but due to the low absolute value of solubility (differences are even smaller) the activity coefficient can be set equal for both molalities at the selected temperature T1 or T2. Thus, the second term on the right-hand side in Eq. 23 can be set to zero and the ratio of both equilibrium constants
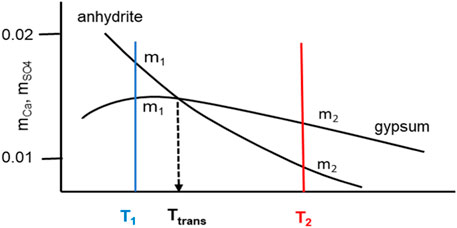
FIGURE 17. Scheme of solubility curves of gypsum and anhydrite in water demonstrating the small molality differences at selected temperatures T1 and T2.
Table 1 contains some references where the transition temperature is calculated by means of thermodynamic models. Models based on a thorough assessment of solubility data in the system CaSO4-H2O obtain transition temperatures at (41 ± 2)°C (Altmaier et al., 2011; Marshall, W. L. et al., 1964; Marshall and Slusher, 1966; Corti and Fernandez-Prini, 1984; Azimi et al., 2007; Wang et al., 2013; Li et al., 2018; Shen et al., 2019). For the remaining models, which predict a much higher or lower temperature deficiencies in data evaluation can be detected. The origin of the low value of about 30°C in Messnaoui and Bounahmidi (2006) can be recognized from Figure 5 in their publication. The calculated solubility of gypsum is systematically above the experimental data and thus shifting the section point with the anhydrite line to a lower temperature. The same with the high value (49°C) from the model of Möller (1988a). Here also the calculated gypsum solubilities are located above the experimental data [see Figure 3 in Möller (1988a)]. The reason of the high value (59.9°C) from Raju and Atkinson (1990) cannot be figured out explicitly. The authors emphasized to trust first of all on solubility data, but also applied caloric data from NBS tables (Wagman et al., 1982) without giving details. This was also criticized by Shen et al. (2019). However, one word more should be in place here about the most recent model of Shen et al. Although their model gives a transition temperature of 42.8°C within the limit of our determination, the agreement is fortuitous. The model is based on an assessment of solubility data in the binary system CaSO4–H2O, where the authors accepted also a large number of data points in a table of D'Ans et al. (1955), which represent calculated (and not experimental!) solubilities from a thermodynamic model developed by D’Ans. The effect of the data selection is illustrated in Figures 18, 19, where our data selection and that of Shen et al. is compared. The calculated data of D’Ans et al. which we had excluded (see discussion Section 2.2.1) were included by Shen et al. (closed red circles in Figures 18, 19). These calculated data points dominate the course of the solubility isotherm of gypsum and anhydrite in the selection of Shen et al. Other, positively and negatively deviating data accepted by Shen et al. are compensating each other in respect to the course of the isotherm, only enhancing the scatter. The careful solubility determinations of Raupenstrauch (1885b), Raupenstrauch (1885a), and Hulett and Allen (1902) for gypsum had not been considered by Shen et al. Since D’Ans calculated data are in agreement with these data, the neglection had no effect on the data fit of Shen et al.
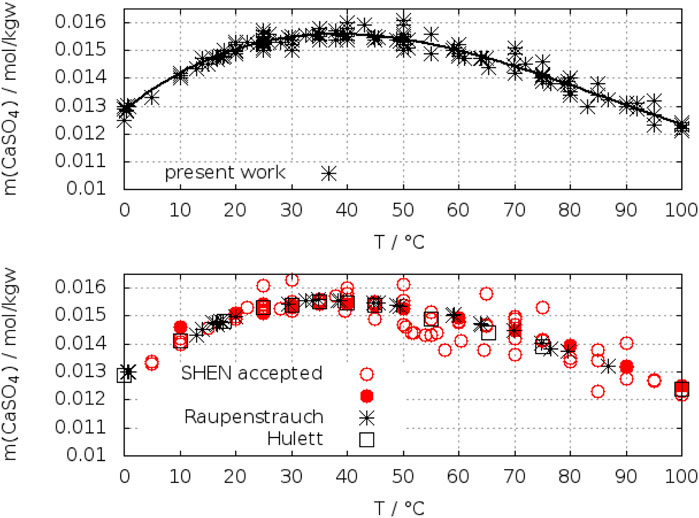
FIGURE 18. Comparison of the data selection of Shen et al. (2019) and in this work for gypsum. Black stars: accepted data of this work (top); red circles (open and closed) accepted by Shen et al. (2019), closed red circles are calculated data of D’Ans, which had been selected as “experimental” by Shen et al. In the lower figure the data of Raupenstrauch (1885a) (stars) and Hulett and Allen (1902) (squares) were added, which had not been considered by Shen et al. Line: fit in this work.
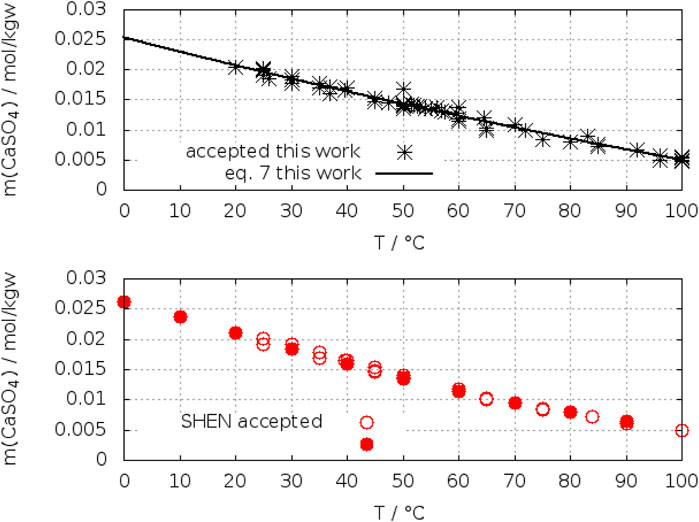
FIGURE 19. Comparison of the data selection of Shen et al. (2019) and in this work for anhydrite. Black stars: accepted data of this work (top); red circles (open and closed): accepted data of Shen et al. (2019) including the calculated data of D’Ans (closed red circles) (buttom). Line: fit this work.
The temperature at which gypsum and anhydrite can co-exist in equilibrium with each other represents the upper limit for the long-term existence of gypsum in contact with solutions and the lower limit for anhydrite. When passing this temperature one phase should be converted or transferred into the other one as long as contact with solution exists. Therefore, the term transition or conversion temperature is in use. As a thermodynamically fixed quantity it does not make any statement on the time required for a transition for instance from gypsum to anhydrite. The extremely slow crystallization kinetics of anhydrite at temperatures below 90°C prevents to approach the solubility equilibrium from super- and undersaturation. In this work several methods to fix this temperature were discussed. The assessment of reported solubility data of gypsum and anhydrite in water represents the most important method to estimate the temperature of the gypsum-anhydrite equilibrium. Although a large pool of solubility data exists, particularly for gypsum, we demonstrated that statistical criteria are not sufficient to achieve the required accuracy to narrow the temperature range for the transition temperature gypsum-anhydrite. Critical selection based on experimental details shifted the mean value given by Krumgalz from 45.6°C to 42.0°C. In addition, it was shown that solubility experiments near the crossing-point of the solubility polytherms of both phases with the same experimental technique yield Ttrans = (42.0 ± 1)°C, which is considered as the best determination at ambient pressure. Independent evidence for this temperature is provided from calorimetric measurements yielding (42 ± 2.8)°C. The presence of electrolyte solutions decreases this temperature, however, the relationship with the water activity supports the value in water, but with a broader uncertainty. Furthermore, it was shown that thermodynamic modelling cannot be considered as an independent proof of the transition temperature, but when based on thorough assessment of solubility data of gypsum and anhydrite the results agree with 42°C. For deviating results we could figure out the deficiencies. The question of the thermodynamic transition temperature can now be considered as resolved. The value of (42 ± 1)°C represents a geochemical reference for the long-term stability of gypsum and anhydrite in water at 1 bar, which can be adapted to other pressures or solutions with lower water activity by applying the relevant thermodynamic equations including additional data as volume change in dissolution or water activities. This should be valuable in a geochemical characterization of host rocks for waste disposal.
WV: Performed the data re-assessments and draw the conclusion. DF: Checked the results based on her experience and knowledge of the system. All authors contributed to the article and approved the submitted version.
Open Access Funding by the Publication Fund of TU Bergakademie Freiberg.
The authors declare that the research was conducted in the absence of any commercial or financial relationships that could be construed as a potential conflict of interest.
All claims expressed in this article are solely those of the authors and do not necessarily represent those of their affiliated organizations, or those of the publisher, the editors and the reviewers. Any product that may be evaluated in this article, or claim that may be made by its manufacturer, is not guaranteed or endorsed by the publisher.
Altmaier, M., Bube, C., Neck, V., Marquardt, C., Richter, A., Scharge, T., et al. (2011). Thereda - thermodynamische referenz-datenbasis. Hexäres Syst. ozeanischen Salze.
Azimi, G., Papangelakis, V. G., and Dutrizac, J. E. (2007). Modelling of calcium sulphate solubility in concentrated multi-component sulphate solutions. Fluid Phase Equilib. 260, 300–315. doi:10.1016/j.fluid.2007.07.069
Bell, J. M., and Taber, W. C. (1906). The solubility of gypsum in solutions of ammonium sulphate. J. Phys. Chem. 10, 119–122. doi:10.1021/j150074a005
Berdugo, I., Romero, E., Saaltink, M., and Albis, M. (2008). On the behaviour of the CaSO4-H2O system. Rev. Acad. Colomb. Cienc. 32, 555.
Block, J., and Waters, O. B. (1968). Calcium sulfate-sodium sulfate-sodium chloride-water system at 25.deg. to 100.deg. J. Chem. Eng. Data 13, 336–344. doi:10.1021/je60038a011
Blount, C. W., and Dickson, F. W. (1973). Gypsum-Anhydrite equilibria in systems CaSO4 - H2O and CaSO4-NaCl-H2O. Am. Mineral. 58, 323–331.
Bock, E. (1961). ON the solubility of anhydrous calcium sulphate and of gypsum in concentrated solutions of sodium chloride at 25 °C, 30 °C, 40 °C, and 50 °C. Can. J. Chem. 29, 1746–1751. doi:10.1139/v61-228
Cameron, F. K. (1901). Solubility of gypsum in aqueous solutions by sodium chloride. J. Phys. Chem. 5, 556–576. doi:10.1021/j150035a002
Corti, H. R., and Fernandez-Prini, R. (1984). Thermodynamics of solution of gypsum and anhydrite in water over a wide temperature range. Can. J. Chem. 62, 484–488. doi:10.1139/v84-081
D'Ans, J., Bredtschneider, D., Eick, H., and Freund, H.-E. (1955). Untersuchungen über die Calciumsulfate. Kali Steinsalz, 17–38.
d'Anselme, M. A. (1903). Solubility of calcium sulfate hydrate in solutions of seawater. Bull. Soc. Chim. Fr. 29, 372–374.
Denman, W. (1961). Maximum Re-use of cooling water based on gypsum content and solubility. Ind. Eng. Chem. 53, 817–822. doi:10.1021/ie50622a026
Dickson, F. W., Blount, C. W., and Tunell, G. (1963). Use of hydrothermal solution euqipment to determine the solubility of anhydrite in water from 100 °C to 275 °C and from 1 bar to 1000 bars pressure. Am. J. Sci.
Freyer, D., and Voigt, W. (2003). Crystallization and phase stability of CaSO4 and CaSO 4 - based salts. Monatsh. fur Chem. 134, 693–719. doi:10.1007/s00706-003-0590-3
Fu, H., Guan, B., Jiang, G., Yates, M. Z., and Wu, Z. (2012). Effect of supersaturation on competitive nucleation of CaSO4 phases in a concentrated CaCl2 solution. Cryst. Growth Des. 12, 1388–1394. doi:10.1021/cg201493w
Grigor’Ev, A. P., and Shamaevp, P. P. (1976). Determination of gypsum-anhydrite equilibrium temperature. Izv. Sib. Otd. Akad. Nauk. SSSR. Ser. Khim., 104.
Hardie, L. A. (1967). Gypsum-anhydrite equilibrium at one atmosphere pressure. Amer. Mineral. 52, 171–200.
Hill, A. E. (1934). Ternary systems. XIX. Calcium sulfate, potassium sulfate and water. J. Am. Chem. Soc. 56, 1071–1078. doi:10.1021/ja01320a019
Hill, A. E. (1937). The transition temperature of gypsum to anhydrite. J. Am. Chem. Soc. 59, 2242–2244. doi:10.1021/ja01290a039
Hulett, G. A., and Allen, L. E. (1902). The solubility of gypsum. J. Am. Chem. Soc. 24, 667–679. doi:10.1021/ja02021a007
Innorta, G., Rabbi, E., and Tomadin, L. (1980). The gypsum-anhydrite equilibrium by solubility measurements. Geochim. Cosmochim. Acta 44, 1931–1936. doi:10.1016/0016-7037(80)90192-1
Kelley, K. K. (1960). Reference material: Bulletin 584-bureau of mines - contributions to the data on theoretical metallurgy, XIII. High-temperature heat-content, heat-capacity, and entropy data for the elements and inorganic compounds. Denton, Texas, USA: UNT Digital Library.
Kelley, K. K., Southard, J. C., and Anderson, C. T. (1941). Thermodynamic properties of gypsum and its dehydration products Washington D. C.,USA: US Bur. Mines Tech Paper.
Knacke, O., and Gans, W. (1977). The thermodynamics of the system CaSO4 - H2O. Z. Phys. Chem. N. F. 104, 41–48. doi:10.1524/zpch.1977.104.1-3.041
Kontrec, J., Kralj, D., and Brečević, L. (2002). Transformation of anhydrous calcium sulphate into calcium sulphate dihydrate in aqueous solutions. J. Cryst. Growth 240, 203–211. doi:10.1016/S0022-0248(02)00858-8
Kruchenko, V. P., and Beremzhanov, B. A. (1976). Solubility of salts in the calcium sulfate-hydrochloric acid-water system at 25 °C. Zh. Neorg. Khim. 21, 281–282.
Krumgalz, B. S. (2018). Temperature dependence of mineral solubility in water. Part 3. Alkaline and alkaline earth sulfates. J. Phys. Chem. Reference Data 47, 23101. doi:10.1063/1.5031951
Kuznetsov, A. M. (1946). The solubility of CaSO4 in the system CaCl2-HCl-H2O. Zh. Prikl. Khim. 19, 1335–1339.
Lancia, A., Musmarra, D., and Prisciandaro, M. (1999). Measuring induction period for calcium sulfate dihydrate precipitation. AIChE J. 45, 390–397. doi:10.1002/aic.690450218
Latimer, W. M., Hicks, J. F. G., and Schutz, P. W. (1933). The heat capacities and entropies of calcium and barium sulfates from 15 to 300°K. The entropy and free energy of sulfate ion. J. Chem. Phys. 1, 620–624. doi:10.1063/1.1749337
Li, D., Zeng, D., Yin, X., and Gao, D. (2018). Phase diagrams and thermochemical modeling of salt lake brine systems. III. Li2SO4+H2O, Na2SO4+H2O, K2SO4+H2O, MgSO4+H2O and CaSO4+H2O systems. Calphad 60, 163–176. doi:10.1016/j.calphad.2018.01.002
Lilley, T. H., and Briggs, C. C. (1976). Activity coefficients of calcium sulphate in water at 25 °C. Proc. R. Soc. Lond. A 349, 355–368.
Li, Z., and Demopoulos, G. P. (2005). Solubility of CaSO4 phases in aqueous HCl + CaCl2 solutions from 283 K to 353 K. J. Chem. Eng. Data 50, 1971–1982. doi:10.1021/je050217e
Madgin, W. M., and Swales, D. A. (1956). Solubilities in the system CaSO4-NaCl-H2O at 25° and 35°. J. Appl. Chem. 6, 482–487. doi:10.1002/jctb.5010061102
Majzlan, J., Navrotsky, A., and Neil, J. M. (2002). Energetics of anhydrite, barite, celestine, and anglesite: A high-temperature and differential scanning calorimetry study. Geochim. Cosmochim. Acta 66, 1839–1850. doi:10.1016/S0016-7037(01)00881-X
Marshall, W. L., Slusher, R., and Iones, E. V. (1964). Aqueous systems at high temperatures XIV. Solubility and thermodynamic relationships for CaSO4 in NaCl-H2O solutions from 40° to 200° C., 0 to 4 molal NaCl. J. Chem. Eng. Data 9, 187–191. doi:10.1021/je60021a011
Marshall, W. L., and Slusher, R. (1966). Thermodynamics of calcium sulfate dihydrate in aqueous sodium chloride solutions, 0-110°1,2. J. Phys. Chem. 70, 4015–4027. doi:10.1021/j100884a044
Mel'nikova, S. M., Moshkina, I. A., and Kolosov, A. S. (1971). Izv. Sib. Otd. Atad. Nauk. SSSR, Ser. Khim. Nauk. https://speciation.net/Database/Journals/Sib-Khim-ZhIzv-Sib-Otd-Akad-Nauk-SSR-Ser-Khim-Nauk-;i405.
Messnaoui, B., and Bounahmidi, T. (2006). On the modeling of calcium sulfate solubility in aqueous solutions. Fluid Phase Equilib. 244, 117–127. doi:10.1016/j.fluid.2006.03.022
Möller, N. (1988a). The prediction of mineral solubilities in natural waters: A chemical equilibrium model for the Na-Ca-Cl-SO4-H2O system, to high temperature and concentration. Geochim. Cosmochim. Acta 52, 821–837. doi:10.1016/0016-7037(88)90354-7
Möller, N. (1988b). The prediction of mineral solubilities in natural waters: A chemical equilibrium model for the Na-Ca-Cl-SO4-H2O system, to high temperature and concentration. Geochim. Cosmochim. Acta 52, 821–837. doi:10.1016/0016-7037(88)90354-7
Nakayama, F. S., and Rasnik, B. A. (1967). Calcium electrode method for measuring dissociation and solubility of calcium sulfate dihydrate. Anal. Chem. 39, 1022–1023. doi:10.1021/ac60252a010
Newman, E. S., and Wells, L. S. (1938). Heats of hydration and transition of calcium sulfate. Nat. Bur. Stand. J. Res. 20, 825. doi:10.6028/jres.020.004
Ossorio, M., van Driessche, A., Pérez, P., and García-Ruiz, J. M. (2014). The gypsum–anhydrite paradox revisited. Chem. Geol. 386, 16–21. doi:10.1016/j.chemgeo.2014.07.026
Otalora, F., and Garcia-Ruiz, J. (2014). Nucleation and growth of the Naica giant gypsum crystals. Chem. Soc. Rev. 43, 2013–2026. doi:10.1039/C3CS60320B
Partridge, E. P., and White, A. H. (1929). The solubility of calcium sulfate from 0 to 200°. J. Am. Chem. Soc. 51, 360–370. doi:10.1021/ja01377a003
Pelsh, A. D. (1973). Handbook of experimental data on solubility in multi-component aqueous salt systems. Leningrad: Khimiya: Water-Salt System Chemistry, Press.
Poggiale, M. (1843). Memoire sur la solubilite des sels dans L'eau. Ann. de chimie de physique, 463–478.
Power, W. H., Fabuss, B. M., and Satterfield, C. N. (1966). Transient solubilities and phase changes of calcium sulfate in aqueous sodium chloride. J. Chem. Eng. Data 11, 149–154. doi:10.1021/je60029a005
Power, W. H., Fabuss, B. M., and Satterfield, C. N. (1964). Transient solubilities in the calcium sulfate - water system. J. Chem. Eng. Data 9, 437–442. doi:10.1021/je60022a046
Raju, Krishnam U. G., and Atkinson, G. (1990). The thermodynamics of "scale" mineral solubilities. 3. Calcium sulfate in aqueous sodium chloride. J. Chem. Eng. Data 35, 361–367. doi:10.1021/je00061a038
Raupenstrauch, G. A. (1885a). Über die Bestimmung der Löslichkeit einiger Salze in Wasser bei verschiedenen Temperaturen. Monatsh Chem. 6, 563–591. doi:10.1007/bf01554655
Raupenstrauch, G. A. (1885b). Über die Bestimmung der Löslichkeit einiger Salze in Wasser bei verschiedenen Temperaturen. Sitzb. kaiserl. Akad. Wissensch. XCII.
Robie, R. A., Russel-Robinson, S., and Hemingway, B. S. (1989). Heat capacities and entropies from 8 to 1000 K of langbeinite (K2Mg2(SO4)3), anhydrite (CaSO4) and of gypsum (CaSO4·2H2O). Thermochim. Acta 139, 67–81. doi:10.1016/0040-6031(89)87010-8
Sborgi, U. (1926). Influenza degli elettroliti sulla velocita di presa del gesso. Atti Soc. Toscana Mem. 37, 179–195.
Shen, L., Sippola, H., Li, X., Lindberg, D., and Taskinen, P. (2019). Thermodynamic modeling of calcium sulfate hydrates in the CaSO4 –H2O system from 273.15 to 473.15 K with extension to 548.15 K. J. Chem. Eng. Data 64, 2697–2709. doi:10.1021/acs.jced.9b00112
Van Driessche, A. E. S., García-Ruíz, J. M., Tsukamoto, K., Patiño-Lopez, L. D., and Satoh, H. (2011). Ultraslow growth rates of giant gypsum crystals. Proc. Natl. Acad. Sci. U.S.A. 108, 15721–15726. doi:10.1073/pnas.1105233108
van't Hoff, J. H. (1912). Untersuchung über die Bildungsverhältnisse der ozeanischen Salzablagerungen insbesondere des Stassfurter Salzlagers Leipzig: Akademische Verlagsges. mbH.
Wagman, D., Evans, W. H., Parker, V. B., Schumm, R. H., Halow, I., Bailey, S. M., et al. (1982). The NBS tables of chemical thermodynamic properties: selected values for inorganic and C1 and C2 organic substances in SI units. J. Phys. Chem. Ref. Data 11, 1–392.
Wang, W., Zeng, D., Yin, X., and Chen, Q. (2012). Prediction and measurement of gypsum solubility in the systems CaSO4 + HMSO4 + H2SO4 + H2O (HM = Cu, Zn, Ni, Mn) at 298.15 K. Ind. Eng. Chem. Res. 51, 5124–5134. doi:10.1021/ie201721m
Wang, W., Zeng, D., Chen, Q., and Yin, X. (2013). Experimental determination and modeling of gypsum and insoluble anhydrite solubility in the system CaSO4–H2SO4–H2O. Chem. Eng. Sci. 101, 120–129. doi:10.1016/j.ces.2013.06.023
Zdanovskii, A. B., and Vlasov, G. A. (1968). Determination of the transition border CaSO4.2H2O and gamma-CaSO4 in solutions of H2SO4. Zh. Neorg. Khim. 13, 2552–2554.
Zen, (1965). Solubility measurements in the system CaSO4-NaCl-H2O at 35, 50, and 70 Cand one atmosphere pressure. J. Petrololgy 6, 124–164. doi:10.1093/petrology/6.1.124
Keywords: solubility equilibrium, gypsum, anhydrite, transition temperature, thermodynamics
Citation: Voigt W and Freyer D (2023) Solubility of anhydrite and gypsum at temperatures below 100°C and the gypsum-anhydrite transition temperature in aqueous solutions: a re-assessment. Front. Nucl. Eng. 2:1208582. doi: 10.3389/fnuen.2023.1208582
Received: 19 April 2023; Accepted: 04 September 2023;
Published: 21 September 2023.
Edited by:
Bernd Grambow, UMR6457 Laboratoire de Physique Subatomique et des Technologies Associées (SUBATECH), FranceReviewed by:
Axel Liebscher, Federal Company for Radioactive Waste Disposal, GermanyCopyright © 2023 Voigt and Freyer. This is an open-access article distributed under the terms of the Creative Commons Attribution License (CC BY). The use, distribution or reproduction in other forums is permitted, provided the original author(s) and the copyright owner(s) are credited and that the original publication in this journal is cited, in accordance with accepted academic practice. No use, distribution or reproduction is permitted which does not comply with these terms.
*Correspondence: Wolfgang Voigt, d29sZmdhbmcudm9pZ3RAY2hlbWllLnR1LWZyZWliZXJnLmRl
Disclaimer: All claims expressed in this article are solely those of the authors and do not necessarily represent those of their affiliated organizations, or those of the publisher, the editors and the reviewers. Any product that may be evaluated in this article or claim that may be made by its manufacturer is not guaranteed or endorsed by the publisher.
Research integrity at Frontiers
Learn more about the work of our research integrity team to safeguard the quality of each article we publish.