
95% of researchers rate our articles as excellent or good
Learn more about the work of our research integrity team to safeguard the quality of each article we publish.
Find out more
ORIGINAL RESEARCH article
Front. Nucl. Eng. , 19 July 2023
Sec. Nuclear Materials
Volume 2 - 2023 | https://doi.org/10.3389/fnuen.2023.1185448
This article is part of the Research Topic Rising Stars in Nuclear Materials: 2022 View all 7 articles
A U-Mo alloy has been selected as the fuel design for the conversion of high-performance research reactors in the United States. Efforts are ongoing to describe the fuel evolution as a function of time, for a variety of different reactor conditions. The accurate prediction of fuel evolution under irradiation requires the implementation of correct thermodynamic properties into mesoscale and continuum-level fuel performance modeling codes. Molecular dynamics has proven to be a valuable tool to parameterize or inform these higher-length scale models. However, there are currently inaccuracies in the only available U-Mo-Xe potential, which limits the predictive capabilities of molecular dynamics to inform critical phenomena in these fuel systems such as fission gas swelling. This work provides an updated U-Mo-Xe ternary interatomic potential which combines existing potentials in a reconciled format. The validation of the interatomic potential is performed by analyzing the phase stability and vacancy formation energies. Subsequently, Xe solution energies and an equation of state to describe Xe bubbles in U-Mo are calculated, providing 1) evidence of the significant differences between the prior ternary potential and the currently presented potential, and 2) updated data/tools for implementation into mesoscale simulation methodologies to study fission gas bubble evolution.
The United States High-Performance Research Reactor (USHPRR) program plans to replace current highly enriched uranium (HEU) fuel in high-power research reactors with low enriched uranium (LEU) fuel (Snelgrove et al., 1997). In order to achieve a reduced enrichment in these fuel types while maintaining the power density, there is a requirement for increased uranium density. The design for conversion includes a monolithic foil of uranium with 10 wt% molybdenum, with a zirconium diffusion barrier in aluminum cladding.
Recently, substantial effort has been made on mesoscale models to predict the swelling behavior of U-Mo fuels (Hu et al., 2016a; Hu et al., 2016b; Liang et al., 2016; Hu et al., 2017; Liang et al., 2017; Liang et al., 2018a; Liang et al., 2018b; Ye et al., 2018). These models rely on phase-field and/or rate theory descriptions of the microstructure evolution of material systems in order to model swelling on realistic timescales. These simulation methodologies include a number of parameters that are either fit to limited experimental data, calculated from lower length scale modeling methodologies, or assumed based on other material systems. Classical molecular dynamics (CMD) has proven valuable for the parametrization of such mesoscale models (Beeler et al., 2020; Beeler et al., 2021; Park et al., 2021; Beeler et al., 2022; Park et al., 2023). However, there are specific limitations to the present interatomic potentials (which are required for CMD simulations) that inhibit the scope of research that is currently capable.
The two interatomic potentials that have been used for the majority of the cited research are from Smirnova et al. (2013) and Starikov et al. (2018). The Smirnova potential is an embedded-atom method (EAM) (Daw and Baskes, 1984; Daw et al., 1993) interatomic potential that includes descriptions for U, Mo, and Xe. At the time of its development, to the authors’ knowledge, it was the only potential capable of describing any of the pair systems included in this ternary. Thus, it presented a dramatic advancement in terms of available tools for the exploration of the U-Mo system. In particular, the inclusion of Xe in this potential allowed for the analysis of gas bubble behavior, which is a critical phenomenon related to the performance of U-Mo fuels (Kim et al., 2013; Meyer et al., 2014). However, certain properties of the γ phase of U-Mo were found to not be well captured by this EAM potential, such as point defect diffusion coefficients and phase stabilities (Smirnova et al., 2013; Starikov et al., 2018). In particular, as will be shown later, the body-centered-cubic (bcc) solid solution phase was found unstable with Mo precipitate formation in the U matrix. In the literature, efforts have been put forth by Starikov et al. (2018) to improve upon the EAM potential and develop a U-Mo potential in the angular dependent potential (ADP) formalism (Mishin et al., 2005). The ADP-type potential can correctly predict the stability of the bcc solid solution phase of U-Mo. Although there is a dramatically improved performance of the ADP compared with the EAM potential, the interactions for Xe were excluded in the ADP parametrization, and this limits the applicability of the ADP-type potential for Xe in U-Mo.
Motivated by the need of simulating Xe with a reliable potential for U-Mo, this work bridges prior separate Xe-U, Xe-Mo, and Xe-U-Mo interactions, with the U-Mo ADP developed by Starikov et al. (2018) to achieve an interatomic potential for the U-Mo-Xe system. The interatomic potential is validated, and prior results investigating the U-Mo-Xe system are investigated to demonstrate the differences from prior ternary descriptions.
The ADP (Mishin et al., 2005) formalism is a generalization of the EAM type potential, where the total energy Ei (commonly in eV) of an atom i is given by:
where α and β are the element types of atoms i and j, F is the embedding energy (the energy required to place an atom of type α into the electron cloud) and is a function of the electron density (ρ), ϕ is a pair potential interaction, and s and t = 1,2,3 and refer to the Cartesian coordinates. The μ and λ terms represent the dipole and quadrupole distortions of the local atomic environment. This formalism extends the original EAM (the first two terms in Eq. 1) by introducing angular forces as dipole and quadrupole moments (third, fourth, and fifth terms). A similar approach that involves the modification of the EAM formalism to include angular forces is the modified-EAM (MEAM) (Baskes et al., 1989; Baskes, 1992).
A given ternary potential requires interactions for each of the three species themselves, and interactions between each species, for a total of six pair descriptions. The U-U, Mo-Mo, and U-Mo interactions are taken from the 2018 version of the Starikov U-Mo ADP (Starikov et al., 2018). The descriptions of U-Xe, Mo-Xe, and Xe-Xe interactions have been previously parameterized, but for an EAM interatomic potential (Smirnova et al., 2013). Thanks to the shared underlying physics between the EAM and the ADP-type interatomic potentials, the EAM-based Xe pair interactions can be implemented into an ADP formalism, provided that appropriate scaling is performed. Therefore, the construction of a ternary interatomic potential in this work should not necessarily be considered a development step, but a reconciliation step, where multiple models have been unified under a single potential formalism, but the underlying descriptions have remained unchanged.
This work makes use of the assumption that for Xe interactions no angular forces are required for the accurate representation of forces. Given the noble nature of Xe and the lack of unpaired valence electrons, we believe that this is a reasonable assumption. Therefore, the EAM descriptions from Smirnova et al. (2013) can be taken as complete, and the third, fourth, and fifth terms in Eq. 1 can be set to zero.
The first step in the reconciliation procedure involves an invariant scaling process. The quantity
where ρ is the electron density. The energy and forces in the system are invariant to the scaling of the electron density and the embedding energy,
where F is the embedding energy and α is a scale factor. This scaling does not change the properties of the pure systems but does, in fact, change the multi-component system’s behavior. The scale factor was applied only to Xe and in such a fashion as to lead to the same electron density range as that employed for the U-Mo ADP. Thus, the scaling factor α is simply the ratio between the ρ discretization in the EAM and ADP parameterizations (approximately 0.936). This is considered minor scaling and should yield minimal impacts on ternary interactions. The invariant scaling process was validated by studying the pressure as a function of volume for pure Xe gas prior to and after the scaling process, which showed an exact match within the statistical fluctuations of the molecular dynamics simulations. No further scaling is required, as the discretization in space (r) is identical for both the ADP and EAM potentials utilized. For further detail on the fitting procedures to obtain the original potentials, please refer to the original manuscripts for the EAM (Smirnova et al., 2013) and the ADP (Starikov et al., 2018).
Simulations were performed utilizing the LAMMPS (Plimpton, 1995) software package and the U-Mo-Xe potential constructed in this work. General simulation details are listed here, and further information, where necessary, is included in the results section.
The γ phase of U-Mo is a bcc random solid substitutional solution phase with a wide compositional range. As the primary purpose of the ADP-type potential is to study the γ phase of U-Mo, its capability of stabilizing the bcc phase in the desired temperature and compositional regions needs to be justified. The stability of the bcc γ phase was examined by calculating the c/a ratio as a function of temperature and Mo molar fraction, cMo, and the stability of the bcc U-10Mo solid solution against phase separation.
A bi-crystal simulation cell with a ⟨100⟩Σ5 symmetrical tilt grain boundary was used to study possible phase separation and grain boundary segregation. The simulation cell was 15.2 nm × by 1.4 nm (y) by 30.4 nm (z) in size and contained 21.6 atomic percent Mo for the purpose of representing U-10Mo. The grain boundary was inserted in the x-y plane. After the relaxation of the initial simulation cell, hybrid molecular dynamics/Monte Carlo (MDMC) simulations were carried out at 300, 600, and 900 K. Both the EAM and ADP-type potentials have been utilized to compare their performance. In the MDMC simulations, a randomly selected Mo atom was swapped with a randomly selected U atom at every MD step. The change in total potential energy, ΔE, was calculated. The swap was accepted if
To compute the c/a ratio, a 20 × 20 × 20 bcc simulation cell was used with 16,000 atoms. The Mo molar fraction was varied from 0 to 1, with an incremental step of 0.1. The point cMo = 0.216 was also inserted to represent U-10Mo. The temperature was varied from 0 to 1000 K, with one data point every 100 K. At each temperature and for each Mo fraction, the length of the cell along the three principal axes was relaxed using a zero-stress boundary condition. The cells were found to evolve into either a body-centered-tetragonal (bct) or bcc structure, i.e., the γ phase. Here, c is taken as the smallest lattice parameter in an orthorhombic unit cell and a as the average of the two other lattice parameters. The γ phase is indicated by c/a ≈ 1, while c/a < 1 represents the bct phase. It should be noted that at high temperatures, c/a is not exactly 1 because of thermal fluctuations in the simulations, and we took c/a > 0.99 as the criteria for the appearance of the γ phase.
The vacancy formation energy,
and the Xe solution energy is defined as
where E(NUNMoV1) is the total energy of simulation cells with NU U atoms, NMo Mo atoms, and one vacancy, and E(NUNMoXe1) is the corresponding total energy when the vacancy is occupied by a Xe atom, forming a Xe substitutional. μU and μMo are the chemical potentials of U and Mo, respectively. The calculations were performed using a 10 × 10 × 10 cell with 1568 U and 432 Mo atoms, representing U-10Mo. An NPT (constant pressure and constant temperature) ensemble with zero external pressure and a temperature at 300 K was used for the calculations. A random atom was either removed or replaced with Xe to create a vacancy or Xe substitutional, respectively. The statistical approach recently proposed (Zhang et al., 2021) was used to compute
Starting from a perfect bcc simulation cell containing N = 2000 atoms, with a total energy of E0, 2000 defected simulation cells were created, each with a vacancy created by removing a different atom (denoted as k) and a total energy of Ek computed by MD. The mean vacancy formation energy,
The chemical potential of element j (U or Mo), μj, was obtained as,
In Eq. 11, Nj is the number of type j atoms, and the summation term in the right-hand side enumerates all simulations in which a type j atom was removed to create the vacancy. The chemical potentials for U and Mo were obtained using the above equations, and that of Xe was taken as 0 because of its inert nature. The chemical potentials were then used to compute the vacancy formation energies and Xe solution energies with 2,000 different atomic configurations to achieve reasonable statistics.
A supercell of 40 × 40 × 40 bcc unit cells (128,000 U atoms) was generated, and 21.6 percent of U atoms were randomly switched to Mo atoms, yielding a U-10Mo alloy in the bcc structure. Relaxation of the bulk system was performed in an NPT ensemble, relaxing each x, y, and z component individually, with a damping parameter of 0.1 ps. Temperatures of interest were 300–700 K, in increments of 100 K, which spans the realistic operating temperatures for U-Mo fuels (Meyer et al., 2017). The system was allowed to equilibrate for 200 ps at a given temperature, and subsequently, a void was constructed by deleting a sphere of atoms from the center of the supercell. This void was relaxed for 200 ps under the same simulation conditions described above. Different sizes of voids are prescribed to ensure that there were no simulation artifacts present due to the existence of a single bubble size. Voids were ensured to be sufficiently large that the surface energy had converged (Beeler et al., 2020).
In order to analyze bubbles, simulations were performed in an NVT ensemble to mimic a bubble in a very large system that effectively exerts a resistive pressure on the bubble. This allows for the calculation of a Xe bubble pressure and a subsequent equation of state (EOS) based on the density of the bubble. The generation of bubbles was performed by inserting Xe atoms into the void one at a time, while the relaxation of the system is ongoing. The insertion rate was less than one Xe atom per 8 ps for all systems. The rate of insertion was modified according to the bubble size in order to ensure a similar rate of Xe to vacancy ratio change as a function of time. This gradual insertion allows for on-the-fly relaxation and avoids pressure/energy spikes that would accompany a rapid insertion of a large number of Xe atoms. In order to track the bubble size, two atoms (one on either side of the void) were tracked throughout the simulation and the distance between the two atoms is classified as the diameter of the bubble. The pressure of the bubble was determined by computing the stress per atom on each of the Xe atoms in the system, summing the individual components of the stress tensor over all Xe atoms, and finally dividing by the degrees of freedom (three) and the volume of the bubble.
A minimization script was utilized to fit the EOS for a Virial functional form to the determined pressure and molar volume data from the molecular dynamics simulations. The data was input into the script, and the relative error was summed and utilized to optimize the EOS, iterating by providing a random step to each of the fitting coefficients and only accepting the iteration if the total relative error is reduced. This methodology is in accordance with a prior study (Beeler et al., 2020) developing a Xe bubble EOS utilizing the U-Mo-Xe EAM potential.
It should be noted that this approach assumes the nucleation of bubbles, but not does explicitly explore the nucleation phenomenon. Negative/attractive binding energies of Xe to voids/bubbles have been observed previously (Beeler et al., 2020), and bubbles are known to form experimentally. Thus, the inclusion of a nucleation stage is not expected to alter any of the results or conclusions of this manuscript.
The MDMC simulations with the EAM and ADP-type potentials predicted different stabilities for the bcc solid solution phases. As shown in Figure 1, with the EAM potential, U-10 Mo solid solution was not stable and went through a phase separation with the formation of Mo precipitates. The same results were obtained at all three simulation temperatures, 300 K, 600 K, and 900 K. In contrast, no such phase separation was observed in the simulations with the ADP-type potential at all three temperatures, where the solid solution U-10Mo remained stable, as shown in Figure 1. This again indicates the benefit of achieving an ADP-type potential with Xe. In all simulations with both potentials, no substantial grain boundary segregation was identified.
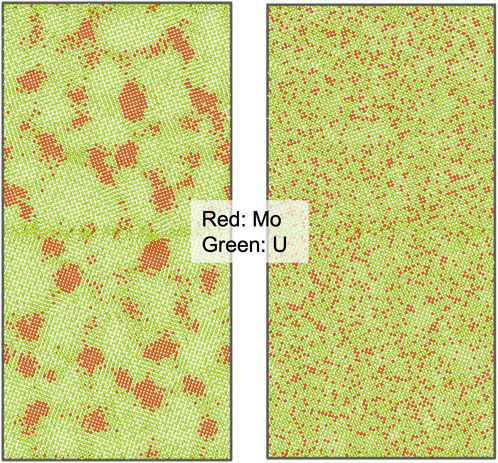
FIGURE 1. Atomic configurations from hybrid MDMC simulations at 900 K showing (left) Mo precipitation with the EAM potential and (right) stable solid solution with the ADP-type potential.
The stable zone of the γ phase is shown by the c/a ratio plotted in Figure 2. The bct phase is stable when T < 650 K and the molar fraction of Mo cMo < 0.2. In this zone, the c/a ratio increases with increasing cMo and is insensitive to temperature with a weak U-shaped dependence. In contrast, the γ phase, indicated by c/a ≈ 1, is stable when T > 650 K or cMo ≥ 0.2. Although the bct phase is not exactly the same as the α-U structure, and the transition temperature is lower than the actual α − β transition point of U, Figure 2 indicates that the potential captures the overall behavior that the γ phase is stabilized by increasing temperature and Mo concentration. It is thereby applicable for studying the properties of U-Mo systems either with high Mo content or at high temperatures. Note that this potential was primarily developed for simulating bcc U-Mo solid solution alloys.
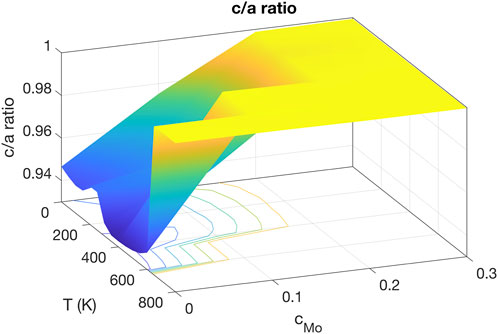
FIGURE 2. The c/a ratio as a function of Mo molar fraction and temperature. The bcc solid solution phase is stable when cMo is above 0.2 or T is above 650 K.
The atomic pressure and volume were computed to investigate their dependence on the local atomic environment. The atomic pressure is computed as
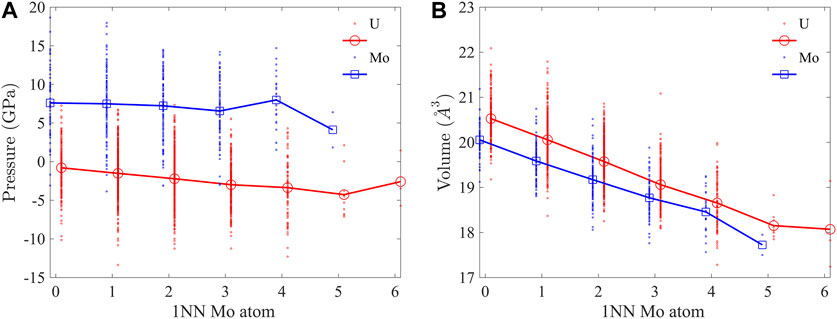
FIGURE 3. (A) Atomic pressure and (B) volume of U and Mo atoms as functions of 1NN Mo atoms. Positive (negative) pressure means tension (compression). Data points for Mo are shifted to the left and U to the right by 0.1 for clarity.
The bcc lattice of U-10Mo solid solution is highly distorted, as indicated by the bond length distribution in Figure 4A. Here, 1NN bonds in a 2,000 atom supercell equilibrated at 300 K were characterized. The U-U bond has the broadest distribution, with a standard deviation of σ = 0.23 Å, which is about 8% of the mean bond length, μ = 2.96 Å, while the range of variation spreads from 2.4 Å to about 3.6 Å. The U-Mo bond has the largest mean length (μ = 2.97 Å), and the Mo-Mo bond has the smallest mean length (μ = 2.90 Å). For the three types of bonds, the lengths decrease with an increasing number of 1NN Mo atoms, as shown in Figure 4B. In all atomic environments, U-Mo bonds have the largest average lengths. In the U-rich environment (with less than three 1NN Mo atoms), U-U bonds have larger average lengths than Mo-Mo but become shorter than Mo-Mo bonds when there are more than three 1NN Mo atoms. The U-U bonds experience the most reduction in length from U-rich to Mo-rich environments. The change in bond length is consistent with the reduction in atomic volume in Figure 3B.
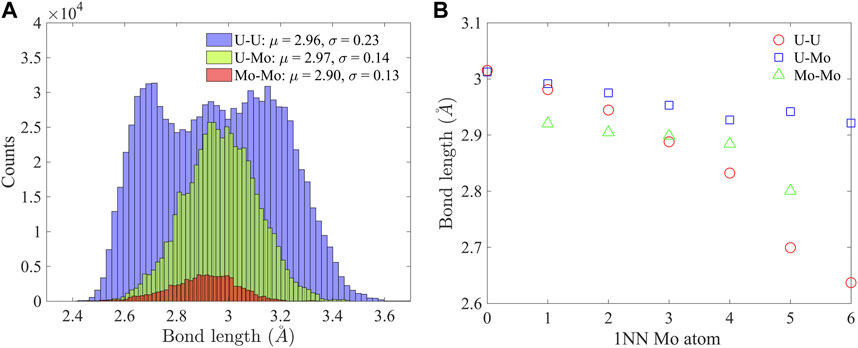
FIGURE 4. (A) Distributions of U-U, U-Mo, and Mo-Mo bond lengths, and (B) the dependence of average U-U, U-Mo, and Mo-Mo bond lengths on 1NN Mo atoms.
The vacancy formation energy

TABLE 1. Chemical potentials of U and Mo, μU and μMo, mean vacancy formation energy
It should be noted that vacancy formation energy and Xe solution energy as defined in Eqs 8, 9 do not depend on the types of atoms that are removed to create the vacancies, because the defected and reference cells have the same numbers of U and Mo atoms. As discussed in (Morgan and Zhang, 2020; Zhang et al., 2021), the formation of a vacancy in a real material system does not involve removing an atom, although it is prescribed that way in atomistic calculations. Rather, the total mass should be conserved, as Eqs 8, 9 imply. Vacancies can be generated from sinks such as free surfaces and grain boundaries without removing any atoms, and they do not feature chemical types. In atomistic calculations, as the reference cell usually has one more atom than the defected cell, the chemical potential of the removed atom is added into the defected cell to conserve the total mass and remove the dependence of the result on the type of the removed atom. As such, there is no distinction between “U vacancies” and “Mo vacancies”. There is a slight difference in composition between cells having a U atom removed and those having a Mo atom removed. Here, we assume such a negligible change in composition will not cause a substantial change in vacancy formation energy. The insertion of Xe follows the creation of a vacancy, and the resulting Xe solution energies are independent of the type of the removed atom as well.
The vacancy formation energy
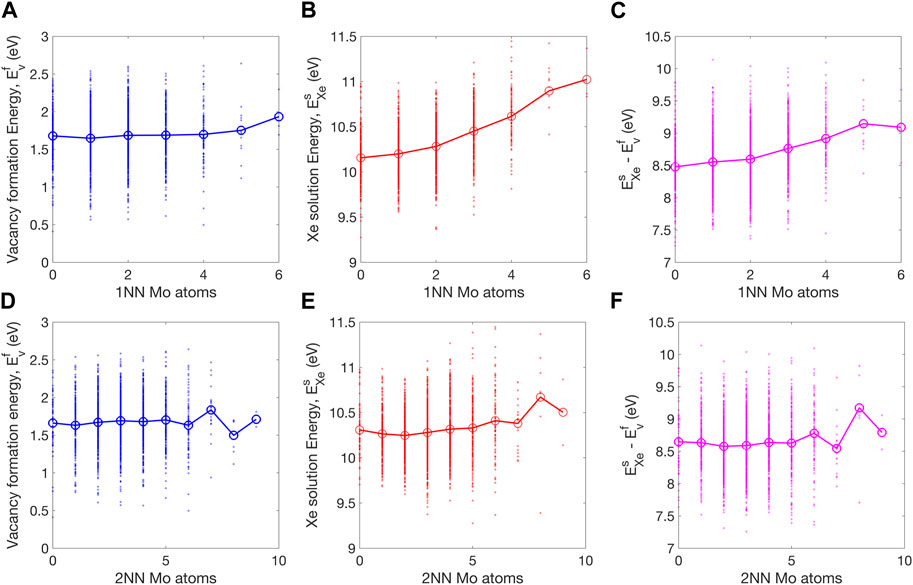
FIGURE 6. Dependence of (A) vacancy formation energy, (B) Xe solution energy, and (C) their difference on the number of 1 NN Mo atoms. In (D–F) the corresponding dependence on the number of Mo atoms within the 2NN distance are shown. The averaged values are shown by large markers connected by lines to guide the visualization.
In order to generate bubbles, voids of varying size must be generated. This allows for the calculation of a void surface area as a function of radius, and the surface energy can be determined from Eq. 12
where E* is the potential energy per atom of the system with a void, E is the potential energy per atom of the perfect crystal of U-Mo, A is the total surface area of the void, and N is the number of atoms in the system with a void. The void surface energy is shown in Figure 7 as a function of the void radius.
It can be observed that the void surface energy converges above a radius of 1.5 nm for all temperatures to a value of approximately 1.5 J/m2. Also, the void surface energy tends to increase slightly with increasing temperature. This is in accordance with the average surface energy for U-Mo planar surfaces as determined in (Beeler et al., 2018), which utilized the Starikov ADP (Starikov et al., 2018). It should be noted that the EAM potential was previously utilized to analyze void surface energy, and predicted a value 0.4 J/m2 lower than the value reported here. This provides confidence in the accurate implementation of the potential with a validation of different methodologies for obtaining average surface energies, and underlines the importance of this work to incorporate a more accurate U-Mo potential which can also describe Xe interactions. Statistical errors for the determination of surface energies are on the order of 0.04 J/m2.
The EOS can be determined by tracking both the pressure inside the bubble and the bubble size as a function of the number of Xe atoms present in the bubble while the system is equilibrated in an NVT ensemble, which provides a pressure versus density relationship. This data can be fit to an EOS that provides a generalized function predicting the relationship between pressure, temperature, and molar volume. Temperatures from 300 K to 700 K are analyzed for all bubble sizes previously mentioned.
In line with the previous study exploring the EOS of Xe bubbles in U-Mo (Beeler et al., 2020), a Virial EOS is utilized, expanded to the third order with respect to volume and the second order with respect to temperature, as is shown in equation Eq. 13,
where A = 1, and B, C, and D are temperature-dependent Taylor series of 1/T (B = b0 + b1/T + b2/T2, C = c0 + c1/T + c2/T2, and D = d0 + d1/T + d2/T2), leading to nine unique fitting parameters. The term R is the gas constant (8.3145 J/mol-K) and v is the molar volume (cm3/mol). The Virial equation is a general function relating pressure, molar volume, and temperature that can be directly derived from statistical mechanics (Onnes, 1902). No restrictions are imposed on the fitting parameters to obtain an optimized EOS.
The subsequent fit, with and without molecular dynamics data, is shown in Figures 8, 9, respectively. As expected, with higher temperatures, the pressure at a given molar volume is higher, resulting in an effective rightward shift of the data as the temperature is increased. All data with molar volumes below 500 cm3/mol are displayed in Figure 8. The MD data is removed in Figure 9 and the optimized EOS is displayed on a log/linear scale to emphasize the differences between the individual isotherms. As stated, temperature shifts the pressure to a larger value at a given molar volume, and the optimized Virial EOS accurately captures this behavior. The optimized coefficients are shown in Table 2.
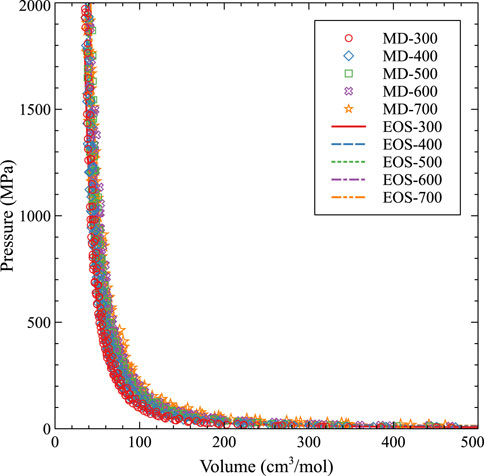
FIGURE 8. An EOS based on a virial expansion for Xe bubbles in U-10Mo from 300 K to 700 K compared to molecular dynamics data.
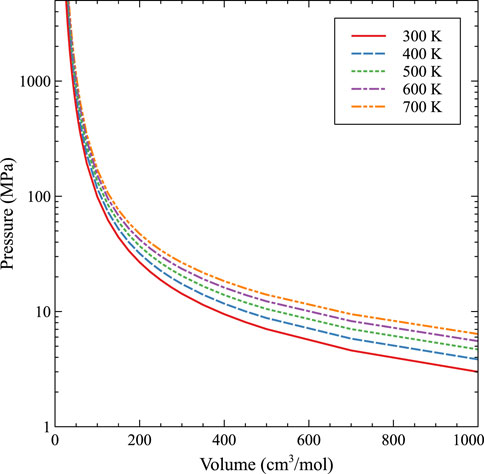
FIGURE 9. An EOS based on a Virial expansion for Xe bubbles in U-10Mo from 300 K to 700 K without molecular dynamics data.
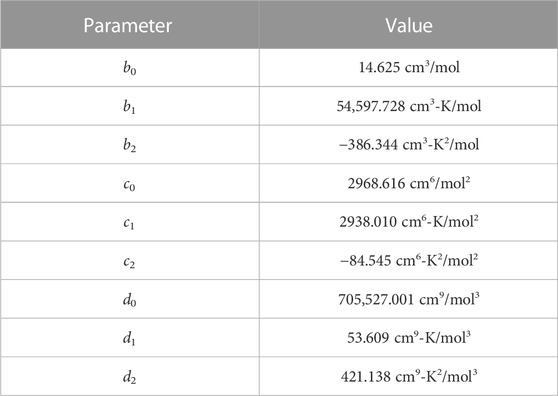
TABLE 2. Virial EOS (Eq. 13) parameters for Xe bubbles in U-Mo.
While 4th order optimizations both including and excluding the 3rd order term were pursued, as has recently been performed by Yang and Wirth, (2022) for Xe in UO2, the accuracy of the fit to the MD data was not improved. A comparison to the Kaplun EOS (Kaplun and Meshalkin, 2003) is shown in Figure 10 for 400 K and 700 K. Kaplun developed a unified EOS for liquid, gas, and fluid defined from thermodynamic equations which shows excellent agreement with experimental data for a number of species. The comparison in Figure 10 shows that at low densities, the Kaplun data and the fit to the computational data converge, with the computational EOS predicting a very slightly higher pressure (<0.2 MPa). The differences observed in Figure 10 are exaggerated due to the log/linear scale utilized in the graphical representation. However, at high densities and high pressures, there is a dramatic difference between the Kaplun EOS and the Virial EOS from this work, indicating the importance of taking into account the U-Mo matrix for the properties of Xe bubbles. Thus, this updated Virial EOS in Eq. 13 and Table 2 can be utilized to describe both high and low density/pressure bubbles in U-Mo over the prescribed temperature ranges. Unfortunately, there is no experimental data to base a comparison or to establish the ultimate accuracy of the EOS of Xe bubbles in U-Mo at high pressures and densities. Thus, we argue that the convergence to a pure Xe gas at low densities, and the specific incorporation of the accurate interaction between U, Mo, and Xe at high densities, provides a reasonable prediction for Xe bubble behavior in the U-Mo system. Figure 10.
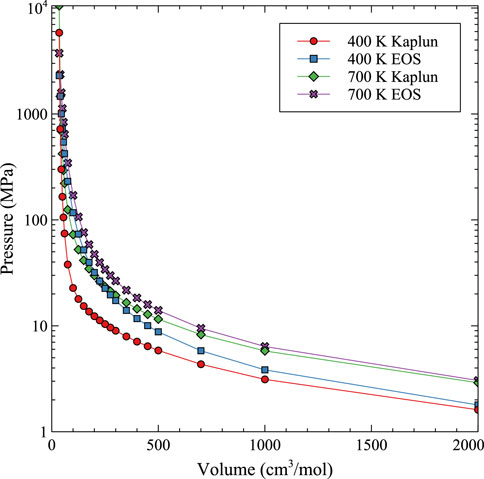
FIGURE 10. Comparison between the Kaplun unified EOS (Kaplun) and the Virial EOS from this work (EOS) over a wide range of molar volumes at 400 K and 700 K.
In this work, prior interatomic potentials for the U-Mo and the U-Mo-Xe system were reconciled under a single ADP framework, generating a novel ternary potential that utilizes the most accurate descriptions of the individual pair systems which exist. The phase stability of the γ phase of U-Mo was explored via MDMC simulations, demonstrating the inability of prior potential forms to correctly predict the stable solid solution behavior of the alloy. The distortion of the γ phase into a bct structure was analyzed as a function of temperature and composition, agreeing with experimental observations of bcc instability of U-rich systems at lower temperatures. A rigorous approach to vacancy and Xe substitutional energies was applied to this system for the first time, identifying key inaccuracies in previous potential formalisms and providing information on the effect of the local environment on the behavior of Xe substitutionals. Finally, voids and bubbles were explored in U-10Mo, verifying previous studies of void surface energy and providing a new equation of state for Xe bubbles specific to the U-Mo system. While further experimental validations are needed to justify the accuracy of the reconciled potential, this work enables studying Xe gas behavior and gas bubble properties in U-Mo solid solutions using molecular dynamics simulations. It allows for the exploration of critical phenomena related to Xe gas atoms and bubbles in U-Mo fuel and will serve to inform mesoscale and engineering scale fuel performance simulations with better reliability than existing interatomic potentials.
The raw data supporting the conclusion of this article will be made available by the authors, without undue reservation.
BB and YZ contributed to the conception and design of the study, performed molecular dynamics simulations and data analysis, generated visualizations, contributed to manuscript revision, and read and approved the submitted version.
This work was supported by the U.S. Department of Energy, Office of Material Management and Minimization, National Nuclear Security Administration, under DOE-NE Idaho Operations Office Contract DE-AC07-05ID14517. This manuscript has been authored by Battelle Energy Alliance, LLC with the U.S. Department of Energy. The publisher, by accepting the article for publication, acknowledges that the U.S. Government retains a nonexclusive, paid-up, irrevocable, worldwide license to publish or reproduce the published form of this manuscript, or allow others to do so, for U.S. Government purposes. This research made use of the resources of the High-Performance Computing Center at Idaho National Laboratory, which is supported by the Office of Nuclear Energy of the U.S. Department of Energy and the Nuclear Science User Facilities. The funder was not involved in the study design, collection, analysis, interpretation of data, the writing of this article or the decision to submit it for publication.
The authors YZ and BB declared that they were an editorial board member of Frontiers, at the time of submission. This had no impact on the peer review process and the final decision.
All claims expressed in this article are solely those of the authors and do not necessarily represent those of their affiliated organizations, or those of the publisher, the editors and the reviewers. Any product that may be evaluated in this article, or claim that may be made by its manufacturer, is not guaranteed or endorsed by the publisher.
Baskes, M. (1992). Modified embedded-atom potentials for cubic materials and impurities. Phys. Rev. B 46, 2727–2742. doi:10.1103/physrevb.46.2727
Baskes, M., Nelson, J., and Wright, A. (1989). Semiempirical modified embedded-atom potentials for silicon and germanium. Phys. Rev. B 40, 6085–6100. doi:10.1103/physrevb.40.6085
Beeler, B., Cooper, M. W., Mei, Z.-G., Schwen, D., and Zhang, Y. (2021). Radiation driven diffusion in γu-mo. J. Nucl. Mater. 543, 152568. doi:10.1016/j.jnucmat.2020.152568
Beeler, B., Hu, S., Zhang, Y., and Gao, Y. (2020). A improved equation of state for xe gas bubbles in γu-mo fuels. J. Nucl. Mater. 530, 151961. doi:10.1016/j.jnucmat.2019.151961
Beeler, B., Zhang, Y., and Gao, Y. (2018). An atomistic study of grain boundaries and surfaces in γU-Mo. J. Nucl. Mater. 507, 248–257. doi:10.1016/j.jnucmat.2018.05.007
Beeler, B., Zhang, Y., Jahid Hasan, A., Park, G., Hu, S., and Mei, Z.-G. (2023). Analyzing the effect of pressure on the properties of point defects in γu–mo through atomistic simulations. MRS Adv. 8, 1–5. doi:10.1557/s43580-022-00350-y
Daw, M., and Baskes, M. (1984). Embedded-atom method - derivation and application to impurities, surfaces, and other defects in metals. Phys. Rev. B 29, 6443–6453. doi:10.1103/physrevb.29.6443
Daw, M., Foiles, S., and Baskes, M. (1993). The embedded-atom method: A review of theory and applications. Mat. Sci. Rep. 9, 251–310. doi:10.1016/0920-2307(93)90001-u
Hu, S., Burkes, D., Lavender, C., and Joshi, V. (2016a). Effect of grain morphology on gas bubble swelling in umo fuels – A 3d microstructure dependent booth model. J. Nucl. Mat. 480, 323–331. doi:10.1016/j.jnucmat.2016.08.038
Hu, S., Burkes, D., Lavender, C., Senor, D., Setyawan, W., and Xu, Z. (2016b). Formation mechanism of gas bubble superlattice in umo metal fuels: Phase-field modeling investigation. J. Nucl. Mat. 479, 202–215. doi:10.1016/j.jnucmat.2016.07.012
Hu, S., Joshi, V., and Lavender, C. (2017). A rate-theory–phase-field model of irradiation-induced recrystallization in umo nuclear fuels. JOM 69, 2554–2562. doi:10.1007/s11837-017-2611-4
Jin, M., Gao, Y., Jiang, C., and Gan, J. (2021). Defect dynamics in γ -U, Mo, and their alloys. J. Nucl. Mater. 549, 152893. doi:10.1016/j.jnucmat.2021.152893
Kaplun, A. B., and Meshalkin, A. B. (2003). Thermodynamic validation of the form of unified equation of state for liquid and gas. High. Temp. 41 (3), 319–326. doi:10.1023/A:1024230324555
Kim, Y., Hofman, G., and Cheon, J. (2013). Recrystallization and fission-gas-bubble swelling of u-mo fuel. J. Nucl. Mat. 436, 14–22. doi:10.1016/j.jnucmat.2013.01.291
Liang, L., Kim, Y., Mei, Z.-G., Aagesen, L., and Yacout, A. (2018a). Fission gas bubbles and recrystallization-induced degradation of the effective thermal conductivity in u-7mo fuels. J. Nucl. Mat. 511, 438–445. doi:10.1016/j.jnucmat.2018.09.054
Liang, L., Mei, Z.-G., Kim, Y., Anitescu, M., and Yacout, A. (2018b). Three-dimensional phase-field simulations of intragranular gas bubble evolution in irradiated u-mo fuel. Comp. Mat. Sci. 145, 86–95. doi:10.1016/j.commatsci.2017.12.061
Liang, L., Mei, Z.-G., Kim, Y., Ye, B., Hofman, G., Anitescu, M., et al. (2016). Mesoscale model for fission-induced recrystallization in u-7mo alloy. Comp. Mat. Sci. 124, 228–237. doi:10.1016/j.commatsci.2016.07.033
Liang, L., Mei, Z.-G., and Yacout, A. (2017). Fission-induced recrystallization effect on intergranular bubble-driven swelling in u-mo fuel. Comp. Mat. Sci. 138, 16–26. doi:10.1016/j.commatsci.2017.06.013
Meyer, M., Gan, J., Jue, J., Keiser, D., Perez, E., Robinson, A., et al. (2014). IRRADIATION PERFORMANCE OF U-Mo MONOLITHIC FUEL. Nucl. Eng. Tech. 46, 169–182. doi:10.5516/net.07.2014.706
Meyer, M., Rabin, B., Cole, J., Glagolenko, I., Jones, W., Jue, J.-F., et al. (2017). Preliminary report on u-mo monolithic fuel for research reactors. Cambridge, MA: Idaho National Laboratory.
Mishin, Y., Mehl, M., and Papaconstantopoulos, D. (2005). Phase stability in the fe–ni system: Investigation by first-principles calculations and atomistic simulations. Acta Mater. 53 (15), 4029–4041. doi:10.1016/j.actamat.2005.05.001
Morgan, D., and Zhang, Y. (2020). Comment on “Thermal vacancies in random alloys in the single-site mean-field approximation”. Phys. Rev. B 101 (13), 136101. doi:10.1103/PhysRevB.101.136101
Onnes, H. K. (1902). Expression of state of gases and liquids by means of series. KNAW Proc. 4, 125.
Park, G., Beeler, B., and Okuniewski, M. A. (2021). An atomistic study of defect energetics and diffusion with respect to composition and temperature in γu and γu-mo alloys. J. Nucl. Mater. 552, 152970. doi:10.1016/j.jnucmat.2021.152970
Park, G., Beeler, B., and Okuniewski, M. A. (2023). Computational determination of a primary diffusion mode in γu-10mo under irradiation. J. Nucl. Mater. 574, 154137. doi:10.1016/j.jnucmat.2022.154137
Plimpton, S. (1995). Fast parallel algorithms for short-range molecular dynamics. J. Comp. Phys. 117, 1–19. doi:10.1006/jcph.1995.1039
Smirnova, D., Kuksin, A., Starikov, S., Stegailov, V., Insepov, Z., Rest, J., et al. (2013). A ternary eam interatomic potential for u-mo alloys with xenon. Model. Simul. Mat. Sci. Eng. 21, 035011. doi:10.1088/0965-0393/21/3/035011
Snelgrove, J., Hofman, G., Meyer, M., Trybus, C., and Weincek, T. (1997). Development of very-high density low enriched uranium fuels. Nucl. Eng. Des. 178, 119–126. doi:10.1016/s0029-5493(97)00217-3
Starikov, S., Kolotova, L., Kuksin, A., Smirnova, D., and Tseplyaev, V. (2018). Atomistic simulation of cubic and tetragonal phases of u-mo alloy: Structure and thermodynamic properties. J. Nucl. Mater. 499, 451–463. doi:10.1016/j.jnucmat.2017.11.047
Steiner, M., Calhoun, C., Klein, R., An, K., Garlea, E., and Agnew, S. (2016). α-Phase transformation kinetics of U – 8 wt% Mo established by in situ neutron diffraction. J. Nucl. Mater. 477, 149–156. doi:10.1016/j.jnucmat.2016.05.016
Yang, L., and Wirth, B. (2022). An improved xenon equation of state for nanobubbles in uo2. J. Nucl. Mater. 572, 154089. doi:10.1016/j.jnucmat.2022.154089
Ye, B., Hofman, G., Leenaers, A., Bergeron, A., Kuzminov, V., den Berghe, S. V., et al. (2018). A modelling study of the inter-diffusion layer formation in u-mo/al dispersion fuel plates at high power. J. Nucl. Mat. 499, 191–203. doi:10.1016/j.jnucmat.2017.11.035
Keywords: molecular dynamics, interatomic potential, nuclear fuel, research reactors (RRs), fission gas
Citation: Beeler B and Zhang Y (2023) The reconciliation and validation of a combined interatomic potential for the description of Xe in γU-Mo. Front. Nucl. Eng. 2:1185448. doi: 10.3389/fnuen.2023.1185448
Received: 13 March 2023; Accepted: 11 July 2023;
Published: 19 July 2023.
Edited by:
Amy Hixon, University of Notre Dame, United StatesCopyright © 2023 Beeler and Zhang. This is an open-access article distributed under the terms of the Creative Commons Attribution License (CC BY). The use, distribution or reproduction in other forums is permitted, provided the original author(s) and the copyright owner(s) are credited and that the original publication in this journal is cited, in accordance with accepted academic practice. No use, distribution or reproduction is permitted which does not comply with these terms.
*Correspondence: Benjamin Beeler, YndiZWVsZXJAbmNzdS5lZHU=
Disclaimer: All claims expressed in this article are solely those of the authors and do not necessarily represent those of their affiliated organizations, or those of the publisher, the editors and the reviewers. Any product that may be evaluated in this article or claim that may be made by its manufacturer is not guaranteed or endorsed by the publisher.
Research integrity at Frontiers

Learn more about the work of our research integrity team to safeguard the quality of each article we publish.