 Shikha Pervin
 Selina Yeasmin
 Mayeen Uddin Khandaker
 Afia Begum4
- 1Health Physics Division, Atomic Energy Centre Dhaka, Bangladesh Atomic Energy Commission, Dhaka, Bangladesh
- 2Centre for Applied Physics and Radiation Technologies, School of Engineering and Technology, Sunway University, Subang Jaya, Malaysia
- 3Department of General Educational Development, Faculty of Science and Information Technology, Daffodil International University, Dhaka, Bangladesh
- 4Department of Physics, Bangladesh University of Engineering and Technology, Dhaka, Bangladesh
Realizing the non-negligible health hazards due to radon exposure, the present study was carried out to measure the radon concentrations in indoor and outdoor environments of Atomic Energy Centre Dhaka (AECD), Bangladesh. A portable electrostatic radon-measuring device (RAD7) was used to determine the indoor radon levels in different laboratories of AECD, and a RAD7 detector with a stainless steel soil probe was employed to measure the soil gas radon in the surrounding areas of the AECD campus. The indoor radon concentration in various laboratories was found to vary from 11 ± 7 Bq/m3 to 360 ± 180 Bq/m3 with an average of 63 ± 33 Bq/m3. Overall, the average indoor radon level shows below the action level (300 Bq/m3) recommended by ICRP publication-126 for homes and workplaces. However, the laboratories having poor ventilation show a relatively higher radon level. The average soil gas radon concentration at different depths of 15 cm, 35 cm, and 55 cm was found to be 0.07 ± 0.01 kBq/m3, 2.31 ± 0.31 kBq/m3, and 22.5 ± 1.4 kBq/m3, respectively. The calculated average annual effective dose due to the inhalation of indoor radon in home and workplaces was found to be below the ICRP recommended value of 10 mSv/y. The present results could serve as a reference radon level in the indoor and outdoor environment in Dhaka city, Bangladesh.
Introduction
Naturally occurring radioactive materials (NORMs) such as 238U, 232Th,235U, and40K are ubiquitous in our dwelling environments such as soil, water, underlying rock, and geological formations with varying concentrations depending on the local geology (Shuaibu et al., 2017). These radionuclides undergo spontaneous and subsequent transformation into long and short-lived progeny. Radon (222Rn), Thoron (220Rn), and Actinon (219Rn), all gaseous radionuclides, are produced in the natural decay chains headed by 226Ra (238U), 228Ra (232Th), and 235U, respectively (Balakrishnan et al., 2021). Generally, 219Rn cannot encounter indoor air due to its insufficiency and short half-life (T1/2 = 3.96 s). On the other hand, 220Rn (T1/2 = 55.6 s) is sometimes encountered in indoor air, particularly near radon entry points and in soil gas. However, 222Rn (T1/2 = 3.82 days), a relatively long-lived member of the radon family, is the most predominantly found isotope in our dwelling environment. Usually, radon gas is released into the atmosphere from ground formation and significantly contributes to elevated indoor radon levels through some mechanisms including convection via cracks and openings, diffusion from the soil via the pore space, an emanation from building materials, off-gassing of waterborne radon into the indoor environment, and entry of radon into the structure from outdoor air (Kumar et al., 2007; Pervin et al., 2018; Lee et al., 2020). Other influencing parameters are the radium content and mineralogy of the host rock and soil, porosity, grain size, moisture content, and permeability (Antoci et al., 2007). The nature of ventilation, types of building materials, topography, and meteorological parameters play vital roles in the concentration of indoor radon. Some studies stated that ventilation and atmospheric pressure have a definite influence on the levels of radon concentration (Ashok et al., 2011).
222Rn possesses a density of 0.7 times higher than that of air. 222Rn releases an alpha particle with 5.49 MeV of energy when it decays to polonium-218. Polonium atoms are metals and tend to stick to surfaces when they come in contact with the dust particles in the air. As a result, radon and their short-lived alpha-emitting progeny are responsible for the major background radiation exposures to human beings (United Nations Scientific Committee on the Effects of Atomic Radiation, 1994). Once the contaminated dust particles are inhaled, they damage the DNA of respiratory tissues, leading to respiratory functional changes, consequently increasing the risk of lung cancer (Bahdan et al., 2010). It has been considered that radon is the second cause of lung cancer after smoking. The combined effect of indoor radon and smoking is responsible for developing lung cancer (United Nations Environment Protection Agency, 1991). It has been reported that due to radon exposure, approximately 21,000 deaths per year in the United States (National Research Council, 1999). Realizing the hazardous nature of radon exposure, several organizations have recommended the action level for indoor radon concentration. Notably, maximum permissible indoor radon concentrations of 100 Bq/m3, 150 Bq/m3, and 200–300 Bq/m3 are recommended by the World Health Organization (WHO), United States Environmental Protection Agency (US-EPA), and International Commission on Radiological Protection (ICRP), respectively (World Health Organization, 2009; International Commission on Radiological Protection, 2010). A considerable number of studies were conducted in different countries in the world including Bangladesh to measure the indoor and soil gas radon concentration via various techniques because of the health hazard following exposure (Ali et al., 2015; Sedighian et al., 2015; Tanaka et al., 2017; Sherafat et al., 2019). Concerning earlier studies in Bangladesh, Asaduzzamam et al. (2015) measured radon in different building materials collected from in and around Dhaka city using gamma spectrometry (Asaduzzaman et al., 2015). Miah et al. (1998) reported the concentrations of different radionuclides including 222Rn in the soil at greater depths in and around Dhaka city (Miah et al., 1998). Talukdur and Khan (2011) measured radon levels in Dhaka city and the other parts of Bangladesh to provide a radon mapping for the country. They utilized CR-39 based Solid-State Nuclear Track Detector (SSNTD) technique, and reported a higher radon level in the old part of Dhaka city (Talukder and Khan, 2011). By using the same SSNTD technique, Khan and Chowdhury (2003) measured the indoor radon concentration of radioactive mineral sands in the Beach Sand Exploitation Centre at Cox’s Bazar, Bangladesh (Khan and Chowdhury, 2003). Furthermore, in 2008, the same authors measured radon levels in several urban and rural residential areas in Sylhet city, and also in the Magurchara gas explosion area in Moulvibazar, Bangladesh (Hamid Khan and Chowdhury, 2008). Srivastava et al. (2001) measured indoor radon levels in the dwellings of the Rajshahi and Chuadanga regions of Bangladesh (Srivastava et al., 2001). Deeba et al. (2020) measured radon in soil and groundwater in the west coastal area of Bangladesh (Patuakhali district) using AlphaGUARD PQ2000 PRO (Saphymo, Germany) device (Deeba et al., 2020). However, most of the studies in Bangladesh are relatively old and adopted mostly SSNTD or gamma-ray spectrometry techniques. In addition, to our knowledge, no data on radon is available in and around the atomic energy center of Dhaka (AECD), Bangladesh. Note that, the AECD is located at the hub of several top-ranked educational institutions in the country. Also, it hosts many laboratories and allows postgraduate students to carry out research in physical, chemical, geological, nuclear, and biological fields. Since its establishment in 1964, it is fully functioning as a leading research center in the country, however, no earlier study on radon level in this area was conducted until this date. In this regard, it is important to know the radon exposure situation in the area under investigation since it serves as the dwelling place for many students and staff. Therefore, the present work aims to measure the indoor radon concentration in the workplace at Atomic Energy Centre, Dhaka, and radon concentration in soil gas around AECD campus and surrounding areas. The obtained radon level is used to evaluate potential health hazards due to radon inhalation.
Materials and Methods
Study Area
Dhaka is the capital of Bangladesh with a latitude of 23.8103° N and a longitude of 90.4125° E. Atomic Energy Centre, Dhaka (AECD) is located in the south part of Dhaka city. It was established in the early sixties. It is a radiological facility. Five divisions of AECD have used radioactive materials and radiation generating equipment for service, training, and Research and Development purposes. AECD has high activity industrial radiography sources and radioactive materials storage room where various kinds of radioactive materials stored since the establishment of AECD. Two large hospitals: Bangabandhu Sheikh Mujib Medical University (BSMMU) and Dhaka Medical College Hospital (DMCH), and two top-ranked universities, the University of Dhaka (DU)and Bangladesh University of Engineering and Technology (BUET) are situated around AECD. Several places such as different laboratories (old laboratories, storeroom, laboratory, and scientist sitting room) in the AECD campus were selected for indoor radon measurement, and several locations surrounding the AECD campus were selected for soil gas radon measurement under this study. Figure 1 shows the map of the study area and sampling points.
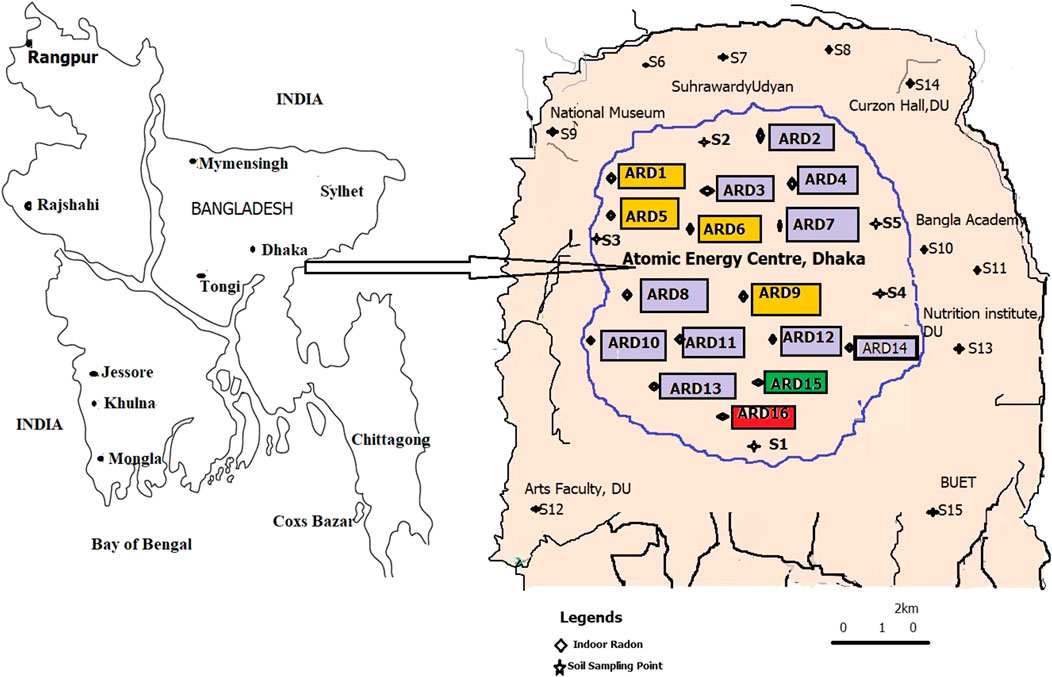
FIGURE 1. Map of study area and sampling points.
Experimental Technique
In this study, measurements of indoor radon concentration and soil gas radon were performed by using a portable electrostatic radon monitor RAD7 (Durridge Co. United States). The Durridge RAD7 uses a solid-state alpha detector. RAD7 detector has an internal sample cell of0.7-liter hemisphere, coated on the inside with an electrical conductor. The high voltage range of the detector is 2000–2500 V, which creates an electric field throughout the volume of the cell. The electric field propels positively charged particles onto the detector. It detects only alpha particles. The major advantages of this detector are the distinguishing characteristics of old radon daughters from new radon daughters, radon from thoron based on the energy of the alpha particle released, and signals from noise. The RAD7 amplifies, filters, and sorts the signals according to the signal produced by the different isotopes having different energies. RAD7 uses only the 218Po signal to determine radon concentration. The most important accessories of RAD7 were the power cord, the Laboratory Drying Unit (the large tube of desiccant, with a screw cap at one end), an inlet filter (one of the six small filters supplied), the piece of tubing with a 5/16″ ID segment at one end and a 1/8” ID segment at the other and an attached printer (RAD7 User Manual, 2012).
Indoor Radon Concentration in Various Laboratories and Office Spaces
The measurement of radon in laboratories and office spaces was conducted according to the EPA protocol (RAD7 User Manual, 2012). Among several setup protocol systems, a 1-day protocol was selected. All windows and doors of the room or laboratories were kept closed for 12 h before the measurement was taken. The air circulations were kept off. During the measurement, the RAD7 detector was placed near the center of the room, about 3–4 feet above the floor. Walls, vents, fireplaces, windows, draft, and direct sunlight were avoided. The RAD7 device was connected to the desiccant or derrite tube. The air inlet filter of RAD7 was connected to the downhole of the desiccant with a probe. The air outlet filter of RAD7 and the upper hole of desiccant were kept open. The detector was purged for at least 10 min to dry the detector and control the humidity, and then the counting was started. During the purge cycle without wasting desiccant, the RAD7 outlet was connected to the open end of the drying tube, making a closed loop for controlling the humidity with 10% or less, because high humidity can damage the sensitivity of the instrument. Then infrared printer of the system was connected to the RAD7 system. After 24 cycles, the RAD7 detector delivered mean radon concentration with standard deviation, highest radon concentration, lowest radon concentration, bar chart, and commutative spectrum. During measurement, each sample was counted four times. Then the standard deviation was taken which has been reported as uncertainty. The uncertainty of the measured radon concentration can be derived using the following equation (Ravikumar et al., 2015):
where Ns is the measured counts in time Ts and Nb is the background counts in time Tb. The standard deviation (±σ), was then converted into radon concentration in Bq/m3. On the other hand, the associated uncertainties should be contributed by statistical uncertainty (1–7%) and systematic uncertainty (4–6%). However, in this study, the reported uncertainties are the standard deviation obtained from four replicate measurements for the same sampling point.
Measurement of Radon Concentration in Soil
The radon activity concentration in soil gas was measured at 15different locations surrounding the AECD campus using a RAD7 radon detector equipped with stainless steel soil probe (Durridge Co., United States). In this study, the radon level was measured at different depths of 15 cm, 35 cm, and 55 cm at each sampling point. The necessary accessories for the soil gas probe were a probe with a pointed tip, 36.4 cm long, an extension 91.4 cm long, both with rod inserts, a T-handle, and a barbed hose adapter. The stainless steel probe with a hollow tube and sampling holes near the tip penetrates the soil to a specified depth, with a rotating handle or immersed with gentle strokes of a hammer where the soil was hard. The probe was then connected to the RAD7 detector through a desiccant tube (drying unit, CaSO4) and inlet filters by pushing the plug-in hose connector into the probe.
Figure 2 shows the schematic diagram of RAD7 based radon monitoring system for radon measurement in soil gas. The depth of the sampling point was determined by the length of the probe inserted into the ground, taking into consideration the location of the sampling points on the probe shaft.
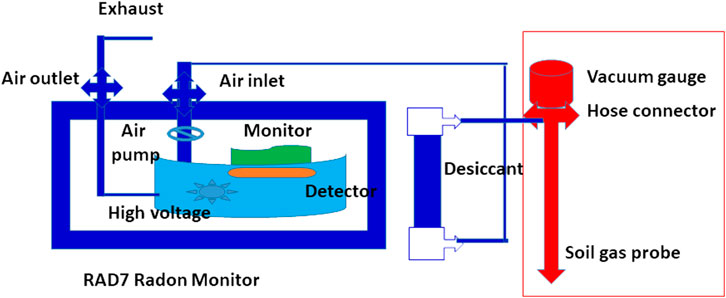
FIGURE 2. Schematic diagram of radon monitor RAD7 for radon measurement in air and soil. The left part is common for both indoor and outdoor radon measurements, while the right part is added for radon measurements in soil.
Care was taken to perform the measurements by choosing the place where the soil is uniform and generally free of rocks, to avoid cracking the probe. Before starting the counting process, the hole made in the soil surface was properly sealed by tamping down the soil around the probe in order to prevent the mixing of soil gas with air. Before each measurement, the system was purged to control the humidity to keep below 10% by using a drierite desiccant which is an important piece of equipment to absorb the moisture from the soil gas. Among several protocols of RAD7 for the soil gas measurements, the protocol that has been used here is called the sniff protocol and grab mode. The RAD7 pumps the soil gas for 5 min into the cell of the detector, and then waits for 5 min and counts only for 5 min 218Po has a half-life of 3.05 min and it takes about 4 half-lives for the 218Po activity to reach secular equilibrium. The decays of the 218Po would then be counted after 10 min (5 min of pumping plus 5 min of waiting), and within this time 95% of equilibrium would have been reached. At the end of each 30 min time, the RAD7 will print out a summary of the measurement, including data on average radon concentration in the soil-gas from the four 5-min cycle measurements along with the respective bar charts and cumulative spectra for each sample (Ravikumar et al., 2015; RAD7 Soil Probe Manual, 2012).
Figure 2 shows the schematic diagram of radon monitor RAD7 for radon measurement in air and soil. The left part is common for both indoor and outdoor radon measurements, while the right part is added for radon measurements in soil. Figure 3 shows the photos of radon measurement at 1) indoor environment of AECD campus using the RAD7 monitoring device, in the soil at 2) AECD campus, and 3) DU campus using the same device with soil probe accessories.
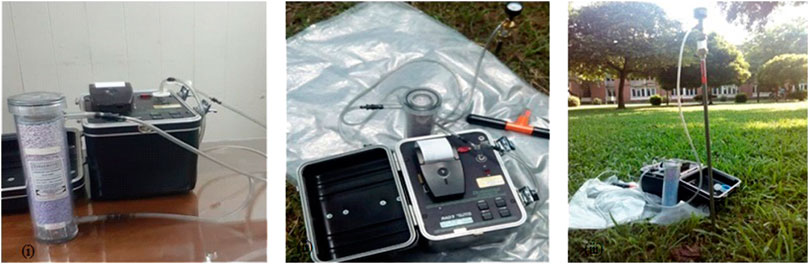
FIGURE 3. Measurement of radon at (i) indoor environment of AECD campus using the RAD7 monitoring device, in the soil at (ii) AECD campus, and (iii) DU campus using the same device with soil probe accessories.
Hazard Calculation
The annual effective dose due to inhalation of indoor radon is calculated using the following equation (United Nations Scientific Committee on the Effects of Atomic Radiation, 2000):
where IRn is indoor radon concentration in the units of Bq∙m−3. F is the equilibrium factor of 0.4, D is the dose conversion factor of 9 nSv (Bq∙m−3∙h)−1, and T is the home occupancy time, i.e., 7,000 h per year.
On the other hand, the annual effective dose for the lungs is calculated using the following equation (United Nations Scientific Committee on the Effects of Atomic Radiation, 2000):
where AED is the annual effective dose, Wt is the tissue weighting factor (0.12 for lung), and Rt is the radiation weighting factor (20 for alpha particles recommended by the ICRP).
Excess lifetime cancer risk (ELCR)is calculated using the following equation (Sherafat et al., 2019):
where AED is the annual effective dose,
Lung cancer cases per year per million people (LCC) are calculated using the following equation (Sherafat et al., 2019):
where AED is the annual effective dose in mSv/y and the risk factor for lung cancer induction is 18 × 10−6 mSv−1 y.
Results and Discussion
The indoor radon concentration was measured in fifteen laboratories on AECD campus using a radon RAD7 detector. Table 1 presents indoor radon concentration with monitoring ID, ventilation circumstances of the monitoring places, temperature, and internal relative humidity (RH) reading of the device during the counting period.
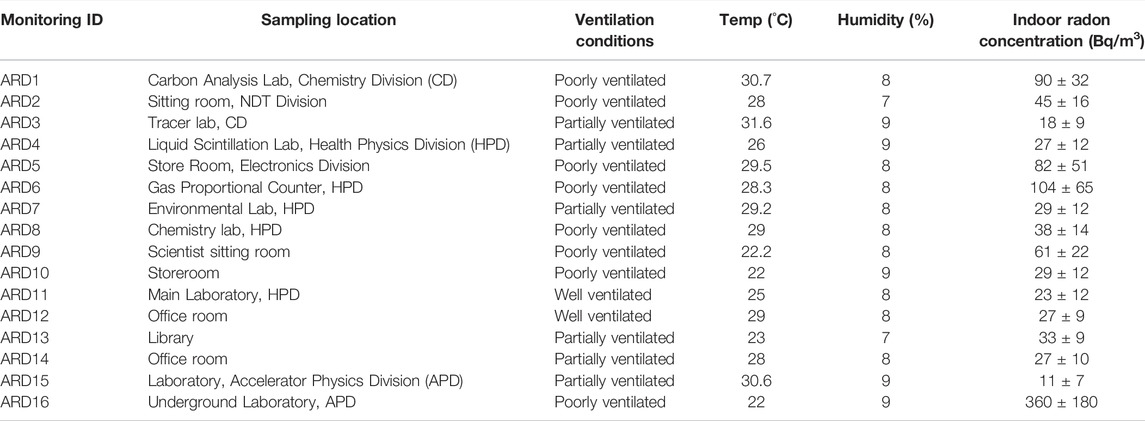
TABLE 1. Indoor radon concentration (Bq/m3) in the AECD campus with metrological data.
The indoor radon concentration in different laboratories of AECD varies from 11 ± 7 Bq/m3 to 360 ± 180 Bq/m3. The lowest radon concentration was found in the room having monitoring ID ARD15, which is green color and the highest value was found in the room with monitoring ID ARD16, which is red color as shown in Figure 1. Results show that radon activity concentration was higher in various laboratories than in the storerooms and scientist sitting rooms. Moreover, the radon activity concentration was found to be minimum at the laboratory that is frequently used compared to the laboratories that are used once or twice a week. The highest indoor radon is found in the underground laboratory where the ventilation condition is very poor. Indoor radon concentration depends on some factors such as soil gas radon concentration, radium concentration, emanation coefficient, and ventilation rate (Mehta et al., 2014). The radon concentration was found to be higher in poorly ventilated rooms compared to the well-ventilated ones. So, it was apparent that the poor ventilation system grounds higher radon concentrations in comparison to a good ventilation system, which is also supported by the literature data (Karim et al., 2016). The Environmental Protection Agency has recommended a value of 148 Bq/m3 as the action limit for indoor radon levels (United Nations Environment Protection Agency, 1991). Based on International Commission on Radiological Protection (ICRP) recommendation, residential radon should be regulated by a reference level of between 200 and 300 Bq/m3 (International Commission on Radiological Protection, 2010). The world average value of indoor radon reported by the United Nations Scientific Committee on the Effects of Atomic Radiation is 40 Bq/m3 (United Nations Scientific Committee on the Effects of Atomic Radiation, 2000). According to the International Atomic Energy Agency (IAEA) Safety Standards Series No. GSR Part 3, the reference level for 222Rn in the workplace should not exceed an annual activity concentration of 1,000 Bq/m3 (International Atomic Energy Agency, 2014).
From Table 1, it is clear that the obtained results of indoor radon value were below the action levels recommended by various international bodies. A comparison of measured radon activity concentration indoors with the results of different studies carried out around the world is given in Table 2.
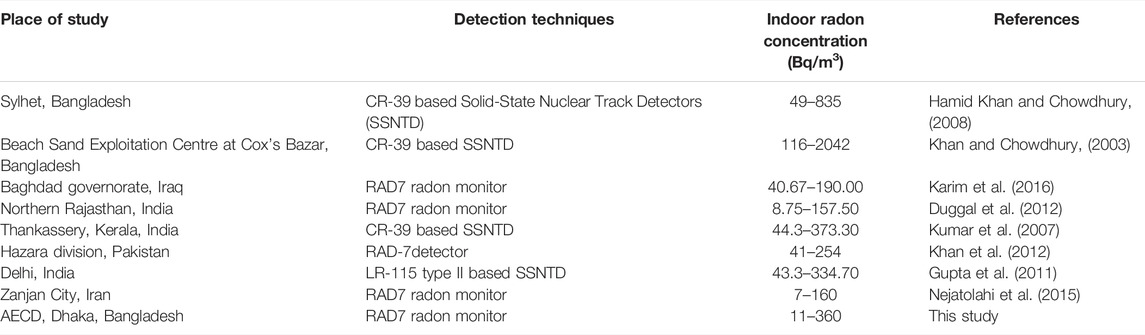
TABLE 2. The comparison of measured indoor radon concentration with results of the different studies worldwide.
From Table 2, it is clear that the results of the present study of indoor radon concentrations are in line with the results reported in different studies around the world. Particularly, the present study shows a higher concentration than the data reported from the Zanjan City of Iran, Hazara division of Pakistan, Northern Rajasthan of India, and Baghdad governorate of Iraq. In the case of Zanjan city of Iran, it was found that the number of monitoring houses was 200, and the main factors for determining the low radon concentration in the studied houses refer to geological characteristics and types of construction and architecture styles. On the other hand, the present study shows lower data than Sylhet city and Cox’s Bazar, Bangladesh, Kerala, and Delhi, India. This might be attributed to the old building structures with poor ventilation conditions.
Soil Gas Radon Activity Concentration
Radon concentration in soil gas was measured at fifteen locations of AECD campus and its surrounding areas using the RAD7 radon monitoring system, and the data is shown in Table 3. In each location, three different depths (15, 35, and 55 cm) were taken for soil gas radon measurement using a soil probe.
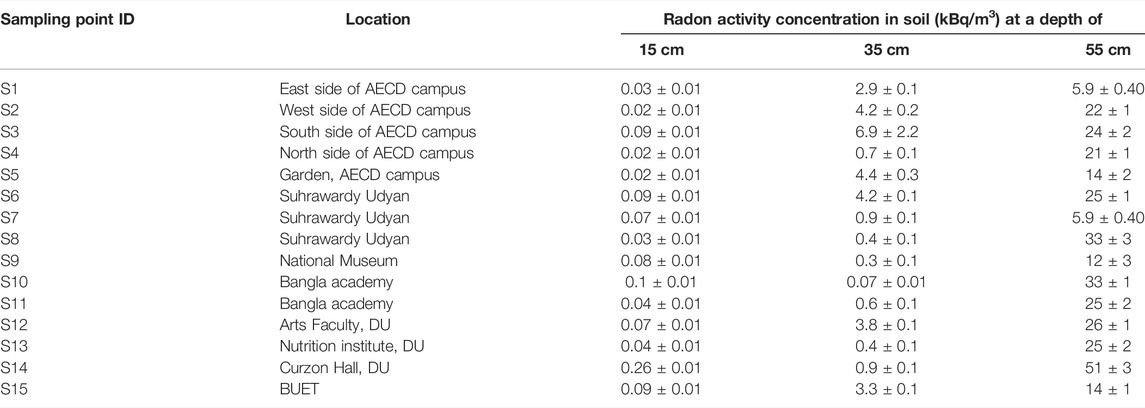
TABLE 3. Radon activity concentration in soil using the RAD7radon monitor with a soil probe.
The obtained results show that soil gas radon concentration was varied from 0.02 ± 0.01 kBq/m3 to 0.26 ± 0.01 kBq/m3 with an average value of 0.07 ± 0.01 kBq/m3 for 15 cm depth, 0.07 ± 0.01 to 6.9 ± 2.2 kBq/m3 with the average value of 2.3 ± 0.3 kBq/m3 for 35 cm depth, and 5.9 ± 0.4 kBq/m3 to 51 ± 3 kBq/m3 with the average value of 22 ± 1 kBq/m3 for 55 cm depth. The maximum allowed concentration level of radon in the soil is between 0.4–40 kBq/m3. It was found that the obtained average values were within the maximum allowed concentration level of radon in soil.
The variation of soil gas radon concentrations among three depths is shown in Figure 4. It shows that radon gas in soil was found high at 55 cm depth and minimum at 15 cm depth. Therefore, it is clear that the radon level was variable at different depths and the soil gas radon activity concentration was increased with increasing the depth. Radon activity concentration in soil gas usually increases with increasing depth due to some facts such as moisture content increases with the depth of the soil, increasing water content in the pores. The result of the present study agrees with the findings of some reported values (Duggal et al., 2015; Mittal et al., 2015). It is also reported that high radon concentration depends on high uranium content rocks (Cevik et al., 2011). A comparison of measured radon activity concentration in soil gas with the results of different studies carried out around the world at different depths is given in Table 4.
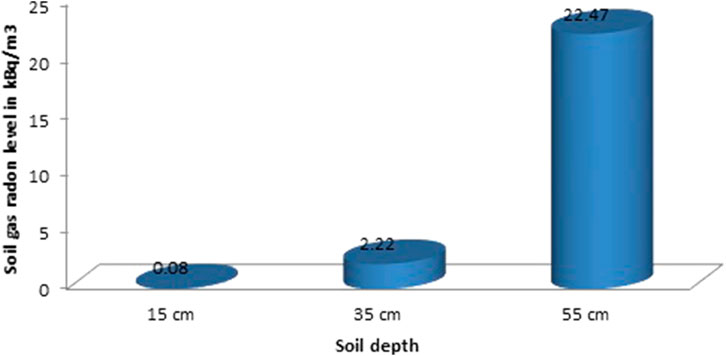
FIGURE 4. The variations of radon activity concentration in soil among three depths using radon monitor RAD7 with soil probe accessories.
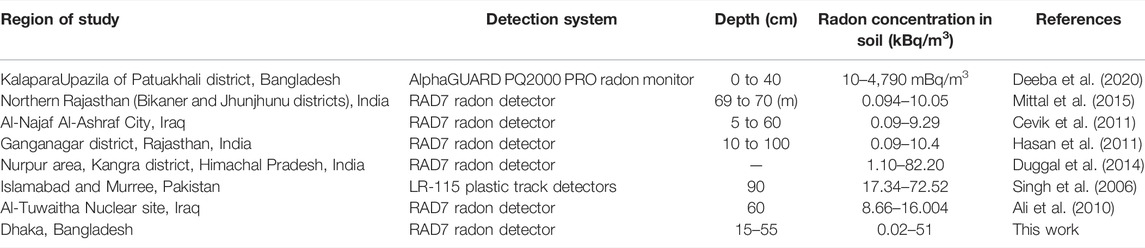
TABLE 4. The comparison of measured soil gas radon concentration with results of other studies around the world.
From Table 4, it is clearly seen that the radon concentration in the soil of the present study was lower than in the Kangra district of Himachal Pradesh in India, and the Islamabad and Murree area in Pakistan. On the other hand, this study shows higher data than the Kalapara Upazila of Patuakhali district in Bangladesh, Jaintapur, and adjacent areas of Sylhet in Bangladesh, Northern Rajasthan and Ganganagar district of Rajasthan in India, Al-Najaf Al-Ashraf City of Iraq, Islamabad and Murreein Pakistan and Al-Tuwaitha Nuclear site of Iraq. Such a variation of data might be attributed to the variation in soil depth, detection techniques as well as geological characteristics.
The annual effective dose, lungs dose, and excess lifetime cancer risk are calculated due to exposure to indoor radon and presented in Table 5.
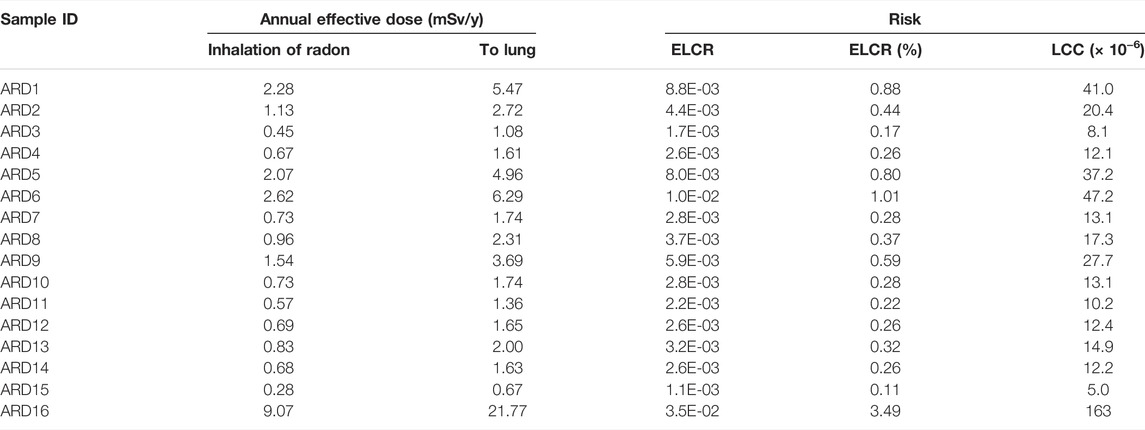
TABLE 5. Annual effective dose and risks for the AECD dwellers/staffs due to indoor radon exposure.
From Table 5, it has been seen that the highest annual effective dose due to inhalation of radon and annual effective dose to lungs were found at 9.07 mSv/y and 21.77 mSv/y, respectively. The value of the annual effective dose of the present study was found to be below the ICRP recommended range of 3–10 mSv/y for exposure to 222Rn at workplaces. The calculated value of ELCR ranged from 0.11 to 3.49%, and it was found that two values of ELCR are higher than the action level of ELCR recommended by the US-EPA. The lowest value of LCC was found to be 4.99 in ARD15 and the highest value was 163.30 in ARD16, which was below the range of 170–230 per million people recommended by the ICRP (Sherafat et al., 2019).
Conclusion
This study has measured the indoor and outdoor radon levels in various laboratories and office spaces and surrounding areas of the Atomic Energy Centre, Dhaka, Bangladesh. A portable electrostatic RAD7 radon monitor was used in this measurement. Indoor radon concentrations in different laboratories on AECD campus were found in the range from 11 ± 7 Bq/m3 to 360 ± 180 Bq/m3, and only one laboratory room was found to contain radon concentration higher than the safety limit of 148 Bq/m3 recommended by the U.S. Environmental Protection Agency. The annual effective doses were found to be below the recommended value of radon for the workplace by ICRP. The concentration of soil gas radon in the adjacent areas of the AECD campus was measured by employing the RAD7 detector with a stainless steel soil probe. The average soil gas radon concentrations at a depth of 15, 35, and 55 cm were found 0.07 ± 0.01 kBq/m3, 2.3 ± 0.3 kBq/m3, and 22.5 ± 1.4 kBq/m3, respectively. The minimum radon activity concentration was found at 15 cm depth and the maximum concentration was found at 55 cm. The measured radon concentrations in most of the studied places are within the recommended action level, thus the monitoring area is safe from the viewpoint of radon exposure and associated hazards. Overall, this study provides baseline data on indoor and soil gas radon levels at busy work in the capital city of Bangladesh. The provided data may be helpful for source identification and countrywide mapping of 222Rn in the future.
Data Availability Statement
The original contributions presented in the study are included in the article/Supplementary Material; further inquiries can be directed to the corresponding author.
Author Contributions
SP: preparation, analysis, and writing. SY: supervision. MK: review and editing. AB: supervision.
Conflict of Interest
The authors declare that the research was conducted in the absence of any commercial or financial relationships that could be construed as a potential conflict of interest.
Publisher’s Note
All claims expressed in this article are solely those of the authors and do not necessarily represent those of their affiliated organizations, or those of the publisher, the editors, and the reviewers. Any product that may be evaluated in this article, or claim that may be made by its manufacturer, is not guaranteed or endorsed by the publisher.
Acknowledgments
The authors would like to acknowledge the support given to this work by the Health Physics Division and all divisional heads of the AECD campus for permitting to use their laboratory during the measurement.
References
Ali, N., Khan, E. U., Akhter, P., Khan, F., and Waheed, A. (2010). Estimation of Mean Annual Effective Dose through Radon Concentration in the Water and Indoor Air of Islamabad and Murree. Radiat. Prot. Dosim. 141, 183–191. doi:10.1093/rpd/ncq160
Ali, N., Muhammad, W., Khattak, N. U., Khan, E. U., Rajput, M. U., Akram, M., et al. (2015). Radon Doses in the Indoor Environments of Murree and Islamabad, Pakistan: A Comparison of Active and Passive Techniques. Indoor Built Environ 0, 1–12.
Antoci, C., Immè, G., Delfa, S. L., Nigro, S. L., Morelli, D., and Alessandro, G. P. G. (2007). Alessandro, Indoor and Soil Radon Measurements in the Hyblean Foreland (South-East Sicily). Ann. Geophys. 50 (4).
Asaduzzaman, K., Mannan, F., Khandaker, M. U., Farook, M. S., Elkezza, A., Amin, Y. B. M., et al. (2015). Assessment of Natural Radioactivity Levels and Potential Radiological Risks of Common Building Materials Used in Bangladeshi Dwellings. PLoS one 10, e0140667. doi:10.1371/journal.pone.0140667
Ashok, G. V., Nagaiah, N., and Prasad, S. N. G. (2011). Indoor and Soil Radon Measurements in the Hyblean Foreland (South-East Sicily). Indoor Radon Concentration and its Possible Dependence on Ventilation Rate and Flooring Type. Radiat. Prot. Dosim., 1–9.
Bahdan, K., Mehra, R., and Sonkawade, R. R. G. (2010). Measurement of Radon Concentration in Ground Water Using RAD7 and Assessment of Average Annual Dose in the Environs of NITJ, Punjab, India. Indian J. Pure Appl. Phys. 48, 508–511.
Balakrishnan, D., Jojo, P. J., and Khandaker, M. U. (2021). Inhalation Dose in the Indoor Environment of Eloor Industrial Area, Kerala, India. Radiat. Phys. Chem. 188, 109655. doi:10.1016/j.radphyschem.2021.109655
Cevik, U., Kara, A., Celik, N., Karabidak, M., and Celik, A. (2011). Radon Survey and Exposure Assessment in Karaca and Çal Caves, Turkey. Water Air Soil Pollut. 214, 461–469. doi:10.1007/s11270-010-0437-6
Deeba, F., Rahman, S. H., and Kabir, M. Z. (2020). Radon Concentration in Soil and Groundwater of West Coastal Area, Bangladesh. Radiat. Prot. Dosim. 1–8. doi:10.1093/rpd/ncaa134
Duggal, V., Mehra, R., and Rani, A. (2015). An Investigation of Factors Influencing Indoor Radon Concentrations in Dwellings of Northern Rajasthan, India. J. Geol. Soc. India 86, 173–180. doi:10.1007/s12594-015-0296-2
Duggal, V., Rani, A., and Mehra, R. (2012). Indoor Radon Level Measurements in the Dwellings of Northern Rajasthan, India. Adv. Appl. Sci. Res. 3, 3956–3960.
Duggal, V., Rani, A., and Mehra, R. (2014). Measurement of Soil-Gas Radon in Some Areas of Northern Rajasthan, India. J. Earth Syst. Sci. 123, 1241–1247. doi:10.1007/s12040-014-0473-5
Gupta, M., Mahur, A. K., Sonkawade, R. G., and Verma, K. D. (2011). Monitoring of Indoor Radon and its Progeny in Dwellings of Delhi Using SSNTDs. Relation 6, 7.
Hamid Khan, M. A., and Chowdhury, M. S. (2008). Radon Measurements in Some Areas in Bangladesh. Radiat. Meas. 43, S410–S413. doi:10.1016/j.radmeas.2008.03.050
Hasan, A. K., Subber, R. H., and Shaltakh, A. R. (2011). Measurement of Radon Concentration in Soil Gas Using RAD7 in the Environs of Al-Najaf Al-Ashraf City-Iraq. Adv. Appl. Sci. Res. 2, 273–278.
International Atomic Energy Agency (2014). Radiation Protection and Safety of Radiation Sources: International Basic Safety Standards, Safety Standards Series No. GSR Part -3. Vienna.
International Commission on Radiological Protection (2010). Lung Cancer Risk from Radon and Progeny and Statement on Radon. Oxford: ICRP Publication, 115. Ann. ICRP, 40(1).
Karim, M. S., Daroysh, H. H., and Mohammed, A. N. (2016). Assessment of Indoor Radon Concentrations in Dwellings for Baghdad Governorate by Using RAD-7 Detector. Detection 04, 40–44. doi:10.4236/detection.2016.42006
Khan, F., Ali, N., Khan, E. U., Khattak, N. U., Raja, I. A., Baloch, M. A., et al. (2012). Study of Indoor Radon Concentrations and Associated Health Risks in the Five Districts of Hazara Division, Pakistan. J. Environ. Monit. 14, 3015–3023. doi:10.1039/c2em30445g
Khan, M. A. H., and Chowdhury, M. S. (2003). The Measurement of Radon Working Levels at a Mineral Separation Pilot Plant in Cox's Bazar, Bangladesh. Health Phys. 85, 466–470. doi:10.1097/00004032-200310000-00010
Kumar, R., Mahur, A. K., John, J. P., and Prasad, R. (2007). Study of Radon and its Progeny Levels Dwellings of Thankassery, Kerala, India. Indian J. Pure Appl. Phys. 45, 877–879.
Lee, K. Y., Park, S. Y., and Kim, C. G. (2020). Effects of Radon on Soil Microbial Community and Their Growth. Environ. Eng. Res. Environ. Eng. Res. 25, 29–35.
Mehta, V., Singh, S. P., Chauhan, R. P., and Mudahar, G. S. (2014). Measurement of Indoor Radon, Thoron and Their Progeny Levels in Dwellings of Ambala District, Haryana, Northern India Using Solid State Nuclear Track Detectors. Rom. J. Phys. 59, 834–845.
Miah, F. K., Roy, S., Touchiduzzaman, M., and Alam, B. (1998). Distribution of Radionuclides in Soil Samples in and Around Dhaka City. Appl. Radiat. Isotopes 49, 133–137. doi:10.1016/s0969-8043(97)00232-7
Mittal, S., Rani, A., and Mehra, R. (2015). Estimation of Radon Concentration in Soil and Groundwater Samples of Northern Rajasthan, India. J. Radiat. Res. Appl. Sci., 1–6.
Muhsin Zayir Al-bakhat, Y., Al-Ani, N. H. K., Mohammed, B. F., Ameen, N. H., Jabr, Z. A. Z., and Hammid, S. H. (2017). Measurement of Radon Activity in Soil Gas and the Geogenic Radon Potential Mapping Using RAD7 at Al-Tuwaitha Nuclear Site and the Surrounding Areas. Rst 3, 29–34. doi:10.11648/j.rst.20170303.13
National Research Council (1999). Committee on Health Risks of Exposure to Radon. In Health Effects of Exposure to Radon. Washington, D.C.: National Academies Press. VI.
Nejatolahi, M., Mehrjo, F., Sheykhi, A., and Alamdarlo, F. V. (2015). Measurement of Indoor Radon Concentration Levels and Effective Dose Assessment in the Zanjan City, Iran. J. Environ. Pollut. Hum. Health 3, 1–3.
Pervin, S., Yeasmin, S., Ferdous, J., and Begum, A. (2018). A Study of Radon Concentration in Tap Water of Dhaka City. J. Environ. Pollut. Manage 1, 205.
Rad7 Soil Probe Manual (2012). Durridge Radon Instrumentation, RAD7 Radon Detector. USA: Durridge Co.
Ravikumar, P., Davis, D., Somashekar, R. K., and Prakash, K. L. (2015). Measurement of Radon Activity in Soil Gas Using RAD7 in the Environs of Chitradurga District, Karnataka, India. Elixir. Earth. Sci. 80, 31078–31082.
Sedighian, S., Kim, S. H., Cho, S. Y., Kim, M. J., Kim, D. J., and Cha, D. W. (2015). Parameter Ranking System of Indoor Radon Concentration in South Korea, Case Studies: Dokdo Island, Yang Pyeong and NaeGi. Int. J. Environ. Res., 1233–1236.
Sherafat, S., Nemati Mansour, S., Mosaferi, M., Aminisani, N., Yousefi, Z., and Maleki, S. (2019). First Indoor Radon Mapping and Assessment Excess Lifetime Cancer Risk in Iran. MethodsX 6, 2205–2216. doi:10.1016/j.mex.2019.09.028
Shuaibu, H. K., Khandaker, M. U., Alrefae, T., and Bradley, D. A. (2017). Assessment of Natural Radioactivity and Gamma-Ray Dose in Monazite Rich Black Sand Beach of Penang Island, Malaysia. Mar. Pollut. Bull. 119, 423–428. doi:10.1016/j.marpolbul.2017.03.026
Singh, S., Kumar Sharma, D., Dhar, S., and Singh Randhawa, S. (2006). Geological Significance of Soil Gas Radon: A Case Study of Nurpur Area, District Kangra, Himachal Pradesh, India. Radiat. Meas. 41, 482–485. doi:10.1016/j.radmeas.2005.10.009
Srivastava, A., Zaman, M. R., Dwivedi, K. K., and Ramachandran, T. V. (2001). Indoor Radon Level in the Dwellings of the Rajshahi and Chuadanga Regions of Bangladesh. Radiat. Meas. 34, 497–499. doi:10.1016/s1350-4487(01)00214-1
Talukder, S. R., and Khan, M. A. (2011). Proceedings of the Seventeenth National Symposium on Solid State Nuclear Track Detectors and Their Applications: Abstracts and Souvenir.
Tanaka, A., Minami, N., Yasuoka, Y., Iimoto, T., Omori, Y., Nagahama, H., et al. (2017). Accurate Measurement of Indoor Radon Concentration Using a Low-Effective Volume Radon Monitor. Radiat. Prot. Dosim. 177, 324–330. doi:10.1093/rpd/ncx050
United Nations Environment Protection Agency (1991). National Primary Drinking Water Regulations; Radionuclides; Proposed Rules. Fed. Regist. 56, 33050.
United Nations Scientific Committee on the Effects of Atomic Radiation (2000). Exposure Due to Natural Radiation Sources. New York: United Nations Publications.
United Nations Scientific Committee on the Effects of Atomic Radiation (1994). Sources, Effects and Risks of Ionizing radiationReport to the General Assembly with Annexes. New York: United Nations Publications.
Keywords: radon concentration, alpha spectrometry, workplace, soil gas, annual effective dose, reference data
Citation: Pervin S, Yeasmin S, Khandaker MU and Begum A (2022) Radon Concentrations in Indoor and Outdoor Environments of Atomic Energy Centre Dhaka, Bangladesh, and Concomitant Health Hazards. Front. Nucl. Eng. 1:901818. doi: 10.3389/fnuen.2022.901818
Received: 22 March 2022; Accepted: 09 May 2022;
Published: 21 June 2022.
Edited by:
Natasa Todorovic, University of Novi Sad, SerbiaReviewed by:
Mostafa Yuness Abdelfatah Mostafa, Minia University, EgyptAyhan Kara, Giresun University, Turkey
Copyright © 2022 Pervin, Yeasmin, Khandaker and Begum. This is an open-access article distributed under the terms of the Creative Commons Attribution License (CC BY). The use, distribution or reproduction in other forums is permitted, provided the original author(s) and the copyright owner(s) are credited and that the original publication in this journal is cited, in accordance with accepted academic practice. No use, distribution or reproduction is permitted which does not comply with these terms.
*Correspondence: Shikha Pervin, c2hpa2hhLnBlcnZpbkB5YWhvby5jb20=