 Megan R. Nelson
 Elizabeth G. Keeling1,2
 Ashley M. Stokes
 Maurizio Bergamino
- 1Division of Neuroimaging Research, Barrow Neurological Institute, Phoenix, AZ, United States
- 2School of Life Sciences, Arizona State University, Tempe, AZ, United States
Background: Mild Cognitive Impairment (MCI) is a transitional stage from normal aging to dementia, characterized by noticeable changes in cognitive function that do not significantly impact daily life. Diffusion MRI (dMRI) plays a crucial role in understanding MCI by assessing white matter integrity and revealing early signs of axonal degeneration and myelin breakdown before cognitive symptoms appear.
Methods: This study utilized the Alzheimer’s Disease Neuroimaging Initiative (ADNI) database to compare white matter microstructure in individuals with MCI to cognitively normal (CN) individuals, employing advanced dMRI techniques such as diffusion kurtosis imaging (DKI), mean signal diffusion kurtosis imaging (MSDKI), and free water imaging (FWI).
Results: Analyzing data from 55 CN subjects and 46 individuals with MCI, this study found significant differences in white matter integrity, particularly in free water levels and kurtosis values, suggesting neuroinflammatory responses and microstructural integrity disruption in MCI. Moreover, negative correlations between Mini-Mental State Examination (MMSE) scores and free water levels in the brain within the MCI group point to the potential of these measures as early biomarkers for cognitive impairment.
Conclusion: In conclusion, this study demonstrates how a multimodal advanced diffusion imaging approach can uncover early microstructural changes in MCI, offering insights into the neurobiological mechanisms behind cognitive decline.
1 Introduction
Mild cognitive impairment (MCI) is characterized by changes in cognitive abilities that exceed what might be expected from normal cognitive aging but do not significantly interfere with daily activities (Anand and Schoo, 2024). Factors such as genetics, diabetes, depression, stroke, and other medical conditions can contribute to the development of MCI (Roberts and Knopman, 2013). Neuropathological changes due to Alzheimer’s disease (AD) pathology, including amyloid-beta plaques, tau tangles, and neurodegeneration, may also contribute to the development of MCI. While MCI is a risk factor for dementia, not all individuals with MCI progress to dementia; some remain stable, and others may even revert to normal cognitive function.
Several neuroimaging techniques have emerged as valuable tools for investigating the neuropathological changes associated with MCI in recent years (Yanhong et al., 2013; Yin et al., 2013). Among these techniques, diffusion MRI (dMRI) is used to study the microstructural alterations in brain tissue. By measuring the diffusion of water molecules in the brain, dMRI provides insights into the integrity of white matter tracts and the organization of neuronal connections (Le Bihan, 2014; Mueller et al., 2015), which is often compromised in individuals with MCI. Disruptions in white matter microstructure, such as axonal degeneration and myelin breakdown, can precede the onset of cognitive symptoms and serve as early biomarkers of neurodegenerative processes (Power et al., 2019). Additionally, dMRI allows for the investigation of structural connectivity networks in the brain (Zhang et al., 2022), shedding light on the degeneration of functional pathways associated with cognitive decline in MCI.
Diffusion tensor imaging (DTI) is a technique widely employed in dMRI studies, owing to its proficiency in assessing white matter microstructure and inferring fiber tractography. DTI metrics like fractional anisotropy (FA) and tractography (Tae et al., 2018) enable the identification of network topology changes and specific brain regions particularly vulnerable to degeneration. However, DTI-derived metrics may provide ambiguous or misleading data in areas with crossing fibers or complex tissue microenvironments, thus hindering the accurate assessment of white matter integrity (Coutu et al., 2014). Advanced dMRI methods, such as diffusion kurtosis imaging (DKI) (Jensen et al., 2005; Jensen and Helpern, 2010; Falangola et al., 2013) and free-water imaging (FWI) (Pasternak et al., 2009), have emerged as robust alternatives to conventional DTI. These approaches address the limitations of DTI by modeling non-Gaussian diffusion processes associated with intricate fiber geometries and accommodating various tissue compartments (Jensen et al., 2005; Jensen and Helpern, 2010; Steven et al., 2014), such as cerebrospinal fluid (CSF) and extracellular free water (Pierpaoli et al., 1996).
DKI captures the complex diffusion patterns exhibited by biological tissues more accurately than DTI by incorporating higher-order diffusion moments, such as kurtosis, which provides insights into tissue microstructural complexity (Jensen et al., 2005; Jensen and Helpern, 2010). Lower diffusion kurtosis values indicate less constrained diffusion, which may correlate with neuronal loss or other pathological alterations (Arab et al., 2018). FWI accounts for the influence of free water contamination by estimating the volume fraction of extracellular free water (f) within brain tissue. FWI enables the derivation of DTI metrics corrected for this confounding factor, thus enhancing the specificity of white matter assessments (Pasternak et al., 2009; Bergamino et al., 2017, 2021). DKI and FWI have been used in studies investigating MCI and dementia, yielding significant findings that contribute to the understanding of these conditions (Dumont et al., 2019; Bergamino et al., 2021, 2024; Chu et al., 2022).
In addition to diffusion changes, white matter hyperintensities (WMH) are commonly observed on MRI scans of elderly individuals and are biomarkers of cerebral small vessel disease (Kynast et al., 2018). WMH can disrupt white matter tracts, leading to impaired communication between brain regions (Garnier-Crussard et al., 2023). Previous studies have found that higher WMH volume increases the risk of developing MCI and dementia, indicating that WMH may serve as a biomarker for cognitive decline (Debette and Markus, 2010). For these reasons, WMHs were included as a covariate to help control for its confounding effects, isolating the impact between white matter tracts and cognitive decline in MCI.
This study assessed white matter microstructural differences between a cohort of individuals with MCI and an age-matched group of cognitively normal individuals (CN), utilizing data from the Alzheimer’s Disease Neuroimaging Initiative (ADNI) database (Petersen et al., 2010).1 This study utilized three distinct dMRI techniques—free-water DTI, kurtosis imaging, and mean signal diffusion kurtosis imaging (MSDKI)—to investigate MCI. To our knowledge, no prior study has integrated both free-water DTI and kurtosis imaging in MCI research, nor has the MSDKI model been applied in this context. This multi-modal approach enables a comprehensive analysis of white matter microstructural alterations, offering insights that single-technique studies may overlook. Addressing the extracellular free-water component and capturing non-Gaussian diffusion behavior will achieve a more precise characterization of the tissue microstructure heterogeneity associated with MCI. Moreover, voxel-based correlations between the Mini-Mental State Exam (MMSE) scores (Arevalo-Rodriguez et al., 2015) and diffusion metrics were assessed within the MCI group.
2 Methods
2.1 Participants
All data were downloaded from the ADNI database (Petersen et al., 2010). Inclusion criteria included the designation of CN or MCI and the availability of anatomical and multi-shell dMRI data. Subjects missing the magnetization-prepared rapid gradient-echo (MPRAGE) or T2-weighted fluid-attenuated inversion recovery (T2-FLAIR) images were excluded. Fifty-five CN subjects (39 females; age (standard deviation, SD) = 76.1 (7.0) years) and 46 MCI individuals (16 females age = 74.2 (7.6) years) were included in this study.
Mini-Mental State Examination (MMSE) scores were available for all 55 CN individuals and 45 subjects with MCI. The primary function of the MMSE is to assess cognitive abilities such as orientation, memory, attention, language skills, and visuospatial abilities. Scoring on the MMSE ranges from 0 to 30 points, with a score of 25 or higher considered normal. Scores below 24 may indicate possible cognitive impairment (Arevalo-Rodriguez et al., 2015). Additional cognitive assessments administered to both groups and available in the ADNI dataset included the Geriatric Depression Scale (GDS), a screening tool to evaluate depressive symptoms in older adults (Yesavage et al., 1982); the Functional Activities Questionnaire (FAQ), designed to assess instrumental activities of daily living, particularly in older adults with cognitive impairment (Marshall et al., 2015); and the Clinical Dementia Rating (CDR), a tool used to stage dementia severity and track changes in cognitive function longitudinally (Morris, 1993).
Apolipoprotein E (ApoE) status is a genetic risk factor implicated in AD risk. Patients with the e4 allele show a higher risk of developing MCI and AD, with the additive risk associated with homozygous e4/e4 alleles (Liu et al., 2013). On the other hand, the e2 allele is protective for AD risk. ApoE status and complete demographic and clinical characteristics of the study participants are shown in Table 1.
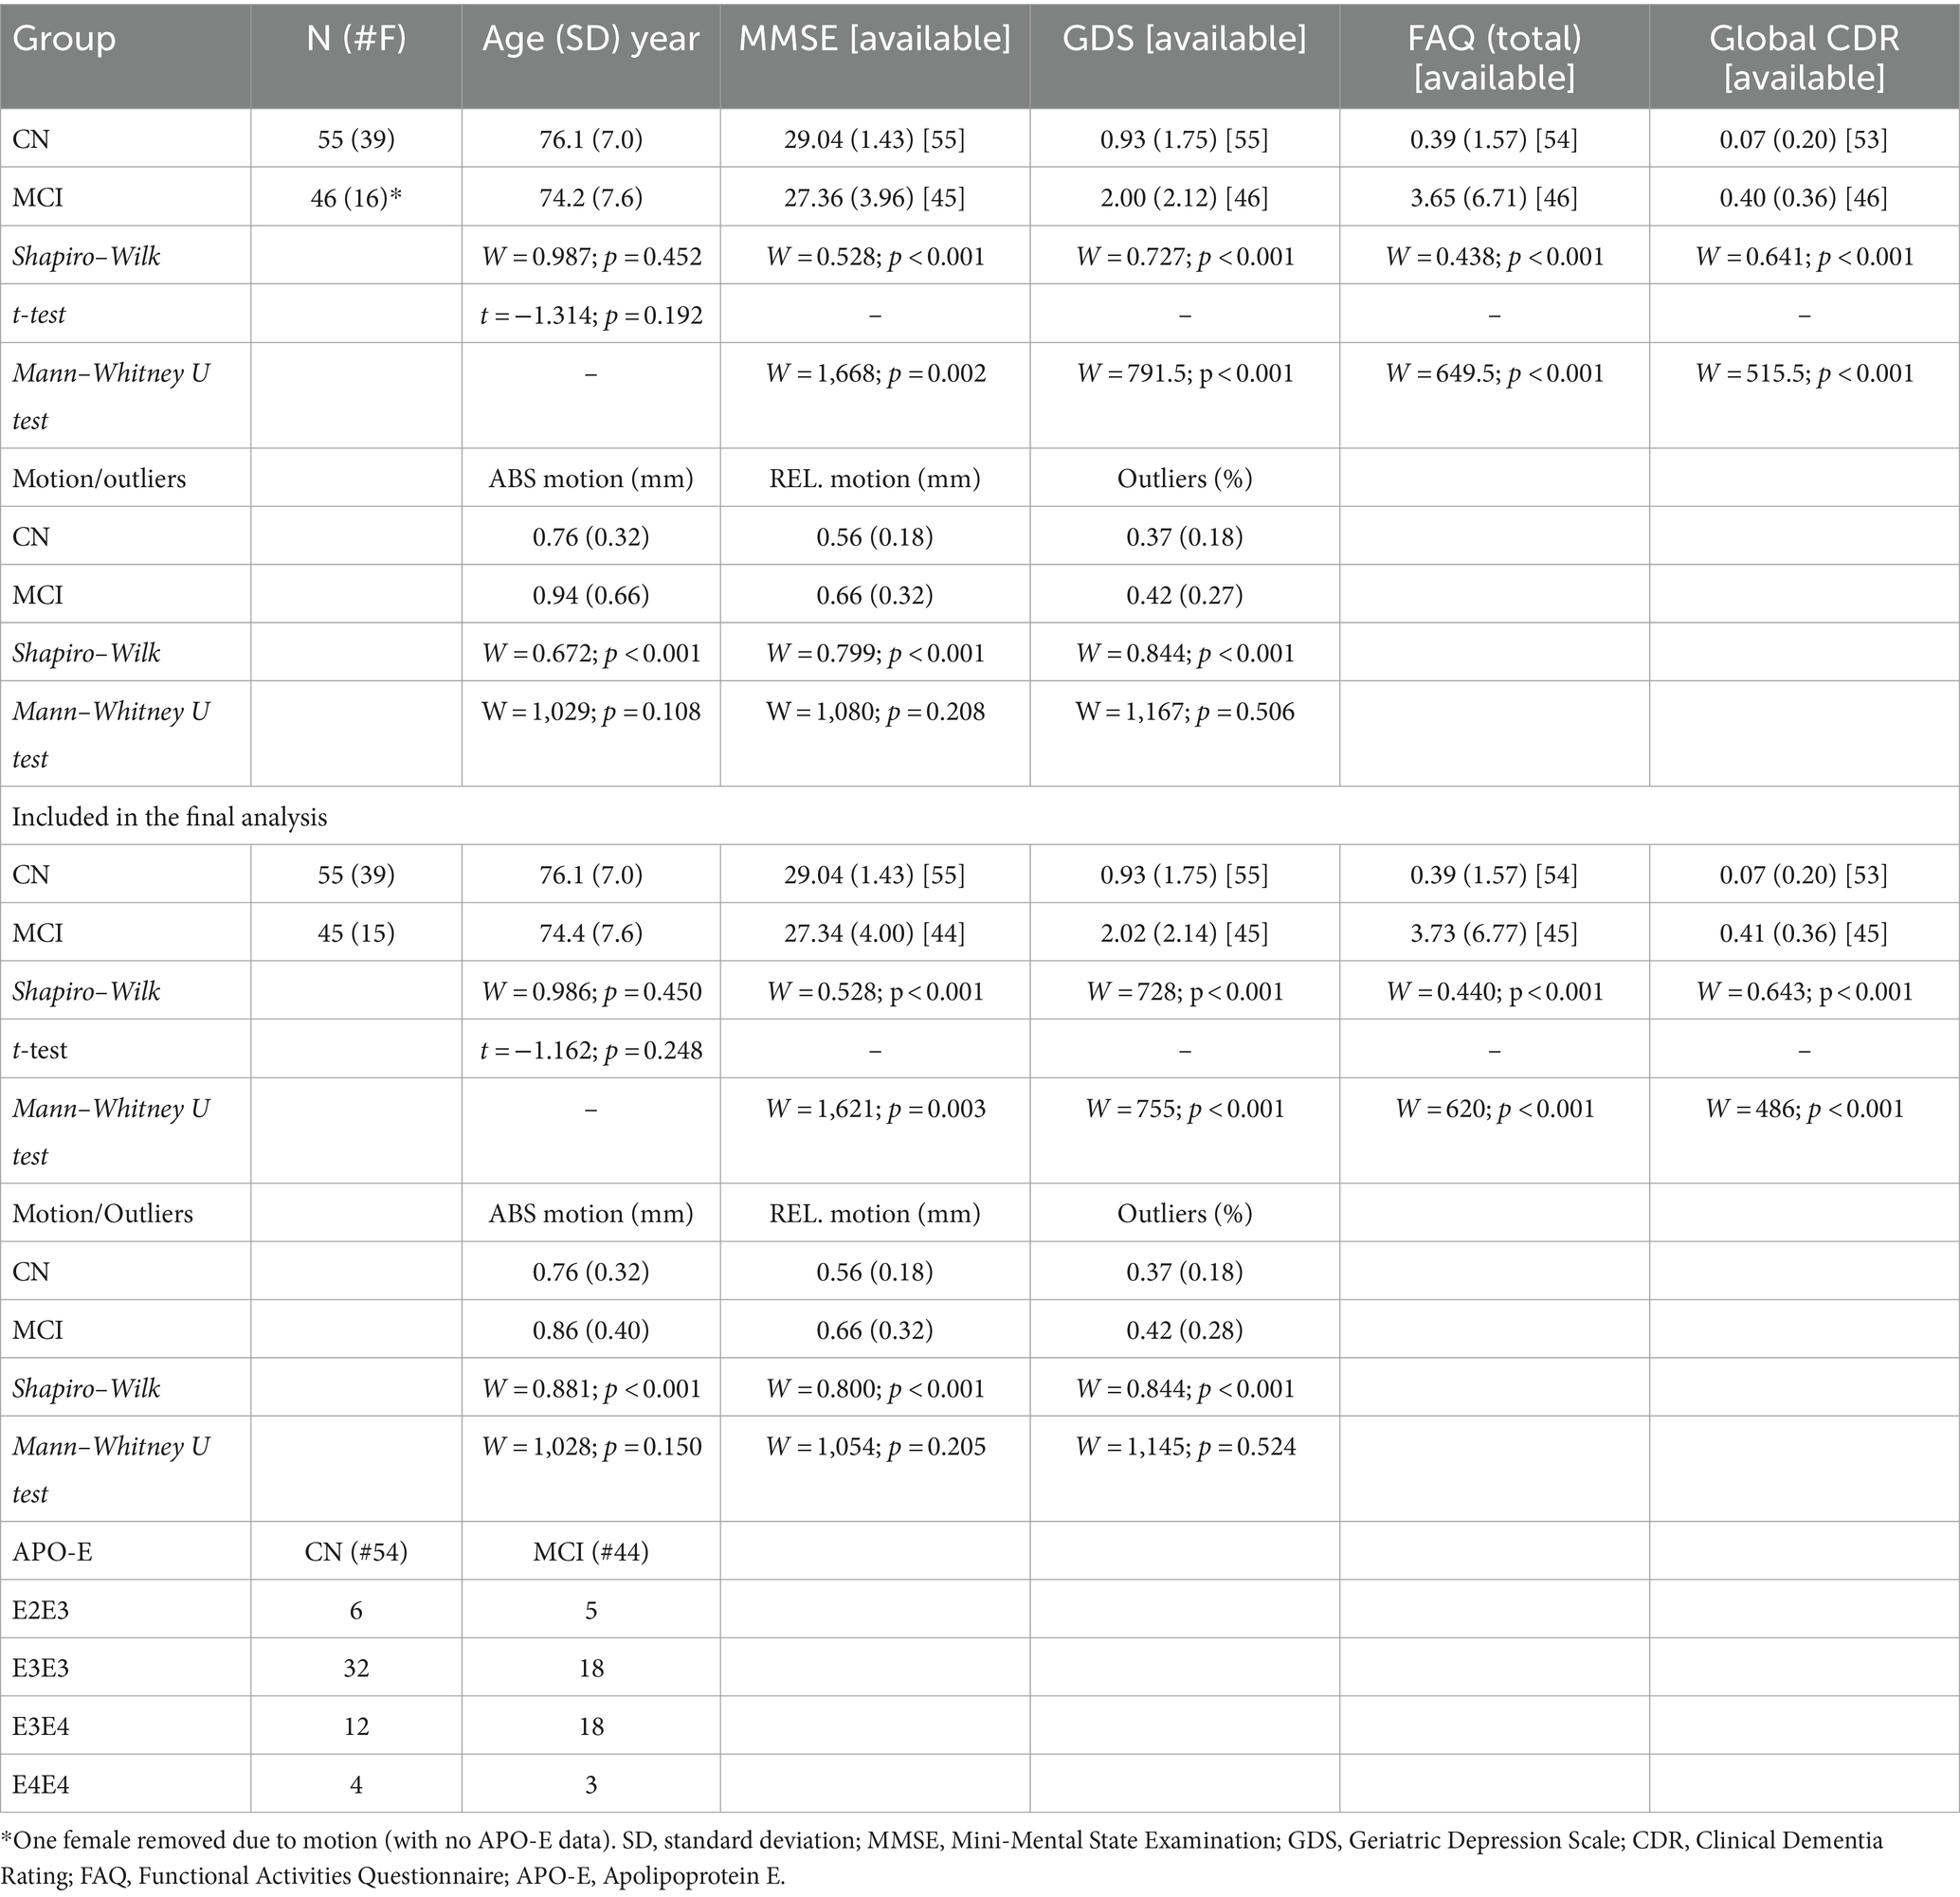
Table 1. Complete subject characteristics.
2.2 MRI acquisition
The dMRI data were downloaded from the ADNI database and acquired on a 3 Tesla Siemens Medical Systems Prisma scanner. All data were obtained from the ADNI-3 cohort, which is currently the only dataset within ADNI that includes multi-shell dMRI acquisitions. Each participant was scanned using an MPRAGE sequence (1.2 mm slices thick; 1.0 × 1.0 mm2 in-plane resolution, 256 × 256 matrix, TR: 8.82 s, TE: 3.162 ms, TI: 3.162 ms, flip angle: 9°) and a T2-FLAIR sequence (5 mm slices thick; 0.86 × 0.86 mm2 in-plane resolution, 256 × 237 matrix, TR: 9.0 s, TE: 90.0 ms, flip angle: 90°).
The dMRI protocol employed a multi-shell acquisition and utilized spin-echo diffusion-weighted echo-planar imaging with a TR of 3,400 ms, an echo time (TE) of 71 ms, multi-band = 3, and a voxel size of 2.0 × 2.0 × 2.0 mm3. The acquisition included a matrix size of 116 × 116, 81 slices, 127 gradient directions with b-values of 500, 1,000 and 2000 s/mm2, and 11 b = 0 (b0) images. Additional acquisition information can be found on the ADNI webpage (see footnote 1).
2.3 Data pre-processing - dMRI
DICOM data were downloaded from the ADNI database and converted into NIFTI format using the dcm2niix tool (available at: https://github.com/rordenlab/dcm2niix). NIFTI data were processed through a series of applications: Mrtrix3 (Tournier et al., 2019),3 FMRIB Software Library (FSL) version 6.0 (Jenkinson et al., 2012), and Advanced Normalization Tools (ANTs).4 The preprocessing steps for dMRI data included noise reduction using dwidenoise (Veraart et al., 2016) (MRtrix3), along with procedures for aligning the images and correcting for eddy currents using eddy (Andersson and Sotiropoulos, 2016) (FSL). The eddy QC tools were employed to evaluate the quality of the dMRI data. Instances of signal loss resulting from subject movement coinciding with diffusion encoding were identified, and the affected slices were replaced with predictions generated through a Gaussian process. The quality control criteria for this study were established as an average absolute volume-to-volume head motion value of less than 3 mm or fewer than 5% of total outliers. The brain extraction from the b0 images was performed by dwi2mask (Mrtrix3). Following this step, all preprocessed dMRI images were uniformly rescaled to a voxel size of 1.25 mm using mrgrid (Mrtrix3). All b0 images were used to create a group-wise template by ANTs. This template was used as a ‘standard’ space for all statistical analyses. For the visualization of significant clusters and the calculation of their volumes within each white matter area, the b0 group-wise template was normalized to the MNI b0 standard image (1x1x1 mm voxel size) using the ANTs Symmetric Image Normalization (SyN) algorithm.
2.4 Free water algorithm
The free water elimination model aims to mitigate the negative impact of CSF partial volume effects on diffusion measurements (Hoy et al., 2014). This model can offer a more nuanced understanding of brain tissue by discerning between freely moving water molecules and those that are hindered or restricted. In this study, the computation of FWI-related metrics, including fractional anisotropy (fw-FA) and the fw index (f), was conducted using the DIPY5 algorithm (fwdti.FreeWaterTensorModel class object and fwdtimodel.fit function) for multi-shell dMRI through an in-house Python script.
2.5 Diffusion kurtosis imaging (DKI)
DKI provides additional information about the non-Gaussian diffusion of water molecules in biological tissues (Jensen et al., 2005; Jensen and Helpern, 2010). Using kurtosis metrics, DKI quantifies the degree of deviation from a Gaussian distribution, an assumption of standard DTI. This model can offer insights into the microstructural complexity of tissues beyond what DTI can provide through the kurtosis coefficient (K), which reflects the deviation from Gaussian diffusion. This study utilized two DKI metrics: the mean kurtosis tensor (MKT) and the kurtosis fractional anisotropy (KFA), which depend solely on the kurtosis tensor. Additionally, standard DKI metrics, including mean kurtosis (MK), radial kurtosis (RK), and axial kurtosis (AK), were analyzed. All DKI metrics were computed using DIPY’s dki.DiffusionKurtosisModel class object and the dkimodel.fit function via an in-house Python script.
2.6 Mean signal diffusion kurtosis imaging (MSDKI)
An essential limitation of DKI is that its measurements are susceptible to noise and image artifacts. For instance, due to low radial diffusivity, standard kurtosis estimates in regions with well-aligned voxels may be corrupted by implausibly low or negative values. To overcome this issue, the MSDKI model can be used (Henriques et al., 2021). This model simplifies the DKI approach by averaging the signal intensities over all diffusion directions for each b-value before calculating the kurtosis. The averaging process reduces the influence of directional variability in water diffusion, yielding a scalar metric that reflects the average diffusion kurtosis across all directions. The mean signal approach aims to simplify the complexity and computational demand of DKI.
MSDKI has several advantages, including reducing data processing and analysis complexity. Averaging signals across directions can mitigate the impact of noise, potentially improving measurement reliability, especially in high b-value ranges. However, by averaging signals, MSDKI sacrifices information on directional diffusion anisotropy, which is essential for understanding the orientation of the tissues inside the white matter.
In this study, the mean signal diffusion (MSD) and the mean signal kurtosis (MSK) metrics were computed using DIPY’s MeanDiffusionKurtosisModel class and the msdki_model.fit function via an in-house Python script. The MSD metric represents the average diffusion coefficient across all directions within a voxel. It provides insights into the microstructural environment of tissues, particularly in areas with complex architecture. A lower MSD value may indicate denser or more restricted tissue environments, while higher values suggest more free water movement, potentially reflecting damaged tissue. The MSK is a metric that quantitatively describes the degree of non-Gaussian diffusion of water molecules in brain tissue, averaged over all diffusion directions. MSK provides a scalar value reflecting the average excess kurtosis of water diffusion, indicating the complexity and heterogeneity of tissue microstructure without emphasizing diffusion directionality.
2.7 White matter hyperintensity (WMH)
WMH are areas of abnormal signal intensity within the white matter, typically visualized on T2-weighted or FLAIR MRI sequences. Automated segmentation of WMH volume was performed with the Lesion Segmentation Tool (LST version 3.0.0 as implemented in SPM12) within MATLAB v. 2023b using T2-weighted FLAIR and MPRAGE images.
In this study, FMRIB’s Automated Segmentation Tool (FAST) (Zhang et al., 2001) segmented the brain into three distinct tissue types: gray matter, white matter, and cerebrospinal fluid (CSF). The total volumes of gray matter, white matter, and CSF were summed to determine the intracranial volume. The volume of white matter hyperintensities (WMH) was then normalized by the intracranial volume. The normalized volumes of the WMH areas were included as covariates for all statistical analyses.
2.8 Statistical analyses
The demographic and clinical characteristics, including age, MMSE, GDS, Global CDR, FAQ, motion, and outliers, are presented as means and standard deviations for each group. Differences in age between groups were examined using a Student’s t-test, confirmed by the Shapiro–Wilk (SW) test for normality (W = 0.987, pSW = 0.452). For cognitive assessments (MMSE, GDS, CDR, and FAQ), differences were analyzed using the Mann–Whitney U test due to non-normality (pSW ≤ 0.001 for all assessments). Group differences in motion and outliers were also analyzed using the Mann–Whitney U test due to non-normality (pSW < 0.001 for all motion/outlier measurements).
All diffusion metrics computed for this study were coregistered to the group-wise template space by an ANTs SyN coregistration algorithm. The voxel-based analysis (between groups and correlations with MMSE) was restricted to voxels within the combined masks derived from the ICBM-DTI-81 white-matter labels atlas and the JHU white-matter tractography atlas. Clusters showing statistically significant differences across groups were annotated according to the JHU DTI-based white-matter atlases (Wakana et al., 2007; Hua et al., 2008).
A Student’s t-test with a linear model function was employed to assess voxel-based differences across groups in all diffusion-related metrics. To mitigate potential confounding effects, the covariates of age, sex, WMH normalized volume, and average absolute motion were incorporated into the model. Voxel-based correlations between all diffusion metrics and MMSE scores were computed using a linear model with age, sex, WMH normalized volume, and average absolute motion as covariates. Analyses were performed with an in-house R (version 3.6.3) script and RStudio (version 1.3.1093).
The Threshold-Free Cluster Enhancement (TFCE) method was utilized to ensure robust clustering while avoiding arbitrary thresholding and addressing multiple comparisons (Smith and Nichols, 2009). Additionally, a Family-Wise Error (FWE) correction at the 0.05 level using the Benjamini-Hochberg procedure (FDR < 0.05) was applied. Effect sizes were calculated for all analyses using Hedges’ g, where |g| ≥ 0.61 indicated a large effect size for voxel-based differences between groups (α = 0.05, power = 0.85), and Spearman’s correlation coefficients with |ρ| > 0.44 as large effects (α = 0.05, power = 0.85) for correlations with MMSE.
3 Results
One female MCI participant was removed from the final analysis due to excessive motion (absolute motion = 4.50 mm).
Among the final participants, no statistical differences between groups were found for age (t = −1.162; p = 0.248). However, statistical differences were found in all cognitive tests (MMSE: W = 1,621; p = 0.003; GDS: W = 755; p < 0.001; FAQ: W = 620; p < 0.001; Global CDR: W = 486; p < 0.001).
No statistical differences were found across the groups in absolute motion (W = 1,028; p = 0.150), relative motion (W = 1,054; p = 0.205), and total outliers (W = 1,145; p = 0.524). Additionally, there were no significant differences in WMH normalized volume between CN and MCI groups (t = 0.454; p = 0.651). Statistical results for all cognitive scores, motion, outliers, and APOE status are reported in Table 1.
3.1 FWI results
Figure 1A illustrates the statistical voxel-based differences between groups for the f index. The MCI group exhibited elevated free water levels compared to the CN group. Extensive clusters with |g| > 0.61 were identified in various white matter regions, including the corpus callosum, right cerebral peduncle, right sagittal stratum, and right uncinate fasciculus. Table 2A provides details on the volume, mean t-values, and maximum effect sizes for the clusters with |g| > 0.61. Complete results for the f index, including large, medium, and small effect sizes, can be found in Supplementary Table S1.
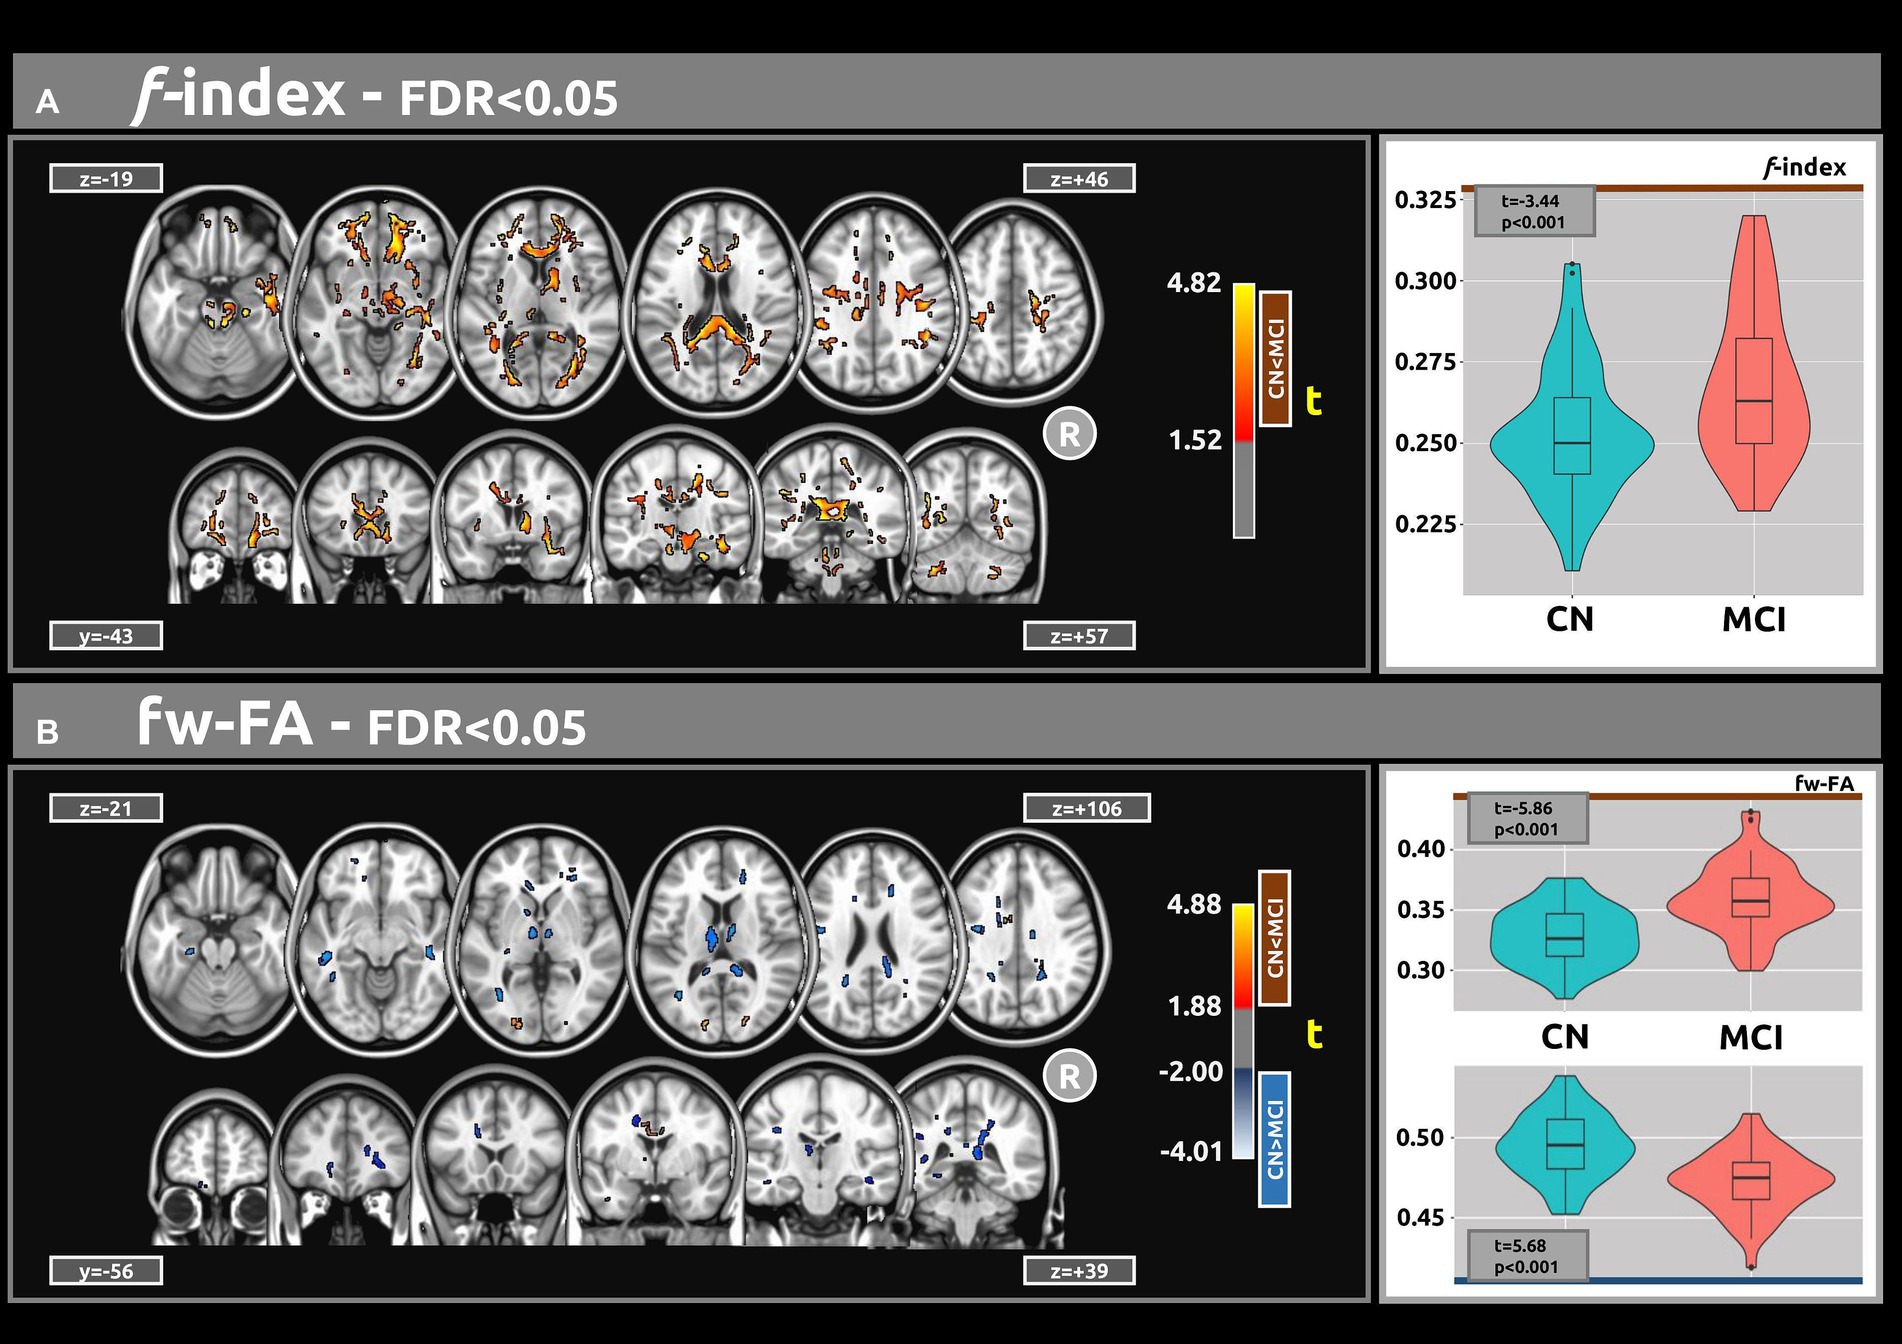
Figure 1. The voxel-based analyses of FWI metrics (t-value at FDR < 0.05) are shown in both axial and coronal views. (A) Compared with CN individuals, higher values of the f index were observed in the MCI group. (B) Group differences were also found for the fw-FA metric. Plots illustrate the mean values within the significant clusters.
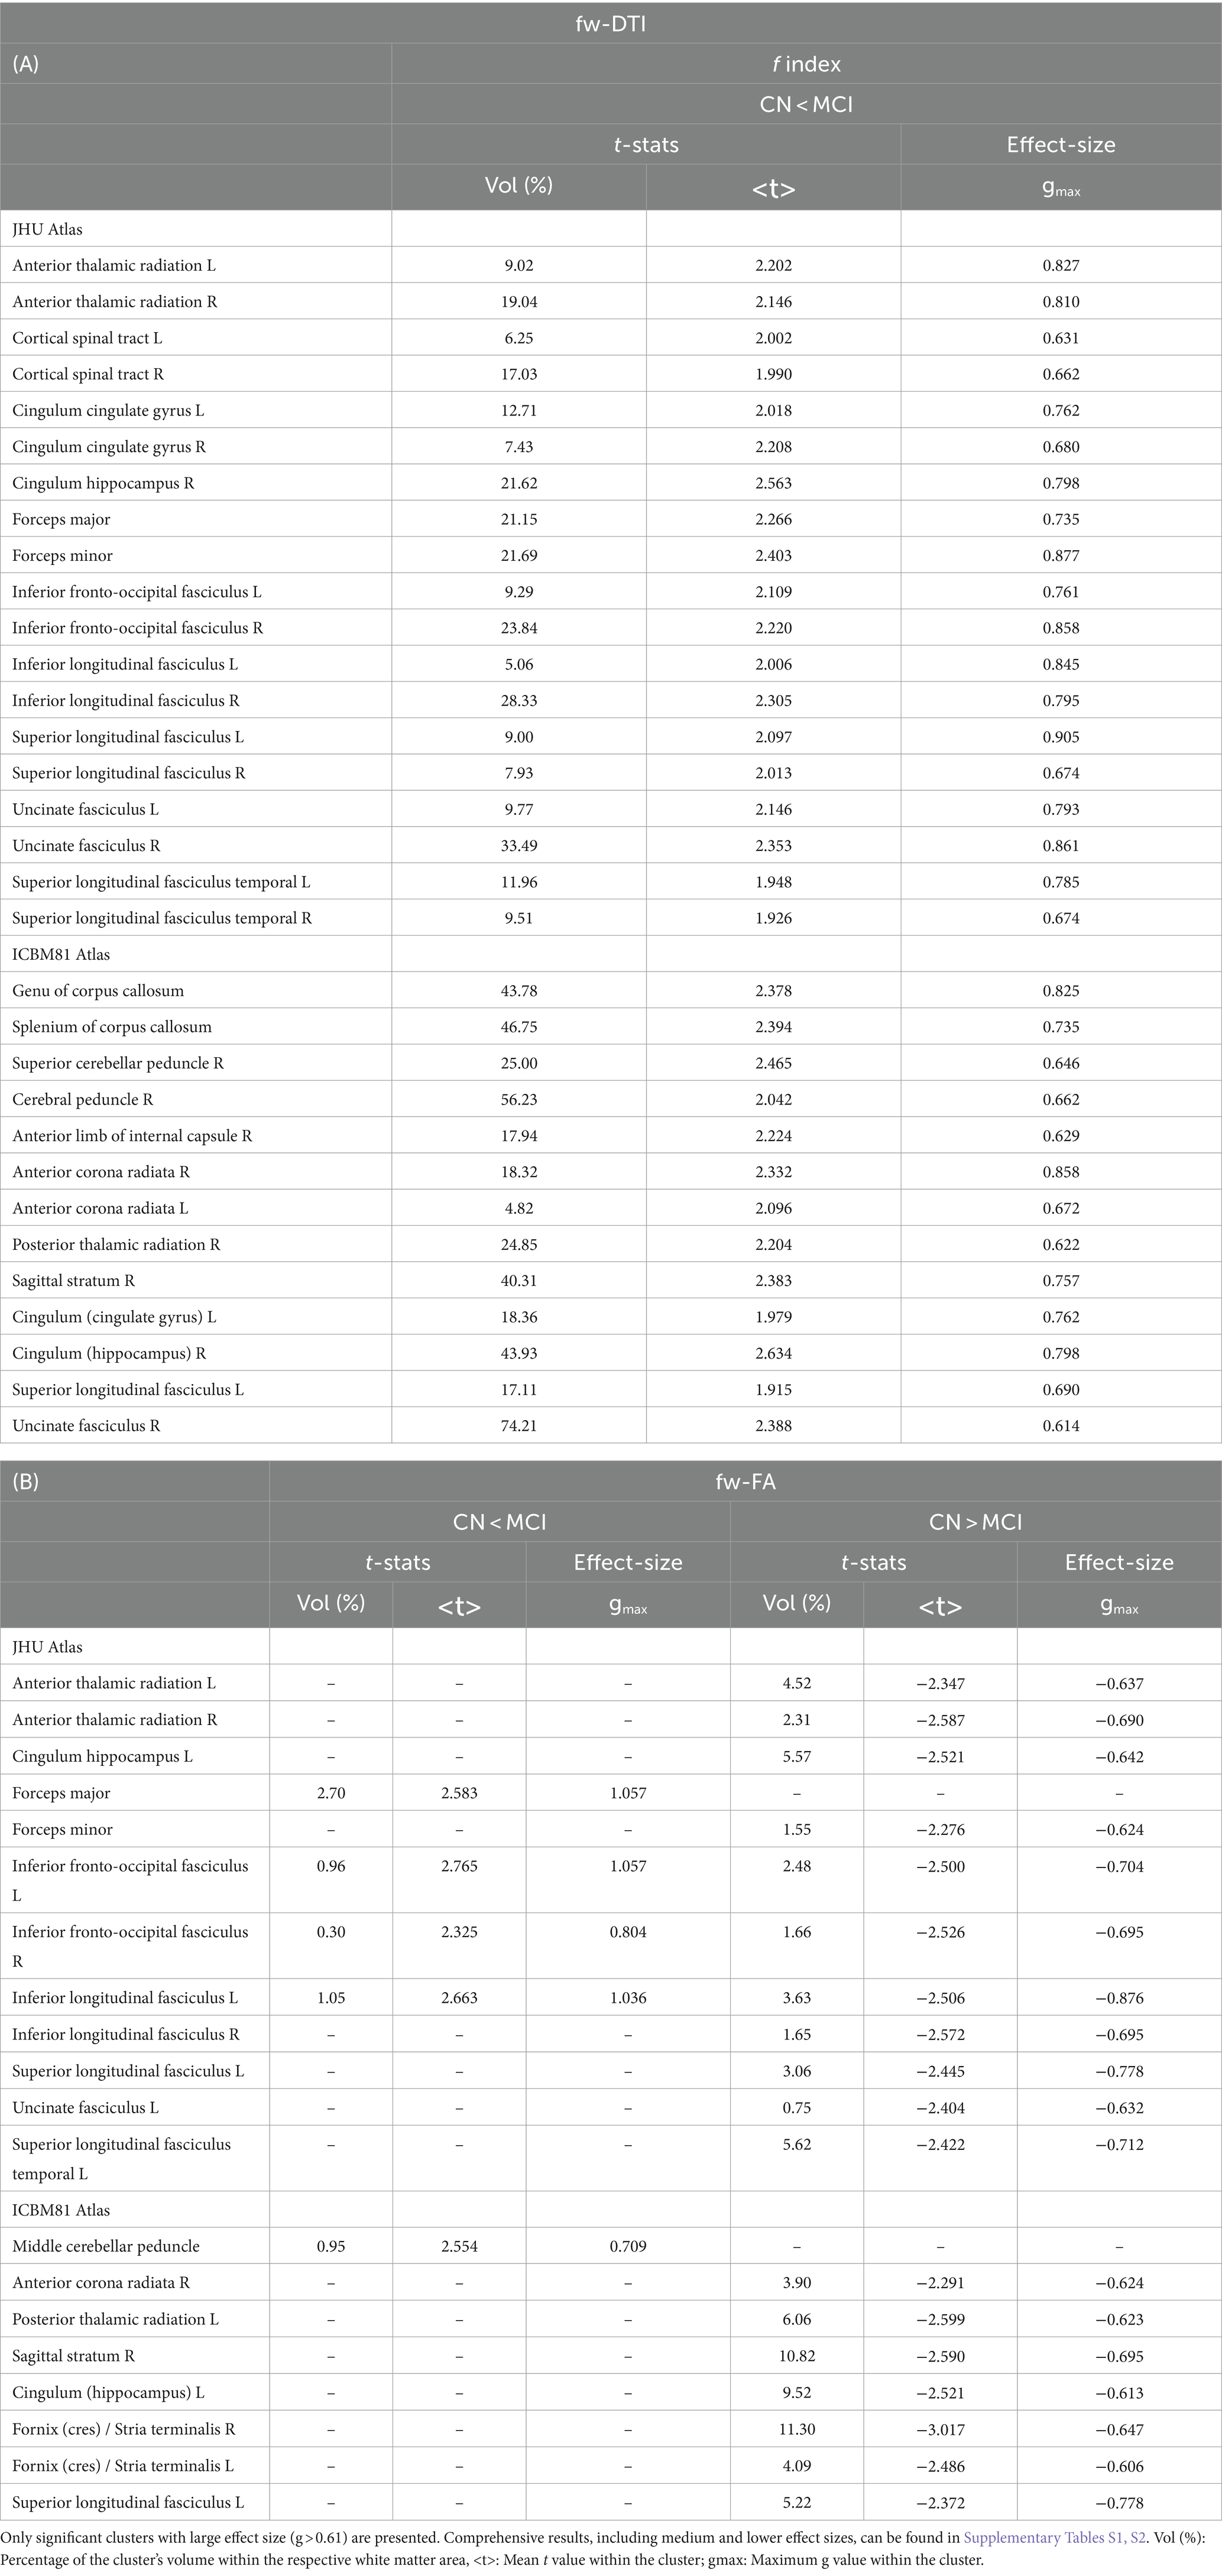
Table 2. Results for fw-DTI ((A) f index and (B) fw-FA).
Figure 1B shows the statistical voxel-based differences between groups for the fw-FA metric. Compared to the CN group, the MCI group exhibited extensive clusters characterized by lower fw-FA values, with a coefficient |g| > 0.61. These clusters were situated within the right sagittal stratum, left cingulum (hippocampus), and right fornix (crus)/stria terminalis. Table 2B presents the findings for clusters with |g| > 0.61. Complete results for fw-FA, including large, medium, and small effect sizes, are shown in Supplementary Table S2.
3.2 DKI results
Figure 2 displays the voxel-based differences between groups for DKI-related metrics. The MCI group generally exhibited reduced kurtosis values compared to the CN group. Significant differences were observed across various white matter regions, characterized by large clusters and |g| > 0.61. The white matter regions most associated with cognitive decline include the superior longitudinal fasciculus, superior fronto-occipital fasciculus, corpus callosum, and sagittal stratum. Smaller clusters indicating higher kurtosis values in MCI compared to CN (excluding KFA) were also identified.
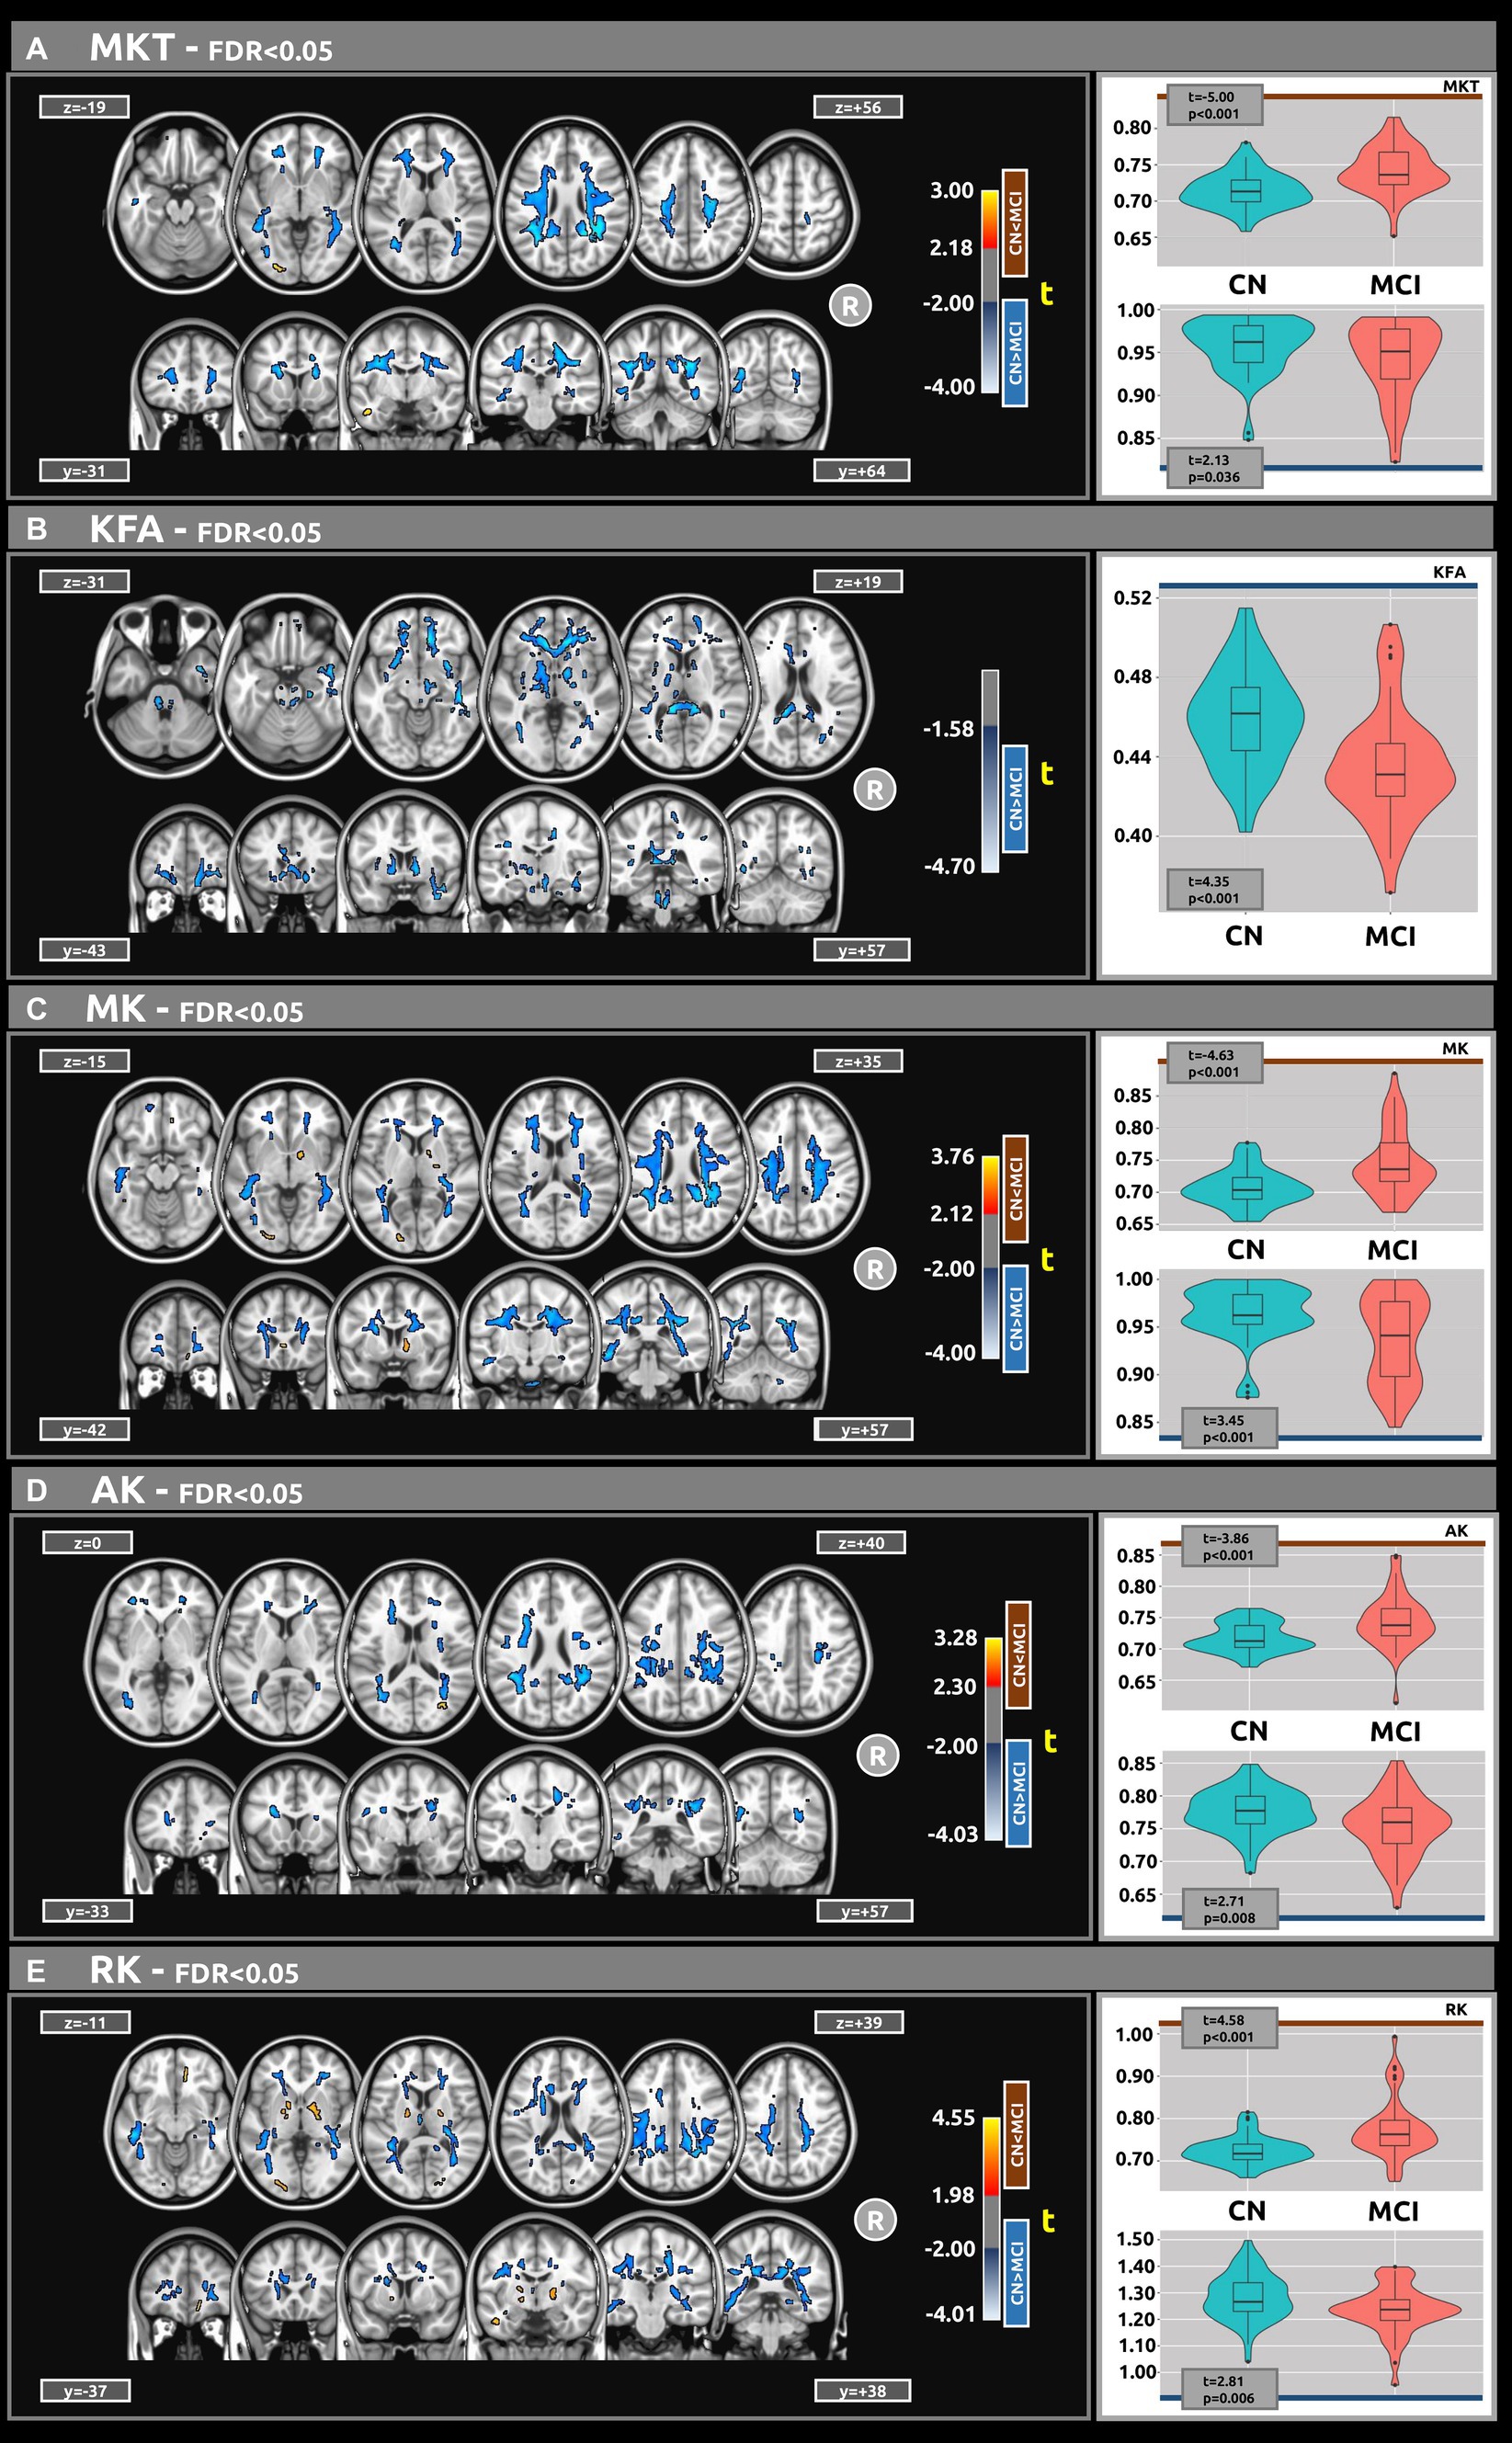
Figure 2. Voxel-based analyses of DKI metrics: (A) MKT, (B) KFA, (C) MK, (D) AK, and (E) Mk, respectively. t-value (at FDR < 0.05) are displayed in axial and coronal views. Group differences were identified for all metrics, typically showing large clusters, wherein the MCI group exhibited lower DKI metrics values compared to the CN group. Plots illustrate the mean diffusion values within the significant clusters.
Table 3 presents the outcomes for clusters with |g| > 0.61 for MKT and KFA metrics. Table 4 outlines the results for clusters with |g| > 0.61 for MK, AK, and RK metrics. Complete DKI results for large, medium, and small effect sizes are shown in Supplementary Tables S3–S7 for MKT, KFA, MK, AK, and RK, respectively.
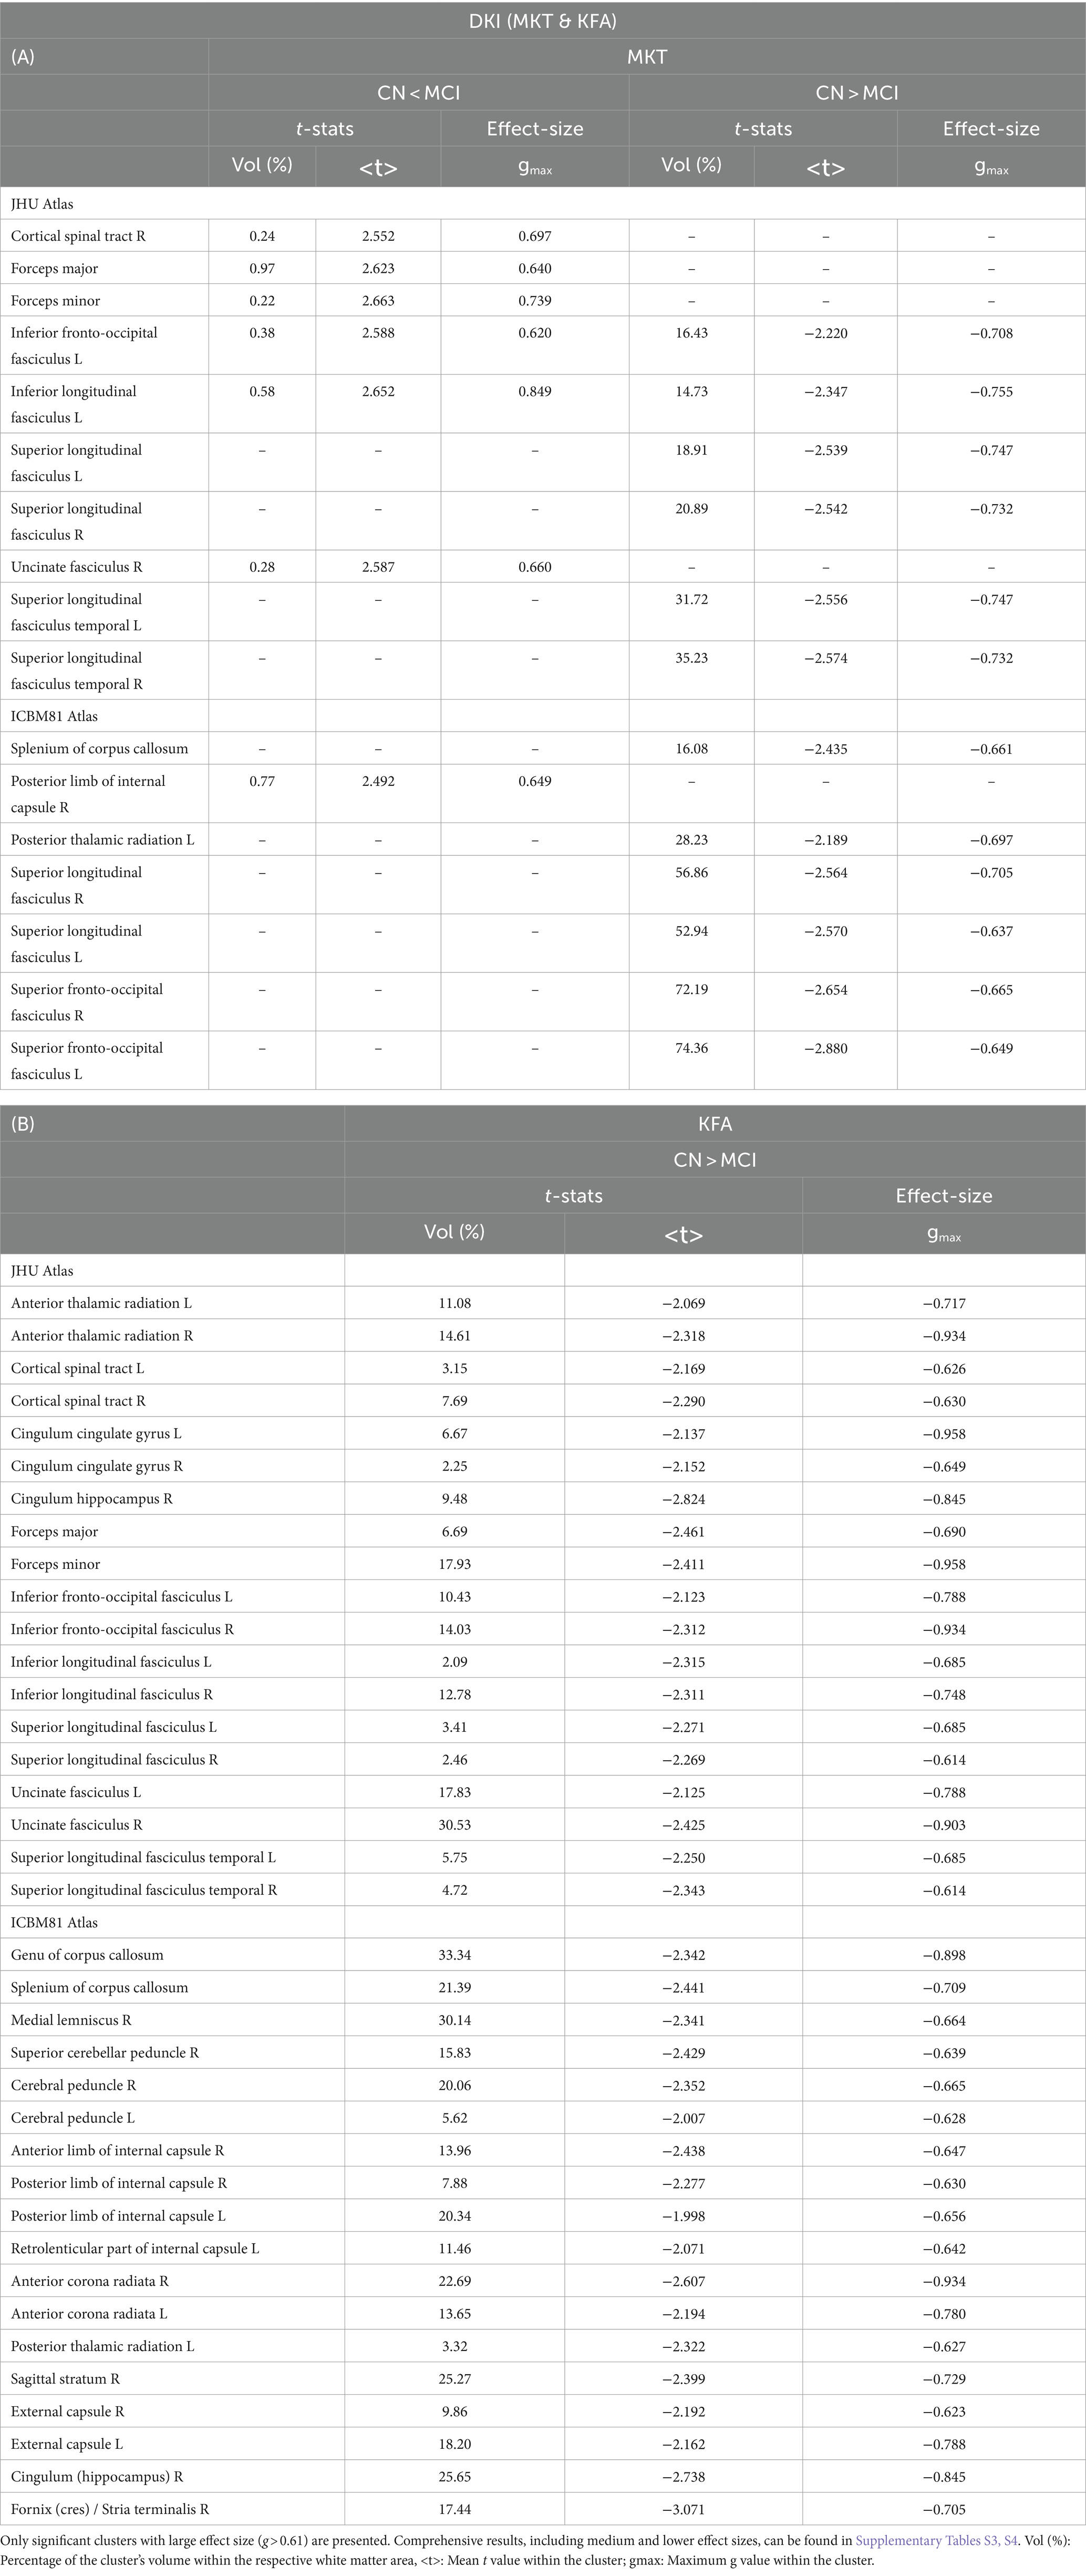
Table 3. Results for DKI ((A) MKT and (B) KFA).
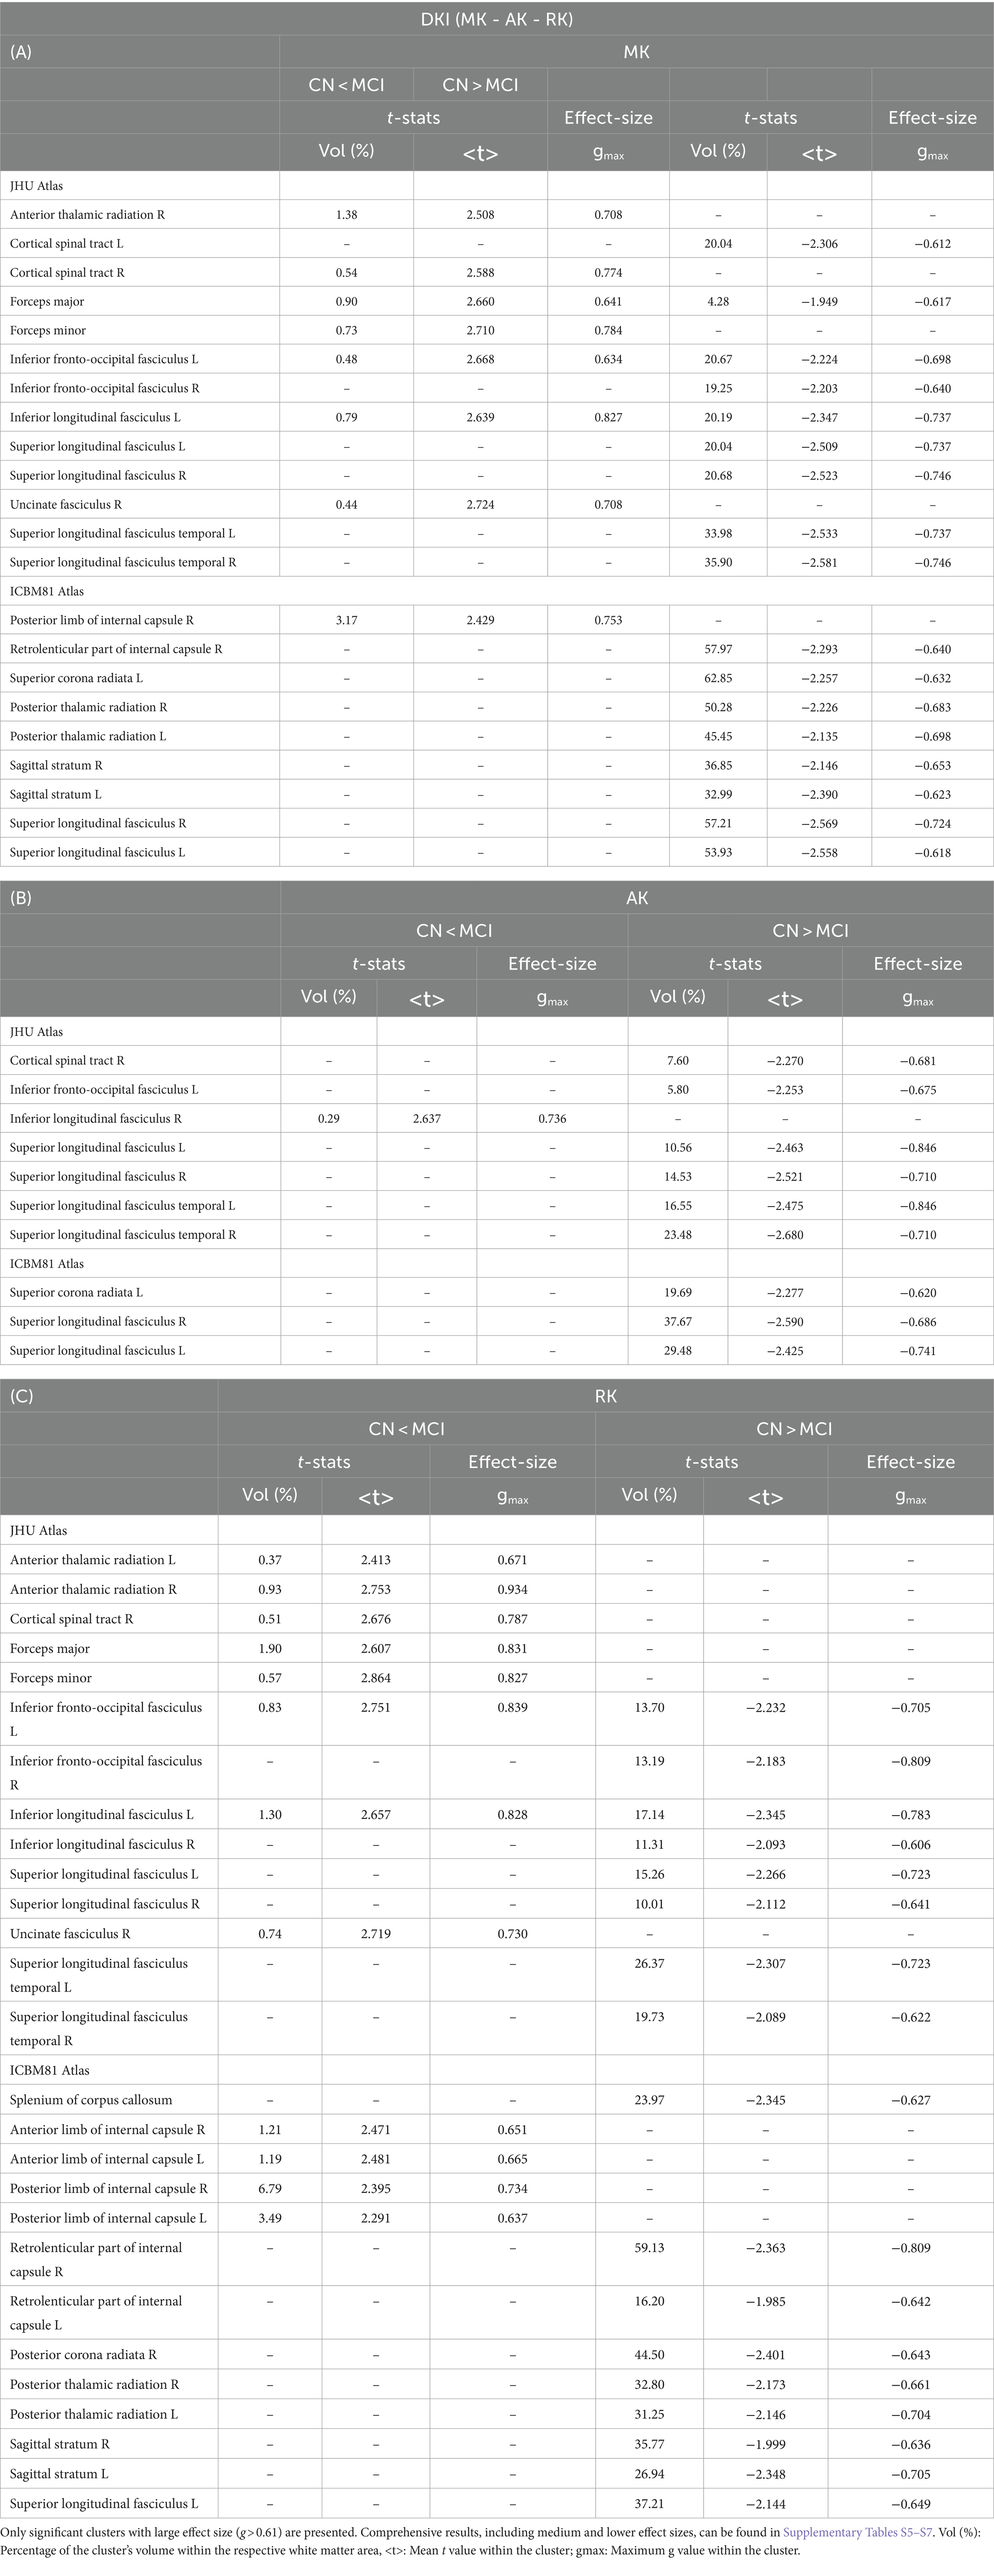
Table 4. Results for DKI ((A) MK, (B) AK, and (C) RK).
3.3 MSDKI results
Figure 3A shows the voxel-based statistical differences between groups regarding the MSD metric. The MCI group demonstrated higher water diffusion levels than the CN group. Extensive clusters with |g| > 0.61 were observed across various white matter regions. Notably, the MSD findings are aligned with those of the f index. Table 5A provides detailed information on the results for the significant clusters with |g| > 0.61. The complete results for the MSD, which include large, medium, and small effect sizes, are provided in Supplementary Table S8.
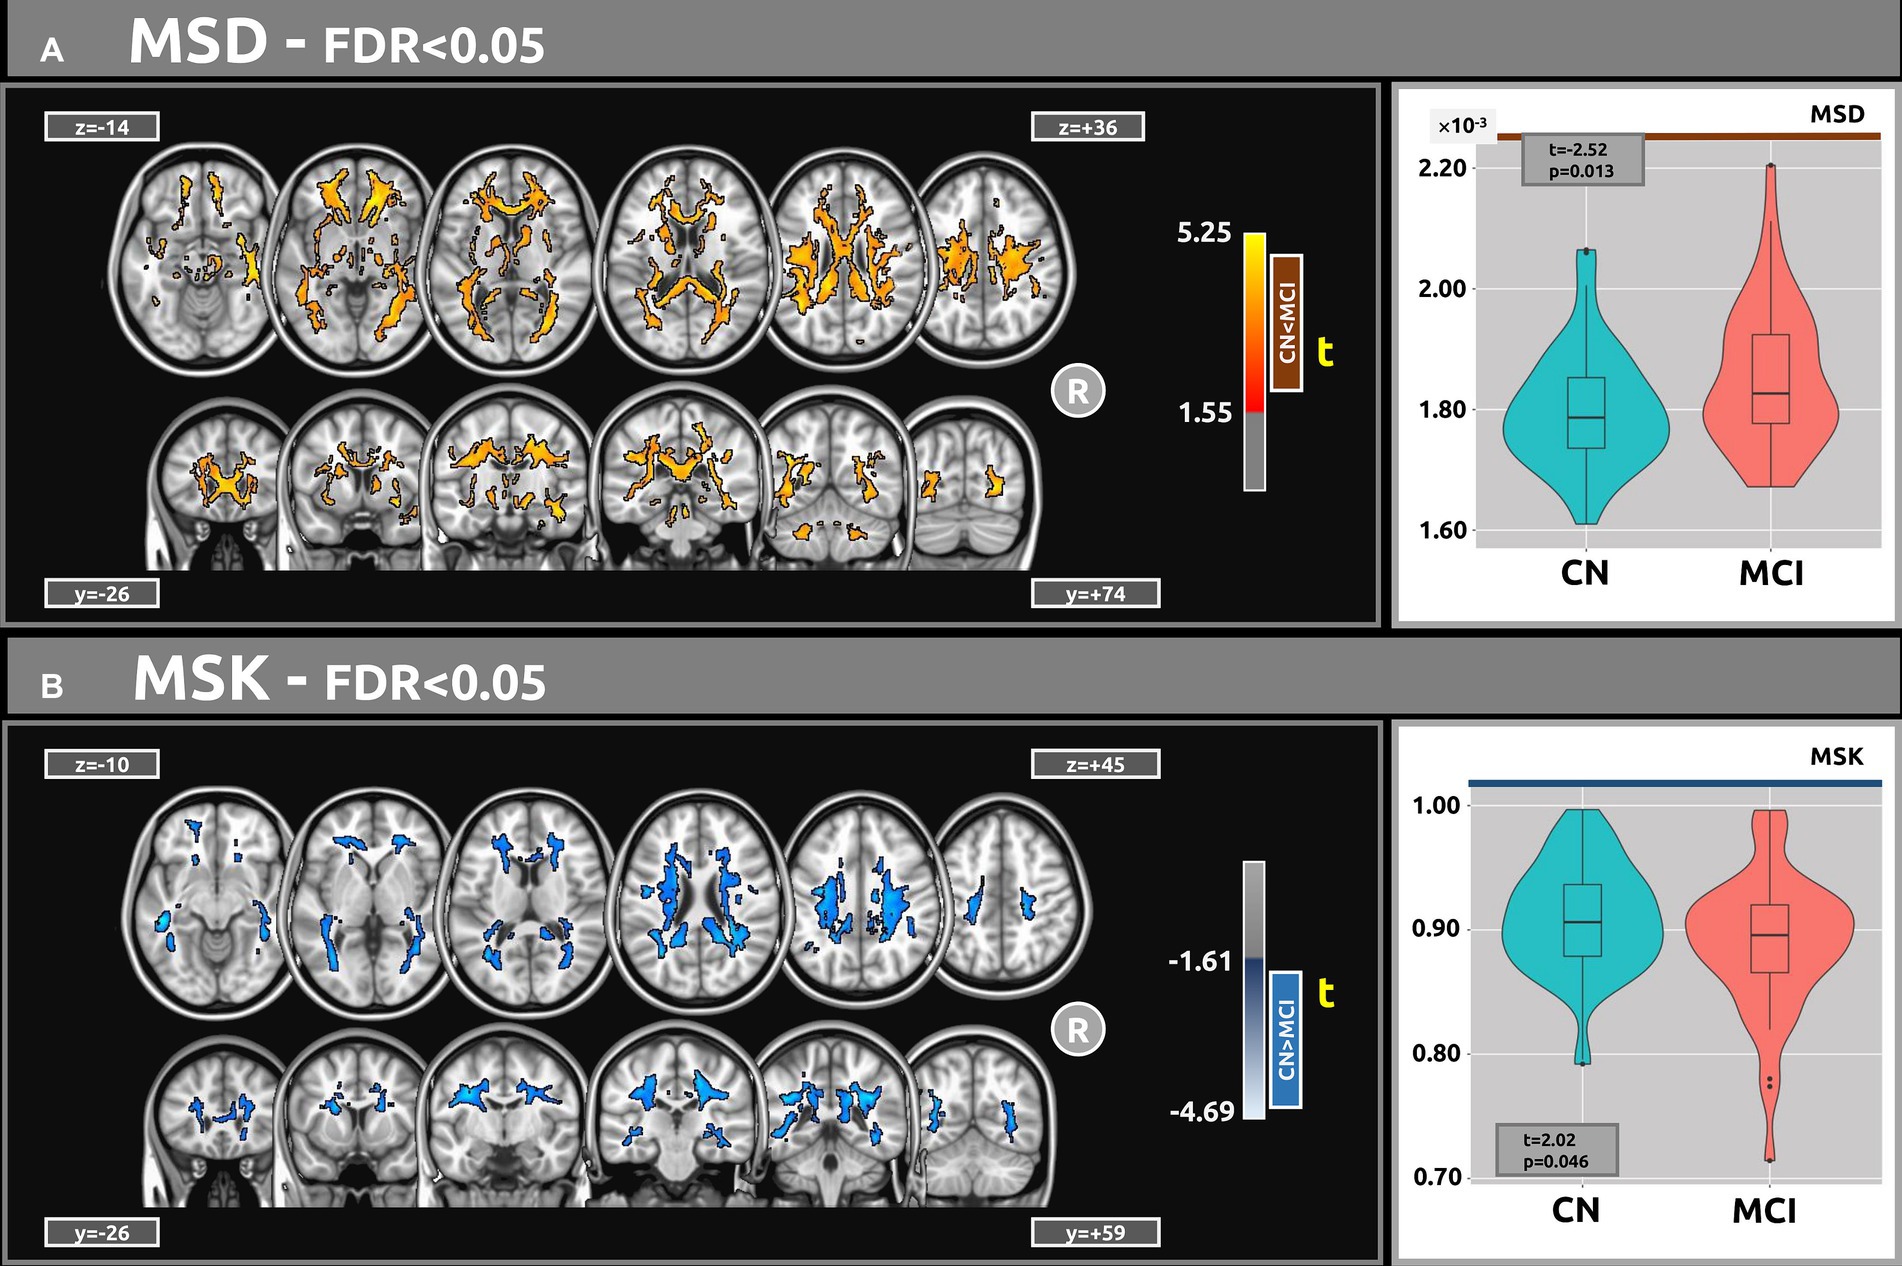
Figure 3. Voxel-based analyses of MSDKI metrics (t-value at FDR < 0.05) are presented in axial and coronal views. (A) In comparison with the CN group, MCI participants exhibited higher MSD values. (B) Contrasted with CN, the MCI group demonstrated lower MSK values. Plots show the mean diffusion values within the significant clusters.
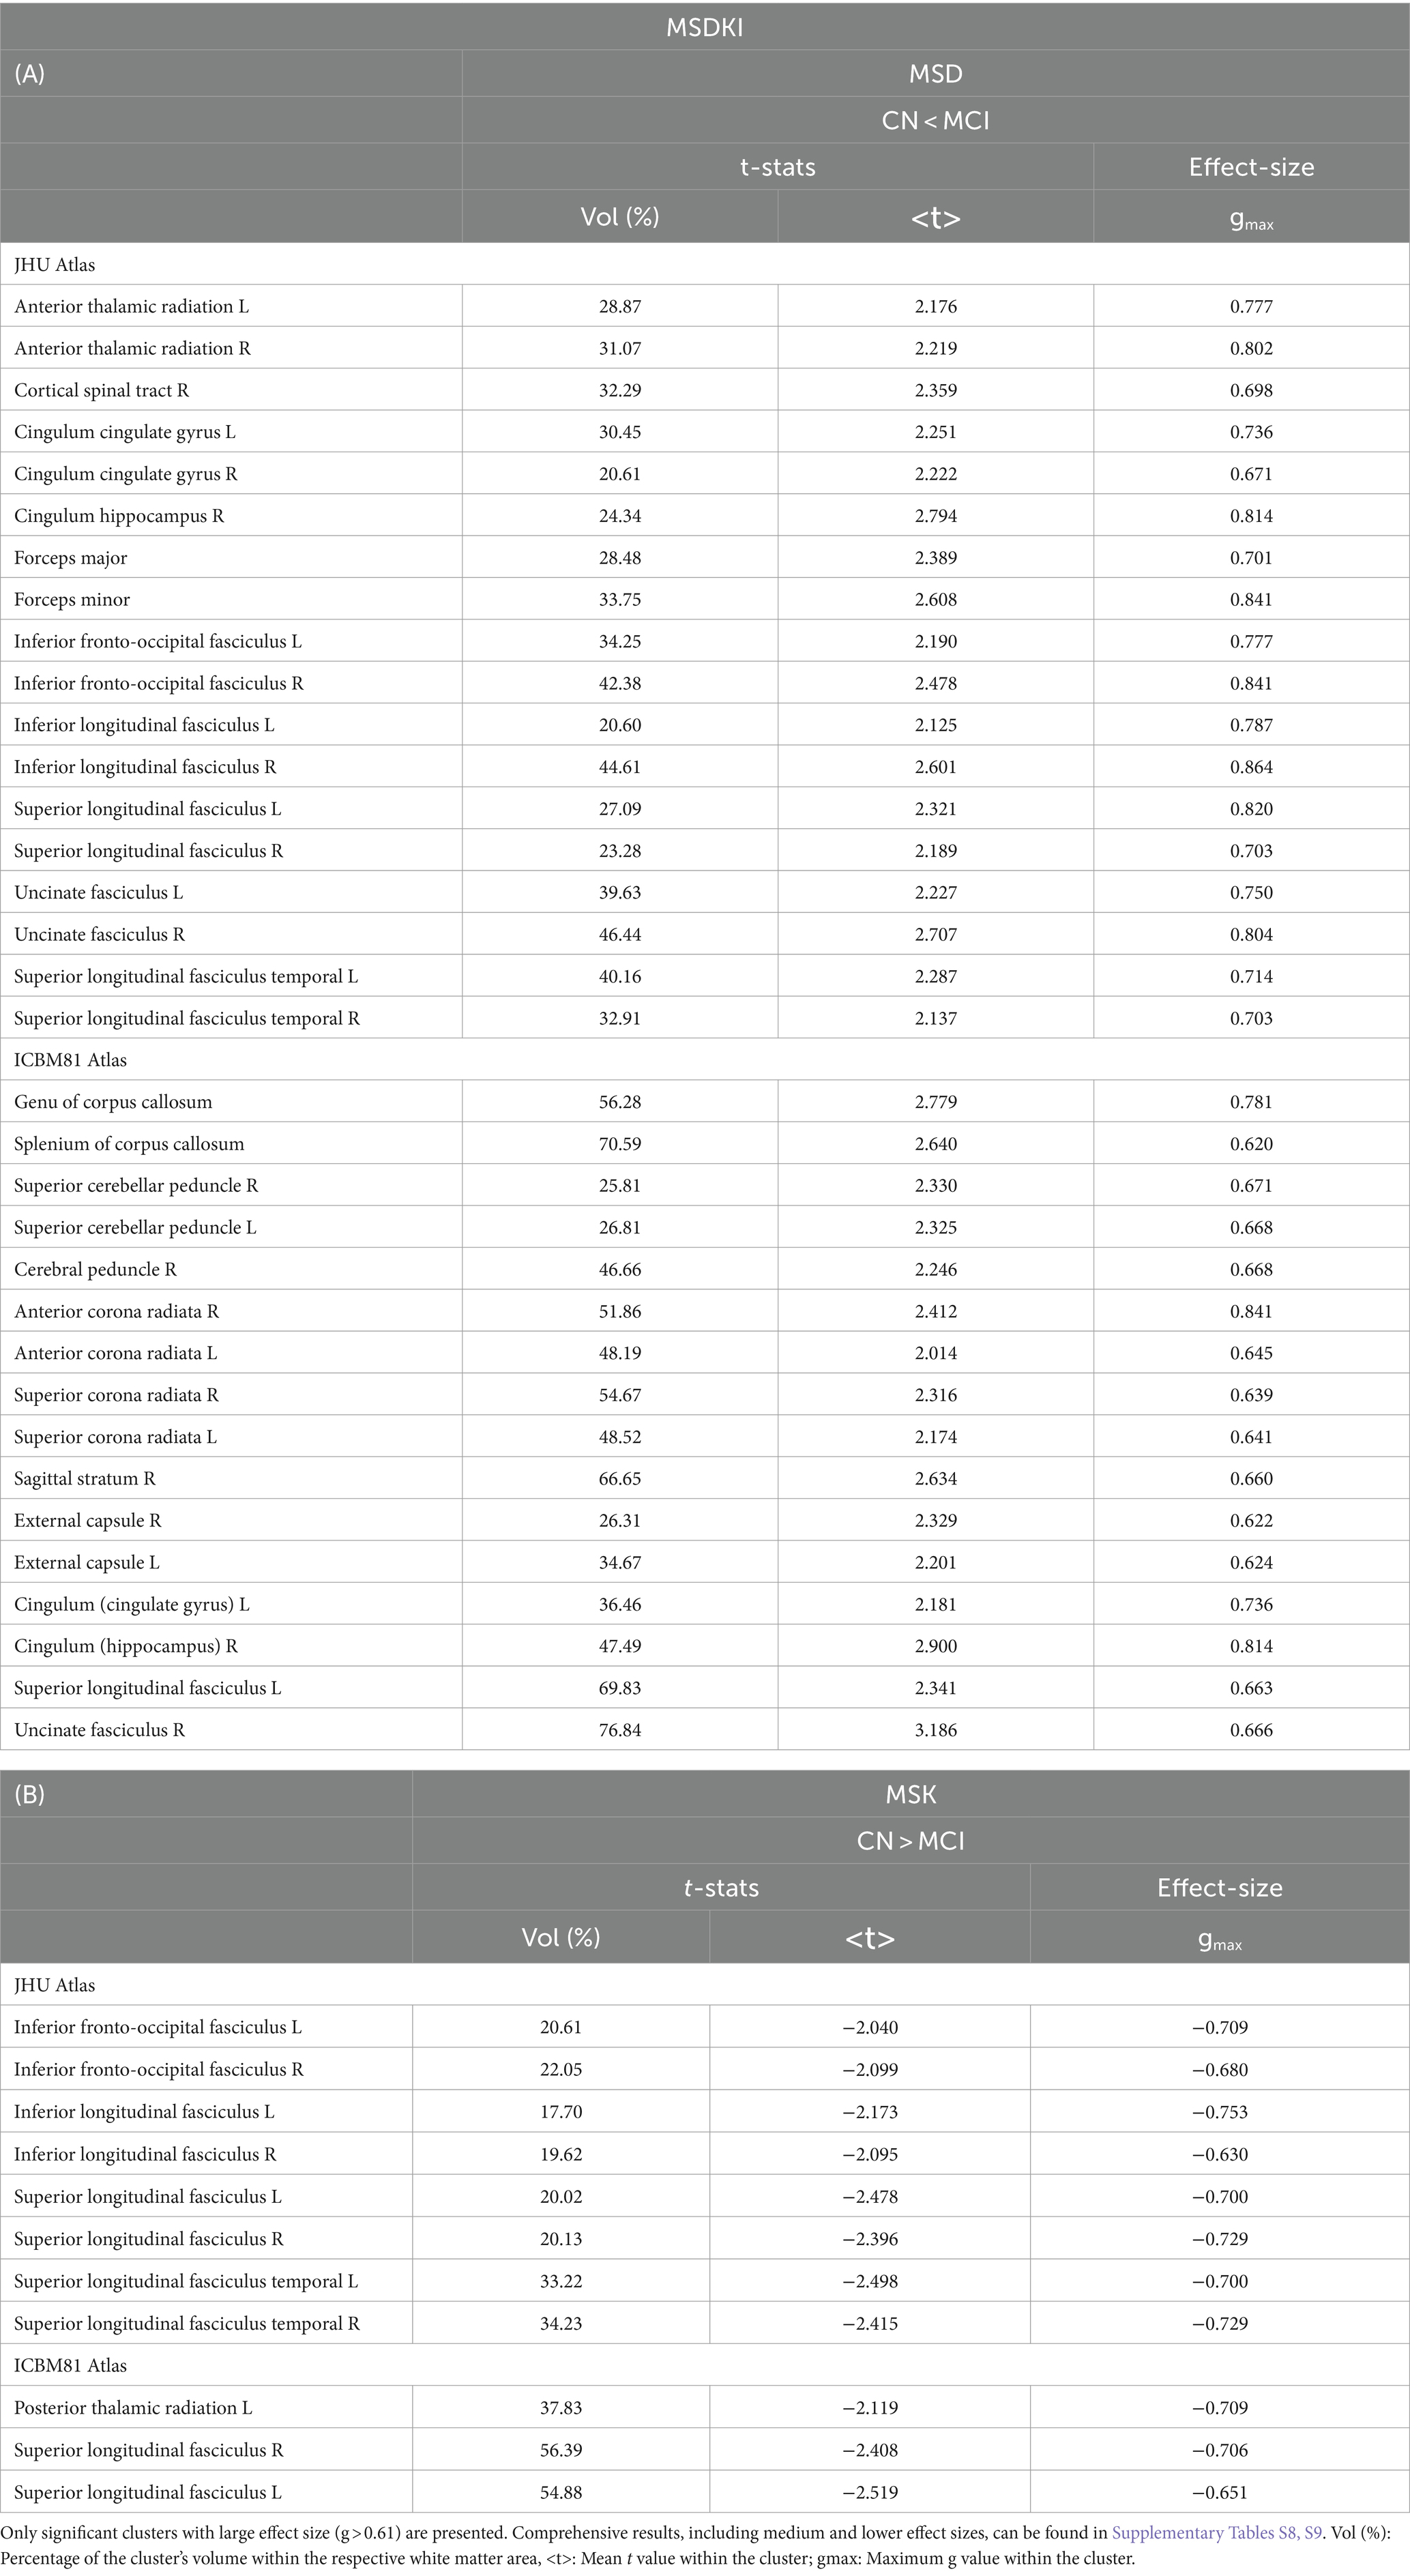
Table 5. Results for MSDKI ((A) MSD and (B) MSK).
Figure 3B shows the voxel-based differences between groups for the MSK metric. The MCI participants demonstrated lower MSK values than the CN group. Clusters with |g| > 0.61 were observed across various white matter regions. Table 5B provides detailed information on the results for the significant clusters with |g| > 0.61. The complete results for the MSK, which include large, medium, and small effect sizes, are provided in Supplementary Table S9.
3.4 Voxel-based correlations with MMSE
Figure 4 displays voxel-based correlations between the diffusion metrics and MMSE scores. Notably, significant negative correlations were observed between MMSE scores and both the f index and MSD metric (with |ρ| > 0.44) across several comparable regions of white matter. Regarding other diffusion metrics, both positive and negative correlations with MMSE scores were identified. Detailed information on these correlations is provided in Tables 6–9.
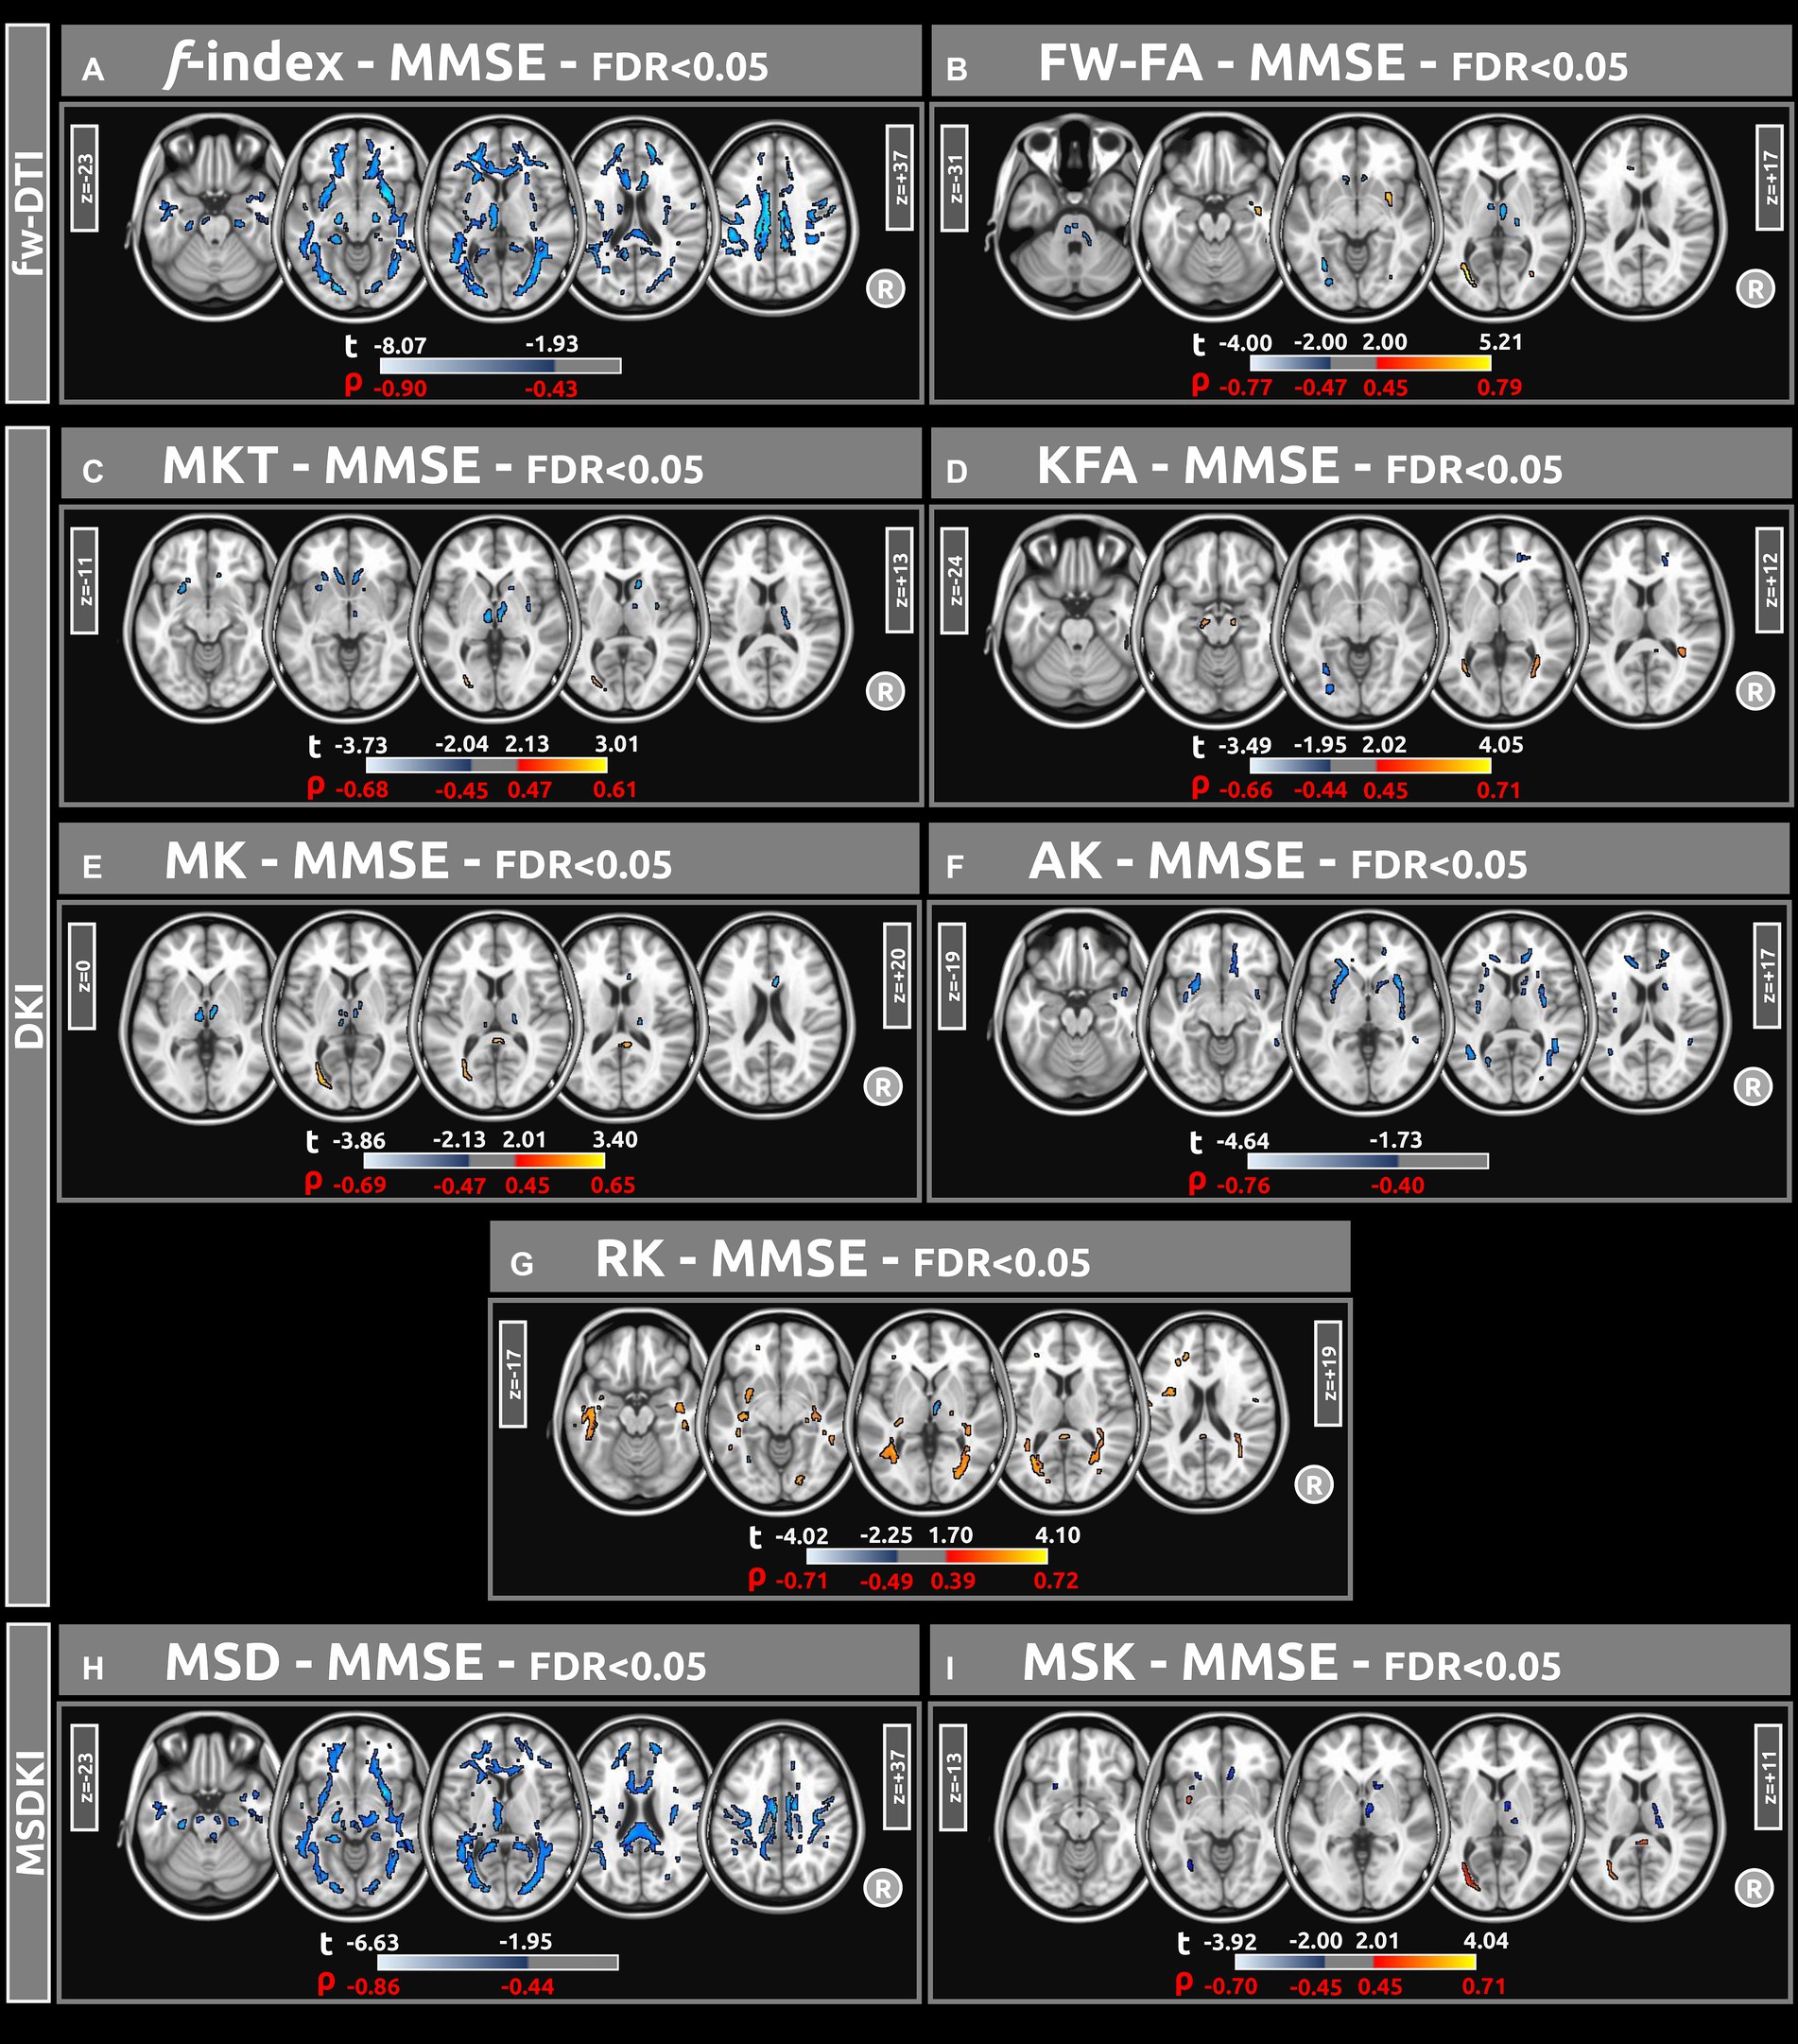
Figure 4. Voxel-based correlations between all diffusion metrics ((A) f index, (B) fw-FA, (C) MKT, (D) KFA, (E) MK, (F) AK, (G) RK, (H) MSD, and (I) MSK) and MMSE scores were computed using a linear model (at FDR < 0.05). Large clusters of correlations were found particularly for the f-index and MSD metrics. The parameters reported include t-values (t) and Spearman’s correlation coefficients (ρ).
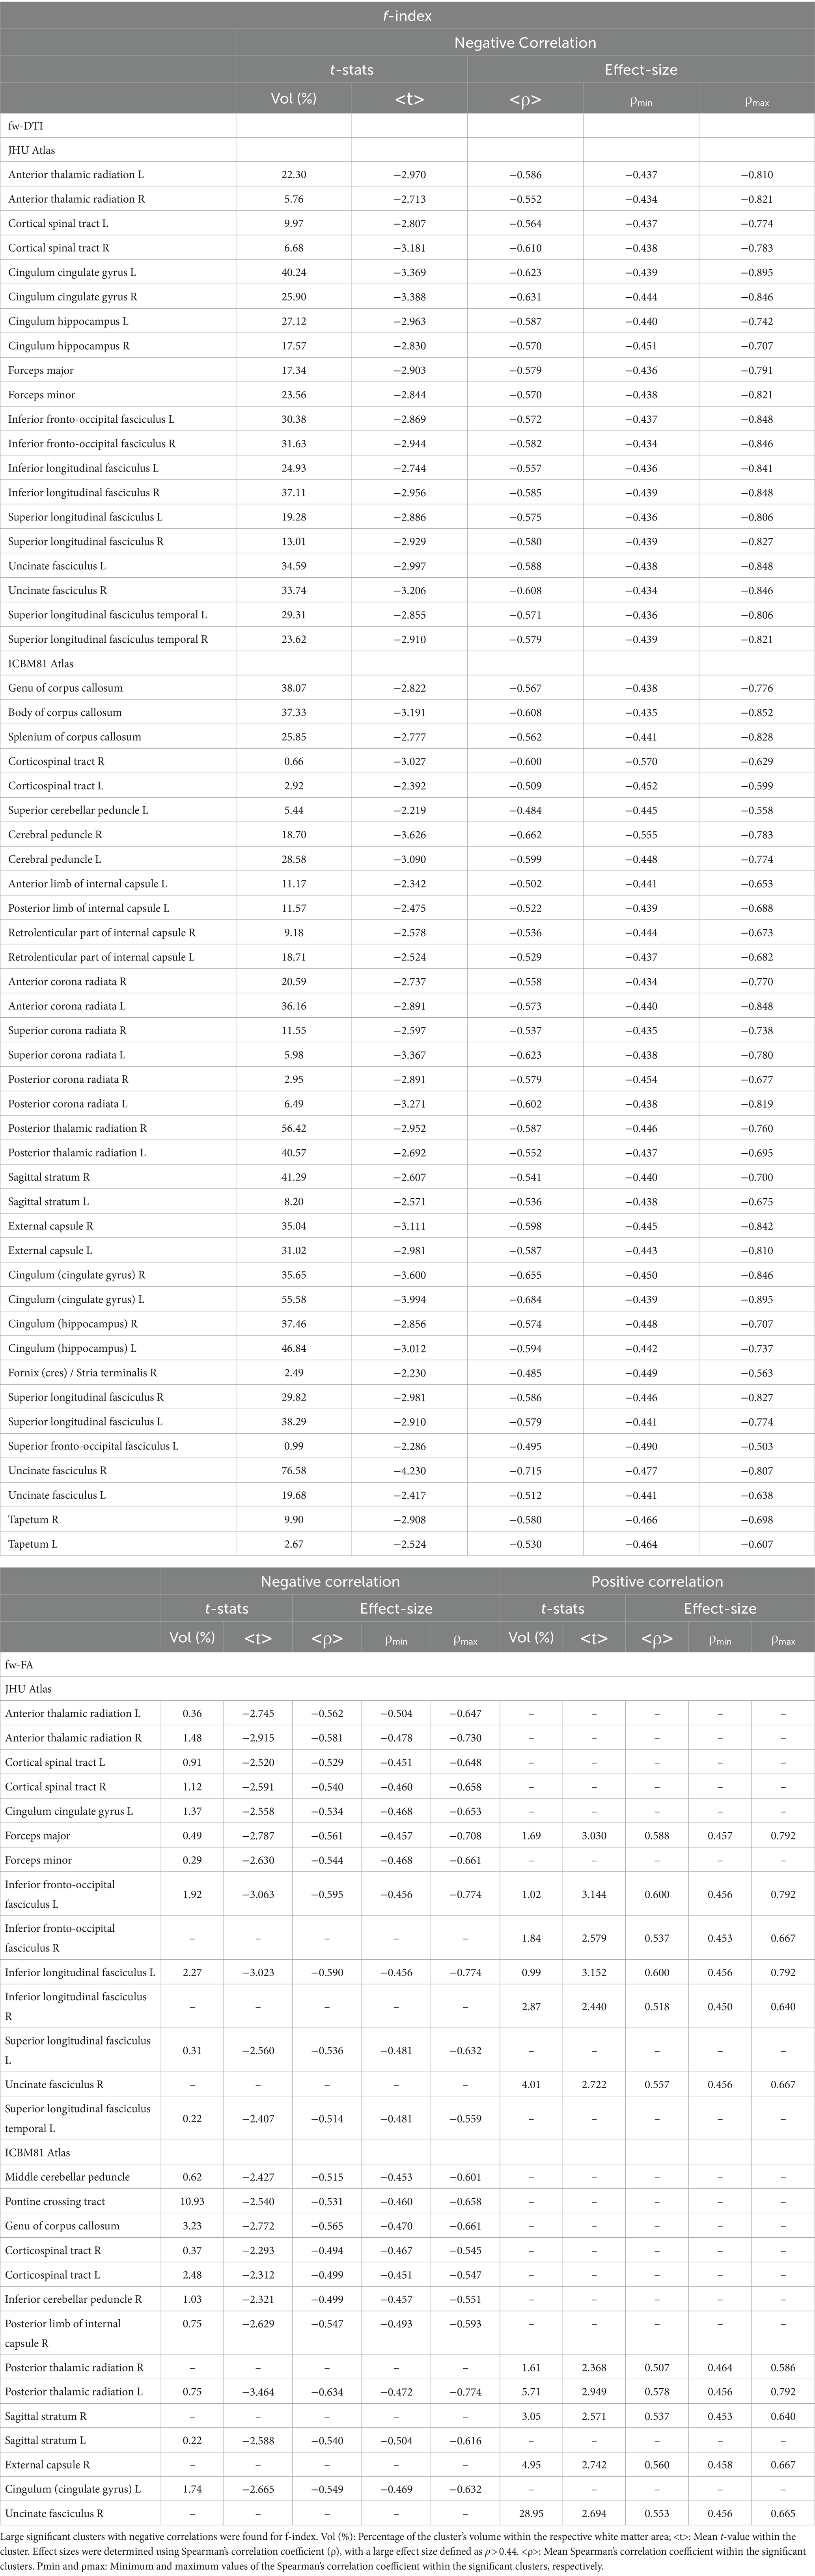
Table 6. Voxel-based correlations between fw-DTI metrics (f-index and fw-FA) and MMSE scores at FDR > 0.05.

Table 7. Voxel-based correlations between DKI metrics (MKT and KFA) and MMSE scores at FDR > 0.05.
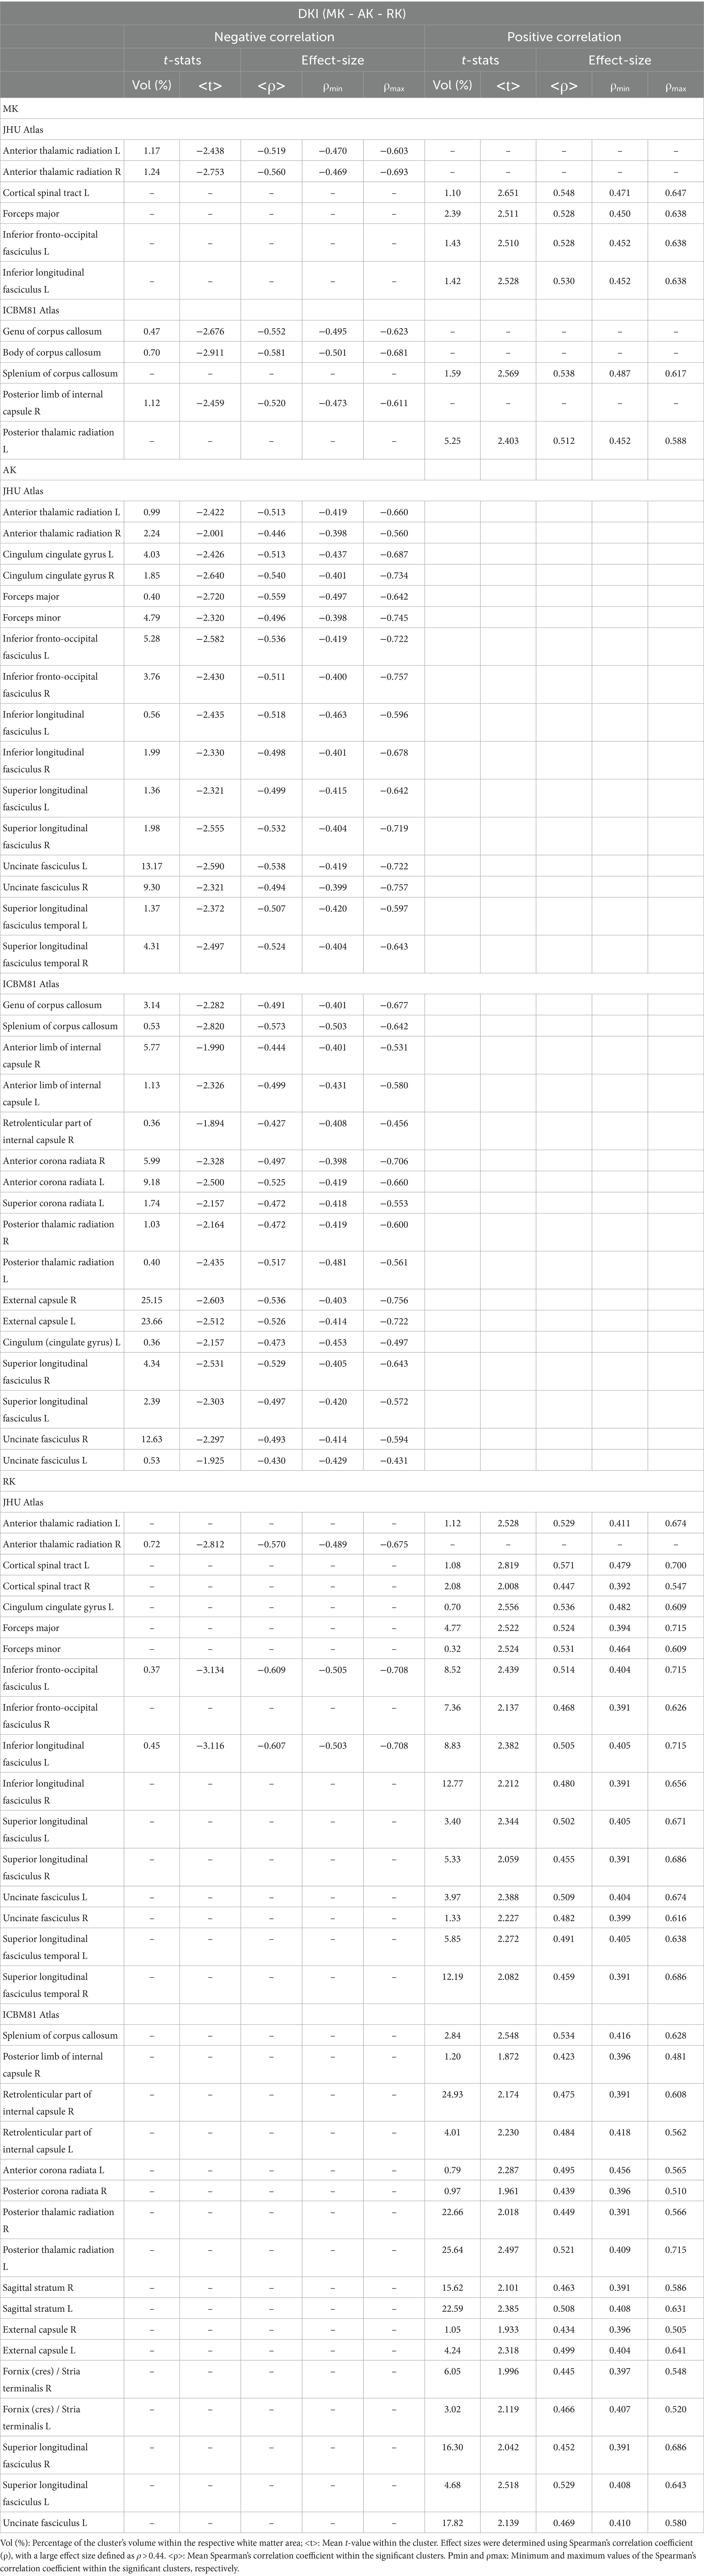
Table 8. Voxel-based correlations between DKI metrics (MK, AK, and RK) and MMSE scores at FDR > 0.05.
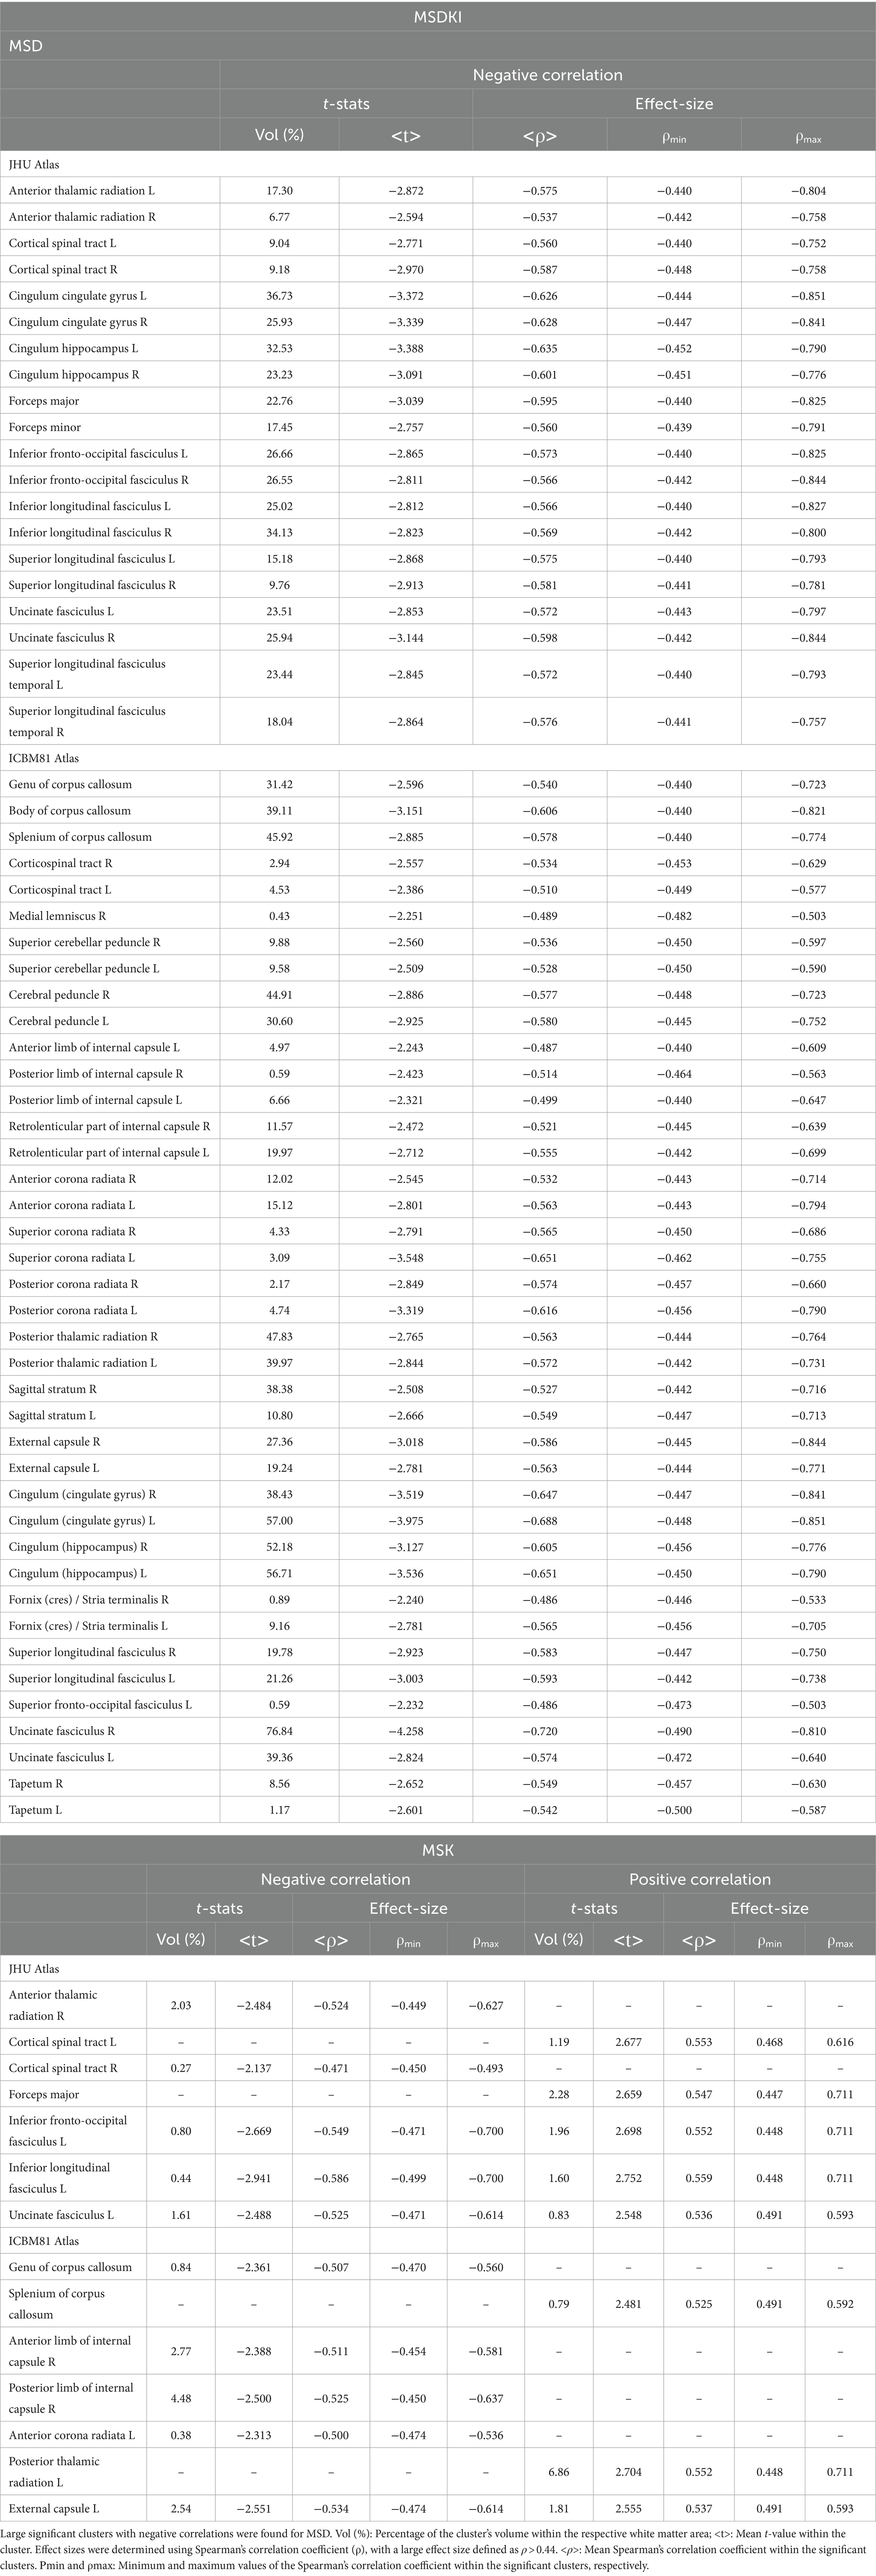
Table 9. Voxel-based correlations between MSDKI metrics and MMSE scores at FDR > 0.05.
4 Discussion
This study presents a comprehensive investigation of the relationship between diffusion metrics and cognitive status in CN and MCI cohorts. Through a multi-modal approach encompassing FWI, DKI, and MSDKI, this research offers valuable insights into the neurobiological mechanisms underpinning cognitive decline.
Our primary objective was to explore the complementary insights offered by FW-DTI and kurtosis MRI. Prior research has neither applied FW-DTI and DKI imaging to MCI, nor utilized MSDKI in this context. This multi-modal approach offers a comprehensive analysis of white matter alterations, providing insights that single-technique studies may overlook. Addressing the extracellular free-water component and capturing non-Gaussian diffusion behavior can lead to a precise characterization of tissue microstructure heterogeneity in MCI. The methodology is strengthened by the use of multi-shell data for free-water imaging. Multi-shell data allows for accurate separation of the free-water and tissue compartments, leading to reliable microstructural measurements. In contrast, single-shell approaches can result in biased estimates due to their limitations in disentangling these components. As noted by Golub et al., multiple b-values enhance the robustness and accuracy of FWI-DTI model (Golub et al., 2021).
FW-DTI accounts for the extracellular free-water component, providing more accurate tissue microstructure metrics, while kurtosis MRI captures non-Gaussian diffusion behavior, revealing tissue complexity not accessible with conventional DTI. Other advanced dMRI techniques, such as Neurite Orientation Dispersion and Density Imaging (NODDI) (Zhang et al., 2012) or intravoxel incoherent motion (IVIM) (Le Bihan, 2019), could offer additional insights in the context of cognitive decline. Previous studies in MCI and AD have shown that NODDI biomarkers of microstructure decrease, while those related to isotropic water diffusion increase (Fu et al., 2020). Additionally, IVIM may reveal early changes in microstructure and pseudoperfusion in MCI and AD cohorts (Bergamino et al., 2020, 2022). This study aimed to comprehensively assess the microstructural properties of MCI by utilizing both FW-DTI and DKI imaging techniques, and future studies could investigate a wider range of dMRI techniques in the context of cognitive decline.
A multi-shell dMRI acquisition computed the FWI-related metric, employing the algorithm developed by Hoy et al. (2014). This approach surpasses the constraints associated with single-shell acquisition algorithms (Pasternak et al., 2009). In analyzing the f index metric related to the free water content within brain tissue, pronounced differences between the CN and MCI groups were observed. Specifically, individuals with MCI demonstrated elevated free water levels across several white matter regions, potentially indicative of neuroinflammatory responses or axonal degradation processes (Dumont et al., 2019; Nakaya et al., 2022). These findings match those of prior studies showing higher free water measures in MCI and AD patients compared to CN controls (Dumont et al., 2019; Bergamino et al., 2021). Additionally, the identification of extensive clusters with large effect sizes, particularly in the corpus callosum, right cerebral peduncle, right sagittal stratum, and right uncinate fasciculus, highlights the vulnerability of these areas in the MCI cohort and suggests potential pathways for the spread of pathological changes.
Analysis of fw-FA metrics revealed a distinct pattern of white matter integrity degradation in the MCI group. Compared to the CN cohort, MCI subjects exhibited significantly lower fw-FA values in regions critical for cognitive processing and memory, including the right sagittal stratum, left cingulum (hippocampus), and right fornix (crus)/stria terminalis. Extensive clusters with a coefficient |g| > 0.61 in these areas point to compromised axonal integrity and myelination, likely reflecting early neurodegenerative changes. White matter clusters with elevated fw-FA values were also identified within the MCI group. These clusters had a large effect size, but their volumes were notably small.
The DKI model can overcome some of the limitations of DTI and has shown promise in differentiating between individuals with AD, MCI, and cognitively normal individuals (Struyfs et al., 2015; Chu et al., 2022; Xu et al., 2023). The lower kurtosis values across several white matter regions in the MCI group suggest a potential disruption in the microstructural integrity of these areas compared to the CN group. These significant differences, characterized by large clusters and large effect sizes, underscore the sensitivity of DKI-related metrics in detecting subtle variations in white matter microstructure. These findings align with previous research that demonstrated the utility of DKI in identifying microstructural changes associated with neurodegenerative diseases (Struyfs et al., 2015). In this study, the white matter regions most associated with cognitive decline are the superior longitudinal fasciculus, superior fronto-occipital fasciculus, corpus callosum, and sagittal stratum.
Smaller clusters with higher kurtosis values in the MCI group introduce an intriguing aspect of white matter pathology in MCI. This finding might suggest a heterogeneous response of white matter to the disease process, with specific areas possibly undergoing compensatory changes or differing in their susceptibility to neurodegeneration. While the volumes of these clusters were notably smaller, it should be noted that Dong et al. demonstrated non-monotonic behavior of DKI metrics in AD pathology, where subjects with milder amyloid deposition exhibited higher kurtosis than controls. This suggests that higher kurtosis values can be present in certain stages of disease progression or under specific pathological conditions (Dong et al., 2020). Additionally, several animal studies have shown an increase in kurtosis in the context of neuroinflammation, possibly reflecting processes such as astrogliosis and macrophage aggregation. These findings indicate that elevated kurtosis may be associated with early or specific pathological changes, rather than simply indicating a general decline in tissue integrity (Guan et al., 2021).
This study employed a novel approach utilizing the MSDKI model to investigate MCI and dementia. The findings provide evidence regarding the utility of MSD and MSK metrics in distinguishing between MCI and CN groups. The voxel-based statistical analysis revealed significant differences between MCI and CN groups, with MCI participants showing higher levels of water diffusion (MSD) and lower MSK values than the CN group. These differences were particularly pronounced in the white matter regions where clusters exhibited large effect sizes.
The increased free water diffusion observed in the MCI group may reflect microstructural degradation within white matter pathways. This degradation is likely a result of neurodegenerative processes that compromise the integrity of white matter, facilitating greater water movement. The alignment of MSD findings with the f index further corroborates this interpretation, suggesting a consistent pattern of white matter compromise by higher free water levels in individuals with MCI.
Conversely, the lower MSK values observed in the MCI group might indicate a reduction in the complexity of the microstructural environment. Kurtosis measures the deviation of water diffusion from a Gaussian distribution, with lower values suggesting a more homogeneous diffusion environment. This might be interpreted as a loss of microstructural complexity, potentially due to the simplification of neural pathways or a decrease in neuronal density, which are hallmark features of cognitive decline and neurodegeneration (Chu et al., 2022).
As assessed by MMSE scores, the voxel-based correlations in Figure 4 highlight the relationship between diffusion metrics and cognitive function. Significant negative correlations between MMSE scores and both the f index and the MSD metric across several white matter regions underscore the potential of these diffusion metrics as biomarkers for cognitive impairment. These correlations suggest that as the integrity of white matter decreases, cognitive function, measured by the MMSE, diminishes. This is consistent with previous research indicating that white matter integrity is crucial for efficient cognitive functioning, and white matter degradation can be linked to various neurodegenerative diseases and cognitive decline (Madden et al., 2009; Chen et al., 2023).
The analysis also revealed both positive and negative correlations between MMSE scores and other diffusion metrics across different brain regions. This indicates that certain brain regions may compensate for white matter degradation in others, or that changes in brain structure differentially impact different aspects of cognitive function.
Together, these findings revealed differences between groups across several white matter regions, including the forceps minor, inferior/superior longitudinal fasciculus, and corpus callosum. These areas are potentially associated with MCI or dementia. Therefore, studying the relationship between MCI and white matter microstructure using different dMRI methods may enhance our understanding and yield more comprehensive results. Although this study cannot definitively determine which metric or region is most sensitive to the earliest microstructural changes, the multi-modal approach aims to provide a comprehensive view of white matter alterations in MCI. We hypothesize that combining these metrics will enhance our ability to detect and characterize early neurodegenerative changes.
While this study employed multi-shell dMRI data and advanced dMRI models to address certain shortcomings of standard DTI, it remains subject to other limitations. Although DKI metrics have been reported to be less affected by the partial volume effect (PVE) than DTI metrics (Yang et al., 2013), they might still be influenced by PVEs. Another limitation is related to the MSDKI model, a variation of DKI that simplifies the complex metrics of DKI into a single mean signal metric. By focusing on a mean signal approach, MSDKI might overlook specific microstructural complexities that can be captured through the full DKI model. This simplification may lead to a loss of valuable information about the directionality of diffusion and microstructural heterogeneity within tissues.
In conclusion, this study highlights the complex link between diffusion metrics and cognitive status in cohorts of CN and MCI participants. It supplements previous research by revealing that microstructural changes, which are detectable through advanced diffusion imaging, may serve as early indicators of cognitive impairment. Additionally, multimodal diffusion MRI techniques provide new insights into the neurobiological mechanisms of cognitive decline while underscoring the value of advanced imaging for early detection.
Data availability statement
Publicly available datasets were analyzed in this study. This data can be found at: https://adni.loni.usc.edu/.
Ethics statement
The studies involving humans were approved by Alzheimer’s Disease Neuroimaging Initiative (ADNI) (National Institutes of Health Grant U01 AG024904) and DOD ADNI (Department of Defense award number W81XWH-12-2-0012) - https://adni.loni.usc.edu/. The studies were conducted in accordance with the local legislation and institutional requirements. The participants provided their written informed consent to participate in this study.
Author contributions
MN: Data curation, Formal analysis, Writing – original draft, Conceptualization. EK: Conceptualization, Data curation, Writing – review & editing. AS: Funding acquisition, Supervision, Validation, Writing – review & editing. MB: Data curation, Formal analysis, Supervision, Validation, Visualization, Writing – original draft, Writing – review & editing.
Funding
The author(s) declare that financial support was received for the research, authorship, and/or publication of this article. This work was supported by the Barrow Neurological Foundation, Sam & Peggy Grossman Family Foundation, Samuel P. Mandell Foundation, and NIH/NIA (P30AG072980). Data collection and sharing for this project was funded by the Alzheimer’s Disease Neuroimaging Initiative (ADNI) (National Institutes of Health Grant U01 AG024904) and DOD ADNI (Department of Defense award number W81XWH-12-2-0012). ADNI is funded by the National Institute on Aging, the National Institute of Biomedical Imaging and Bioengineering, and through generous contributions from the following: AbbVie, Alzheimer’s Association; Alzheimer’s Drug Discovery Foundation; Araclon Biotech; BioClinica, Inc.; Biogen; Bristol-Myers Squibb Company; CereSpir, Inc.; Cogstate; Eisai Inc.; Elan Pharmaceuticals, Inc.; Eli Lilly and Company; EuroImmun; F. Hoffmann-La Roche Ltd. and its affiliated company Genentech, Inc.; Fujirebio; GE Healthcare; IXICO Ltd.; Janssen Alzheimer Immunotherapy Research & Development, LLC.; Johnson & Johnson Pharmaceutical Research & Development LLC.; Lumosity; Lundbeck; Merck & Co., Inc.; Meso Scale Diagnostics, LLC.; NeuroRx Research; Neurotrack Technologies; Novartis Pharmaceuticals Corporation; Pfizer Inc.; Piramal Imaging; Servier; Takeda Pharmaceutical Company; and Transition Therapeutics. The Canadian Institutes of Health Research is providing funds to support ADNI clinical sites in Canada. Private sector contributions are facilitated by the Foundation for the National Institutes of Health (www.fnih.org). The grantee organization is the Northern California Institute for Research and Education, and the study is coordinated by the Alzheimer’s Therapeutic Research Institute at the University of Southern California. ADNI data are disseminated by the Laboratory for NeuroImaging at the University of Southern California.
Conflict of interest
The authors declare that the research was conducted in the absence of any commercial or financial relationships that could be construed as a potential conflict of interest.
Publisher’s note
All claims expressed in this article are solely those of the authors and do not necessarily represent those of their affiliated organizations, or those of the publisher, the editors and the reviewers. Any product that may be evaluated in this article, or claim that may be made by its manufacturer, is not guaranteed or endorsed by the publisher.
Supplementary material
The Supplementary material for this article can be found online at: https://www.frontiersin.org/articles/10.3389/fnins.2024.1440653/full#supplementary-material
Footnotes
References
Anand, S., and Schoo, C. (2024). Mild cognitive impairment. Treasure Island (FL): StatPearls Publishing.
Andersson, J. L. R., and Sotiropoulos, S. N. (2016). An integrated approach to correction for off-resonance effects and subject movement in diffusion MR imaging. NeuroImage 125, 1063–1078. doi: 10.1016/j.neuroimage.2015.10.019
Arab, A., Wojna-Pelczar, A., Khairnar, A., Szabó, N., and Ruda-Kucerova, J. (2018). Principles of diffusion kurtosis imaging and its role in early diagnosis of neurodegenerative disorders. Brain Res. Bull. 139, 91–98. doi: 10.1016/j.brainresbull.2018.01.015
Arevalo-Rodriguez, I., Smailagic, N., Roqué, I., Figuls, M., Ciapponi, A., Sanchez-Perez, E., et al. (2015). Mini-mental state examination (MMSE) for the detection of Alzheimer’s disease and other dementias in people with mild cognitive impairment (MCI). Cochrane Database Syst. Rev. 2015:CD010783. doi: 10.1002/14651858.CD010783.pub2
Bergamino, M., Keeling, E., McElvogue, M., Schaefer, S. Y., Burke, A., Prigatano, G., et al. (2024). White matter microstructure analysis in subjective memory complaints and cognitive impairment: insights from diffusion kurtosis imaging and free-water DTI. J. Alzheimers Dis. 98, 863–884. doi: 10.3233/JAD-230952
Bergamino, M., Kuplicki, R., Victor, T. A., Cha, Y.-H., and Paulus, M. P. (2017). Comparison of two different analysis approaches for DTI free-water corrected and uncorrected maps in the study of white matter microstructural integrity in individuals with depression. Hum. Brain Mapp. 38, 4690–4702. doi: 10.1002/hbm.23694
Bergamino, M., Nespodzany, A., Baxter, L. C., Burke, A., Caselli, R. J., Sabbagh, M. N., et al. (2020). Preliminary assessment of Intravoxel incoherent motion diffusion-weighted MRI (IVIM-DWI) metrics in Alzheimer’s disease. J. Magn. Reson. Imaging 52:27445. doi: 10.1002/jmri.27445
Bergamino, M., Steffes, L., Burke, A., Baxter, L. C., Caselli, R. J., Sabbagh, M. N., et al. (2022). Longitudinal Assessment of Intravoxel Incoherent Motion Diffusion-Weighted MRI (IVIM-DWI) Metrics in Alzheimer’s Disease, in ISMRM 2022 Annual Meeting, (London).
Bergamino, M., Walsh, R. R., and Stokes, A. M. (2021). Free-water diffusion tensor imaging improves the accuracy and sensitivity of white matter analysis in Alzheimer’s disease. Sci. Rep. 11:6990. doi: 10.1038/s41598-021-86505-7
Chen, J., Ge, A., Zhou, Y., Ma, Y., Zhong, S., Chen, C., et al. (2023). White matter integrity mediates the associations between white matter hyperintensities and cognitive function in patients with silent cerebrovascular diseases. CNS Neurosci. Ther. 29, 412–428. doi: 10.1111/cns.14015
Chu, X., Wu, P., Yan, H., Chen, X., Fan, L., Wu, Z., et al. (2022). Comparison of brain microstructure alterations on diffusion kurtosis imaging among Alzheimer’s disease, mild cognitive impairment, and cognitively normal individuals. Front. Aging Neurosci. 14:919143. doi: 10.3389/fnagi.2022.919143
Coutu, J.-P., Chen, J. J., Rosas, H. D., and Salat, D. H. (2014). Non-Gaussian water diffusion in aging white matter. Neurobiol. Aging 35, 1412–1421. doi: 10.1016/j.neurobiolaging.2013.12.001
Debette, S., and Markus, H. S. (2010). The clinical importance of white matter hyperintensities on brain magnetic resonance imaging: systematic review and meta-analysis. BMJ 341:c3666. doi: 10.1136/bmj.c3666
Dong, J. W., Jelescu, I. O., Ades-Aron, B., Novikov, D. S., Friedman, K., Babb, J. S., et al. (2020). Diffusion MRI biomarkers of white matter microstructure vary nonmonotonically with increasing cerebral amyloid deposition. Neurobiol. Aging 89, 118–128. doi: 10.1016/j.neurobiolaging.2020.01.009
Dumont, M., Roy, M., Jodoin, P.-M., Morency, F. C., Houde, J.-C., Xie, Z., et al. (2019). Free water in white matter differentiates MCI and AD from control subjects. Front. Aging Neurosci. 11:270. doi: 10.3389/fnagi.2019.00270
Falangola, M. F., Jensen, J. H., Tabesh, A., Hu, C., Deardorff, R. L., Babb, J. S., et al. (2013). Non-Gaussian diffusion MRI assessment of brain microstructure in mild cognitive impairment and Alzheimer’s disease. Magn. Reson. Imaging 31, 840–846. doi: 10.1016/j.mri.2013.02.008
Fu, X., Shrestha, S., Sun, M., Wu, Q., Luo, Y., Zhang, X., et al. (2020). Microstructural white matter alterations in mild cognitive impairment and Alzheimer’s disease: study based on neurite orientation dispersion and density imaging (NODDI). Clin. Neuroradiol. 30, 569–579. doi: 10.1007/s00062-019-00805-0
Garnier-Crussard, A., Cotton, F., Krolak-Salmon, P., and Chételat, G. (2023). White matter hyperintensities in Alzheimer’s disease: beyond vascular contribution. Alzheimers Dement. 19, 3738–3748. doi: 10.1002/alz.13057
Golub, M., Neto Henriques, R., and Gouveia Nunes, R. (2021). Free-water DTI estimates from single b-value data might seem plausible but must be interpreted with care. Magn. Reson. Med. 85, 2537–2551. doi: 10.1002/mrm.28599
Guan, X., Liu, S., Liang, M., Li, G., Dong, J., and Zhou, Q. (2021). Diffusion kurtosis imaging to evaluate the effect and mechanism of tetramethylpyrazine on cognitive impairment induced by lipopolysaccharide in rats. Brain Imaging Behav. 15, 2492–2501. doi: 10.1007/s11682-021-00449-0
Henriques, R. N., Correia, M. M., Marrale, M., Huber, E., Kruper, J., Koudoro, S., et al. (2021). Diffusional kurtosis imaging in the diffusion imaging in Python project. Front. Hum. Neurosci. 15:675433. doi: 10.3389/fnhum.2021.675433
Hoy, A. R., Koay, C. G., Kecskemeti, S. R., and Alexander, A. L. (2014). Optimization of a free water elimination two-compartment model for diffusion tensor imaging. NeuroImage 103, 323–333. doi: 10.1016/j.neuroimage.2014.09.053
Hua, K., Zhang, J., Wakana, S., Jiang, H., Li, X., Reich, D. S., et al. (2008). Tract probability maps in stereotaxic spaces: analyses of white matter anatomy and tract-specific quantification. NeuroImage 39, 336–347. doi: 10.1016/j.neuroimage.2007.07.053
Jenkinson, M., Beckmann, C. F., Behrens, T. E. J., Woolrich, M. W., and Smith, S. M. (2012). FSL. Neuroimage 62, 782–790. doi: 10.1016/j.neuroimage.2011.09.015
Jensen, J. H., and Helpern, J. A. (2010). MRI quantification of non-Gaussian water diffusion by kurtosis analysis. NMR Biomed. 23, 698–710. doi: 10.1002/nbm.1518
Jensen, J. H., Helpern, J. A., Ramani, A., Lu, H., and Kaczynski, K. (2005). Diffusional kurtosis imaging: the quantification of non-gaussian water diffusion by means of magnetic resonance imaging. Magn. Reson. Med. 53, 1432–1440. doi: 10.1002/mrm.20508
Kynast, J., Lampe, L., Luck, T., Frisch, S., Arelin, K., Hoffmann, K.-T., et al. (2018). White matter hyperintensities associated with small vessel disease impair social cognition beside attention and memory. J. Cereb. Blood Flow Metab. 38, 996–1009. doi: 10.1177/0271678X17719380
Le Bihan, D. (2014). Diffusion MRI: what water tells us about the brain. EMBO Mol. Med. 6, 569–573. doi: 10.1002/emmm.201404055
Le Bihan, D. (2019). What can we see with IVIM MRI? NeuroImage 187, 56–67. doi: 10.1016/j.neuroimage.2017.12.062
Liu, C.-C., Liu, C.-C., Kanekiyo, T., Xu, H., and Bu, G. (2013). Apolipoprotein E and Alzheimer disease: risk, mechanisms and therapy. Nat. Rev. Neurol. 9, 106–118. doi: 10.1038/nrneurol.2012.263
Madden, D. J., Bennett, I. J., and Song, A. W. (2009). Cerebral white matter integrity and cognitive aging: contributions from diffusion tensor imaging. Neuropsychol. Rev. 19, 415–435. doi: 10.1007/s11065-009-9113-2
Marshall, G. A., Zoller, A. S., Lorius, N., Amariglio, R. E., Locascio, J. J., Johnson, K. A., et al. (2015). Functional activities questionnaire items that best discriminate and predict progression from clinically Normal to mild cognitive impairment. Curr. Alzheimer Res. 12, 493–502. doi: 10.2174/156720501205150526115003
Morris, J. C. (1993). The clinical dementia rating (CDR): current version and scoring rules. Neurology 43, 2412–2414. doi: 10.1212/wnl.43.11.2412-a
Mueller, B. A., Lim, K. O., Hemmy, L., and Camchong, J. (2015). Diffusion MRI and its role in neuropsychology. Neuropsychol. Rev. 25, 250–271. doi: 10.1007/s11065-015-9291-z
Nakaya, M., Sato, N., Matsuda, H., Maikusa, N., Shigemoto, Y., Sone, D., et al. (2022). Free water derived by multi-shell diffusion MRI reflects tau/neuroinflammatory pathology in Alzheimer’s disease. Alzheimers Dement. 8:e12356. doi: 10.1002/trc2.12356
Pasternak, O., Sochen, N., Gur, Y., Intrator, N., and Assaf, Y. (2009). Free water elimination and mapping from diffusion MRI. Magn. Reson. Med. 62, 717–730. doi: 10.1002/mrm.22055
Petersen, R. C., Aisen, P. S., Beckett, L. A., Donohue, M. C., Gamst, A. C., Harvey, D. J., et al. (2010). Alzheimer’s Disease Neuroimaging Initiative (ADNI): clinical characterization. Neurology 74, 201–209. doi: 10.1212/WNL.0b013e3181cb3e25
Pierpaoli, C., Jezzard, P., Basser, P. J., Barnett, A., and Di Chiro, G. (1996). Diffusion tensor MR imaging of the human brain. Radiology 201, 637–648. doi: 10.1148/radiology.201.3.8939209
Power, M. C., Su, D., Wu, A., Reid, R. I., Jack, C. R., Knopman, D. S., et al. (2019). Association of white matter microstructural integrity with cognition and dementia. Neurobiol. Aging 83, 63–72. doi: 10.1016/j.neurobiolaging.2019.08.021
Roberts, R., and Knopman, D. S. (2013). Classification and epidemiology of MCI. Clin. Geriatr. Med. 29, 753–772. doi: 10.1016/j.cger.2013.07.003
Smith, S. M., and Nichols, T. E. (2009). Threshold-free cluster enhancement: addressing problems of smoothing, threshold dependence and localisation in cluster inference. NeuroImage 44, 83–98. doi: 10.1016/j.neuroimage.2008.03.061
Steven, A. J., Zhuo, J., and Melhem, E. R. (2014). Diffusion kurtosis imaging: an emerging technique for evaluating the microstructural environment of the brain. AJR Am. J. Roentgenol. 202, W26–W33. doi: 10.2214/AJR.13.11365
Struyfs, H., Van Hecke, W., Veraart, J., Sijbers, J., Slaets, S., De Belder, M., et al. (2015). Diffusion kurtosis imaging: a possible MRI biomarker for AD diagnosis? J. Alzheimers Dis. 48, 937–948. doi: 10.3233/JAD-150253
Tae, W. S., Ham, B. J., Pyun, S. B., Kang, S. H., and Kim, B. J. (2018). Current clinical applications of diffusion-tensor imaging in neurological disorders. J. Clin. Neurol. 14, 129–140. doi: 10.3988/jcn.2018.14.2.129
Tournier, J.-D., Smith, R., Raffelt, D., Tabbara, R., Dhollander, T., Pietsch, M., et al. (2019). MRtrix3: a fast, flexible and open software framework for medical image processing and visualisation. NeuroImage 202:116137. doi: 10.1016/j.neuroimage.2019.116137
Veraart, J., Novikov, D. S., Christiaens, D., Ades-Aron, B., Sijbers, J., and Fieremans, E. (2016). Denoising of diffusion MRI using random matrix theory. NeuroImage 142, 394–406. doi: 10.1016/j.neuroimage.2016.08.016
Wakana, S., Caprihan, A., Panzenboeck, M. M., Fallon, J. H., Perry, M., Gollub, R. L., et al. (2007). Reproducibility of quantitative tractography methods applied to cerebral white matter. NeuroImage 36, 630–644. doi: 10.1016/j.neuroimage.2007.02.049
Xu, W., Sun, X., Jiang, H., Wang, X., Wang, B., Niu, Q., et al. (2023). Diffusion kurtosis imaging in evaluating the mild cognitive impairment of occupational aluminum workers. Acad. Radiol. 30, 2225–2233. doi: 10.1016/j.acra.2022.12.003
Yang, A. W., Jensen, J. H., Hu, C. C., Tabesh, A., Falangola, M. F., and Helpern, J. A. (2013). Effect of cerebral spinal fluid suppression for diffusional kurtosis imaging. J. Magn. Reson. Imaging 37, 365–371. doi: 10.1002/jmri.23840
Yanhong, O., Chandra, M., and Venkatesh, D. (2013). Mild cognitive impairment in adult: a neuropsychological review. Ann. Indian Acad. Neurol. 16, 310–318. doi: 10.4103/0972-2327.116907
Yesavage, J. A., Brink, T. L., Rose, T. L., Lum, O., Huang, V., Adey, M., et al. (1982). Development and validation of a geriatric depression screening scale: a preliminary report. J. Psychiatr. Res. 17, 37–49. doi: 10.1016/0022-3956(82)90033-4
Yin, C., Li, S., Zhao, W., and Feng, J. (2013). Brain imaging of mild cognitive impairment and Alzheimer’s disease. Neural Regen. Res. 8, 435–444. doi: 10.3969/j.issn.1673-5374.2013.05.007
Zhang, F., Daducci, A., He, Y., Schiavi, S., Seguin, C., Smith, R. E., et al. (2022). Quantitative mapping of the brain’s structural connectivity using diffusion MRI tractography: a review. NeuroImage 249:118870. doi: 10.1016/j.neuroimage.2021.118870
Zhang, H., Schneider, T., Wheeler-Kingshott, C. A., and Alexander, D. C. (2012). NODDI: practical in vivo neurite orientation dispersion and density imaging of the human brain. NeuroImage 61, 1000–1016. doi: 10.1016/j.neuroimage.2012.03.072
Keywords: mild cognitive impairment, dementia, free-water DTI, diffusion kurtosis imaging, mean signal diffusion kurtosis imaging
Citation: Nelson MR, Keeling EG, Stokes AM and Bergamino M (2024) Exploring white matter microstructural alterations in mild cognitive impairment: a multimodal diffusion MRI investigation utilizing diffusion kurtosis and free-water imaging. Front. Neurosci. 18:1440653. doi: 10.3389/fnins.2024.1440653
Edited by:
Nagesh Adluru, University of Wisconsin-Madison, United StatesCopyright © 2024 Nelson, Keeling, Stokes and Bergamino. This is an open-access article distributed under the terms of the Creative Commons Attribution License (CC BY). The use, distribution or reproduction in other forums is permitted, provided the original author(s) and the copyright owner(s) are credited and that the original publication in this journal is cited, in accordance with accepted academic practice. No use, distribution or reproduction is permitted which does not comply with these terms.
*Correspondence: Maurizio Bergamino, bWF1cml6aW8uYmVyZ2FtaW5vQGJhcnJvd25ldXJvLm9yZw==; bWF1cml6aW8uYmVyZ2FtaW5vQHByb3Rvbi5tZQ==