
94% of researchers rate our articles as excellent or good
Learn more about the work of our research integrity team to safeguard the quality of each article we publish.
Find out more
BRIEF RESEARCH REPORT article
Front. Neurosci., 18 July 2024
Sec. Neurodegeneration
Volume 18 - 2024 | https://doi.org/10.3389/fnins.2024.1406969
This article is part of the Research TopicProgress in Neuroacanthocytosis Syndromes and Related Diseases Including other Bulk Lipid Transfer DisordersView all 10 articles
 Carolina A. Hernández1
 Kevin Peikert2,3,4
 Min Qiao5,6
 Alexis Darras5Jonathan R. A. de Wilde1Jennifer Bos1Maya Leibowitz7Ian Galea7Christian Wagner5,8
 Minke A. E. Rab1,9Ruth H. Walker10,11Andreas Hermann2,3,12
 Eduard J. van Beers13
 Richard van Wijk1
 Lars Kaestner5,6*
Introduction: The unique red blood cell (RBC) properties that characterize the rare neuroacanthocytosis syndromes (NAS) have prompted the exploration of osmotic gradient ektacytometry (Osmoscan) as a diagnostic tool for these disorders. In this exploratory study, we assessed if Osmoscans can discriminate NAS from other neurodegenerative diseases.
Methods: A comprehensive assessment was conducted using Osmoscan on a diverse group of patients, including healthy controls (n = 9), neuroacanthocytosis syndrome patients (n = 6, 2 VPS13A and 4 XK disease), Parkinson’s disease patients (n = 6), Huntington’s disease patients (n = 5), and amyotrophic lateral sclerosis patients (n = 4). Concurrently, we collected and analyzed RBC indices and patients’ characteristics.
Results: Statistically significant changes were observed in NAS patients compared to healthy controls and other conditions, specifically in osmolality at minimal elongation index (Omin), maximal elongation index (EImax), the osmolality at half maximal elongation index in the hyperosmotic part of the curve (Ohyper), and the width of the curve close to the osmolality at maximal elongation index (Omax-width).
Discussion: This study represents an initial exploration of RBC properties from NAS patients using osmotic gradient ektacytometry. While specific parameters exhibited differences, only Ohyper and Omax-width yielded 100% specificity for other neurodegenerative diseases. Moreover, unique correlations between Osmoscan parameters and RBC indices in NAS versus controls were identified, such as osmolality at maximal elongation index (Omax) vs. mean cellular hemoglobin content (MCH) and minimal elongation index (EImin) vs. red blood cell distribution width (RDW). Given the limited sample size, further studies are essential to establish diagnostic guidelines based on these findings.
Neuroacanthocytosis syndromes (NAS) comprise the neurodegenerative disorders VPS13A disease (formerly known as chorea-acanthocytosis) and XK disease (formerly known as McLeod syndrome) (Walker et al., 2023). Autosomal recessive VPS13A disease is caused by mutations in the Vacuolar Protein Sorting 13 Homolog A (VPS13A) gene and may present with progressive cognitive impairment, psychiatric symptoms, various movement disorders, muscle weakness, and epilepsy. In addition, the disease is characterized by acanthocytosis – the presence of morphologically altered red blood cells (RBCs) displaying thorn-like protrusions (Ueno et al., 2001; Rampoldi et al., 2002; Lupo et al., 2016). X-linked XK disease is caused by mutations in the XK gene typically leading to the absence of the Kx blood antigen. Manifestations of XK disease are very similar to VPS13A disease except for, e.g., the usually later onset and prominent cardiac involvement (Danek et al., 2001; Peikert et al., 2022a). As in VPS13A disease, acanthocytosis is a very common, but not obligatory feature (Peikert et al., 2022b). Recent studies have shown that VPS13A (bridge-like lipid transfer protein) and XK (scramblase) form a protein complex which may be the molecular basis of the phenotypical similarities in the symptoms of the related disorders (Park and Neiman, 2020; Guillén-Samander et al., 2022; Park et al., 2022; Ryoden et al., 2022).
Hence, RBCs are clearly affected in NAS (Storch et al., 2005; Siegl et al., 2013; Cluitmans et al., 2015; Peikert et al., 2022b). It is not clear whether the acanthocytes are a byproduct of the disease, directly resulting from the genetic defect, or a secondary effect. It is also unknown whether they play a role in disease progression (Franceschi et al., 2014; Adjobo-Hermans et al., 2015). It is known that RBC from NAS patients have an altered deformability (Darras et al., 2021; Rabe et al., 2021; Reichel et al., 2022; Recktenwald et al., 2022a). These properties are obviously important in the circulation of the microvasculature (Barshtein et al., 2016, 2017).
Osmotic gradient ektacytometry is another method for measuring RBC deformability, in addition to the previously mentioned microfluidic approaches (Bianchi et al., 2015; Lazarova et al., 2017; Zaninoni et al., 2018). The Laser Optical Rotational Red Cell Analyzer (Lorrca, RR Mechatronics, The Netherlands) is a device established for diagnostic parameters of RBC-related diseases (Costa et al., 2016; Kaestner and Bianchi, 2020). We tested if such an osmotic gradient ektacytometry approach could be used as a diagnostic tool for NAS. An easy method for an initial NAS screening is of utmost importance since NAS patients receive their diagnosis often very late. It is not uncommon for a correct diagnosis of NAS, which are ultra-rare diseases, to be made years or even decades after the initial symptoms appear. Obviously, the genetic confirmation is required for a definitive diagnosis (Walker and Danek, 2021), but an easy inexpensive ‘pre-test’ would be an extremely useful screening tool for both patients and clinicians.
Peripheral blood was collected into EDTA tubes (Sarstedt, Germany) for healthy control samples (n = 9) and VPS13A disease patients (n = 2), XK disease patients (n = 4), carriers of VPS13A mutations (n = 3), carriers of the XK mutations (n = 4), Parkinson’s disease (PD) patients (n = 6), Huntington’s disease (HD) patients (n = 5) and amyotrophic lateral sclerosis (ALS) patients (n = 4) patients. The study was approved by the review boards of the ‘Ärztekammer des Saarlandes’, permission number 51/18, as well as of the University of Rostock (A 2019–0134), and performed in accordance with the Declaration of Helsinki. Part of the study was carried out under national (UK) research ethics committee approval 11/SC/0204 and institutional approval ERGO 41084.
Osmoscans were performed by osmotic gradient ektacytometry on the Lorrca (RR Mechatronics, The Netherlands), according to the manufacturer’s instructions (Costa et al., 2016; Lazarova et al., 2017; Zaninoni et al., 2018). The Osmoscan was performed using a standardised final RBC dilution of 20,000 cells per μL of reagent. For the Osmoscan an osmotic gradient is created by the device by mixing two polyvinylpyrolidone (PVP) solutions with similar, physiological pH and viscosity, but different osmotic values.
For this study: Osmo LOW: 54 mOsm/kg, viscosity: 26.19 cP, Osmo HIGH: 776 mOsm/kg, viscosity: 28.76 cP was used. Data collection started at 60 mOsm/kg and continued until approximately 600 mOsm/kg. Red blood cell deformability was measured at a shear of 30 Pa, every second. The osmotic gradient gradually changes as a result of a varying mix of low and high osmotic reagent in the Couette flow system. The laser beam diffraction pattern (the A and B axis of the elliptical pattern) was measured. Deformability was expressed as the Elongation Index (EI), and calculated by the formula (A-B)/(A + B) representing the average shape change of the total RBC population under shear. The (local) minimum in elongation index (EI) in the hypo-osmotic part of the curve defines the values EImin and the corresponding osmolarity as Omin. Omin negatively correlates with the membrane surface-to-volume ratio of the RBCs: if the surface-to-volume ratio decreases, Omin increases. The (global) maximum EI of the curves define EImax and as the corresponding value Omax. If cell surface-to-volume decreases, EImax decreases. The value of half EImax in the hyperosmotic part of the curve defines EIhyper and the corresponding osmolarity Ohyper. An additional parameter is the area under the curve (AUC), which is correlated with the decrease in membrane deformability. Furthermore, we introduce two new parameters recently described (Wilde et al., 2023), called Omax-width and Omin-width, which are defined as the width of the curve at ±5% of EImax and at ±5% of EImin. The values of Omax-width recently showed a relation to the high intracellular viscosity of the RBC and limited ability to lose water to the environment (Wilde et al., 2023). Meanwhile Omin-width has been correlated to RBC population volume variability, disease severity and osmotic fragility (Wilde et al., 2023).
A complete RBC count including reticulocyte counts was measured by the central laboratory of the Saarland University Hospital (Flormann et al., 2022) or in the haematology department of Southampton General Hospital on an automated XN10 system (Sysmex, Japan).
The various parameters of RBC and Osmoscan analyses were thoroughly examined using standard statistical methods, including ordinary one-way ANOVA and Tukey’s multiple comparison test, with a confidence interval set at 95%. The correlation heatmap was constructed using the non-parametric Spearman correlation, incorporating a two-tailed p-value within a 95% confidence interval. For specific correlations, linear regressions were employed. It is important to note that all of these statistical analyses were executed and visualized using GraphPad Prism. This comprehensive approach aimed to provide a robust understanding of the relationships and variations within the studied parameters, ensuring a thorough and reliable interpretation of the data.
Since both VPS13A and XK disease are very rare diseases with an estimated incidence of 1:1,000,000 and 1:10,000,000, respectively, we used the occasion of the ‘11th International Meeting on Neuroacanthocytosis Syndromes’ (Kaestner, 2023), which was a joint scientific and patient meeting, to recruit two VPS13A disease patients and four XK disease patients as well as three VPS13A and four XK mutation carriers. The basic demographic characteristics of the patients are listed in Table 1. To allow a judgment for differential diagnosis, we compared the NAS patients to patients suffering from other neurodegenerative diseases, in particular, Parkinson’s disease (PD), Huntington’s disease (HD) and Amyotrophic lateral sclerosis (ALS) patients. The characteristics of these patients as well as the healthy controls are also summarized in Table 1.
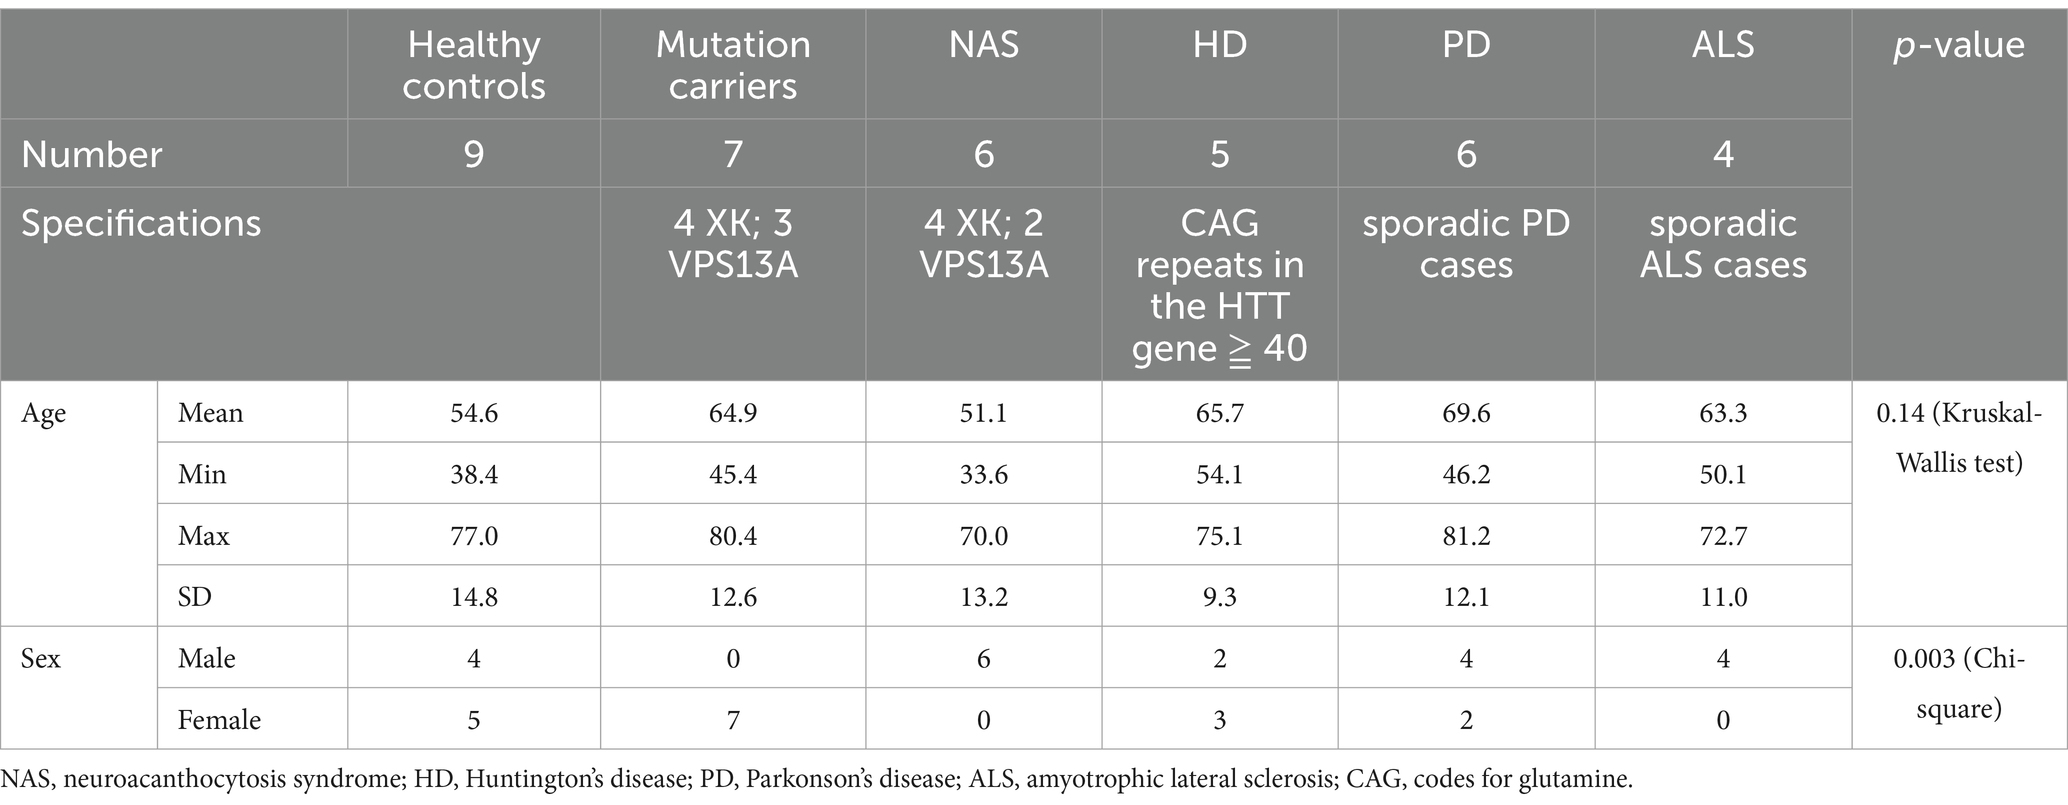
Table 1. Patient characteristics.
We investigated the differences in RBC deformability using the Osmoscan for patient samples from VPS13A disease, XK disease, HD, PD and ALS patients and compared it to healthy donors, in addition to carriers of VPS13A disease and XK disease. The results are summarised in Figure 1. In the graphs of Figures 1A–D, deformability vs. osmolality curves are plotted, whereas Figures 1E–L shows the statistical evaluation of particular parameters derived from the curves exemplified in Figures 1A–D.
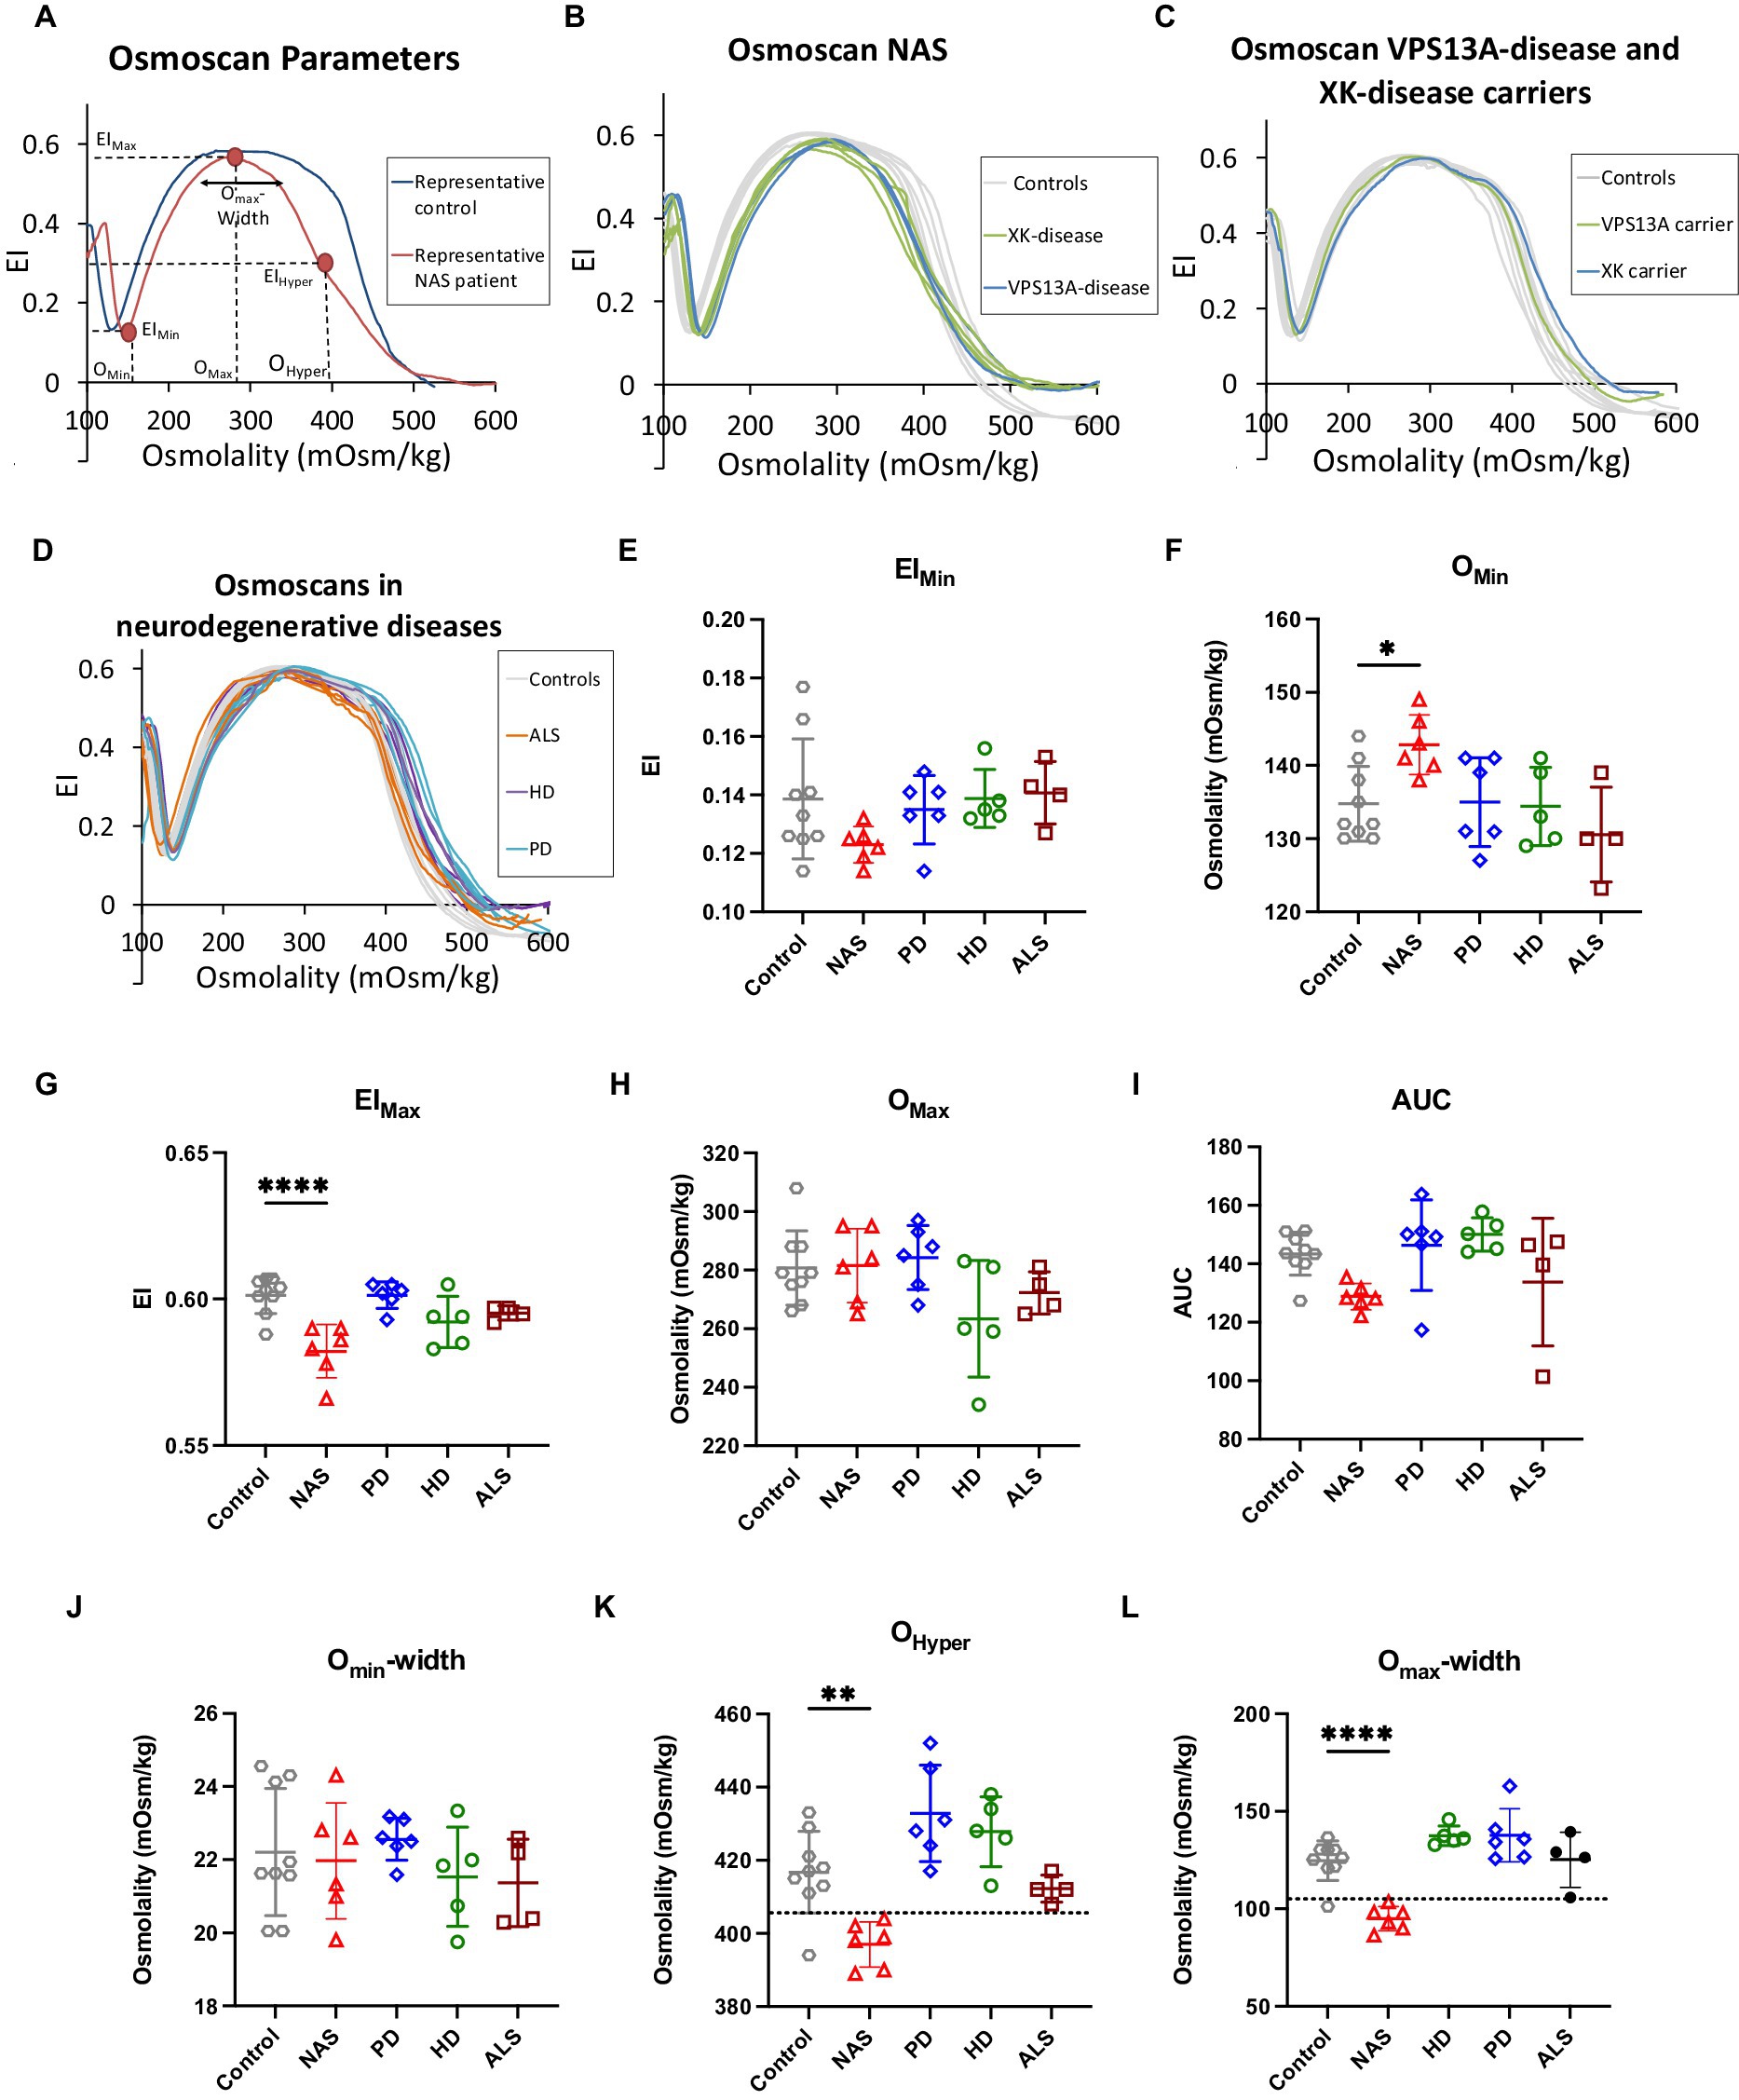
Figure 1. Ektacytometry data. Panel (A) shows representative Osmoscan curves of a NAS patient sample compared to a healthy control donor. In addition, characteristic parameters of the curve are annotated. Panel (B) provides the Osmoscan curves of both VPS13A disease patients and all 4 XK disease patients, showing their similarity and justifying to pool these patients in a NAS group for statistical analysis. Panel (C) depicts representative Osmoscan curves for both, VPS13A and XK mutation carriers showing their similarity. Panel (D) plots all Osmoscan curves of patients from all investigated neurodegenerative diseases except NAS to indicate the lack of difference between control curves and the neurodegenerative disorders HD, PD and ALS. In panels (A–D) each curve represents an individual patient or a healthy volunteer. Panels (E–L) show the statistical analysis of the characteristic parameters annotated in panel A. These are EImin, Omin, EImax, Omax, AUC, Omin-width, Ohyper and Omax-width, respectively. Plotted are the individual values with indication of the mean and the standard error of mean (SEM). Significance was checked with an ordinary one-way ANOVA test, and 1–4 stars correspond to p-values lower than 0.05, 0.01, 0.001, and 0.0001, respectively.
Figure 1A depicts representative examples of Osmoscan curves from the RBCs of a healthy donor and a NAS patient. Furthermore, this panel contains annotations for the particular parameters, which are statistically evaluated. Figure 1B shows the Osmoscan curves from RBCs of both VPS13A disease patients and all four XK-disease patients, all showing the same shape characteristics justifying their pooling into one NAS group for further statistical analysis. Similarly, Figure 1C shows two VPS13A and XK disease mutation carriers measured together with nine healthy control samples, also showing the same characteristics. Figure 1D depicts representative examples from the NAS group in comparison to RBC samples from other neurodegenerative patients, in particular PD, HD and ALS.
For EImin and AUC corresponding to Figures 1E–I, respectively, the curves of the NAS RBCs seem to differ from healthy control patients but this difference does not reach significance (p = 0.15; p = 0.08). In contrast, a significant difference was seen in the Omin, EImax, Ohyper and in Omax-width in NAS patients vs. healthy controls (Figures 1F,G,K,L). Interestingly, for Ohyper and Omax-width one could find threshold values allowing discrimination between controls and NAS patients (dotted lines in Figures 1K,L, respectively) with only one false positive value from healthy controls and no false positive among the other patients. In addition, no statistically significant difference was observed for any ektacytometric parameter when comparing HD, PD and ALS vs. healthy controls.
In addition, for all patients, a complete RBC count including a reticulocyte count was performed. The results are summarized in Figures 2A–I. With very few exceptions, which are the RBC distribution width (RDW) for the XK disease patients and the reticulocyte hemoglobin content for the VPS13A mutation carriers and the ALS patients, all measured indices were on average within the reference range (grey areas in Figures 2A–I). Differences in RBC number, hemoglobin concentration and hematocrit (Figures 2A–C, respectively) were most likely due to age and gender differences (typically, the mutation carriers were the mothers of the male patients).
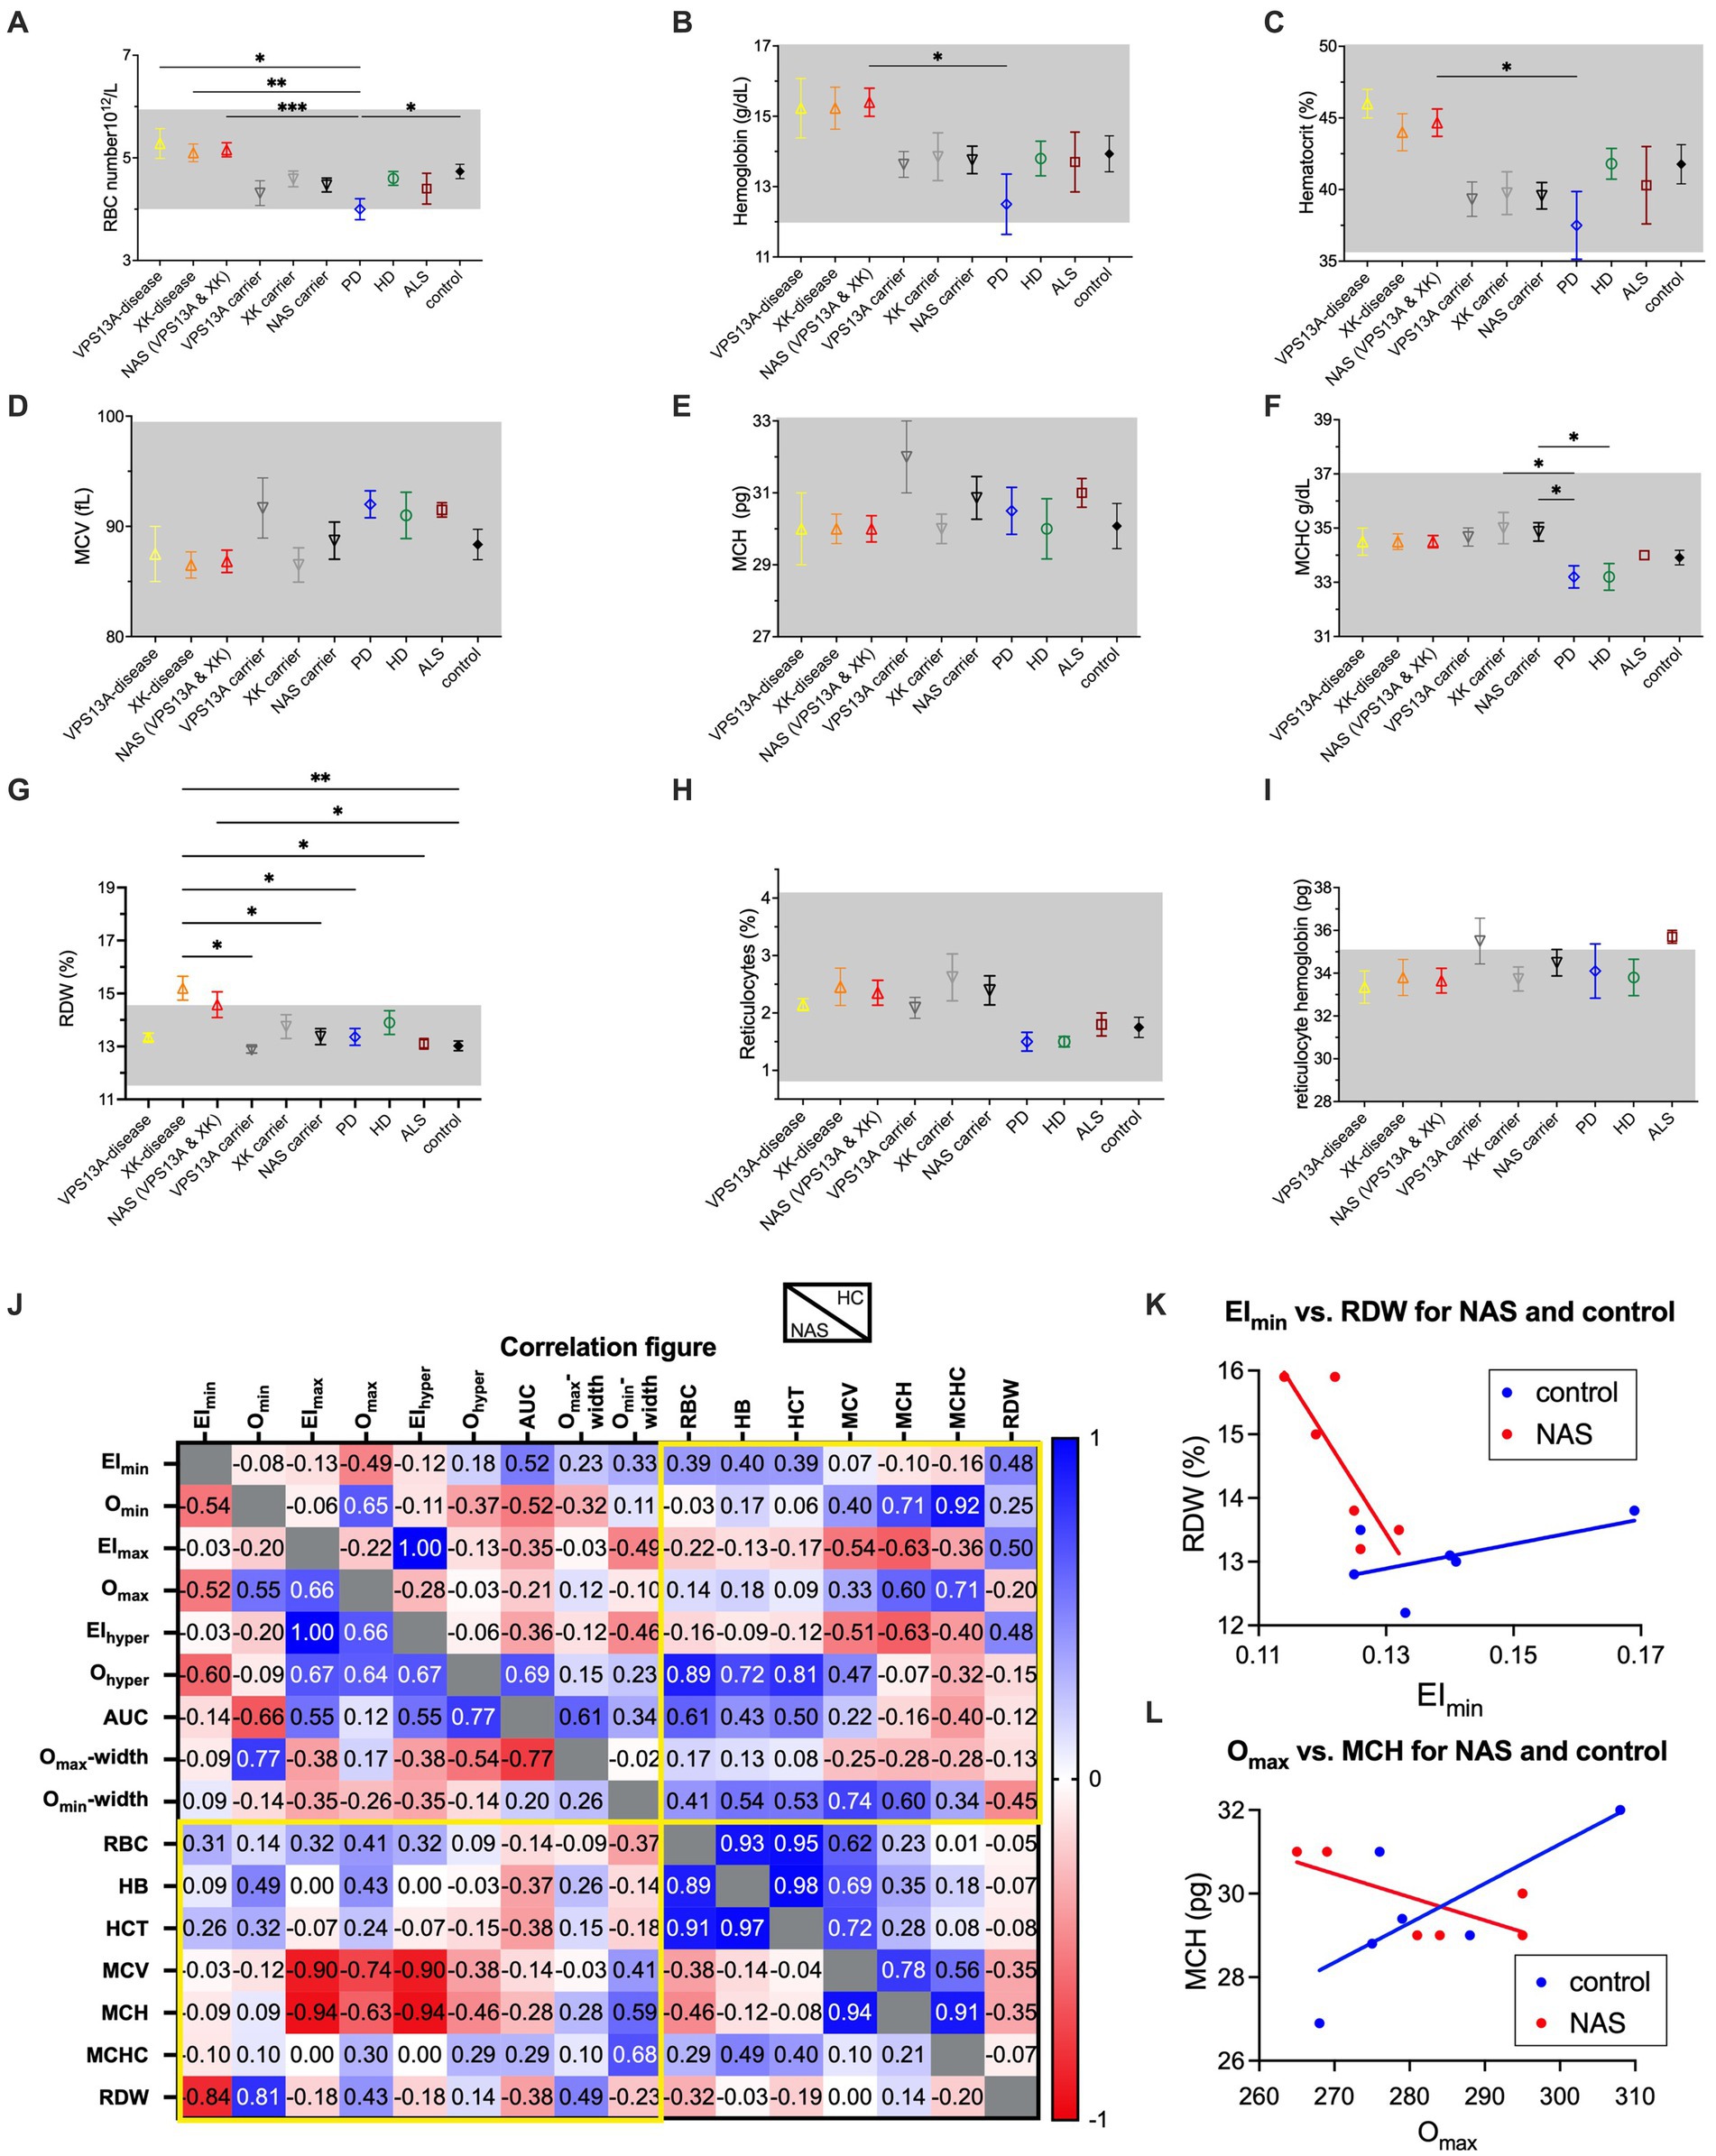
Figure 2. RBC indices of the different patient groups and mutation carriers and correlations with the ektacytometry parameters. Panels (A–I) present the RBC number per blood volume, the hemoglobin concentration of the blood, the hematocrit, the mean RBC volume (MCV), the mean RBC hemoglobin content, the mean RBC hemoglobin concentration, the RBC distribution width (RDW), the percentage of reticulocytes and the mean reticulocyte hemoglobin content, respectively. Data are based on 2 VPS13A disease patients, 4 XK disease patients, 3 VPS13A mutation carriers, 4 XK mutation carriers, 6 PD patients, 5 HD patients, 4 ALS patients and 9 controls. The NAS patients as well as the NAS mutation carriers are based on pooled respective subgroups (VPS13A and XK disease). Plotted are the mean values with the standard error of mean (SEM). Significance was checked with an Ordinary one-way ANOVA test, and 1–4 stars correspond to p-values lower than 0.05, 0.01, 0.001, and 0.0001, respectively. Panel (J) is a color-coded correlation matrix for healthy controls (HC) and pooled NAS patients of the values presented in Figures 1E–L and panels (A–G). Selected correlation blots for EImin vs. RDW and Omax vs. MCH are provided in panels K and L, respectively.
Only very few parameters showed significant differences between the compared groups. Most of them were related to particular low values of the PD patients (RBC number – Figure 2A, hemoglobin concentration – Figure 2B, hematocrit – Figure 2C and mean cellular hemoglobin concentration (MCHC) – Figure 2F). However, the above-mentioned increase of RDW in XK disease patients also showed significant differences in carriers as well as ALS patients (Figure 2G). However, since the patient groups were heterogenous and not very large, such differences were likely caused by age or comorbidities rather than by the disease itself. In addition, Supplementary Table S1 provides the blood count parameters with a p-value for the comparison with the healthy control group.
Furthermore, we tested for correlations among all measured parameters (Figure 2J) especially the putative correlation between Osmoscan parameters and RBC indices (yellow framed areas in Figure 2J) for healthy controls and NAS patients. The correlation plot of selected parameters, namely, EImin vs. RDW and Omax vs. MCH is provided in Figures 2K,L, respectively.
Deformability characteristics of RBCs have been widely used as biomarkers to determine membrane integrity and cellular viability, e.g., for disorders such as sickle cell disease (Mozar et al., 2016; Parrow et al., 2017; Connes et al., 2018; Gutierrez et al., 2021), diabetes (McMillan et al., 1978; Hanss et al., 1983; Williamson et al., 1985; Caimi and Presti, 2004) or COVID19 (Kubánková et al., 2021; Recktenwald et al., 2022b) but also in the context of RBC quality for transfusion purposes (Card et al., 1983; Barshtein et al., 2016, 2017; Lopes et al., 2023). Specifically, in NAS, membrane deformability changes have been explored along with their effect on microcirculation (Darras et al., 2021; Rabe et al., 2021; Reichel et al., 2022; Recktenwald et al., 2022a).
Although ektacytometry was already used to assess RBC deformability of NAS patients in the past (Bosman, 2018; Lazari et al., 2020), to the best of our knowledge, Osmoscans have not been explored for these neurological conditions yet. Here, we demonstrate the method’s applicability and utility for NAS by showing significant differences in several Osmoscan parameters. The best discrimination was found for Ohyper and Omax-width, which refers to the hydration status of the RBCs. Importantly NAS patients could be distinguished from both healthy control donors as well as other patients with neurodegenerative diseases (HD, PD and ALS).
As outlined in the Introduction, it would be extremely useful to have an easy method for an initial NAS screening. It would be even better to have markers for the monitoring of the disease state and its progression, and for monitoring the effect of therapeutic interventions. Here we discuss to which extent osmotic gradient ektacytometry may fulfil such requirements and how it compares to other RBC-based techniques.
This is to the best of our knowledge the first approach to investigate blood samples of NAS patients by Osmoscans. Therefore, it can only be seen as an initial approach for discriminating differences in the parameters Ohyper – Figure 1K and Omax-width – Figure 1L. Both Ohyper and Omax-width provided only one false positive value for controls (11%) and none in the other neurodegenerative diseases (differential diagnosis). Although these initial results are very promising, sample size was small, and further studies with more patients are required to substantiate these results and inform diagnostic guidelines.
Inspired by one of the reviewers, it is suggested that the osmoscan may help differentiate between NAS patients and patients with PIEZO1 mutations [hereditary xerocytosis (HX)]. While HX patients show a left shift of their osmoscan curve (Kaestner and Bianchi, 2020), the NAS curves differ from HX in the sense that in NAS the Omin of the osmoscan is increased, rather than typically decreased (in HX). This results in a narrower width, which is also reflected in the significant difference in the Omax-width parameter (Figure 1L).
Other RBC properties may be used diagnostically or as a biomarker to identify or follow NAS patients. These parameters are in particular the acanthocyte count, the erythrocyte sedimentation rate (ESR) and data derived from microfluidic approaches. Table 2 compares the different approaches including known conditions and properties of the particular techniques. The acanthocyte count is the oldest method that is purely based on the RBC shape, classifying a certain percentage of acanthocytes. This method, regardless of whether based on conventional dry blood smears or on optimized wet smears (Storch et al., 2005), proved to be challenging in practice. In patients, the number of acanthocytes can vary over time, including total absence (Malandrini et al., 1993; Sorrentino et al., 1999; Bayreuther et al., 2010). Furthermore, echinocytes can be mistaken for acanthocytes (Peikert et al., 2022b) and the method is prone to human bias (Darras et al., 2021). The situation slightly improves when 3D-imaging and shape classification based on machine learning is applied (Rabe et al., 2021; Simionato et al., 2021). Therefore the acanthocyte count as a biomarker for NAS patients can be seen as controversial.
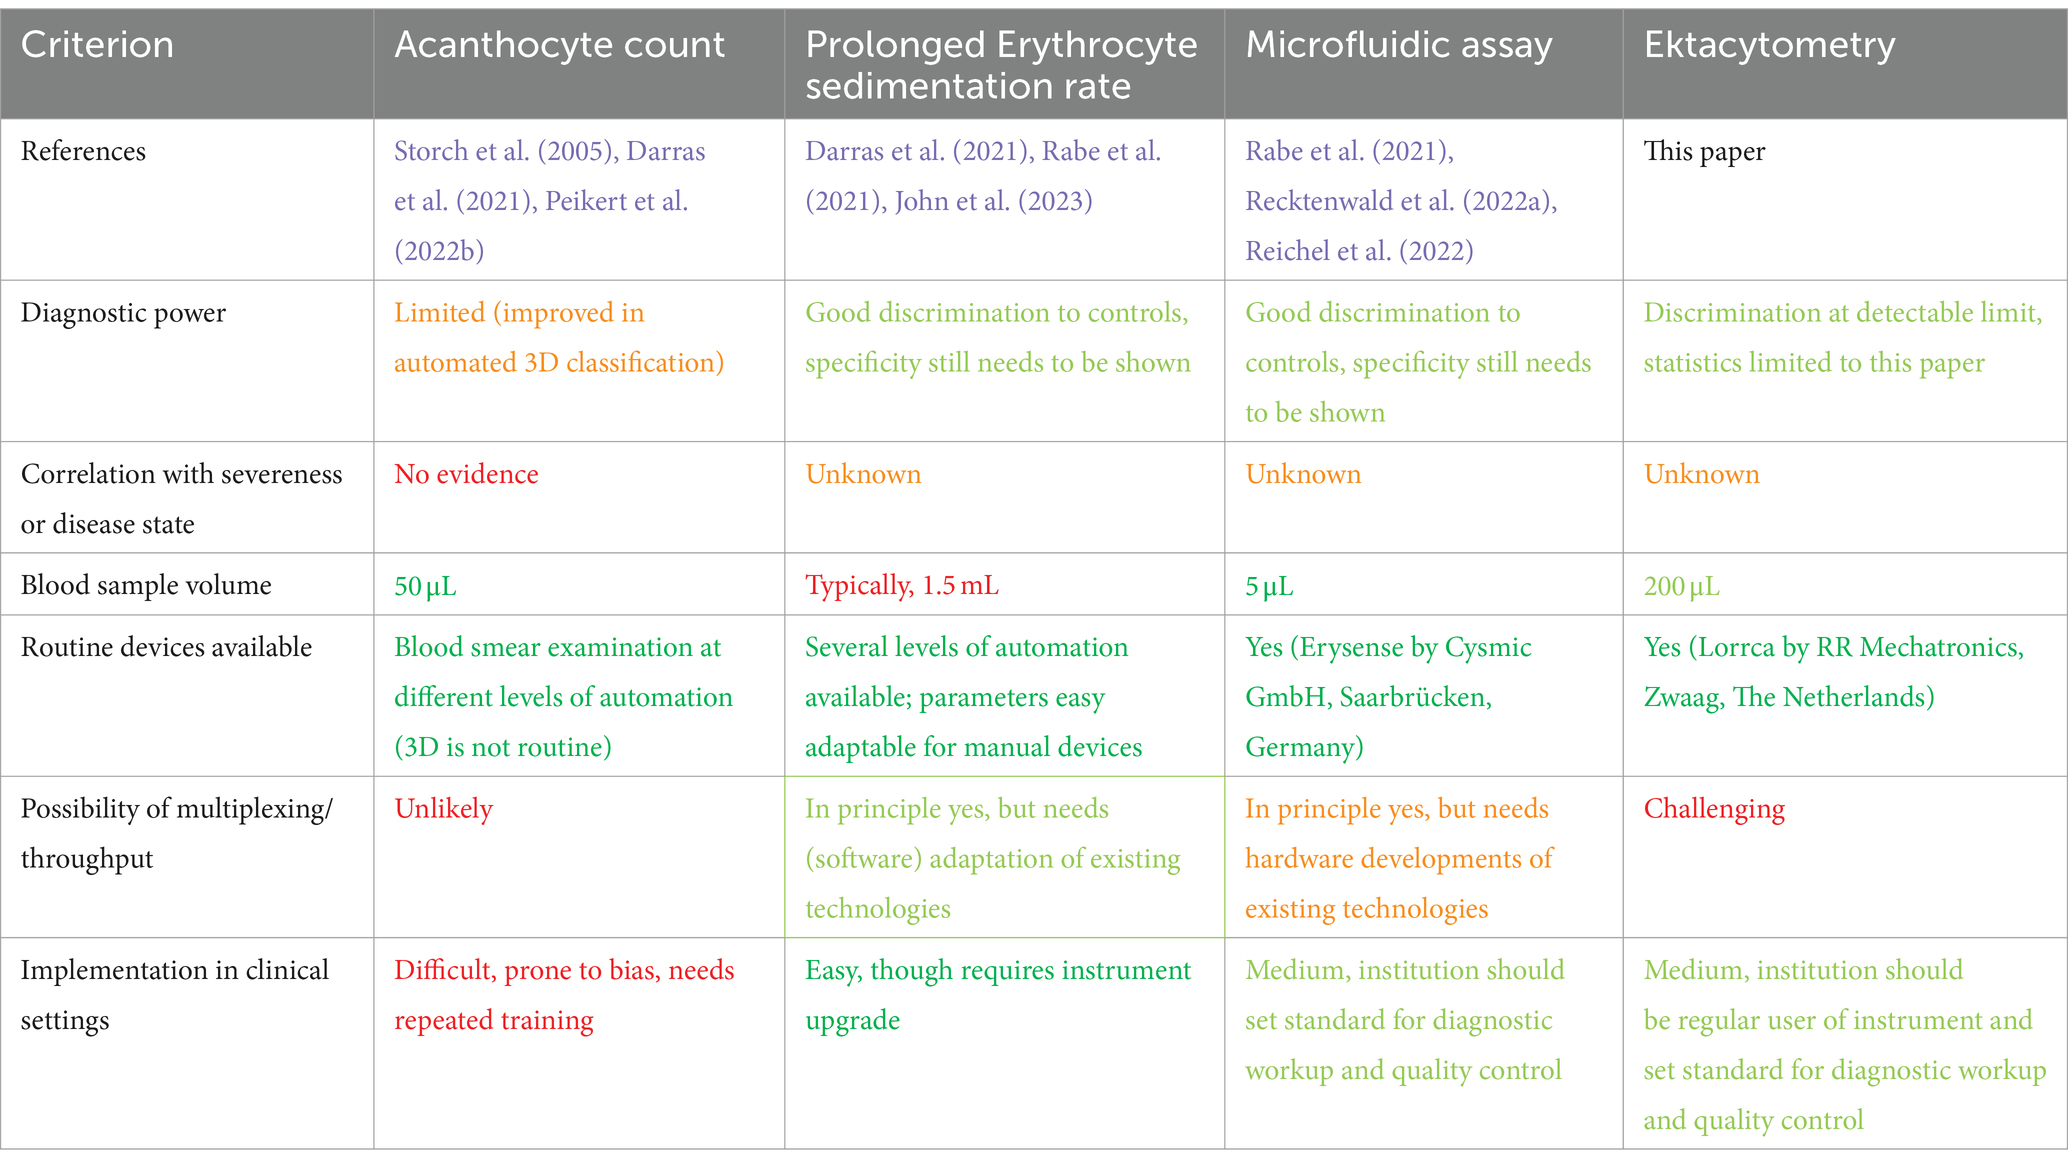
Table 2. Comparison of RBC-based diagnostic measures for NAS.
The other methods listed in Table 2 (ESR, microfluidics and ektacytometry) have in common a more integrated read-out, which not only considers RBC shape but their deformability. Furthermore, they are recent putative biomarkers for NAS (see first line in Table 2). In this respect all of them need further investigation, studies with larger sample sizes, and therefore we are unable to favor or even recommend one of these methods as a gold-standard. Nevertheless, for each of the methods we like to highlight one up-to-date unique property that is in support for the particular approach. A significant strength of the Westergren ESR is the broad availability of this established method, including automated devices for its quantification in central haematological laboratories. It requires only a different read-out mode (a longer time and preferentially the kinetics of the sedimentation (Darras et al., 2021, 2022; Dasanna et al., 2022). The big advantage of the microfluidic approach is the small sample volume, which would very well work with samples from finger needle prick not requiring venous blood sampling (Recktenwald et al., 2022a). In this report, we present a comparison with respect to other neurodegenerative diseases for Osmoscans (currently lacking for ESR and microfluidics).
All the three methods discussed (ESR, microfluidics, and Osmoscan), are based to a large extent on RBC deformability. Therefore, all of them may develop into a diagnostic marker/biomarker. However, different deployment scenarios, such as a diagnostic screen in a large population, the follow-up of particular patients or the comparison of patients, may all require special conditions (sample volume, sample numbers, time and expenses per test) and this may determine the method of choice.
The original contributions presented in the study are included in the article/Supplementary material, further inquiries can be directed to the corresponding author.
The studies involving humans were approved by the review boards of the ‘Ärztekammer des Saarlandes’, permission number 51/18, as well as of the University of Rostock (A 2019-0134). Part of the study was carried out under national (UK) research ethics committee approval 11/SC/0204 and institutional approval ERGO 41084. The studies were conducted in accordance with the local legislation and institutional requirements. The participants provided their written informed consent to participate in this study.
CH: Formal analysis, Visualization, Writing – original draft, Data curation, Investigation, Methodology. KP: Data curation, Investigation, Funding acquisition, Resources, Writing – review & editing. MQ: Data curation, Investigation, Writing – review & editing. AD: Data curation, Investigation, Writing – review & editing. JW: Writing – review & editing, Methodology. JB: Methodology, Writing – review & editing. ML: Resources, Writing – review & editing. IG: Resources, Writing – review & editing. CW: Writing – review & editing, Funding acquisition, Project administration, Supervision. MR: Writing – review & editing, Methodology. RW: Writing – review & editing, Resources. AH: Funding acquisition, Supervision, Writing – review & editing. EB: Supervision, Writing – review & editing, Methodology, Project administration. RW: Methodology, Project administration, Supervision, Writing – review & editing, Funding acquisition. LK: Funding acquisition, Project administration, Supervision, Writing – review & editing, Conceptualization, Formal analysis, Visualization, Writing – original draft.
The author(s) declare that financial support was received for the research, authorship, and/or publication of this article. This study was supported by the European Framework Horizon 2020 under grant agreement number 860436 (EVIDENCE) and European Framework Horizon Europe under grant agreement number 101120168 (INNOVATION). KP is supported by the Rostock Academy of Science (RAS) and Andreas Hermann by the "Hermann und Lilly Schilling-Stiftung für medizinische Forschung im Stifterverband.”
We are grateful to Glenn (†) and Ginger Irvine as the founders of the Advocacy for Neuroacanthocytosis Patients (www.naadvocacy.org) and to Susan Wagner and Joy Willard-Williford as representatives of the NA Advocacy USA (www.naadvocacyusa.org).
The authors declare that the research was conducted in the absence of any commercial or financial relationships that could be construed as a potential conflict of interest.
The author(s) declared that they were an editorial board member of Frontiers, at the time of submission. This had no impact on the peer review process and the final decision.
All claims expressed in this article are solely those of the authors and do not necessarily represent those of their affiliated organizations, or those of the publisher, the editors and the reviewers. Any product that may be evaluated in this article, or claim that may be made by its manufacturer, is not guaranteed or endorsed by the publisher.
The Supplementary material for this article can be found online at: https://www.frontiersin.org/articles/10.3389/fnins.2024.1406969/full#supplementary-material
Adjobo-Hermans, M. J. W., Cluitmans, J. C. A., and Bosman, G. J. C. G. M. (2015). Neuroacanthocytosis: observations, theories and perspectives on the origin and significance of Acanthocytes. Tremor Other Hyperkinet. Mov. 5:328. doi: 10.7916/d8vh5n2m
Barshtein, G., Goldschmidt, N., Pries, A. R., Zelig, O., Arbell, D., and Yedgar, S. (2017). Deformability of transfused red blood cells is a potent effector of transfusion-induced hemoglobin increment: A study with β-thalassemia major patients. Am. J. Hematol. 92, E559–E560. doi: 10.1002/ajh.24821
Barshtein, G., Pries, A. R., Goldschmidt, N., Zukerman, A., Orbach, A., Zelig, O., et al. (2016). Deformability of transfused red blood cells is a potent determinant of transfusion-induced change in recipient’s blood flow. Microcirculation 23, 479–486. doi: 10.1111/micc.12296
Bayreuther, C., Borg, M., Ferrero-Vacher, C., Chaussenot, A., and Lebrun, C. (2010). Choréo-acanthocytose sans acanthocytes. Rev. Neurol. 166, 100–103. doi: 10.1016/j.neurol.2009.03.005
Bianchi, P., Zaninoni, A., Fermo, E., Vercellati, C., Paola, M. A., Zanella, A., et al. (2015). Diagnostic power of laser assisted optical rotational cell analyzer (LoRRca MaxSis) evaluated in 118 patients affected by hereditary hemolytic anemias. Blood 126:942. doi: 10.1182/blood.v126.23.942.942
Bosman, G. J. C. G. M. (2018). Disturbed red blood cell structure and function: an exploration of the role of red blood cells in neurodegeneration. Front. Med. 5:146. doi: 10.3389/fmed.2018.00198
Caimi, G., and Presti, R. L. (2004). Techniques to evaluate erythrocyte deformability in diabetes mellitus. Acta Diabetol. 41, 99–103. doi: 10.1007/s00592-004-0151-1
Card, R. T., Mohandas, N., and Mollison, P. L. (1983). Relationship of post-transfusion viability to deformability of stored red cells. Br. J. Haematol. 53, 237–240. doi: 10.1111/j.1365-2141.1983.tb02016.x
Cluitmans, J. C. A., Tomelleri, C., Yapici, Z., Dinkla, S., Bovee-Geurts, P., Chokkalingam, V., et al. (2015). Abnormal red cell structure and function in neuroacanthocytosis. PLoS One 10:e0125580. doi: 10.1371/journal.pone.0125580
Connes, P., Renoux, C., Romana, M., Abkarian, M., Joly, P., Martin, C., et al. (2018). Blood rheological abnormalities in sickle cell anemia. Clin. Hemorheol. Microcirc. 68, 165–172. doi: 10.3233/ch-189005
Costa, L. D., Suner, L., Galimand, J., Bonnel, A., Pascreau, T., Couque, N., et al. (2016). Diagnostic tool for red blood cell membrane disorders: assessment of a new generation ektacytometer. Blood cells Mol. Dis. 56, 9–22. doi: 10.1016/j.bcmd.2015.09.001
Danek, A., Rubio, J. P., Rampoldi, L., Ho, M., Dobson-Stone, C., Tison, F., et al. (2001). McLeod neuroacanthocytosis: genotype and phenotype. Ann. Neurol. 50, 755–764. doi: 10.1002/ana.10035
Darras, A., Dasanna, A. K., John, T., Gompper, G., Kaestner, L., Fedosov, D. A., et al. (2022). Erythrocyte sedimentation: collapse of a high-volume-fraction soft-particle gel. Phys. Rev. Lett. 128:088101. doi: 10.1103/physrevlett.128.088101
Darras, A., Peikert, K., Rabe, A., Yaya, F., Simionato, G., John, T., et al. (2021). Acanthocyte sedimentation rate as a diagnostic biomarker for neuroacanthocytosis syndromes: experimental evidence and physical justification. Cells 10:788. doi: 10.3390/cells10040788
Dasanna, A. K., Darras, A., John, T., Gompper, G., Kaestner, L., Wagner, C., et al. (2022). Erythrocyte sedimentation: effect of aggregation energy on gel structure during collapse. Phys. Rev. E 105:024610. doi: 10.1103/physreve.105.024610
Flormann, D., Qiao, M., Murciano, N., Iacono, G., Darras, A., Hof, S., et al. (2022). Transient receptor potential channel vanilloid type 2 in red cells of cannabis consumer. Am. J. Hematol. 97, E180–E183. doi: 10.1002/ajh.26509
Franceschi, L. D., Bosman, G. J. C. G. M., and Mohandas, N. (2014). Abnormal red cell features associated with hereditary neurodegenerative disorders: the neuroacanthocytosis syndromes. Curr. Opin. Hematol. 21, 201–209. doi: 10.1097/moh.0000000000000035
Guillén-Samander, A., Wu, Y., Pineda, S. S., García, F. J., Eisen, J. N., Leonzino, M., et al. (2022). A partnership between the lipid scramblase XK and the lipid transfer protein VPS13A at the plasma membrane. Proc. Natl. Acad. Sci. 119:e2205425119. doi: 10.1073/pnas.2205425119
Gutierrez, M., Shamoun, M., Seu, K. G., Tanski, T., Kalfa, T. A., and Eniola-Adefeso, O. (2021). Characterizing bulk rigidity of rigid red blood cell populations in sickle-cell disease patients. Sci. Rep. 11:7909. doi: 10.1038/s41598-021-86582-8
Hanss, M., Attali, J. R., Helou, C., and Lemarie, J. C. (1983). Erythrocytes deformability and diabetes. Clin. Hemorheol. Microcirc. 3, 383–391. doi: 10.3233/ch-1983-3404
John, T., Kaestner, L., Wagner, C., and Darras, A. (2023). Early stage of erythrocyte sedimentation rate test: fracture of a high-volume-fraction gel. PNAS Nexus 3:pgad416. doi: 10.1093/pnasnexus/pgad416
Kaestner, L. (2023). Proceedings of the eleventh international meeting on neuroacanthocytosis syndromes. Tremor Other Hyperkinet. Mov. 13:41. doi: 10.5334/tohm.826
Kaestner, L., and Bianchi, P. (2020). Trends in the development of diagnostic tools for red blood cell-related diseases and anemias. Front. Physiol. 11:387. doi: 10.3389/fphys.2020.00387
Kubánková, M., Hohberger, B., Hoffmanns, J., Fürst, J., Herrmann, M., Guck, J., et al. (2021). Physical phenotype of blood cells is altered in COVID-19. Biophys. J. 120, 2838–2847. doi: 10.1016/j.bpj.2021.05.025
Lazari, D., Leal, J. K. F., Brock, R., and Bosman, G. (2020). The relationship between aggregation and deformability of red blood cells in health and disease. Front. Physiol. 11:288. doi: 10.3389/fphys.2020.00288
Lazarova, E., Gulbis, B., Van Oirschot, B., and Van Wijk, R. (2017). Next-generation osmotic gradient ektacytometry for the diagnosis of hereditary spherocytosis: interlaboratory method validation and experience. Clin. Chem. Lab. Med. 55, 394–402. doi: 10.1515/cclm-2016-0290
Lopes, M. G. M., Recktenwald, S. M., Simionato, G., Eichler, H., Wagner, C., Quint, S., et al. (2023). Big data in transfusion medicine and artificial intelligence analysis for red blood cell quality control. Transfus. Med. Hemother. 50, 163–173. doi: 10.1159/000530458
Lupo, F., Tibaldi, E., Matte, A., Sharma, A. K., Brunati, A. M., Alper, S. L., et al. (2016). A new molecular link between defective autophagy and erythroid abnormalities in chorea-acanthocytosis. Blood 128, 2976–2987. doi: 10.1182/blood-2016-07-727321
Malandrini, A., Fabrizi, G. M., Palmeri, S., Ciacci, G., Salvadori, C., Berti, G., et al. (1993). Choreo-acanthocytosis like phenotype without acanthocytes: clinicopathological case report. Acta Neuropathol. 86, 651–658. doi: 10.1007/bf00294306
McMillan, D. E., Utterback, N. G., and Puma, J. L. (1978). Reduced erythrocyte deformability in diabetes. Diabetes 27, 895–901. doi: 10.2337/diab.27.9.895
Mozar, A., Connes, P., Collins, B., Hardy-Dessources, M.-D., Romana, M., Lemonne, N., et al. (2016). Red blood cell nitric oxide synthase modulates red blood cell deformability in sickle cell anemia. Clin. Hemorheol. Microcirc. 64, 47–53. doi: 10.3233/ch-162042
Park, J.-S., Hu, Y., Hollingsworth, N. M., Miltenberger-Miltenyi, G., and Neiman, A. M. (2022). Interaction between VPS13A and the XK scramblase is important for VPS13A function in humans. J. Cell Sci. 135:jcs260227. doi: 10.1242/jcs.260227
Park, J.-S., and Neiman, A. M. (2020). XK is a partner for VPS13A: a molecular link between chorea-Acanthocytosis and McLeod syndrome. Mol. Biol. Cell 31, 2425–2436. doi: 10.1091/mbc.e19-08-0439-t
Parrow, N. L., Tu, H., Nichols, J., Violet, P.-C., Pittman, C. A., Fitzhugh, C., et al. (2017). Measurements of red cell deformability and hydration reflect HbF and HbA2 in blood from patients with sickle cell anemia. Blood Cells Mol. Dis. 65, 41–50. doi: 10.1016/j.bcmd.2017.04.005
Peikert, K., Hermann, A., and Danek, A. (2022a). XK-associated McLeod syndrome: nonhematological manifestations and relation to VPS13A disease. Transfus. Med. Hemother. 49, 4–12. doi: 10.1159/000521417
Peikert, K., Storch, A., Hermann, A., Landwehrmeyer, G. B., Walker, R. H., Simionato, G., et al. (2022b). Commentary: acanthocytes identified in Huntington’s disease. Front. Neurosci. 16:1049676. doi: 10.3389/fnins.2022.1049676
Rabe, A., Kihm, A., Darras, A., Peikert, K., Simionato, G., Dasanna, A. K., et al. (2021). The erythrocyte sedimentation rate and its relation to cell shape and rigidity of red blood cells from chorea-acanthocytosis patients in an off-label treatment with Dasatinib. Biomol. Ther. 11:727. doi: 10.3390/biom11050727
Rampoldi, L., Danek, A., and Monaco, A. P. (2002). Clinical features and molecular bases of neuroacanthocytosis. J. Mol. Med. 80, 475–491. doi: 10.1007/s00109-002-0349-z
Recktenwald, S. M., Lopes, M. G. M., Peter, S., Hof, S., Simionato, G., Peikert, K., et al. (2022a). Erysense, a lab-on-a-Chip-based point-of-care device to evaluate red blood cell flow properties with multiple clinical applications. Front. Physiol. 13:884690. doi: 10.3389/fphys.2022.884690
Recktenwald, S. M., Simionato, G., Lopes, M. G., Gamboni, F., Dzieciatkowska, M., Meybohm, P., et al. (2022b). Cross-talk between red blood cells and plasma influences blood flow and omics phenotypes in severe COVID-19. eLife 11:e81316. doi: 10.7554/elife.81316
Reichel, F., Kräter, M., Peikert, K., Glaß, H., Rosendahl, P., Herbig, M., et al. (2022). Changes in blood cell deformability in chorea-Acanthocytosis and effects of treatment with Dasatinib or Lithium. Front. Physiol. 13:852946. doi: 10.3389/fphys.2022.852946
Ryoden, Y., Segawa, K., and Nagata, S. (2022). Requirement of Xk and Vps13a for the P2X7-mediated phospholipid scrambling and cell lysis in mouse T cells. Proc. Natl. Acad. Sci. 119:e2119286119. doi: 10.1073/pnas.2119286119
Siegl, C., Hamminger, P., Jank, H., Ahting, U., Bader, B., Danek, A., et al. (2013). Alterations of red cell membrane properties in nneuroacanthocytosis. PLoS One 8:e76715. doi: 10.1371/journal.pone.0076715
Simionato, G., Hinkelmann, K., Chachanidze, R., Bianchi, P., and Fermo, E., Wijk, R. van van Wijk, R., Leonetti, M., Wagner, C., Kaestner, L., and Quint, S. (2021). Red blood cell phenotyping from 3D confocal images using artificial neural networks. PLoS Comput. Biol. 17,:e1008934. doi: 10.1371/journal.pcbi.1008934
Sorrentino, G., Renzo, A. D., Miniello, S., Nori, O., and Bonavita, V. (1999). Late appearance of acanthocytes during the course of chorea-acanthocytosis. J. Neurol. Sci. 163, 175–178. doi: 10.1016/s0022-510x(99)00005-2
Storch, A., Kornhass, M., and Schwarz, J. (2005). Testing for acanthocytosis. J. Neurol. 252, 84–90. doi: 10.1007/s00415-005-0616-3
Ueno, S., Maruki, Y., Nakamura, M., Tomemori, Y., Kamae, K., Tanabe, H., et al. (2001). The gene encoding a newly discovered protein, chorein, is mutated in chorea-acanthocytosis. Nat. Genet. 28, 121–122. doi: 10.1038/88825
Walker, R. H., and Danek, A. (2021). “Neuroacanthocytosis” – overdue for a taxonomic update. Tremor Other Hyperkinet. Mov. 11:1. doi: 10.5334/tohm.583
Walker, R. H., Peikert, K., Jung, H. H., Hermann, A., and Danek, A. (2023). Neuroacanthocytosis syndromes: the clinical perspective. Contact 6:25152564231210340. doi: 10.1177/25152564231210339
Wilde, J. R. A. D., Boesveld, M. E., Vuren, A. J. Van, and Solinge, W. W. Vn, Beers, E. J. V., Bartels, M., et al. (2023). Novel biomarkers for assessing clinical severity in hereditary spherocytosis - application of routine and advanced diagnostic tests. Blood 142,:2453. doi: 10.1182/blood-2023-189034
Williamson, J. R., Gardner, R. A., Boylan, C. W., Carroll, G. L., Chang, K., Marvel, J. S., et al. (1985). Microrheologic investigation of erythrocyte deformability in diabetes mellitus. Blood 65, 283–288. doi: 10.1182/blood.v65.2.283.283
Zaninoni, A., Fermo, E., Vercellati, C., Consonni, D., Marcello, A. P., Zanella, A., et al. (2018). Use of laser assisted optical rotational cell analyzer (LoRRca MaxSis) in the diagnosis of RBC membrane disorders, enzyme defects, and congenital Dyserythropoietic anemias: a monocentric study on 202 patients. Front. Physiol. 9:451. doi: 10.3389/fphys.2018.00451
Keywords: VPS13A disease, XK disease, neurodegeneration, RBC deformability, ektacytometry, Osmoscan, acanthocytes
Citation: Hernández CA, Peikert K, Qiao M, Darras A, de Wilde JRA, Bos J, Leibowitz M, Galea I, Wagner C, Rab MAE, Walker RH, Hermann A, van Beers EJ, van Wijk R and Kaestner L (2024) Osmotic gradient ektacytometry – a novel diagnostic approach for neuroacanthocytosis syndromes. Front. Neurosci. 18:1406969. doi: 10.3389/fnins.2024.1406969
Edited by:
Kevin J. O'Donovan, United States Military Academy, United StatesReviewed by:
Joan-lluis Vives-Corrons, Josep Carreras Leukaemia Research Institute (IJC), SpainCopyright © 2024 Hernández, Peikert, Qiao, Darras, de Wilde, Bos, Leibowitz, Galea, Wagner, Rab, Walker, Hermann, van Beers, van Wijk and Kaestner. This is an open-access article distributed under the terms of the Creative Commons Attribution License (CC BY). The use, distribution or reproduction in other forums is permitted, provided the original author(s) and the copyright owner(s) are credited and that the original publication in this journal is cited, in accordance with accepted academic practice. No use, distribution or reproduction is permitted which does not comply with these terms.
*Correspondence: Lars Kaestner, bGFyc19rYWVzdG5lckBtZS5jb20=
Disclaimer: All claims expressed in this article are solely those of the authors and do not necessarily represent those of their affiliated organizations, or those of the publisher, the editors and the reviewers. Any product that may be evaluated in this article or claim that may be made by its manufacturer is not guaranteed or endorsed by the publisher.
Research integrity at Frontiers
Learn more about the work of our research integrity team to safeguard the quality of each article we publish.