 Sanna Persson
 Rodrigo Moreno
95% of researchers rate our articles as excellent or good
Learn more about the work of our research integrity team to safeguard the quality of each article we publish.
Find out more
ORIGINAL RESEARCH article
Front. Neurosci. , 23 July 2024
Sec. Brain Imaging Methods
Volume 18 - 2024 | https://doi.org/10.3389/fnins.2024.1403804
This article is part of the Research Topic Methods and Applications of Diffusion MRI Tractometry View all 14 articles
Introduction: In tractography, redundancy poses a significant challenge, often resulting in tractograms that include anatomically implausible streamlines or those that fail to represent the brain's white matter architecture accurately. Current filtering methods aim to refine tractograms by addressing these issues, but they lack a unified measure of redundancy and can be computationally demanding.
Methods: We propose a novel framework to quantify tractogram redundancy based on filtering tractogram subsets without endorsing a specific filtering algorithm. Our approach defines redundancy based on the anatomical plausibility and diffusion signal representation of streamlines, establishing both lower and upper bounds for the number of false-positive streamlines and the tractogram redundancy.
Results: We applied this framework to tractograms from the Human Connectome Project, using geometrical plausibility and statistical methods informed by the streamlined attributes and ensemble consensus. Our results establish bounds for the tractogram redundancy and the false-discovery rate of the tractograms.
Conclusion: This study advances the understanding of tractogram redundancy and supports the refinement of tractography methods. Future research will focus on further validating the proposed framework and exploring tractogram compression possibilities.
Diffusion-weighted magnetic resonance imaging (DW-MRI) has emerged as a revolutionary tool for non-invasively probing the complex architecture of white matter tracts in the living brain. The technique captures the diffusion of water molecules, which preferentially occurs along the length of axonal fibers, thereby providing insights into the orientation and integrity of neural pathways. Tractography algorithms leverage this information to reconstruct the three-dimensional trajectories of white matter tracts, known as streamlines, resulting in a tractogram which is a comprehensive map of neural connections within the brain (De Benedictis et al., 2016; Hau et al., 2017; Maffei et al., 2018; Jeurissen et al., 2019; Henderson et al., 2020). Applications range from connectivity network studies (Yeh et al., 2021; Zhang et al., 2022), segmentation (Wasserthal et al., 2018; Rheault et al., 2020, 2022; Warrington et al., 2020; Bertò et al., 2021; Maffei et al., 2021; Schilling et al., 2021; Siegbahn et al., 2022), to the identification of neural pathways for surgery planning (Henderson et al., 2020; Yang et al., 2021).
Many tractography algorithms have been proposed in the last two decades using diverse methodologies (Mori et al., 1999; Basser et al., 2000; Smith et al., 2012; Christiaens et al., 2015; Neher et al., 2017; Poulin et al., 2017, 2019; Konopleva et al., 2018; Jeurissen et al., 2019; Théberge et al., 2021; Sinzinger and Moreno, 2022; Legarreta et al., 2023). This large number of available methods has made it difficult for end users to choose the most appropriate tractography algorithm for their applications. Furthermore, there is little consensus on which parameters to use, such as the most appropriate number of streamlines. In order to address this issue, one of the goals of the International Society for Magnetic Resonance in Medicine (ISMRM) 2015 Tractography Challenge (Maier-Hein et al., 2017) was to help end users by quantitatively assessing the performance of tractography pipelines in a realistic phantom. This challenge used the Tractometer (Côté et al., 2013) for this aim. The Tractometer uses regions of interest (ROIs) to define six different measurements. While using ROIs gives insights into the quality of the tractogram, such a methodology is unable to assess the quality of individual streamlines. For example, anatomically implausible streamlines that do not go outside of a bundle segmentation mask connecting two brain regions will not penalize Tractometer measurements. This restriction can potentially affect connectivity and tractometry analyses (Chandio et al., 2020). Thus, there is currently an unmet need to create new measurements that can address the limitations of the Tractometer. This study contributes to this goal by leveraging tractogram filtering methods.
Despite its widespread application in neuroscience research and clinical settings, tractography faces significant challenges (Daducci et al., 2016; Maier-Hein et al., 2017; Schilling et al., 2019). One of the most critical issues is the presence of false-positive streamlines within tractograms (Daducci et al., 2016; Jörgens et al., 2021). False-positive streamlines manifest as either anatomically implausible streamlines that do not correspond to true neural pathways or as overlapping with other streamlines (duplicates) that result in redundancy in the representation of the diffusion signal. We refer to the duplicated streamlines as redundant. These erroneous streamlines can obscure the true structural connectivity, leading to misinterpretations in both research and clinical applications (Garyfallidis et al., 2012; Durantel et al., 2022).
This study aims to create a statistical framework to estimate the lower and upper bounds of tractogram redundancy from per-streamline estimates obtained with tractogram filtering. These estimates can potentially be used to rank tractography pipelines by their inefficiency, with the ambition of fostering research for improved tractography methods. Although the proposed framework is generic, we use three specific tractogram filtering methods: ExTractor (Petit et al., 2023), randomized spherical-deconvolution-informed filtering of tractograms (rSIFT) (Hain et al., 2023), and randomized convex optimization modeling for microstructure informed tractography (rCOMMIT) (Wan, 2023).1
A false-positive streamline in a tractogram does not contribute to, or may even detract from, the accurate representation of the brain's white matter architecture as inferred from diffusion MRI data. False positives can manifest either through streamlines that do not correspond to anatomically plausible structures or redundant streamlines that do not enhance the fidelity of the tractogram to the diffusion signal (duplicates), thereby failing to improve or clarify the depiction of the brain's structural connectivity. The fraction of duplicated streamlines is also referred to as the redundancy in the tractogram and constitutes an important distinction from the total number of false-positive streamlines. An anatomically implausible streamline would not be seen in a brain and is likely the result of an error produced during tractography. The identification and removal of these streamlines aim to refine the tractogram, ensuring that it more faithfully reflects the underlying neural pathways and microstructural characteristics.
Tractography filtering is the process of refining a tractogram by identifying and removing streamlines that are considered false positives. This process is essential to enhance the quality and usability of tractograms for both research and clinical applications. Filtering methods vary in their approach, with some focusing on the anatomical plausibility of streamlines, while others aim to ensure that the streamline distribution corresponds to the underlying diffusion signal (Jörgens et al., 2021).
The concept of tractography filtering is rooted in the understanding that not all streamlines in a tractogram contribute equally to the representation of the white matter structure. Some streamlines may be artifacts of the tractography process, while others may represent genuine neural pathways but are overrepresented due to biases in the algorithm. Filtering methods aim to identify these discrepancies and adjust the tractogram accordingly to produce a more accurate and reliable representation of the brain's white matter. Specifically, in this study, we used three different tractogram filtering methods: ExTractor, rSIFT, and rCOMMIT.
ExTractor (Petit et al., 2023) is a rule-based automatic pipeline designed to enhance the anatomical plausibility of tractograms by filtering streamlines inconsistent with known neuroanatomical principles. ExTractor operates on the premise that every cortical area is interconnected with other cortical and subcortical regions via association, commissural, and projection fibers, which adhere to a certain anatomical organization. The method is grounded in the neuroanatomical categorization established by previous research (Meynert, 1885; Ludwig and Klingler, 1956; Crosby, 1963; Schmahmann and Pandya, 2006; Nieuwenhuys et al., 2008).
In the process of automatic filtering, ExTractorFlow (Cousineau et al., 2017; Di Tommaso et al., 2017; Kurtzer et al., 2017), an implementation of the ExTractor method, employs anatomical rules derived from the structural organization of white matter fibers. The filtering method uses ROIs from established brain templates (Oishi et al., 2009) to enforce sequential filtering conditions that discard streamlines unlikely to represent true anatomical pathways. For instance, streamlines are considered implausible if they are shorter than a specified length, make excessive loops, terminate along ventricular surfaces, or end within deep white matter structures inconsistent with expected tract trajectories.
SIFT (Smith et al., 2013) refines tractograms by selectively discarding streamlines that poorly fit the fiber orientation distributions (FODs) derived from constrained spherical deconvolution (Tournier et al., 2007). It operates under the premise that the streamline density within a voxel should be proportional to the FOD amplitude, which reflects the volume of white matter fibers in that orientation. Streamlines are assessed based on their contribution to the FODs, and those that over-represent or under-represent the FOD-derived fiber volume are filtered out. This targeted removal reduces reconstruction biases, such as overemphasis on longer pathways or straighter courses in branching tracts, leading to tractograms that more plausibly represent the structural connectivity. SIFT works independently of the tractography method.
In SIFT, each streamline is evaluated for its alignment with the FODs, which provide a probabilistic estimate of the direction and density of fibers within each voxel. SIFT employs a cost function that quantifies the discrepancy between the streamline density and the FOD amplitude across the tractogram. Streamlines contributing to an excess of density in comparison to the FODs are deemed false-positive and are preferentially removed, while those in deficit areas are retained, ensuring a balance that mirrors the estimated fiber volumes. SIFT does not distinguish between redundant streamlines and anatomically implausible ones.
The filtering process is iterative, with a gradient descent approach guiding the selection of streamlines for removal. The algorithm calculates a proportionality coefficient, which scales the streamline density to the FOD amplitude, and it adjusts this coefficient dynamically as streamlines are removed. This ensures that the remaining streamline distribution continues to provide the best possible fit to the FODs throughout the filtering process.
COMMIT (Daducci et al., 2015) is a filtering algorithm that refines tractograms by leveraging a convex optimization framework to incorporate microstructural tissue properties, discerning between anatomically plausible tracts and artifacts. It adjusts the weight of each candidate fiber derived from standard tractography to best fit the diffusion signal to ensure the quantitative integrity of the tractogram. COMMIT models the diffusion signal within each voxel as a linear combination of the diffusion responses from these tracts. The method applies convex optimization to solve for the global weights of these tracts, effectively pruning the tractogram by removing or down-weighting contributions that do not align with the observed diffusion signal. This results in a filtered tractogram that more accurately reflects the underlying structural connectivity with reduced redundancy and improved anatomical plausibility.
One issue with both SIFT and COMMIT is that they cannot be used for estimating the anatomical plausibility of individual streamlines. Indeed, the very same streamline can be accepted or rejected depending on the composition of the tractogram. This is because both methods aim to reject both anatomically implausible and redundant streamlines. Thus, an anatomically plausible streamline can be rejected if it is deemed a duplicate. This issue has been addressed by randomized SIFT (rSIFT) and COMMIT (rCOMMIT). rSIFT (Hain et al., 2023) introduces a sampling method offering a statistical framework for the evaluation of each streamline's inherent importance to the tractogram. By employing random sub-sampling, rSIFT iteratively applies the SIFT algorithm across numerous tractogram subsets, effectively creating a distribution of filtering outcomes for each streamline. This process enables the quantification of streamline acceptance rates, which serve as a probabilistic measure of the streamline's fidelity to the underlying diffusion signal.
rSIFT uses the collective behavior of streamlined subsets to infer the likelihood of anatomical plausibility. The method uses the variability introduced by the randomization process to discern between duplicates and outliers that are inconsistent with the diffusion data. This distinction is critical, as it addresses the intrinsic limitations of global optimization strategies in conventional SIFT, which may penalize both types of streamlines. rCOMMIT (Wan, 2023) (see text footnote 1) uses the same sampling and voting method as rSIFT but implements COMMIT as the filtering method of the tractograms. That is, each subset is filtered by weights that are larger than zero.
The unavoidable result of both randomized algorithms is that the aggregation over many tractogram subsets is prohibitively computationally expensive. Efforts have been made to imitate the filtering algorithm with deep learning using streamline-by-streamline classification. The current accuracy of those methods is in the range of 80%. In order to obtain an accurate measurement of redundancy, we used the standard rSIFT and rCOMMIT in the experiments.
In Section 2.1, we propose a definition of redundancy that distinguishes between the total number of false-positive streamlines and the number of duplicates. We now attempt to formalize this notion of redundancy further in a tractogram. Assume there is a tractogram T*, which is the optimal representation of the underlying structural connectivity. In line with previous research, we assume for the sake of simplicity that the unfiltered tractogram T is redundant, i.e., T*⊆T. In particular, we assume that
where |D| and |I| are the number of redundant (duplicated) and anatomically implausible streamlines, respectively. We aim to propose a framework for bounding the fraction of false-positive and redundant streamlines in tractograms:
where l and u are the lower and upper bounds of the fraction of false-positive streamlines, given by
The fraction of false-positive streamlines can also be referred to as the false discovery rate (FDR), which is the fraction of streamlines in the tractogram that are falsely discovered
It should be noted that, depending on the application, one of the bounds is more relevant. For example, duplicates are not an issue for bundle segmentation. Thus, l can be used as a measure of the FDR. In turn, structural connectivity analyses and bundle-wise tractometry can be affected by redundancy, so u can be used instead. That is, we bound the redundancy R as 0 ≤ R ≤ u−l.
As described in Jörgens et al. (2023), some tractogram filtering methods restrictively filter only the anatomically implausible streamlines, while others filter both implausible and redundant ones. The former can be used to estimate the lower bound l, while the latter is useful for u. In our case, ExTractor is appropriate for l and rSIFT and rCOMMIT for u, as described in the following subsections. Both rSIFT and rCOMMIT use streamline attributes and the consensus of filtering different subsets to assess streamline plausibility.
The lower bound of the FDR requires a filtering method focused on the anatomical plausibility of streamlines. It should be noted that the definition of anatomical plausibility is not unambiguous, therefore we consider the notion of geometrical plausibility as a surrogate that allows us to quantify the lower bound l. ExTractor is a method that can be used for this aim since it does not discard redundant streamlines, which is necessary to estimate the lower bound. In particular, we estimated the FDR lower bound as the percentage of rejected streamlines with ExTractor.
It is important to note that, unlike SIFT and COMMIT, the filtering decision of ExTractor on every streamline does not depend on the composition of the tractogram. The main implication of this is that ExTractor will not benefit from randomized approaches to estimate acceptance rates, as is the case with SIFT and COMMIT. Thus, ExTractor is applied only once per tractogram.
SIFT and COMMIT, and consequently, rSIFT and rCOMMIT, target both anatomically implausible and redundant streamlines. Thus, combinations of rSIFT and rCOMMIT are good candidates for estimating the upper bound of the streamline FDR. We estimated the upper bound using two methodologies, as described below.
In the methods of rSIFT and rCOMMIT, tractogram filtering is repeated over randomized samples from the original tractogram without replacement. This property allows us to compute a probabilistic bound for the deviation of the average FDR from the expected value.
Assume that the tractogram filtering method has been applied to m subsets. Let Xi be the random variable representing the number of false-positive streamlines in the i-th subset, Ai of size ni. Since each streamline in a subset can either be classified as false-positive or not, we have that Xi is bounded. Specifically, 0 ≤ Xi ≤ ni, where ni is the total number of streamlines in subset Ai.
Let Sm = X1 + ⋯ + Xm be the total number of false-positive streamlines across all subsets. The expected value of Sm is given by
Applying Hoeffding (1963)'s theorem to the sum Sm, we can bound the probability that the observed total number of false-positive streamlines deviates from its expected value by at least a certain amount t > 0. Specifically, for all t > 0,
where p = 0.05 provides a t that gives a 95% confidence interval around Sm, that is given by
This inequality provides a probabilistic upper bound on the deviation of the observed number of false-positives from the expected value given by Sm+t. For ease of interpretation, we present this bound normalized as
If the subsets are of equal size, i.e., ni = n for all i, then the bound simplifies to
This setting is useful for estimating upper bounds for specific sampling sizes, as done in rSIFT and rCOMMIT.
By choosing an appropriate value of t, we can make statements about the confidence with which the observed FDR does not exceed the expected streamlined FDR by more than the specified amount. For example, setting t = ϵmn, where ϵ represents the acceptable deviation from the expected proportion of falsely discovered streamlines on a per-streamline basis, we obtain
where r is the expected FDR in a subset. This result can be used to determine the number of subsets m necessary to achieve the desired confidence level for bounding the FDR.
For the upper bound of the FDR, we use the one-sided bound of Equation 1 given by:
where t is any real number.
Using an empirical Bayesian approach, we can also bound the streamlined FDR in tractograms by considering the acceptance rates obtained through randomized tractography filtering algorithms. We first establish an empirical prior based on the observed data, then compute the likelihood for each streamline, update to form the posterior probability, and aggregate the results to provide an upper bound for the FDR.
Given N streamlines and m subsets, let ai denote the acceptance rate of the i-th streamline, which is the proportion of subsets where the streamline is classified as a true positive. We model the prior distribution of acceptance rates using a Beta distribution, whose parameters α and β are estimated by:
where and s2 are the sample mean and variance of the acceptance rates, respectively. The likelihood of observing the acceptance rate ai for the i-th streamline, assuming a binomial model, is given by:
where ki is the number of accepted classifications and vi is the total number of subsets in which streamline i appears. The posterior distribution for each streamline is under the Beta-binomial conjugacy, also a Beta distribution
To aggregate the posteriors, we compute the mean and variance of the posterior probabilities of the FDR across all streamlines:
where N is the total number of streamlines.
To describe the variance of the posterior probabilities for the FDR across all streamlines, we must consider not only the individual variances of each posterior but also the covariance among them. The total variance of the mean of the posterior probabilities can be expressed as:
Given the high dimensionality of most tractograms, calculating the full covariance matrix between all pairs of streamlines is computationally prohibitive. To address this challenge, we can estimate an upper bound on the variance of the mean posterior probability by assuming the maximum possible variance from the individual posteriors. This approach circumvents the need for explicit covariance terms, instead employing the aggregate effect of the maximum variance among the individual probabilities. Consequently, we define our conservative upper bound on the variance as:
This upper bound effectively assumes perfect positive correlation among streamlines, thereby reflecting the maximal potential covariance and providing a conservative estimate of variability. Due to the high dimensionality of tractograms, often in the order of millions of streamlines, the central limit theorem ascertains that the distribution of the entire tractogram FDR will be normally distributed. Subsequently, the upper 95% confidence bound on the mean posterior probability of the FDR is computed as:
where Z0.95 represents the 95th percentile of the standard normal distribution. This Bayesian approach provides a conservative estimate of the FDR in the tractogram even when the covariance is not directly computable.
The presented methods to estimate upper bounds require estimates of streamline FDR in different subsets. For this, we measure FDR as 1—the acceptance rate of rSIFT or rCOMMIT. A streamline that has a high acceptance rate can also be considered non-redundant. In addition, an alternative is combining rSIFT and rCOMMIT acceptance scores to estimate FDR.
In this estimator, we compute a filtering result based on the computed acceptance probabilities for both rSIFT and rCOMMIT. We obtain the corresponding filtering result by setting a threshold θ, such that a streamline is considered non-redundant if its acceptance probability exceeds this threshold in both methods. Formally, for a given streamline i, let airSIFT and airCOMMIT denote its acceptance probabilities according to rSIFT and rCOMMIT, respectively. The streamline is included in the filtered tractogram if airSIFT>θ and airCOMMIT>θ. The estimator is then defined as:
where is the acceptance probability of the intersection of rSIFT and rCOMMIT for a specific threshold θ and I is the indicator function. The choice of θ can be based on the desired specificity and sensitivity trade-off, and it can be adjusted according to the distribution of acceptance probabilities. This method provides a straightforward way to combine information from both methods and requires less data in the different subset constitutions than the following methods.
One issue with considering the intersection of rSIFT and rCOMMIT is that we need to set a specific threshold θ, which can be difficult to choose. An alternative to this is to estimate the streamline's probability of being non-redundant by considering the minimum of the normalized acceptance counts across different methods. Specifically, for each streamline, we look at the number of times it has been accepted by both the rSIFT and rCOMMIT algorithms, normalized by the number of occurrences of that streamline in the respective method's subsets. This method creates a “pseudo-subset” where the streamline's acceptance is evaluated based on its most conservative acceptance rate across the methods for each subset size.
For a given streamline i, let kirSIFT be the number of times streamline i is accepted by rSIFT, and virSIFT be the number of subsets in which streamline i appears according to rSIFT. Similarly, let kirCOMMIT and virCOMMIT denote the corresponding counts for rCOMMIT. The maximal valid filtering estimator is then defined as the minimum of the normalized acceptance rates across the methods for each subset size
with
where is the minimum acceptance probability of i, and j is the tractography filtering method (rSIFT or rCOMMIT). This estimator considers each streamline's relative acceptance rate, providing a conservative estimate of its probability of being non-redundant. It is particularly useful when one wishes to ensure that a streamline is consistently accepted across multiple filtering methods before considering it non-redundant.
In this approach, we pool the subsets from both rSIFT and rCOMMIT to create a set of meta-subsets. The pooling process involves combining the subsets from each method, thereby increasing each streamline's total number of observations. Given that both methods are assumed to provide valid filtering results, their combination is expected to enhance the stability of the acceptance rate estimation due to the increased number of samples while reducing bias toward any specific tractography filtering method.
For each streamline i, the pooled acceptance probability is calculated based on its acceptance across all meta-subsets. If ki, rSIFT and ki, rCOMMIT represent the number of times streamline i is accepted in rSIFT and rCOMMIT subsets, respectively, and nrSIFT and nrCOMMIT are the total numbers of subsets for each method, the pooled estimator is then:
This estimator reflects the overall acceptance of a streamline across the combined evidence from both filtering methods.
We use a subset of the Human Connectome Project that consists of seven subjects from a dataset pre-processed by Glasser et al. (2013) with tractograms generated by Wasserthal et al. (2018) using the iFOD2 method as developed by Tournier et al. (2010). Each tractogram consists of 10 million streamlines with a range of 40–250 mm in length, was generated with anatomically constrained tractography with a step size of 0.625 mm, and covers the entire white matter volume. The subset of HCP subjects was also used by rSIFT (Hain et al., 2023) and rCOMMIT (Wan, 2023). The streamlines have been compressed to their most significant points with the method developed by Presseau et al. (2015) using a tolerance level of 0.35mm. The rSIFT parameters are the same as in Hain et al. (2023). For the method of rCOMMIT, we randomly sample tractogram subsets without replacement and run the COMMIT algorithm with the Stick-Zeppelin-Ball model. The parameters used were: axial diffusivity of 1.7 × 10⁻³, perpendicular diffusivity of 0.51 × 10⁻³, isotropic diffusivities of 1.7 × 10⁻³ and 3 × 10⁻³ with a tolerance of 1 × 10⁻³, and maximum iterations of 1,000. Table 1 reports the subset sizes and number of subsets used in the experiments.
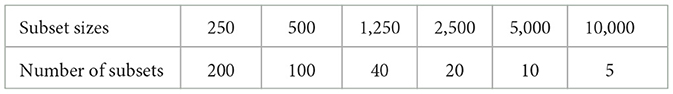
Table 1. Subset sizes (in thousands) and number of subsets per subset size used for computing rSIFT and rCOMMIT.
The lower bound of the FDR was computed with the ExTractor algorithm (Petit et al., 2023) with implementation in Singularity and NextFlow (Cousineau et al., 2017; Di Tommaso et al., 2017; Kurtzer et al., 2017), obtaining a fraction of removed streamlines of 0.890 (0.857, 0.926) for the data.
To disentangle the effects of the number of streamlines from the tractography method, a comparison using the same number of streamlines and subjects would be necessary.
It is interesting to assess the agreement between rCOMMIT and rSIFT for further estimations of redundancy. Figure 1 shows the distribution of rSIFT and rCOMMIT acceptance rates of streamlines that are accepted by the other method for all subjects in the HCP 10M dataset. As shown, the two methods have a large number of streamlines where both have an acceptance rate of 1.0, but there are many other streamlines where the two methods disagree. Figure 2 shows the distribution of acceptance rates and the Venn diagram between the two sets of accepted streamlines per method. As shown, the distributions have high concentrations around 0/1. Further, it should be noted that rSIFT disregards more streamlines than rCOMMIT, and the intersection of the two sets is 0.7% of the whole dataset. That means that only around 70,000 streamlines out of 10 million are always accepted by rSIFT and rCOMMIT. This observation has also been reported by Wan (2023). This suggests that using intersection or minimal acceptance rates may be too tight to estimate the upper bounds of redundancy compared to a single run of the corresponding method.
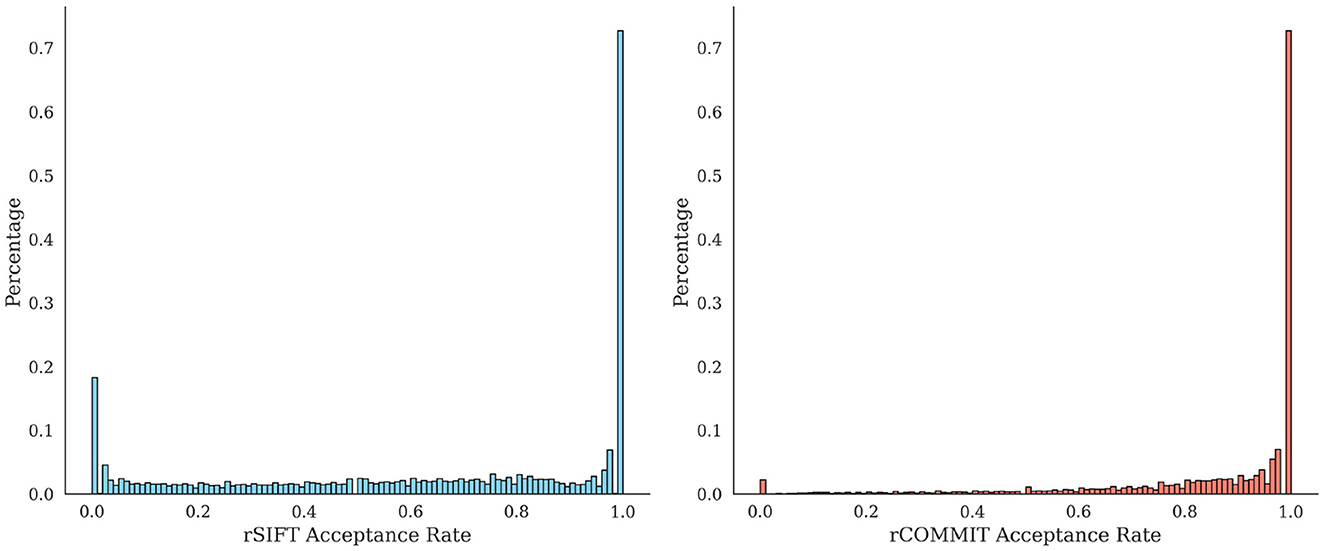
Figure 1. Distribution of rSIFT acceptance rates (Left) for accepted streamlines by rCOMMIT (acceptance rate = 1) and distribution of rCOMMIT rates for accepted streamlines by rSIFT (Right). The percentages are given for the total number of streamlines from all subjects in the dataset.
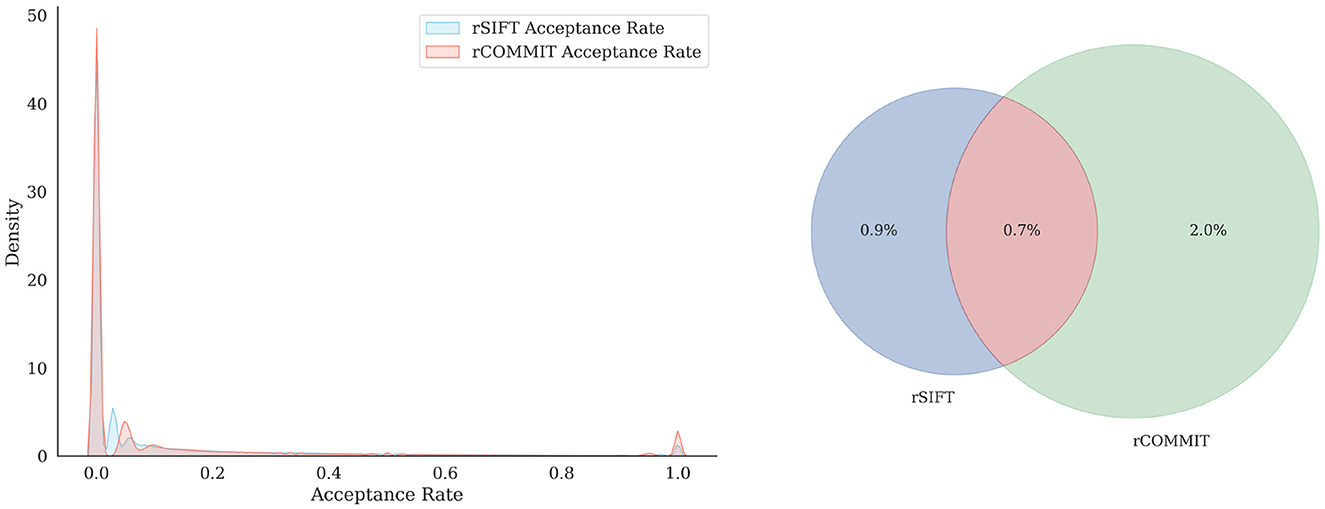
Figure 2. Distribution of the acceptance rate (Left) for rSIFT and rCOMMIT acceptance rates and the proportion of overlapping streamlines with a threshold of 1 (Right).
We implement the upper bounds by sub-sampling in Section 3.3.1 using Hoeffding's inequality and the empirical Bayesian approach in Section 3.3.2 for our dataset, for which we have the rCOMMIT and rSIFT results. The bounds are computed for different estimates of the streamlines FDR given by rCOMMIT, rSIFT, maximal valid filtering and pooled filtering. We do not include the intersection of rSIFT and rCOMMIT in these experiments because it requires a threshold that is difficult to set. As discussed previously, the minimal acceptance rate is similar to the intersection and has the advantage of not needing thresholding.
Figures 3, 4 show the results for a specific subject from our dataset. As shown, the maximal filtering approach provides the most strict upper bound of the FDR, followed by rSIFT. As was previously seen, rCOMMIT generally filters fewer streamlines than rSIFT, and we also note that the variance of rCOMMIT results is wider for the data, especially for the Bayesian approach, suggesting that COMMIT may be a less stable filtering method. The pooled estimate is approximately in the middle between rSIFT and rCOMMIT and has the lowest variance due to the combined subsets.
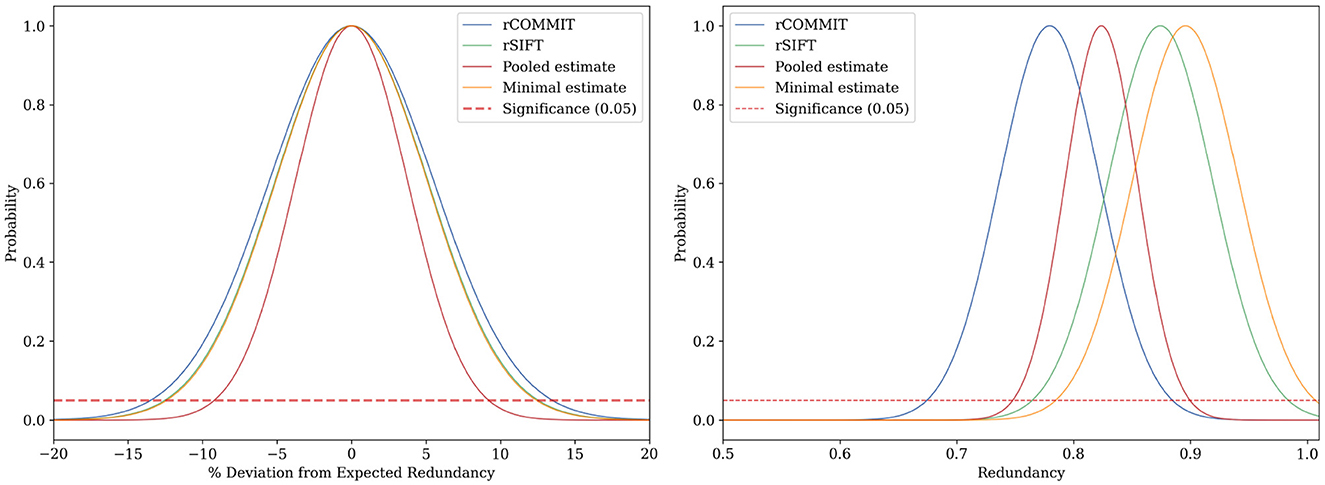
Figure 3. FDR estimation for subject ID 877168 in the HCP dataset using Hoeffding's inequality using different estimators of FDR. (Left) Deviation of the sampled FDR from its expected value. (Right) Hoeffding's upper-bound estimation of the FDR.
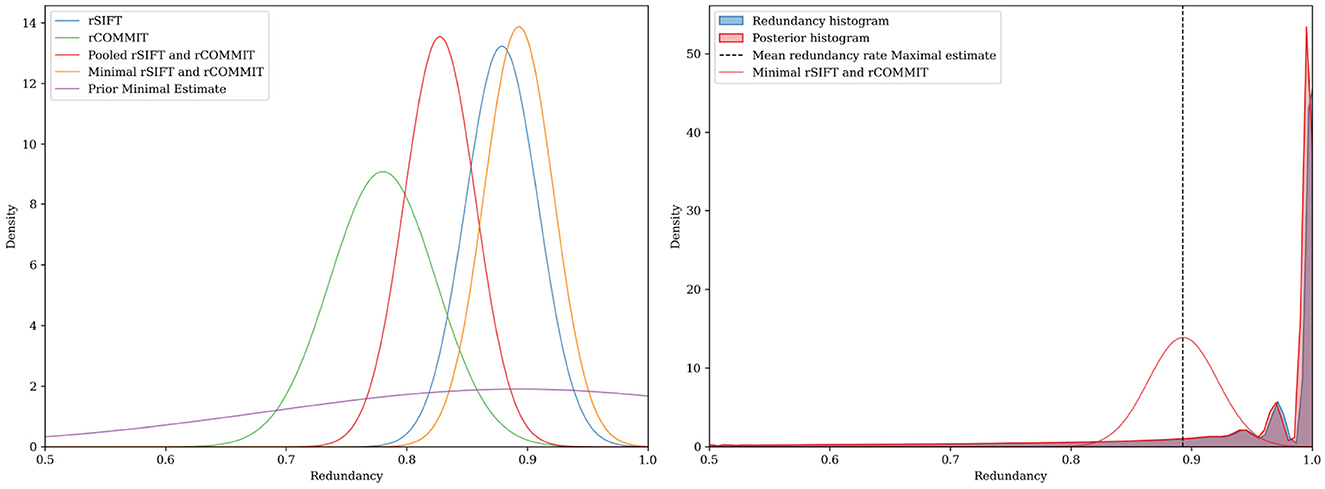
Figure 4. FDR upper-bound estimation using a Bayesian approach for subject ID 877168 in the HCP dataset. (Left) The estimate is determined by the width and the center of the distribution. (Right) In this example, the posterior and FDR histogram approximately coincide due to the extensive subsets for rSIFT and rCOMMIT, but generally, the posterior will be shifted in the direction of the prior for the model.
Table 2 shows Hoeffding's bound aggregated over all subjects in the dataset. These results are consistent with the ones in Figures 3, 4. It should be noted that the minimal estimate gives an upper bound of 1.0, suggesting that (almost) all streamlines are classified as false positives. As discussed before, the number of streamlines that are accepted by both rSIFT and rCOMMIT is very low, which makes the minimal estimate too strict. It should also be noted that Hoeffding's bound is relatively wider than the Bayesian one (compare the difference between the mean FDR and Hoeffding's bound in Table 2 to the mean posterior and upper bound in Table 3).
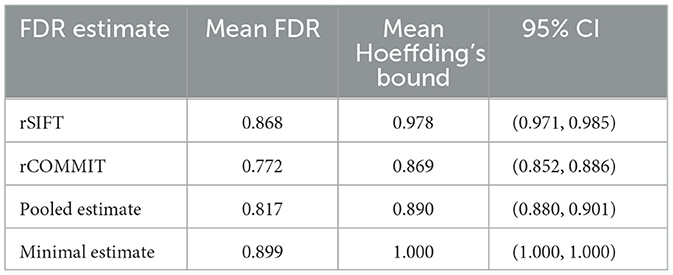
Table 2. Table of aggregated results for subjects for Hoeffding's bound ≤ 0.05 computed by Equation 2.
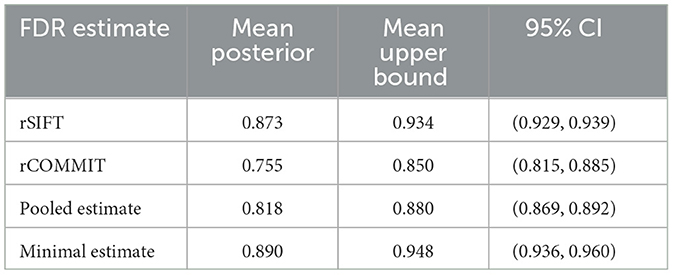
Table 3. Table of aggregated results for all subjects for empirical Bayesian upper bound.
The empirical Bayesian upper bound gives a tighter upper bound with estimates and confidence intervals reported in Table 3. The Bayesian approach is less strict than Hoeffding's bound. Still, both methods show a similar trend between the probability estimators. Table 4 shows the FDR estimated with the different methods and we observed that the posterior Bayesian distribution of Table 3 approximately matches the mean FDR from Table 4. This is expected since the number of subsets of rSIFT and rCOMMIT in the dataset is significant enough to dominate the posterior probabilities, i.e., the confidence in the empirical estimate increases with the number of subsets. Figure 5 shows the relation between the subset size and the FDR for both Hoeffding's and Bayesian upper bounds.
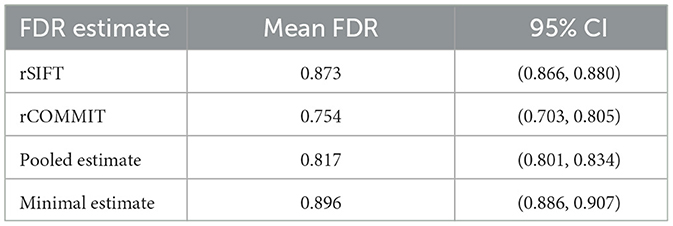
Table 4. Table of aggregated results for all subjects for the average number of filtered streamlines, that is , which is the mean acceptance rate for all subjects.
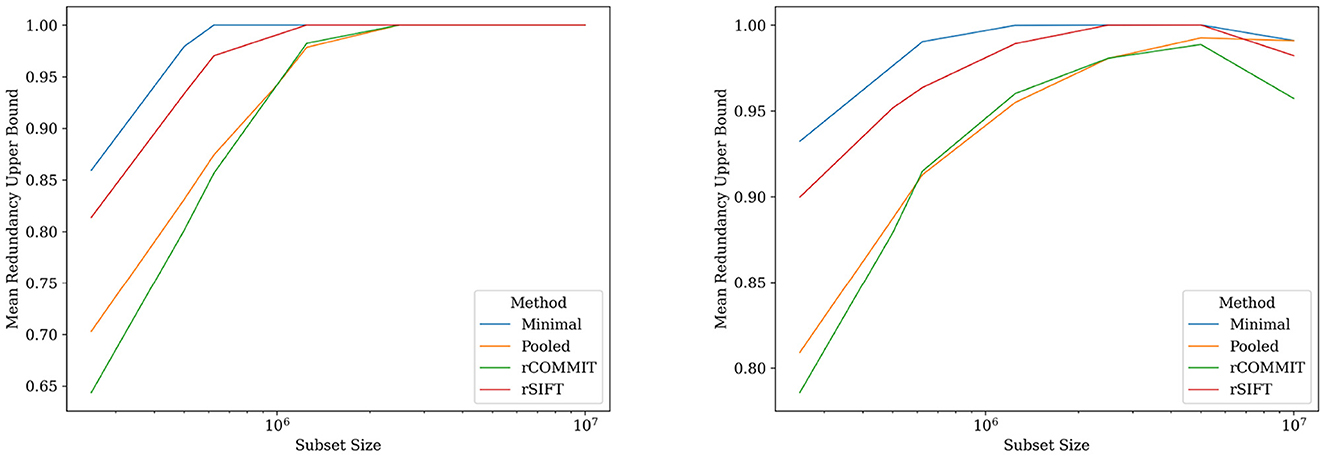
Figure 5. FDR upper bounds per subset size for different estimates of the streamline probabilities. (Left) Hoeffding's upper bound for log-normalized subset sizes for rSIFT and rCOMMIT. (Right) Bayesian upper bound for log-normalized subset sizes for rSIFT and rCOMMIT.
The effectiveness of our bounds is underscored by their capacity to accommodate the inherent variability of tractography data. In our dataset, we predict an FDR that is bounded between 85.7% [the lower confidence of interval (CI) of the ExTractor method] and 96% as given by the upper bound of the confidence interval of the minimal estimate for the empirical Bayesian method in Table 3. This interval includes all estimated upper bounds by our proposed methods except for the minimal estimate with Hoeffding's bound, which we conclude gives a too-strict upper bound. These results suggest that the redundancy consists of at least 10% of streamlines (1 million), excluding those that are also anatomically implausible, i.e., the difference between the lower and upper bounds.
Our lower bound, derived from the ExTractor algorithm, confirms the presence of anatomically implausible streamlines, providing a foundation upon which redundancy can be objectively assessed. The upper bounds, constrained by Hoeffding's inequality and the empirical Bayesian approach, provide different lenses through which the tractography-filtering outcomes can be evaluated. These statistical methods offer both means to assess the redundancy and also serve as means to understand the differences between different tractography filtering approaches. The variation in the results between these upper-bound methods reveals the trade-offs between non-parametric results and the incorporation of prior knowledge into streamlines' FDR estimation. We suggest three methods for combining the tractography filtering results from rSIFT and rCOMMIT for the upper-bound computations. The intersection between rSIFT and rCOMMIT determines the streamline's acceptance by thresholding the results from both tractography filtering algorithms. The strategy of pooling combines the streamlined acceptance of both methods to decrease the uncertainty and bias toward any particular method. The minimum acceptance rate strategy uses a subset-level approach to determine the intersectional streamline acceptance rate as the minimum of each method.
The two different statistical approaches for bounding the redundancy of the tractogram give similar results but are based on different assumptions based on the data. Hoeffding's inequality, as a non-parametric method, does not make assumptions about the distribution of the streamline false discovery rate. Its bounds are generally less tight than those of the Bayesian method but cover a broader range of potential tractography scenarios. Meanwhile, the empirical Bayesian approach offers a different perspective by introducing prior knowledge into the analysis, narrowing down the potential variance in tractogram redundancy. The results of this method rely on the prior chosen to represent the initial distribution of the data, and in cases of limited data, the effect of the prior will be enhanced, and a poorly chosen prior could lead to misleading conclusions.
When comparing Hoeffding's inequality and the empirical Bayesian approach, the perspective from which they view the data is different. Hoeffding's inequality assesses the redundancy of tractograms at the subset level. It treats each subset as an independent event, and the focus is on the resulting aggregate of these subsets. It does not delve into the individual characteristics of streamlines but instead evaluates the larger pattern of redundancy across the entire collection of subsets. This approach is particularly useful in providing a high-level, macroscopic understanding of the redundancy.
In contrast, the empirical Bayesian approach considers the evidence for each streamline on an individual basis. This perspective allows it to incorporate prior knowledge specific to each streamline's behavior across different subsets. By looking at the streamline acceptance rates, the empirical Bayesian approach effectively combines evidence from multiple iterations to update the prior beliefs into a posterior distribution reflective of each streamline's probability of being redundant. This approach values the individual contribution of streamlines within the tractogram. Figure 5 further shows the difference between the upper-bounding methods on different subsets, visualizing the interplay between the Bayesian empirical model and the data for each subset. The reduction in the Bayesian estimate (Figure 5, right) for the entire tractogram is due to the low variance of SIFT and COMMIT when run on a single fixed tractogram.
Many tractogram filtering methods are based on the exact composition of the tractogram (Smith et al., 2013, 2015; Daducci et al., 2015; Schiavi et al., 2020) and fail to take into account the uncertainty inherent to not only probabilistic tractography methods but the DW-MRI signal. Randomized SIFT and COMMIT (Hain et al., 2023; Wan, 2023) are methods that aim to assess the stability of their underlying filtering method, but due to computational time, these have challenges with widespread utilization. It should be noted that ExTractor (Petit et al., 2023) is also very expensive.
Machine learning approaches are promising to reduce the burden of computations. For example, Astolfi et al. (2023), Hain et al. (2023), Wan (2023), and (see text footnote 1) used deep learning for approximate ExTractor, rSIFT and rCOMMIT, respectively. We decided not to use the method by Astolfi et al. (2023) to obtain more accurate estimations of the lower bound of the tractogram FDR. As for rSIFT and rCOMMIT, the deep learning methods aim to classify individual streamlines from the streamline coordinates. Thus, duplicates will inexorably be accepted by the neural networks, making them inappropriate for estimating the upper bound, although they could potentially be used for estimating the lower bound provided that their accuracy is good enough.
We chose ExTractor to estimate the lower bound since it is based on neuroanatomical knowledge, making it more closely related to assessing anatomical plausibility. As discussed by Petit et al. (2023), ExTractor still can have problems with false negatives, which can affect the estimation of the lower bound of the FDR. That might imply that the lower bound estimated with ExTractor might become too strict. While FINTA (Legarreta et al., 2021) might be a good alternative to ExTractor for estimating the lower bound of redundancy because of its speed, it lacks explainability. Moreover, FINTA requires setting thresholds per bundle that are difficult to generalize for whole-brain tractogram filtering. Indeed, more research is needed to address the current issues with these methods.
Some tractogram filtering methods produce a weight for each streamline that reflects its contribution to the diffusion signal. Examples of these methods are COMMIT (Daducci et al., 2015), SIFT2 (Smith et al., 2015), and COMMIT2 (Schiavi et al., 2020). Effectively, this means that streamlines with a weight of 0 are removed from the tractogram. SIFT2 (Smith et al., 2015) is motivated by the computational inefficiency of generating highly redundant tractograms and proposes to estimate an effective area of each streamline. The result is a weight for each streamline that can be used to compute a post-filtering weighted tractogram without removing streamlines unless the weight is zero. A limitation to this approach is that there is no explicit removal of anatomically implausible streamlines unless the weight is zero, leading to a greater emphasis on an accurate original tractogram.
Building upon the efforts to increase the anatomical accuracy of tractography, Schiavi et al. (2020) introduced COMMIT2, a refinement of the original COMMIT framework. COMMIT2 enhances the specificity of reconstructing brain networks by considering their organization into anatomically plausible bundles. By balancing the local axon density derived from the diffusion-weighted MR signals against the sparsity of bundles used to explain that density, COMMIT2 suppresses the number of false positive connections more effectively compared to COMMIT, SIFT, and SIFT2, possibly at the cost of sensitivity.
As discussed in Jörgens et al. (2021), the scores of SIFT2 as compared to SIFT are not directly related to redundancy. That is, in a sample of a tractogram, a streamline can be disproportionately highly weighted compared to its significance in another sample of the same tractogram since individual streamline weights are determined by the other streamlines.
Since the inputs of the upper-bound estimations are estimations of redundancy (acceptance rates) per streamline, weights from such tractography filtering methods cannot be used directly for our purposes. That problem can be solved by a method that can estimate the probability of acceptance from those scores. Proposing such a method is part of our current research.
The proposed methods for bounding tractogram redundancy have implications for selecting tractography methods, optimizing the number of streamlines, and choosing filtering algorithms. The capability to quantify redundancy makes it possible to systematically compare the efficacy of different tractography approaches, understand how each method contributes to redundancy in the tractograms they produce, and possibly improve the methods. This quantification can guide the selection of tractography algorithms that balance the requirements of completeness and efficiency.
Additionally, measuring the effect of the number of streamlines on the overall redundancy is a potential application for the established bounds. Streamline counts can be adjusted based on empirical evidence of redundancy, facilitating the configuration of tractography pipelines to produce tractograms that are both informative and resource-efficient. The methods for bounding redundancy could also assist in evaluating the performance of various tractography filtering algorithms with a quantitative metric. Such evaluations can determine how different filtering methods reduce redundancy and enhance the anatomical plausibility of tractograms. These measurements can be used to complement the traditional tractometer measurements (Côté et al., 2013). Tractometry methods are also highly dependent on a high-quality tractogram, and our study contributes to the area of being able to measure tractogram quality and fidelity, starting with redundancy.
The introduced method can be further developed to benchmark both tractograms and filtering algorithms to assess the stability of their results as well as the underlying tractogram redundancy.
Both Hoeffding's inequality and the empirical Bayesian approach offer valuable frameworks for estimating the FDR; however, they do not account for the variable topographical complexity of brain regions. The current methods treat the tractogram as a homogeneous entity and apply a uniform standard across all regions, potentially overlooking these variations.
Furthermore, our approach does not incorporate region-specific biological knowledge about white matter pathways that could significantly inform the process of identifying redundancy. Instead, it relies on the underlying tractogram filtering methods—ExTractor, rSIFT, and rCOMMIT—to give appropriate estimates of streamline-level redundancy.
ExTractor provides a rule-based approach to filter anatomically implausible streamlines, but the definition of anatomical plausibility is not unequivocal; therefore, any rule-based approach may filter connections that are truly positive and miss erroneous streamlines. We recognize this limitation and use the ExTractor as a method to estimate the proportion of geometrically plausible streamlines. It is, however, an approximation for a lower bound that excludes implausible streamlines but does not optimize the representation of the underlying diffusion signal.
The computational load of establishing these bounds is currently significant; for example, processing each subject with rCOMMIT takes ~2 weeks on a high-performance workstation with a 16-core Intel Xeon processor and 64 GB of RAM. We, however, note that the acceptance probabilities for each streamline, as given by rSIFT and rCOMMIT in Table 4, are indicative of the posterior distribution of each streamline. We, therefore, argue that approximating the streamline acceptance rate with a noise-injected deep learning model could be an interesting alternative to explore to establish the confidence interval over sampled outputs from the models. This approach would provide a practical estimate of the redundancy, and previous research has shown this to be a feasible route (Legarreta et al., 2021; Astolfi et al., 2023; Hain et al., 2023; Wan, 2023) (see text footnote 1). While this is true for estimating the lower bound of the false discovery rate, training a model that can be used for estimating the upper bound of the FDR is more challenging and deserves additional research.
The proposed method for statistically bounding redundancy in a tractogram offers several potential future areas of research. Our study is based on computational methods for filtering tractograms, and comparing our results to histological data could provide a prior for the expected redundancy, similar to what has been done for the tractogram fidelity (Seehaus et al., 2013; Delettre et al., 2019).
In the intersection of rCOMMIT and rSIFT, we find that there are certain streamlines that build the overarching structure of the tractogram that appear uniformly over the entire tractogram (see Figure 6). We denote them foundational streamlines, and these may be suggested to form the basis for the tractogram. In this study, we do not investigate whether these streamlines retain individual characteristics or whether tractography filtering can compress a tractogram.
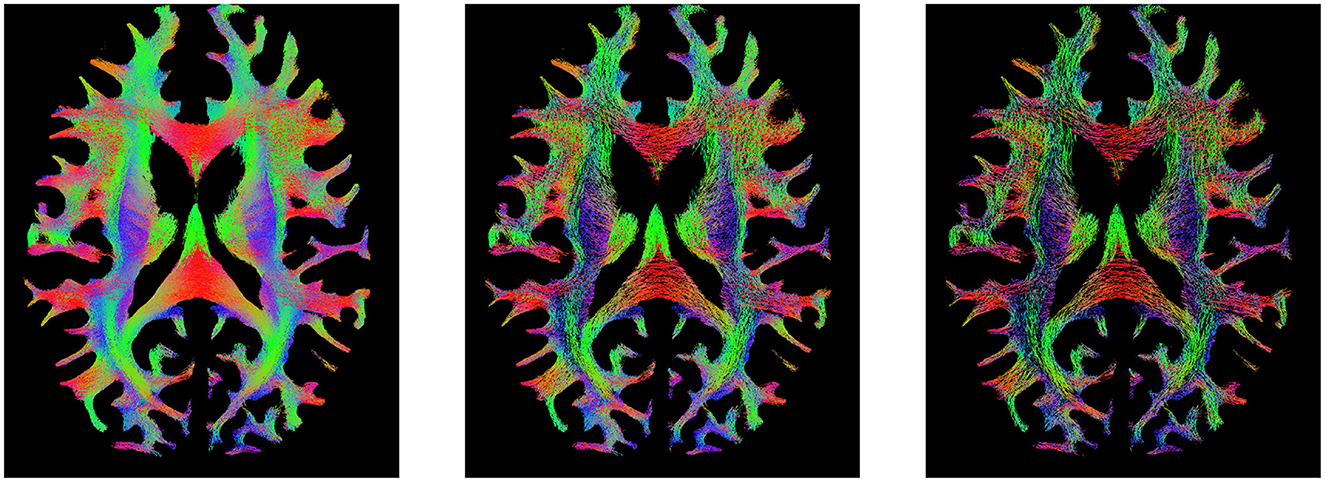
Figure 6. Visualization of the tractogram of Subject 877168 in HCP 10M. (Left) Tractogram filtering by rCOMMIT. (Middle) Tractogram filtering by rSIFT. (Right) Foundational streamlines at the intersection of filtering by rCOMMIT and rSIFT with acceptance probability = 1.
Furthermore, in our study, we apply our methods with rSIFT and rCOMMIT, but there have been studies extending these methods, such as SIFT2 (Smith et al., 2015), COMMIT2 (Schiavi et al., 2020), and the blurred streamlines representation in combination with COMMIT proposed by Gabusi et al. (2024). Extending our proposed redundancy metric to these methods is an important avenue for our future research. Regarding SIFT2, the weights estimated by the method are always positive, according to Jörgens et al. (2021), which makes it impossible to use the same randomization procedure we use for SIFT and COMMIT to SIFT2. In turn, COMMIT, and consequently COMMIT2, encourages sparsity on the weights. As a consequence, COMMIT2 can give zero weight to many streamlines, making it suitable for our randomization procedure. The same is true for other approaches based on COMMIT (e.g., COMMIT-tree Ocampo-Pineda et al., 2021 or COMMIT-T2 Barakovic et al., 2021). Similarly, assessing the redundancy of clinical datasets could provide further insights into the variation depending on the diffusion MRI quality. For this, it is relevant to study randomized methods that can run on single-shell diffusion data.
We have presented two statistical approaches for bounding the redundancy with minimal assumptions that can be applied to different tractography filtering methods, with examples given for the randomized SIFT and COMMIT. Our approaches are designed to be applicable across a variety of filtering methods and offer reliability in heterogeneous datasets. While there remain areas for further validation, the methods developed comprise a step forward toward quantifying the lower and upper bounds of the false discovery rates of streamlines in tractograms and the redundancy rate and can provide a viable metric for the quality of tractography methods. Future research includes evaluating the proposed bounds on different tractography methods and aims toward ranking tractography methods by their redundancy to give an application-dependent recommendation of the number of streamlines that are necessary for a good representation of brain neural tracts.
Publicly available datasets were analyzed in this study. This data can be found here: https://db.humanconnectome.org.
Ethical review and approval was not required for the study on human participants in accordance with the local legislation and institutional requirements. The participants provided their written informed consent to participate in this study.
SP: Conceptualization, Investigation, Methodology, Software, Validation, Visualization, Writing – original draft, Writing – review & editing, Formal analysis. RM: Conceptualization, Funding acquisition, Methodology, Project administration, Resources, Supervision, Visualization, Writing – review & editing.
The authors declare financial support was received for the research, authorship, and/or publication of this article. This research has been partially funded by Digital Futures, Project dBrain, the Swedish Research Council (Grant No. 2022-03389), and MedTechLabs. The funding sources had no involvement in the research and preparation of this study. Data were provided by the Human Connectome Project, WU-Minn Consortium (Principal Investigators: David Van Essen and Kamil Ugurbil; 1U54MH091657), funded by the 16 National Institutes of Health (NIH) Institutes and Centers that support the NIH Blueprint for Neuroscience Research, and by the McDonnell Center for Systems Neuroscience at Washington University.
The authors declare that the research was conducted in the absence of any commercial or financial relationships that could be construed as a potential conflict of interest.
All claims expressed in this article are solely those of the authors and do not necessarily represent those of their affiliated organizations, or those of the publisher, the editors and the reviewers. Any product that may be evaluated in this article, or claim that may be made by its manufacturer, is not guaranteed or endorsed by the publisher.
1. ^Persson, S., Wan, X., and Moreno, R. (Submitted). Randomly Committing: Iterative Convex Optimization for Microstructure-Informed Tractography.
Astolfi, P., Verhagen, R., Petit, L., Olivetti, E., Sarubbo, S., Masci, J., et al. (2023). Supervised tractogram filtering using Geometric Deep Learning. Med. Image Anal. 90:102893. doi: 10.1016/j.media.2023.102893
Barakovic, M., Tax, C. M., Rudrapatna, U., Chamberland, M., Rafael-Patino, J., Granziera, C., et al. (2021). Resolving bundle-specific intra-axonal T2 values within a voxel using diffusion-relaxation tract-based estimation. Neuroimage 227:117617. doi: 10.1016/j.neuroimage.2020.117617
Basser, P. J., Pajevic, S., Pierpaoli, C., Duda, J., and Aldroubi, A. (2000). In vivo fiber tractography using DT-MRI data. Magn. Reson. Med. 44, 625–632. doi: 10.1002/1522-2594(200010)44:4<625::AID-MRM17>3.0.CO;2-O
Bertò, G., Bullock, D., Astolfi, P., Hayashi, S., Zigiotto, L., Annicchiarico, L., et al. (2021). Classifyber, a robust streamline-based linear classifier for white matter bundle segmentation. Neuroimage 224:117402. doi: 10.1016/j.neuroimage.2020.117402
Chandio, B. Q., Risacher, S. L., Pestilli, F., Bullock, D., Yeh, F.-C., Koudoro, S., et al. (2020). Bundle analytics, a computational framework for investigating the shapes and profiles of brain pathways across populations. Sci. Rep. 10:17149. doi: 10.1038/s41598-020-74054-4
Christiaens, D., Reisert, M., Dhollander, T., Sunaert, S., Suetens, P., and Maes, F. (2015). Global tractography of multi-shell diffusion-weighted imaging data using a multi-tissue model. Neuroimage 123, 89–101. doi: 10.1016/j.neuroimage.2015.08.008
Côté, M.-A., Girard, G., Boré, A., Garyfallidis, E., Houde, J.-C., and Descoteaux, M. (2013). Tractometer: towards validation of tractography pipelines. Med. Image Anal. 17, 844–857. doi: 10.1016/j.media.2013.03.009
Cousineau, M., Jodoin, P.-M., Garyfallidis, E., Côté, M.-A., Morency, F. C., Rozanski, V., et al. (2017). A test-retest study on Parkinson's PPMI dataset yields statistically significant white matter fascicles. NeuroImage Clin. 16, 222–233. doi: 10.1016/j.nicl.2017.07.020
Daducci, A., Dal Palù, A., Descoteaux, M., and Thiran, J.-P. (2016). Microstructure informed tractography: pitfalls and open challenges. Front. Neurosci. 10:247. doi: 10.3389/fnins.2016.00247
Daducci, A., Dal Palú, A., Lemkaddem, A., and Thiran, J.-P. (2015). COMMIT: convex optimization modeling for microstructure informed tractography. IEEE Transact. Med. Imaging 34, 246–257. doi: 10.1109/TMI.2014.2352414
De Benedictis, A., Petit, L., Descoteaux, M., Marras, C. E., Barbareschi, M., Corsini, F., et al. (2016). New insights in the homotopic and heterotopic connectivity of the frontal portion of the human corpus callosum revealed by microdissection and diffusion tractography. Hum. Brain Mapp. 37, 4718–4735. doi: 10.1002/hbm.23339
Delettre, C., Messé, A., Dell, L.-A., Foubet, O., Heuer, K., Larrat, B., et al. (2019). Comparison between diffusion MRI tractography and histological tract-tracing of cortico-cortical structural connectivity in the ferret brain. Netw. Neurosci. 3, 1038–1050. doi: 10.1162/netn_a_00098
Di Tommaso, P., Chatzou, M., Floden, E. W., Barja, P. P., Palumbo, E., and Notredame, C. (2017). Nextflow enables reproducible computational workflows. Nat. Biotechnol. 35, 316–319. doi: 10.1038/nbt.3820
Durantel, T., Coloigner, J., and Commowick, O. (2022). “A convolutional wasserstein distance for tractography evaluation: complementarity study to state-of-the-art measures,” in 2022 IEEE 19th International Symposium on Biomedical Imaging (ISBI) (Kolkata), 1–5. doi: 10.1109/ISBI52829.2022.9761650
Gabusi, I., Battocchio, M., Bosticardo, S., Schiavi, S., and Daducci, A. (2024). Blurred streamlines: a novel representation to reduce redundancy in tractography. Med. Image Anal. 93:103101. doi: 10.1016/j.media.2024.103101
Garyfallidis, E., Brett, M., Correia, M., Williams, G., and Nimmo-Smith, I. (2012). QuickBundles, a method for tractography simplification. Front. Neurosci. 6:175. doi: 10.3389/fnins.2012.00175
Glasser, M. F., Sotiropoulos, S. N., Wilson, J. A., Coalson, T. S., Fischl, B., Andersson, J. L., et al. (2013). The minimal preprocessing pipelines for the Human Connectome Project. Neuroimage 80, 105–124. doi: 10.1016/j.neuroimage.2013.04.127
Hain, A., Jörgens, D., and Moreno, R. (2023). Randomized iterative spherical-deconvolution informed tractogram filtering. Neuroimage 278:120248. doi: 10.1016/j.neuroimage.2023.120248
Hau, J., Sarubbo, S., Houde, J. C., Corsini, F., Girard, G., Deledalle, C., et al. (2017). Revisiting the human uncinate fasciculus, its subcomponents and asymmetries with stem-based tractography and microdissection validation. Brain Struct. Funct. 222, 1645–1662. doi: 10.1007/s00429-016-1298-6
Henderson, F., Abdullah, K. G., Verma, R., and Brem, S. (2020). Tractography and the connectome in neurosurgical treatment of gliomas: the premise, the progress, and the potential. Neurosurg. Focus 48:E6. doi: 10.3171/2019.11.FOCUS19785
Hoeffding, W. (1963). Probability inequalities for sums of bounded random variables. J. Am. Stat. Assoc. 58, 13–30. doi: 10.1080/01621459.1963.10500830
Jeurissen, B., Descoteaux, M., Mori, S., and Leemans, A. (2019). Diffusion MRI fiber tractography of the brain. NMR Biomed. 32:e3785. doi: 10.1002/nbm.3785
Jörgens, D., Descoteaux, M., and Moreno, R. (2021). “Challenges for tractogram filtering,” in Anisotropy Across Fields and Scales, Mathematics and Visualization, eds. E. Özarslan, T. Schultz, E. Zhang, and A. Fuster (Cham. Springer International Publishing), 149–168.
Jörgens, D., Jodoin, P.-M., Descoteaux, M., and Moreno, R. (2023). Merging multiple input descriptors and supervisors in a deep neural network for tractogram filtering. arXiv [preprint]. doi: 10.48550/arXiv.2307.05786
Konopleva, L., Il'yasov, K. A., Skibbe, H., Kiselev, V. G., Kellner, E., Dhital, B., et al. (2018). Modelfree global tractography. Neuroimage 174, 576–586. doi: 10.1016/j.neuroimage.2018.03.058
Kurtzer, G. M., Sochat, V., and Bauer, M. W. (2017). Singularity: scientific containers for mobility of compute. PLoS ONE 12:e0177459. doi: 10.1371/journal.pone.0177459
Legarreta, J. H., Petit, L., Jodoin, P.-M., and Descoteaux, M. (2023). Generative sampling in bundle tractography using autoencoders (GESTA). Med. Image Anal. 85:102761. doi: 10.1016/j.media.2023.102761
Legarreta, J. H., Petit, L., Rheault, F., Theaud, G., Lemaire, C., Descoteaux, M., et al. (2021). Filtering in tractography using autoencoders (FINTA). Med. Image Anal. 72:102126. doi: 10.1016/j.media.2021.102126
Maffei, C., Jovicich, J., De Benedictis, A., Corsini, F., Barbareschi, M., Chioffi, F., et al. (2018). Topography of the human acoustic radiation as revealed by ex vivo fibers micro-dissection and in vivo diffusion-based tractography. Brain Struct. Funct. 223, 449–459. doi: 10.1007/s00429-017-1471-6
Maffei, C., Lee, C., Planich, M., Ramprasad, M., Ravi, N., Trainor, D., et al. (2021). Using diffusion MRI data acquired with ultra-high gradient strength to improve tractography in routine-quality data. Neuroimage 245:118706. doi: 10.1016/j.neuroimage.2021.118706
Maier-Hein, K. H., Neher, P. F., Houde, J.-C., Côté, M.-A., Garyfallidis, E., Zhong, J., et al. (2017). The challenge of mapping the human connectome based on diffusion tractography. Nat. Commun. 8:1349. doi: 10.1038/s41467-017-01285-x
Meynert, T. (1885). Psychiatry: A Clinical Treatise on Diseases of the Fore-Brain Based Upon a Study of Its Structure, Functions, and Nutrition [Internet]. G.P. Putnam's Sons. Available online at: https://books.google.com/books?id=rFpz_Kmlpq4C
Mori, S., Crain, B. J., Chacko, V. P., and Van Zijl, P. C. (1999). Three-dimensional tracking of axonal projections in the brain by magnetic resonance imaging. Ann. Neurol. 45, 265–269. doi: 10.1002/1531-8249(199902)45:2<265::AID-ANA21>3.0.CO;2-3
Neher, P. F., Côté, M.-A., Houde, J.-C., Descoteaux, M., and Maier-Hein, K. H. (2017). Fiber tractography using machine learning. Neuroimage 158, 417–429. doi: 10.1016/j.neuroimage.2017.07.028
Nieuwenhuys, R., Voogd, J., and Huijzen, V. (2008). The Human Central Nervous System. 4th Edn. Berlin: Springer-Verlag.
Ocampo-Pineda, M., Schiavi, S., Rheault, F., Girard, G., Petit, L., Descoteaux, M., et al. (2021). Hierarchical microstructure informed tractography. Brain Connect. 11, 75–88. doi: 10.1089/brain.2020.0907
Oishi, K., Faria, A., Jiang, H., Li, X., Akhter, K., Zhang, J., et al. (2009). Atlas-based whole brain white matter analysis using large deformation diffeomorphic metric mapping: application to normal elderly and Alzheimer's disease participants. Neuroimage 46, 486–499. doi: 10.1016/j.neuroimage.2009.01.002
Petit, L., Ali, K. M., Rheault, F., Boré, A., Cremona, S., Corsini, F., et al. (2023). The structural connectivity of the human angular gyrus as revealed by microdissection and diffusion tractography. Brain Struct. Funct. 228, 103–120. doi: 10.1007/s00429-022-02551-5
Poulin, P., Côté, M.-A., Houde, J.-C., Petit, L., Neher, P. F., Maier-Hein, K. H., et al. (2017). “Learn to track: deep learning for tractography,” in Medical Image Computing and Computer Assisted Intervention MICCAI 2017, eds. M. Descoteaux, L. Maier-Hein, A. Franz, P. Jannin, D. L. Collins, and S. Duchesne (Cham. Springer International Publishing), 540–547.
Poulin, P., Jörgens, D., Jodoin, P.-M., and Descoteaux, M. (2019). Tractography and machine learning: current state and open challenges. Magn. Reson. Imaging 64, 37–48. doi: 10.1016/j.mri.2019.04.013
Presseau, C., Jodoin, P.-M., Houde, J.-C., and Descoteaux, M. (2015). A new compression format for fiber tracking datasets. Neuroimage 109, 73–83. doi: 10.1016/j.neuroimage.2014.12.058
Rheault, F., De Benedictis, A., Daducci, A., Maffei, C., Tax, C. M. W., Romascano, D., et al. (2020). Tractostorm: the what, why, and how of tractography dissection reproducibility. Hum. Brain Mapp. 41, 1859–1874. doi: 10.1002/hbm.24917
Rheault, F., Schilling, K. G., Valcourt-Caron, A., Théberge, A., Poirier, C., Grenier, G., et al. (2022). Tractostorm 2: optimizing tractography dissection reproducibility with segmentation protocol dissemination. Hum. Brain Mapp. 43, 2134–2147. doi: 10.1002/hbm.25777
Schiavi, S., Ocampo-Pineda, M., Barakovic, M., Petit, L., Descoteaux, M., Thiran, J.-P., et al. (2020). A new method for accurate in vivo mapping of human brain connections using microstructural and anatomical information. Sci. Adv. 6:eaba8245. doi: 10.1126/sciadv.aba8245
Schilling, K. G., Daducci, A., Maier-Hein, K., Poupon, C., Houde, J.-C., Nath, V., et al. (2019). Challenges in diffusion MRI tractography—lessons learned from international benchmark competitions. Magn. Reson. Imaging 57, 194–209. doi: 10.1016/j.mri.2018.11.014
Schilling, K. G., Rheault, F., Petit, L., Hansen, C. B., Nath, V., Yeh, F.-C., et al. (2021). Tractography dissection variability: what happens when 42 groups dissect 14 white matter bundles on the same dataset? Neuroimage 243:118502. doi: 10.1016/j.neuroimage.2021.118502
Schmahmann, J. D., and Pandya, D. N. (2006). Fiber Pathways of the Brain [Internet]. Oxford University Press. Available online at: https://books.google.com/books?id=LPACkAEACAAJ
Seehaus, A. K., Roebroeck, A., Chiry, O., Kim, D.-S., Ronen, I., Bratzke, H., et al. (2013). Histological validation of DW-MRI tractography in human postmortem tissue. Cereb. Cortex 23, 442–450. doi: 10.1093/cercor/bhs036
Siegbahn, M., Engmér Berglin, C., and Moreno, R. (2022). Automatic segmentation of the core of the acoustic radiation in humans. Front. Neurol. 13:934650. doi: 10.3389/fneur.2022.934650
Sinzinger, F. L., and Moreno, R. (2022). “Reinforcement learning based tractography with so (3) equivariant agents,” in Geometric Deep Learning in Medical Image Analysis (Extended abstracts). Available online at: https://scholar.google.com/scholar?&q=Sinzinger%2C%20F.L.%2C%20Moreno%2C%20R.%3A%20Reinforcement%20learning%20based%20tractography%20with%20so%20%283%29%20equivariant%20agents.%20In%3A%20Geometric%20Deep%20Learning%20in%20Medical%20Image%20Analysis%20%282022%29
Smith, R. E., Tournier, J.-D., Calamante, F., and Connelly, A. (2012). Anatomically-constrained tractography: improved diffusion MRI streamlines tractography through effective use of anatomical information. Neuroimage 62, 1924–1938. doi: 10.1016/j.neuroimage.2012.06.005
Smith, R. E., Tournier, J.-D., Calamante, F., and Connelly, A. (2013). SIFT: spherical-deconvolution informed filtering of tractograms. Neuroimage 67, 298–312. doi: 10.1016/j.neuroimage.2012.11.049
Smith, R. E., Tournier, J.-D., Calamante, F., and Connelly, A. (2015). SIFT2: enabling dense quantitative assessment of brain white matter connectivity using streamlines tractography. Neuroimage 119, 338–351. doi: 10.1016/j.neuroimage.2015.06.092
Théberge, A., Desrosiers, C., Descoteaux, M., and Jodoin, P.-M. (2021). Track-to-learn: a general framework for tractography with deep reinforcement learning. Med. Image Anal. 72:102093. doi: 10.1016/j.media.2021.102093
Tournier, J.-D., Calamante, F., and Connelly, A. (2007). Robust determination of the fibre orientation distribution in diffusion MRI: non-negativity constrained super-resolved spherical deconvolution. Neuroimage 35, 1459–1472. doi: 10.1016/j.neuroimage.2007.02.016
Tournier, J. D., Calamante, F., and Connelly, A. (2010). “Improved probabilistic streamlines tractography by 2nd order integration over fibre orientation distributions,” in Proceedings of the International Society for Magnetic Resonance in Medicine (ISMRM), Volume 1670. John Wiley & Sons, Inc.
Wan, X. (2023). Assessing the streamline plausibility through convex optimization for microstructure informed tractography (COMMIT) with deep learning [Internet] (Master's thesis). (TRITA-CBH-GRU). Available online at: https://urn.kb.se/resolve?urn=urn:nbn:se:kth:diva-326496
Warrington, S., Bryant, K. L., Khrapitchev, A. A., Sallet, J., Charquero-Ballester, M., Douaud, G., et al. (2020). XTRACT - standardised protocols for automated tractography in the human and macaque brain. Neuroimage 217:116923. doi: 10.1016/j.neuroimage.2020.116923
Wasserthal, J., Neher, P., and Maier-Hein, K. H. (2018). TractSeg - fast and accurate white matter tract segmentation. Neuroimage 183, 239–253. doi: 10.1016/j.neuroimage.2018.07.070
Yang, J. Y.-M., Yeh, C.-H., Poupon, C., and Calamante, F. (2021). Diffusion MRI tractography for neurosurgery: the basics, current state, technical reliability and challenges. Phys. Med. Biol. 66:15TR01. doi: 10.1088/1361-6560/ac0d90
Yeh, C.-H., Jones, D. K., Liang, X., Descoteaux, M., and Connelly, A. (2021). Mapping structural connectivity using diffusion MRI: challenges and opportunities. J. Magn. Reson. Imaging 53, 1666–1682. doi: 10.1002/jmri.27188
Keywords: diffusion MRI, tractography, tractogram filtering, tractogram redundancy, Hoeffding's inequality, Bayesian estimation
Citation: Persson S and Moreno R (2024) Bounding tractogram redundancy. Front. Neurosci. 18:1403804. doi: 10.3389/fnins.2024.1403804
Received: 19 March 2024; Accepted: 08 July 2024;
Published: 23 July 2024.
Edited by:
Kurt G. Schilling, Vanderbilt University Medical Center, United StatesReviewed by:
Ilaria Gabusi, University of Verona, ItalyCopyright © 2024 Persson and Moreno. This is an open-access article distributed under the terms of the Creative Commons Attribution License (CC BY). The use, distribution or reproduction in other forums is permitted, provided the original author(s) and the copyright owner(s) are credited and that the original publication in this journal is cited, in accordance with accepted academic practice. No use, distribution or reproduction is permitted which does not comply with these terms.
*Correspondence: Sanna Persson, c2FubmFwZUBrdGguc2U=
Disclaimer: All claims expressed in this article are solely those of the authors and do not necessarily represent those of their affiliated organizations, or those of the publisher, the editors and the reviewers. Any product that may be evaluated in this article or claim that may be made by its manufacturer is not guaranteed or endorsed by the publisher.
Research integrity at Frontiers
Learn more about the work of our research integrity team to safeguard the quality of each article we publish.