 Lucia Maccioni1*
 Carranza Mellana Michelle1,2
 Ludovica Brusaferri3,4
 Erica Silvestri1
 Alessandra Bertoldo1,5
 Julia J. Schubert6Maria A. Nettis6
 Valeria Mondelli6
 Oliver Howes6
 Federico E. Turkheimer6Michel Bottlaender7
 Benedetta Bodini2
 Bruno Stankoff2
 Marco L. Loggia3
 Mattia Veronese1,6*
- 1Department of Information Engineering, University of Padova, Padova, Italy
- 2Paris Brain Institute, ICM, CNRS, Inserm, Sorbonne Université, Paris, France
- 3Athinoula A. Martinos Center for Biomedical Imaging, Department of Radiology, Massachusetts General Hospital, Harvard Medical School, Charlestown, MA, United States
- 4Computer Science and Informatics, School of Engineering, London South Bank University, London, United Kingdom
- 5Padova Neuroscience Center, University of Padova, Padova, Italy
- 6Institute of Psychiatry, Psychology and Neuroscience (IoPPN), King’s College London, London, United Kingdom
- 7BioMaps, Service Hospitalier Frédéric Joliot CEA, CNRS Inserm, Université Paris-Saclay, Orsay, France
Introduction: Recent evidence suggests the blood-to-brain influx rate (K1) in TSPO PET imaging as a promising biomarker of blood–brain barrier (BBB) permeability alterations commonly associated with peripheral inflammation and heightened immune activity in the brain. However, standard compartmental modeling quantification is limited by the requirement of invasive and laborious procedures for extracting an arterial blood input function. In this study, we validate a simplified blood-free methodologic framework for K1 estimation by fitting the early phase tracer dynamics using a single irreversible compartment model and an image-derived input function (1T1K-IDIF).
Methods: The method is tested on a multi-site dataset containing 177 PET studies from two TSPO tracers ([11C]PBR28 and [18F]DPA714). Firstly, 1T1K-IDIF K1 estimates were compared in terms of both bias and correlation with standard kinetic methodology. Then, the method was tested on an independent sample of [11C]PBR28 scans before and after inflammatory interferon-α challenge, and on test–retest dataset of [18F]DPA714 scans.
Results: Comparison with standard kinetic methodology showed good-to-excellent intra-subject correlation for regional 1T1K-IDIF-K1 (ρintra = 0.93 ± 0.08), although the bias was variable depending on IDIF ability to approximate blood input functions (0.03–0.39 mL/cm3/min). 1T1K-IDIF-K1 unveiled a significant reduction of BBB permeability after inflammatory interferon-α challenge, replicating results from standard quantification. High intra-subject correlation (ρ = 0.97 ± 0.01) was reported between K1 estimates of test and retest scans.
Discussion: This evidence supports 1T1K-IDIF as blood-free alternative to assess TSPO tracers’ unidirectional blood brain clearance. K1 investigation could complement more traditional measures in TSPO studies, and even allow further mechanistic insight in the interpretation of TSPO signal.
1 Introduction
Inflammatory processes are involved in the pathophysiology of a wide spectrum of brain disorders (Albrecht et al., 2016; Guzman-Martinez et al., 2019) The prolonged activation of microglia and astrocytes, the resident immune cells in the brain, and the infiltration of peripheral immune cells in the brain parenchyma have been associated with the onset and/or progression of neurodegenerative disorders - such as Alzheimer’s disease, Parkinson’s disease and multiple sclerosis -, neuropsychiatric disorders - such as schizophrenia and depression -, but also stroke, and chronic pain (Loggia et al., 2015; Bauer and Teixeira, 2019; Goldsmith et al., 2019; Nutma et al., 2019; Dimitrova-Shumkovska et al., 2020; Han et al., 2021).
The growing interest in neuroinflammation has motivated the introduction in the past decade of a substantial number of imaging biomarkers designed to detect in vivo brain inflammation (Vicente-Rodríguez et al., 2021).
Positron Emission Tomography (PET) imaging represents a powerful tool for the in vivo characterization of neuroinflammatory processes (Turkheimer et al., 2015; Werry et al., 2019; Jain et al., 2020). The majority of PET imaging studies of neuroinflammation utilize radiotracers targeting the 18 kDa translocator protein (TSPO), which is expressed in activated microglia, and also in astrocytes and endothelial cells, and is upregulated in neuro-immune responses (Jain et al., 2020). Despite its limitations (Vivash and O’Brien, 2016; De Picker and Haarman, 2021; Zhang et al., 2021; Nutma et al., 2023), TSPO PET is currently the most specific method for imaging neuroinflammation in the living human brain.
Compartmental modeling is the standard methodology for the quantification of dynamic PET data: it provides a mathematical description of the kinetic of the radiotracer within the target tissues as a function of the tracer concentration in the plasma over time. Plasma tracer activity commonly defines the input function of the model, while the model parameters describe the tracer kinetics (Bertoldo et al., 2014). In the case of TSPO PET tracers, the most widely used kinetic model is composed of two reversible compartments and defined by 4 rate constants (i.e., K1, k2, k3, k4; Turkheimer et al., 2015; Wimberley et al., 2021; Figure 1A), which can be extended with the inclusion of a vascular component (Rizzo et al., 2014). If the input is known, the model parameters can be estimated by fitting the model to the measured time activity curves (TACs). Model parameters are then combined to quantify metrics of interest such as the volume of distribution (VT,; Innis et al., 2007), which is widely employed in TSPO PET studies as a proxy of the density of TSPO (Rizzo et al., 2014; Marques et al., 2021).
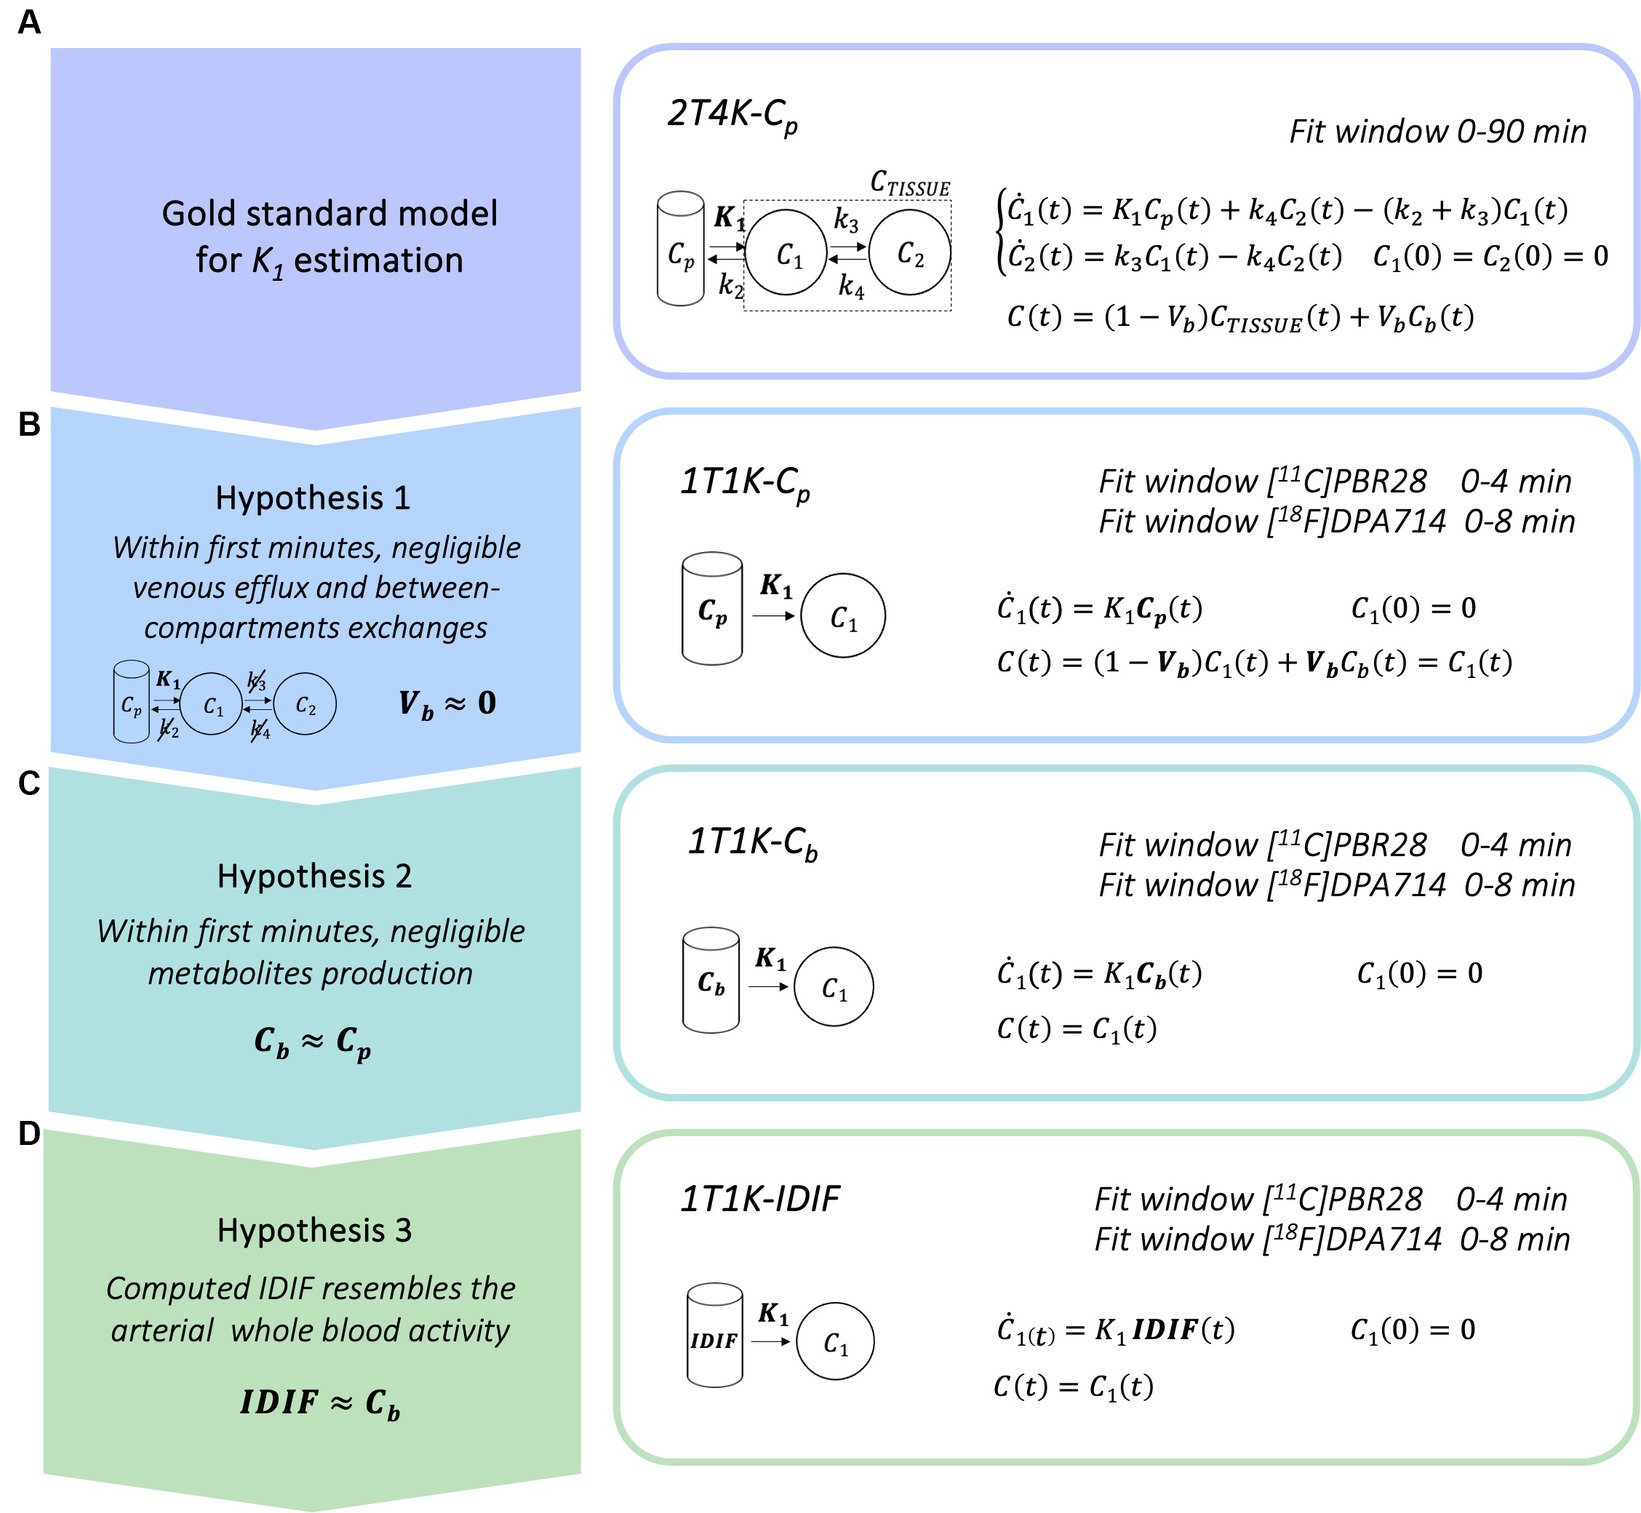
Figure 1. Simplified blood-free methodological framework for K1 estimation. Panel A show the gold standard compartmental model for kinetic modeling of TSPO radiotracers; panels B–D show the simplified models for the K1 estimation derived when considering a limited time window for model fitting [Cp = arterial parent plasma input function, Cb = arterial whole blood input function, IDIF = image derived input function].
Among these parameters, is the influx rate constant K1 (mL/cm3/min). This metric denotes the rate at which the tracer crosses the blood–brain barrier (BBB) from plasma and, according to Fick’s law, can be expressed as the product of cerebral blood flow and tracer BBB extraction fraction (Renkin, 1959; Crone, 1963).
The BBB represents the main regulatory interface between the central nervous system and the immune system (Erickson et al., 2012). A growing body of evidence indicates its modulation or disruption as a common hallmark of neurodegeneration in neuroinflammatory conditions (Takata et al., 2021): a likely protective reduction of BBB permeability has been suggested as a response to mild peripheral cytokine levels (Turkheimer et al., 2023), while BBB leakage has been demonstrated in several brain disorders, such as multiple sclerosis (Kirk et al., 2003), neurodegenerative disorders (Zlokovic, 2008), and chronic inflammatory pain (Brooks et al., 2005).
The reasons above have motivated a recent interest in the investigation of K1 alterations. On the other hand, kinetic modeling in TSPO PET imaging is hampered by logistical considerations linked to the necessity to accurately quantify the metabolite-corrected blood input function. Blood input function requires invasive arterial sampling, which can cause discomfort to the participants, and laborious procedures for the counting of blood and plasma tracer concentrations, the extraction and quantification of radio-metabolites as well as the measurement of the tracer free plasma fraction (fp), i.e., the fraction of the tracer not bound to plasma proteins (Tonietto et al., 2016, 2019).
Many alternative blood-free approaches have been proposed in the past years to overcome the practical limitations of arterial blood-based methods. Among these is the use of an image-derived input function (IDIF). However, the actual use of the IDIF approach in research studies has been limited by several issues, primarily the challenge of deriving from the image the information on the tracer parent plasma fraction (PPf; Zanotti-Fregonara et al., 2011a, b; Volpi et al., 2023).
In this work, we propose a new non-invasive and simplified methodological framework for the computation of the rate K1, that consists of fitting a limited time window of the tracer kinetic after tracer injection (within 10 min), with a simplified model composed of a single irreversible compartment and a non-invasive IDIF (1T1K-IDIF). Validation was performed on two second-generation TSPO PET tracers, namely [11C]PBR28 and [18F]DPA714, on dynamic scans gathered from three different PET centers (the Centre for Neuroimaging Sciences at King’s College London, the Athinoula A. Martinos Center of Biomedical Imaging, Massachusetts General Hospital, and the Paris Brain Institute, Sorbonne University). Model evaluation encompassed three main steps: (1) comparison of 1T1K-IDIF to standard-reference 2T4K-Cp kinetic modeling; (2) application of 1T1K-IDIF approach to the study of K1 alterations linked to peripheral inflammation on [11C]PBR28 PET scans for which a statistically significant reduction of the gray matter influx rate measured by the standard kinetic methodology was previously reported (Turkheimer et al., 2021); (3) evaluation of the reproducibility of 1T1K-IDIF estimates on test–retest [18F]DPA714 PET data.
2 Materials and methods
2.1 Methodological framework
The current standard for the quantification of the influx rate constant for TSPO PET tracers is the use of the reversible two tissues compartmental model, with metabolite corrected plasma input function (Cp), to fit the tissue whole-dynamic TAC (2T4K-Cp; Figure 1A).
Here, we propose a simplified quantification approach consisting of the estimation of the K1 kinetic parameter via fitting of the first minutes (within 10 min) of the tracer kinetic in the tissue. This methodological framework was readapted from a previous research project performed in the context of β-amyloid PET imaging (Silvestri, 2018). With the aim of deriving a completely non-invasive procedure, the method relies on 3 different assumptions:
1. Within the first minutes after the injection, it is reasonable to assume that exchanges between the first and the second compartment and the venous efflux have not yet occurred, or if it is so, that their effect on the dynamics is negligible. In this framework, the kinetic of the tracer is mostly reflecting the tracer influx from blood to the brain parenchyma and the two tissues reversible compartment model can be reduced to a model with only one irreversible compartment. The model equation can be further simplified through the deletion of the parametrization of the fraction of blood volume (Vb = 0), which brings to the definition of the final linear model for the estimation of K1 parameter (1T1K-Cp, Figure 1B). Of note, the assumption of null Vb, while commonly applied in the context of brain PET parametric imaging (voxel resolution), represents a relevant approximation in the case of region-of-interest (ROI) analysis.
2. In a limited time-window after tracer injection, the production of metabolites from the parent radiotracers is still limited (Tonietto et al., 2016; Peyronneau et al., 2023). In the case of many PET tracers, it is possible to identify a specific time window after tracer injection in which the impact of the metabolites on the PPf is still negligible (<10%) as compared to the total parent. If the concentration of metabolites is negligible, we can also assume an even tracer distribution between red blood cells and plasma that is generally, but not solely, driven by polar radioactive molecules. Hence, we can assume the whole blood tracer concentration (Cb) as a reasonable approximation of the parent plasma tracer concentration and use it as the input function of the model (1T1K-Cb; Figure 1C).
3. In this framework, by the adoption of a robust protocol for image-derived input function extraction and by assuming that the computed IDIF is a good approximation of the Cb, it can be adopted as the input function of the compartmental model (1T1K-IDIF; Figure 1D), providing a completely blood sampling free method for the estimation of the K1 parameter. IDIF from brain PET protocols is known to generally represent a poor alternative to Cp, especially in the case of low spatial and temporal resolution of dynamic images of traditional brain PET scanners (Volpi et al., 2023). This third assumption is thus expected to be the most penalizing, with performances of the K1 estimation highly dependent on the ability to retrieve a reliable estimate of the IDIF.
2.2 Study participants and data acquisition
Five datasets were adopted in this study. In total, 159 [11C]PBR28 PET imaging scans from two independent research centers (King’s College London (KCL) and Athinoula A. Martinos Center for Biomedical Imaging, Massachusetts General Hospital (MGH)) and 18 [18F]DPA714 scans from the Paris Brain Institute of Sorbonne University (ICM) were included.
All PET imaging sessions were acquired with a continuous dynamic acquisition, from 0 to 90 min after a bolus injection of the tracer. For all participants (but one subject from the ICM [18F]DPA714 dataset), arterial blood data were sampled via radial artery catheter at the time of the scan and corrected for metabolites. PET data reconstruction varied across imaging sites and scanner types, but all included correction for random and scattered coincidences and tissue attenuation.
Given the genetic rs6971 polymorphism of the TSPO gene, which conveys different affinity profiles for TSPO radioligands [high affinity binder (HAB), mixed affinity binder (MAB), or low affinity binder (LAB; Wimberley et al., 2021)], all participants were genotyped before scanning, and only HABs and MABs were retained for further analysis.
With the purpose of tissue segmentation and ROIs parcellation, structural T1-weighted (T1w) Magnetic Resonance (MR) images were also acquired for each participant (simultaneously to PET acquisition at MGH, in separate visits at KCL and ICM). Studies were approved by local ethics committees and institutional review boards prior to start, and all participants provided informed consent after reading a full description of the study.
2.2.1 KCL [11C]PBR28 data
A total of 108 dynamic [11C]PBR28 PET and MR images were shared by KCL. Available data included a dataset of 94 scans (Dataset 1) collected in healthy volunteers and psychiatric patients gathered from KCL historical database (Age: 34 ± 14 years; Sex: 62 male and 32 female; Genotype: 63 HABs and 31 MABs; Clinical population: 65 healthy controls, 14 subjects at ultra-high risk of psychosis, 15 patients with schizophrenia). A second dataset (Dataset 2) was composed of [11C]PBR28 dynamic PET and MR scans on 7 healthy controls (Age: 30 ± 6 years; Sex: 7 male; Genotype: 7 HABs), who each received scans before and 24 h after an immune challenge performed via subcutaneous injection of IFN-α 2a (Roferon-A 3 million IU/0.5 mL solution for injection).
Details on participants and data acquisition for the two datasets can be found in Bloomfield et al. (2016); Dahoun et al. (2019); and Nettis et al. (2020). In brief, all acquisition protocols included an initial low-dose computer tomography (CT) scan, acquired for attenuation and scatter correction, using a Siemens Biograph™ TruePoint™ PET·CT scanner (Siemens Medical Systems, Germany; transaxial field of view (FOV): 60.5 cm, axial FOV: 16.2 cm), followed by a 90 min dynamic PET scan after a bolus injection of [11C]PBR28 (Injected Dose: 329.30 ± 27.43 MBq). Dynamic PET data were binned into 26 frames (durations: 8 × 15 s, 3 × 1 min, 5 × 2 min, 5 × 5 min, 5 × 10 min), reconstructed using filtered back projection, with a 5 mm isotropic Gaussian smoothing, and corrected for random noise, attenuation, and scatter effects. Radio-pharmaceutical preparation acquisition protocol was consistent for all the studies. T1w MR brain scan data were collected using a Siemens 3-T MR scanner on either a Siemens Tim Trio or Siemens MAGNETOM Verio.
Arterial blood data were sampled using the combination of an automatic continuous sampling system of the whole blood activity for the first 15 min of each scan, and a series of discrete blood samples, manually taken at 5, 10, 15, 20, 25, 30, 40, 50, 60, 70, 80, and 90 min. Manual samples were centrifuged and used to determine the plasma over blood activity ratio (POB). Samples taken at 5, 10, 20, 30, 50, 70, and 90 min were also analyzed using radio-high performance liquid chromatography (HPLC) to calculate the PPf. The MIAKAT software (MIAKAT™)1 was adopted for blood data processing: subjects’ Cb were defined by combining and calibrating continuous and discrete whole blood data; a linear and a sigmoid model were, respectively, fitted over POB and PPf discrete samples and applied for the definition of uncorrected plasma activity (Cp_uncor) and Cp for each subject.
2.2.2 MGH [11C]PBR28 data
MGH dataset (Dataset 3) included dynamic [11C]PBR28 PET/MR images from 51 individuals [Age: 55 ± 16 years; Sex: 27 male and 24 female; Genotype: 31 HABs and 20 MABs; Clinical population: 10 Healthy Controls, 41 subjects with chronic musculoskeletal pain (low back pain, N = 26; knee osteoarthritis, N = 15)] simultaneously collected on a Siemens Biograph mMR whole-body PET/MR scanner (transaxial FOV: 59.4 cm; axial FOV: 25.8 cm). Full details on participant inclusion criteria and data acquisition can be found in original references (Weerasekera et al., 2021; Morrissey et al., 2023).
For all these studies dynamic PET data were acquired for a time period of 0–90 min after a bolus injection of [11C]PBR28 (Injected Dose: 523.60 ± 48.66 MBq), binned into 27 frames (duration: 8x10s, 3x20s, 2x30s, 1x1min, 1x2min, 1x3min, 8x5min, 3x10min) and reconstructed using the Ordered Subset Expectation Maximization (OSEM) with four iterations, 21 subsets, and a 3 mm Full Width Half Maximum (FWHM) Gaussian smoothing. Structural T1w images were used for the generation of attenuation correction maps using an in-house developed magnetic resonance-based approach (Izquierdo-Garcia et al., 2014).
Blood samples were collected at 5, 10, 20, 30, 50, 70, and 90 min post radiotracer injection. In 16 subjects, arterial blood processing was performed using a HyperSep C18 solid extraction cartridge for separation of radio-metabolites from parent radiotracer; in 36 subjects, HPLC was used instead. For each scan, Cp_uncor was obtained from collected blood samples and corrected for metabolites to compute the Cp. Cb was not available for these participants.
2.2.3 ICM [18F]DPA714 data
[18F]DPA714 dynamic PET and MR scans acquired on 10 healthy volunteers at SFHJ, CEA, Orsay, were shared by the ICM center. Details on acquisition protocol are available in García-Lorenzo et al. (2018) and Lavisse et al. (2015).
For all participants, after a transmission scan using a 137Cs point source, a [18F]DPA714 slow bolus was intravenously injected over 1 min (Injected Dose: 203.05 ± 25.41 MBq) and subjects underwent dynamic PET scans in a high-resolution research tomograph (HRRT, Siemens, Knoxville, TN, United States; transaxial FOV: 31.2 cm, axial FOV: 25.5 cm) at SHFJ-CEA, Orsay. PET images were corrected for attenuation, random and scattered coincidences, reconstructed with the iterative ordered-subset expectation maximization (Ordinary Poisson [OP]-OSEM) 3D method, and binned into 27 time frames (durations: 6 × 1 min, 7 × 2 min, 14 × 5 min). A 3D Gaussian kernel with 2 mm FWHM was used as a point-spread function correction. Each participant underwent T1w MR imaging, performed with either a Philips (Best, The Netherlands) Achieva 1.5 T MR scanner or a Siemens Trio 3 T (Erlangen, Germany) scanner.
Eight of the participants underwent a second [18F]DPA714 dynamic PET to generate test–retest data (Dataset 4; Age: 44 ± 13 years; Sex: 2 male and 6 female; Genotype: 6 HABs and 2 MABs). For all participants, the second acquisition was performed between 5 and 67 days after the first visit, with a dose difference between the two acquisitions of 21.29 ± 18.95 MBq.
Metabolite-corrected and uncorrected plasma curves were generated only for 9 of the 10 subjects (Dataset 5; Age: 39 ± 13 years; Sex: 4 male and 5 female; Genotype: 5 HABs and 4 MABs). During PET scan acquisition, 21 sequential arterial blood samples were manually sampled and 7 of them (at 5, 10, 20, 40, 60, 70 and 90 min) analyzed as described in Peyronneau et al. (2023) to determine the PPf, Cp_uncor, and Cp activity for each subject. As for MGH dataset, Cb was not available for these participants.
2.3 Image pre-processing
Data were analyzed by each individual site using different combinations of in-house codes and neuroimaging analysis software including Statistical Parametric Mapping 8,2 FSL3 and MIAKAT.
Despite these differences among the three centers, all pipelines included a step of motion correction of the dynamic PET data, the computation of integral PET images, the derivation of brain and gray matter masks from structural MR images—which was performed in all three cases using FreeSurfer package—and the registration of brain and tissues masks to the subject’s native PET space.
A neuroanatomical atlas was implemented and co-registered on the subject’s PET native space for the definition of ROIs. In detail, 46 cortical and 2 cerebellum ROIs (left and right hemisphere) defined by CIC neuroanatomical atlas version 2.0 (Tziortzi et al., 2011) were considered in the case of [11C]PBR28 data; 68 cortical and 1 cerebellum ROI defined by the Desikan-Killany atlas included with FreeSurfer (Desikan et al., 2006) were adopted for the [18F]DPA714 data. Mean regional TACs were computed for each subject.
2.4 Image-derived input function and blood data analysis
An image-derived input function was also calculated from each of the processed dynamic PET scans in the PET naïve space. The first step in the IDIF computation consisted of the segmentation of the arterial carotid siphons. This step was performed via intensity thresholding of early dynamic PET frames. In the case of KCL and MGH data, a preliminary crop mask was defined to delineate an anatomical area including the siphons, and then the siphons mask was defined by selecting the voxels belonging to the crop mask with the highest intensity in the early PET frames. In the case of ICM scans a manual segmentation of the internal carotids was already available. However, for consistency with the previous method, we decided to still perform a selection of the voxels belonging to the manual carotid mask with an intensity equal to or higher than 20% of the maximum value shown by the voxels in the so-defined ROI.
For each voxel, we computed the one-versus-all correlation of the voxels TACs and we heuristically selected 70% of voxels with the more correlated dynamics: this step was aimed at excluding the voxels with highly noisy dynamics. In the case of MGH data, where the number of selected voxels was highly variable among the subjects, a further step consisting of the selection of 30 voxels with the highest peak amplitude was performed; this step showed to guarantee a better description of the peak of the input function curve. IDIF was finally derived by averaging the TACs of all voxels resulting from the selection.
Since compartmental modeling assumes a noise-free input function, IDIF for each subject was finally fitted using the tri-exponential model, employing a linear regression for the rising part of the curve and a sum of three exponentials for the descending part of the curve (Parsey et al., 2000). Representative IDIFs are reported in Supplementary Figure 1.
Population PPf curves were computed for both [11C]PBR28 and [18F]DPA714. This step was aimed at investigating the presence of a time window after tracer injection in which the production of metabolites is negligible (i.e., Hypothesis #2 of our methodological framework). Population curves were derived by averaging PPf data from [11C]PBR28 dynamic PET scans of 72 healthy subjects (KCL Dataset 1 and Dataset 2, pre INF-α) and [18F]DPA714 PET scans of 9 healthy volunteers (ICM Dataset 5). Only in the case of KCL data, for which individual POB curves were available, population POB curves were computed from data of the 72 healthy subjects.
2.5 Model validation
All model fitting and statistical analyses were performed using MATLAB (MathWorks), although slightly different versions were adopted for the three PET centers: Matlab2017b for KCL, Matlab2023a for MGH and Matlab2022b for ICM. This discrepancy was the consequence of software and license availability on each site.
2.5.1 Comparison with standard blood-based K1 estimates
As a first step in the validation, the performance of the proposed methodology in the estimation of K1 parameter was evaluated by comparison to the standard reference 2T4K-Cp estimates. This step was performed on Dataset 1,3,5. K1 regional estimates were computed for each subject’s ROIs, and bias introduced for each hypothesis of the proposed simplified method (Figure 1) was sequentially tested. Firstly, we tested whether the one irreversible compartment applied to early frames of the PET dynamics gave comparable results to those obtained with the full compartmental model and the true parent plasma adopted as input function (1T1K-Cp K1). Then, the effect of the assumptions of metabolites production and red blood cells uptake negligibility was tested by computation of the K1 using the whole blood input function (1T1K-Cb K1). To note, information on the whole blood TACs was available only in the case of KCL scans. For MGH and ICM datasets the uncorrected plasma tracer concentration was adopted instead. Finally, regional K1 parameters were computed with IDIF as input to the reduced model (1T1K-IDIF K1).
In all the cases, the a priori definition of the time window to use for model fitting was necessary. This choice was based on a trade-off between the opposite necessities to limit the model fit to a short time window, such that the model hypotheses were respected, and to include enough data points for model fitting. Ultimately the time window selection had to account for differences in the speed of the kinetics for the two employed tracers and in the frame binning of dynamic PET scans. The time window was selected for each tracer as the interval following tracer administration in which the parent plasma fraction was >90%. ROIs TACs were also visually inspected with the purpose of ensuring the applicability of Hypothesis #1 of our methodological framework. This resulted in a time window of around 4 min for [11C]PBR28 and 8 min for [18F]DPA714.
Standard 2T4K-Cp K1 estimates were finally computed by fitting the whole 0-90 min tracer kinetic using a weighted non-linear least-square estimator with weights chosen optimally as
as suggested by Carson et al. (1983), where ti is the time instant, Δti is the length of the scanning interval and CROI (ti) is the ROI average time activity at time ti. Both Cp or Cb input functions were corrected for delay (i.e., the variable time of appearance of tracer radioactivity in blood depending on the time required for the tracer to travel from the arterial sampling site to the region of interest; Iida et al., 1988).
To complete the corollary on K1 analysis, assuming the cerebellum gray matter (CER) as a representative pseudo-reference region (Lyoo et al., 2015), the K1 ratio
was also computed for each method and each cortex ROI. The relative measure R1 was introduced for completeness and consistency with previous PET studies where the R1 measure can be used as a proxy of relative perfusion (Chen et al., 2015). However, it is important to highlight that the identification of a proper reference region remains not trivial, especially for TSPO studies, and disease specific (Albrecht et al., 2018).
Results obtained with each of the three simplified approaches (1T1K-Cp, 1T1K-Cb, 1T1K-IDIF), in terms of both ROIs K1 and R1 estimates, were compared to the respective standard 2T4K-Cp estimates by computation of bias and relative bias in absolute value (bias and relBias) and both intra- and between-subjects Pearson’s coefficients of correlation (ρIntra, ρBetween).
A multilinear regression model was finally estimated, describing the subjects’ mean relBias (averaged across ROIs) between the 1T1K-IDIF and the 2T4K-Cp K1 estimates, in terms of subjects’ age, genotype classification, sex, PET center where the acquisition was performed, and the ratio between the area under the curve of IDIF and Cp over the specific time window selected for fitting (AUCratio). Regression analysis was performed using the fitglm function (Matlab2023a, Mathworks). Predictors and response variables were rescaled to the same range [0 1]. In the case of categorical variables (genotype classification, gender, PET center), with L number of categories assumed by the categorical variable, the first category is assumed as the reference level, and the remaining L – 1 are included as indicator variables in the model and treated as a single variable.
1T1K-Cp, 1T1K-Cb, and 1T1K-IDIF model fitting were repeated using different time intervals, ranging from 2 to 5 min in the case of [11C]PBR28 (Dataset 1) and from 3 to 9 min for [18F]DPA714 (Dataset 5). The sensitivity of model performance to the choice of the fitting window was investigated for each of the reduced models in terms of between-subjects and intra-subject correlation of K1 and R1 estimates and bias of K1 estimates with respect to reference full model (2T4K-Cp), and precision of K1 estimates.
Additionally, 1T1K K1 estimation, with each of the three input functions, was repeated for [11C]PBR28 scans (Dataset 1) with the inclusion in the model of the parametrization of the fraction of blood volume (1T1KVb) and compared with the previous 1T1K-Cp, 1T1K-Cb and 1T1K-IDIF K1 estimates obtained under the hypothesis of null Vb.
Finally, the reversible one tissue compartment model (1T2K), with and without the Vb parametrization, was tested and results of 1T1K and 1T2K fitting were compared both in terms of goodness of fit and consistency of K1 estimates to standard 2T4K-Cp K1 estimates.
2.5.2 IFN-α challenge-[11C]PBR28 scans
For each subject, regional cortex 2T4K-Cp K1 and 1T1K-IDIF K1 estimates were computed from both pre and post IFN-α challenge dynamic PET scans (Dataset 2) and averaged across the cortical ROIs. Distribution across subjects of pre and post mean cortex K1 estimates were compared via a paired t-test following a test for normality (Lilliefors test).
2.5.3 Test–retest reproducibility of K1 estimates-[18F]DPA714 scans
To test the reproducibility of the results, regional 1T1K-IDIF K1 estimates were computed for both test and retest scans on a pool of 8 healthy subjects (Dataset 4). K1 estimates were computed for each subject (both test and retest scan) from mean TACs of 4 cortical brain lobes - frontal, temporal, occipital, and parietal -, insula, cerebellum, thalami, and brainstem. Pearson correlation coefficient (ρ) and mean root distance (MRD) were computed to compare K1 obtained for test and retest scans.
3 Results
3.1 Population PPf and POB curves
Population PPf and POB curves are reported in Figures 2, 3. Average PPf curve for healthy populations reaches a value equal to 0.90 between 3 and 4 min for [11C]PBR28, while the 0.90 threshold is crossed at about 8 min in the case of [18F]DPA714.
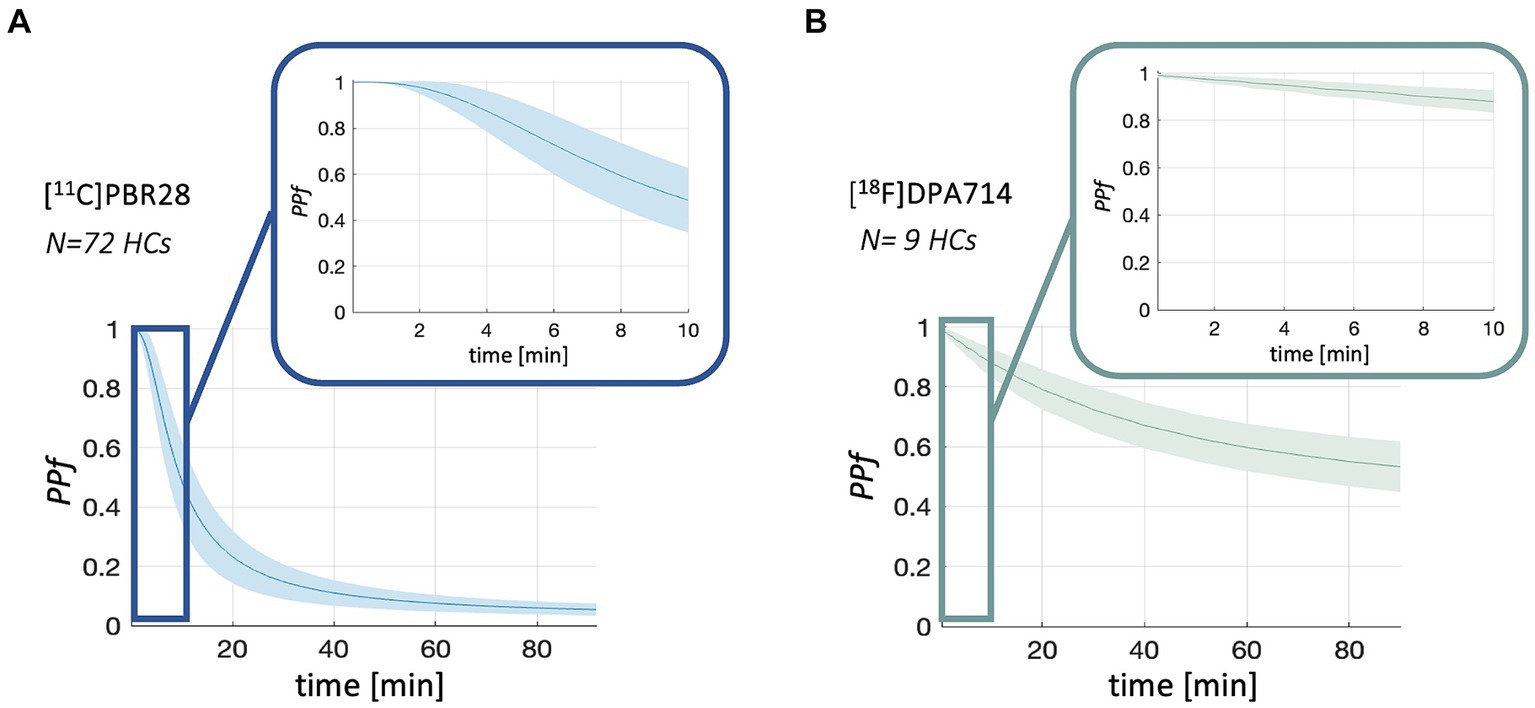
Figure 2. PPf population curves. Figure shows the mean (solid line) and standard deviation (shadowed band) of PPf curves for [11C]PBR28 (panel A) and [18F]DPA714 (panel B) in healthy controls (HCs) population.
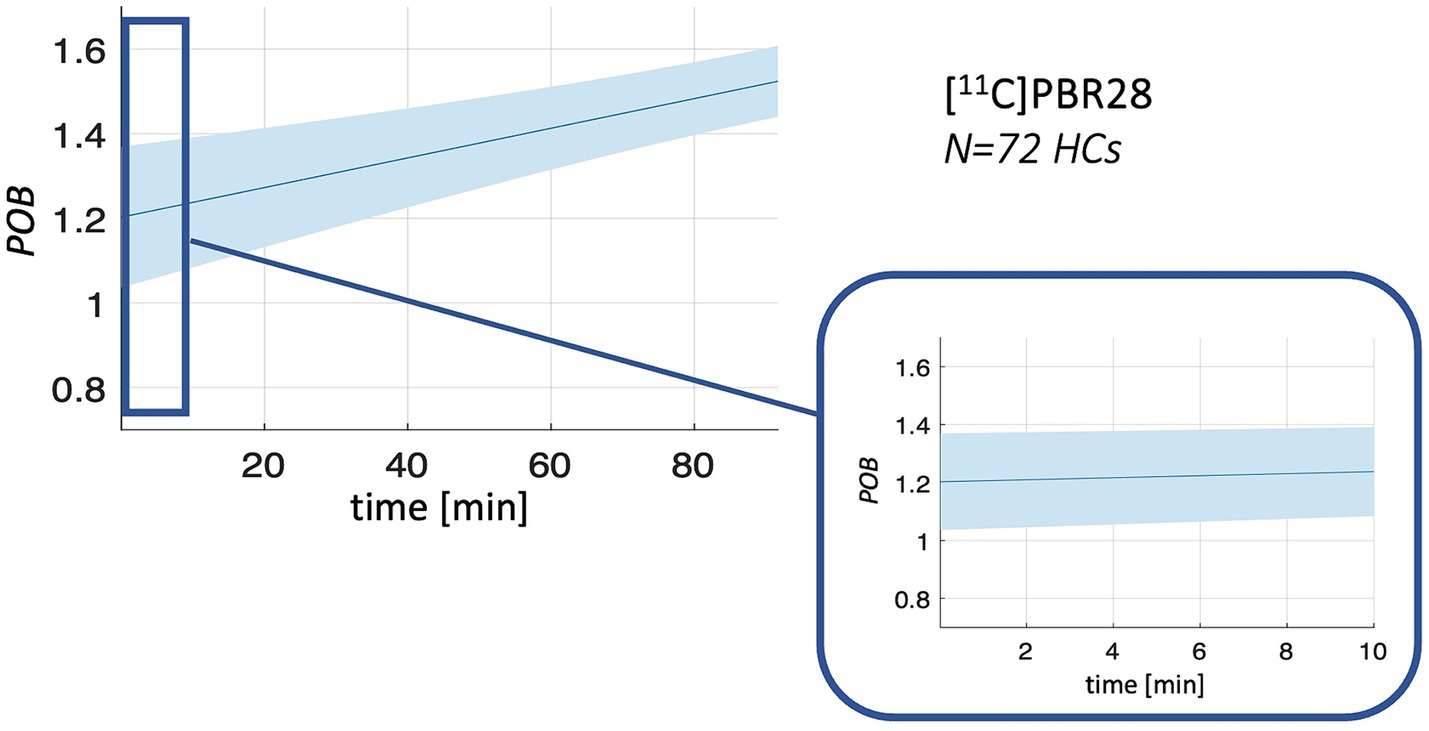
Figure 3. POB population curves. Figure shows the mean (solid line) and standard deviation (shadowed band) of POB curves for [11C]PBR28 in healthy controls (HCs) population.
3.2 Comparison with standard blood-based K1 estimates
Results of mean cortex K1 and R1 estimates obtained from the datasets of the 3 PET centers are reported in Figure 4, together with Bland Altman plots comparing the mean cortex 1T1K-Cp, 1T1K-Cb, and 1T1K-IDIF to the reference 2T4K-Cp K1 and R1 estimates.
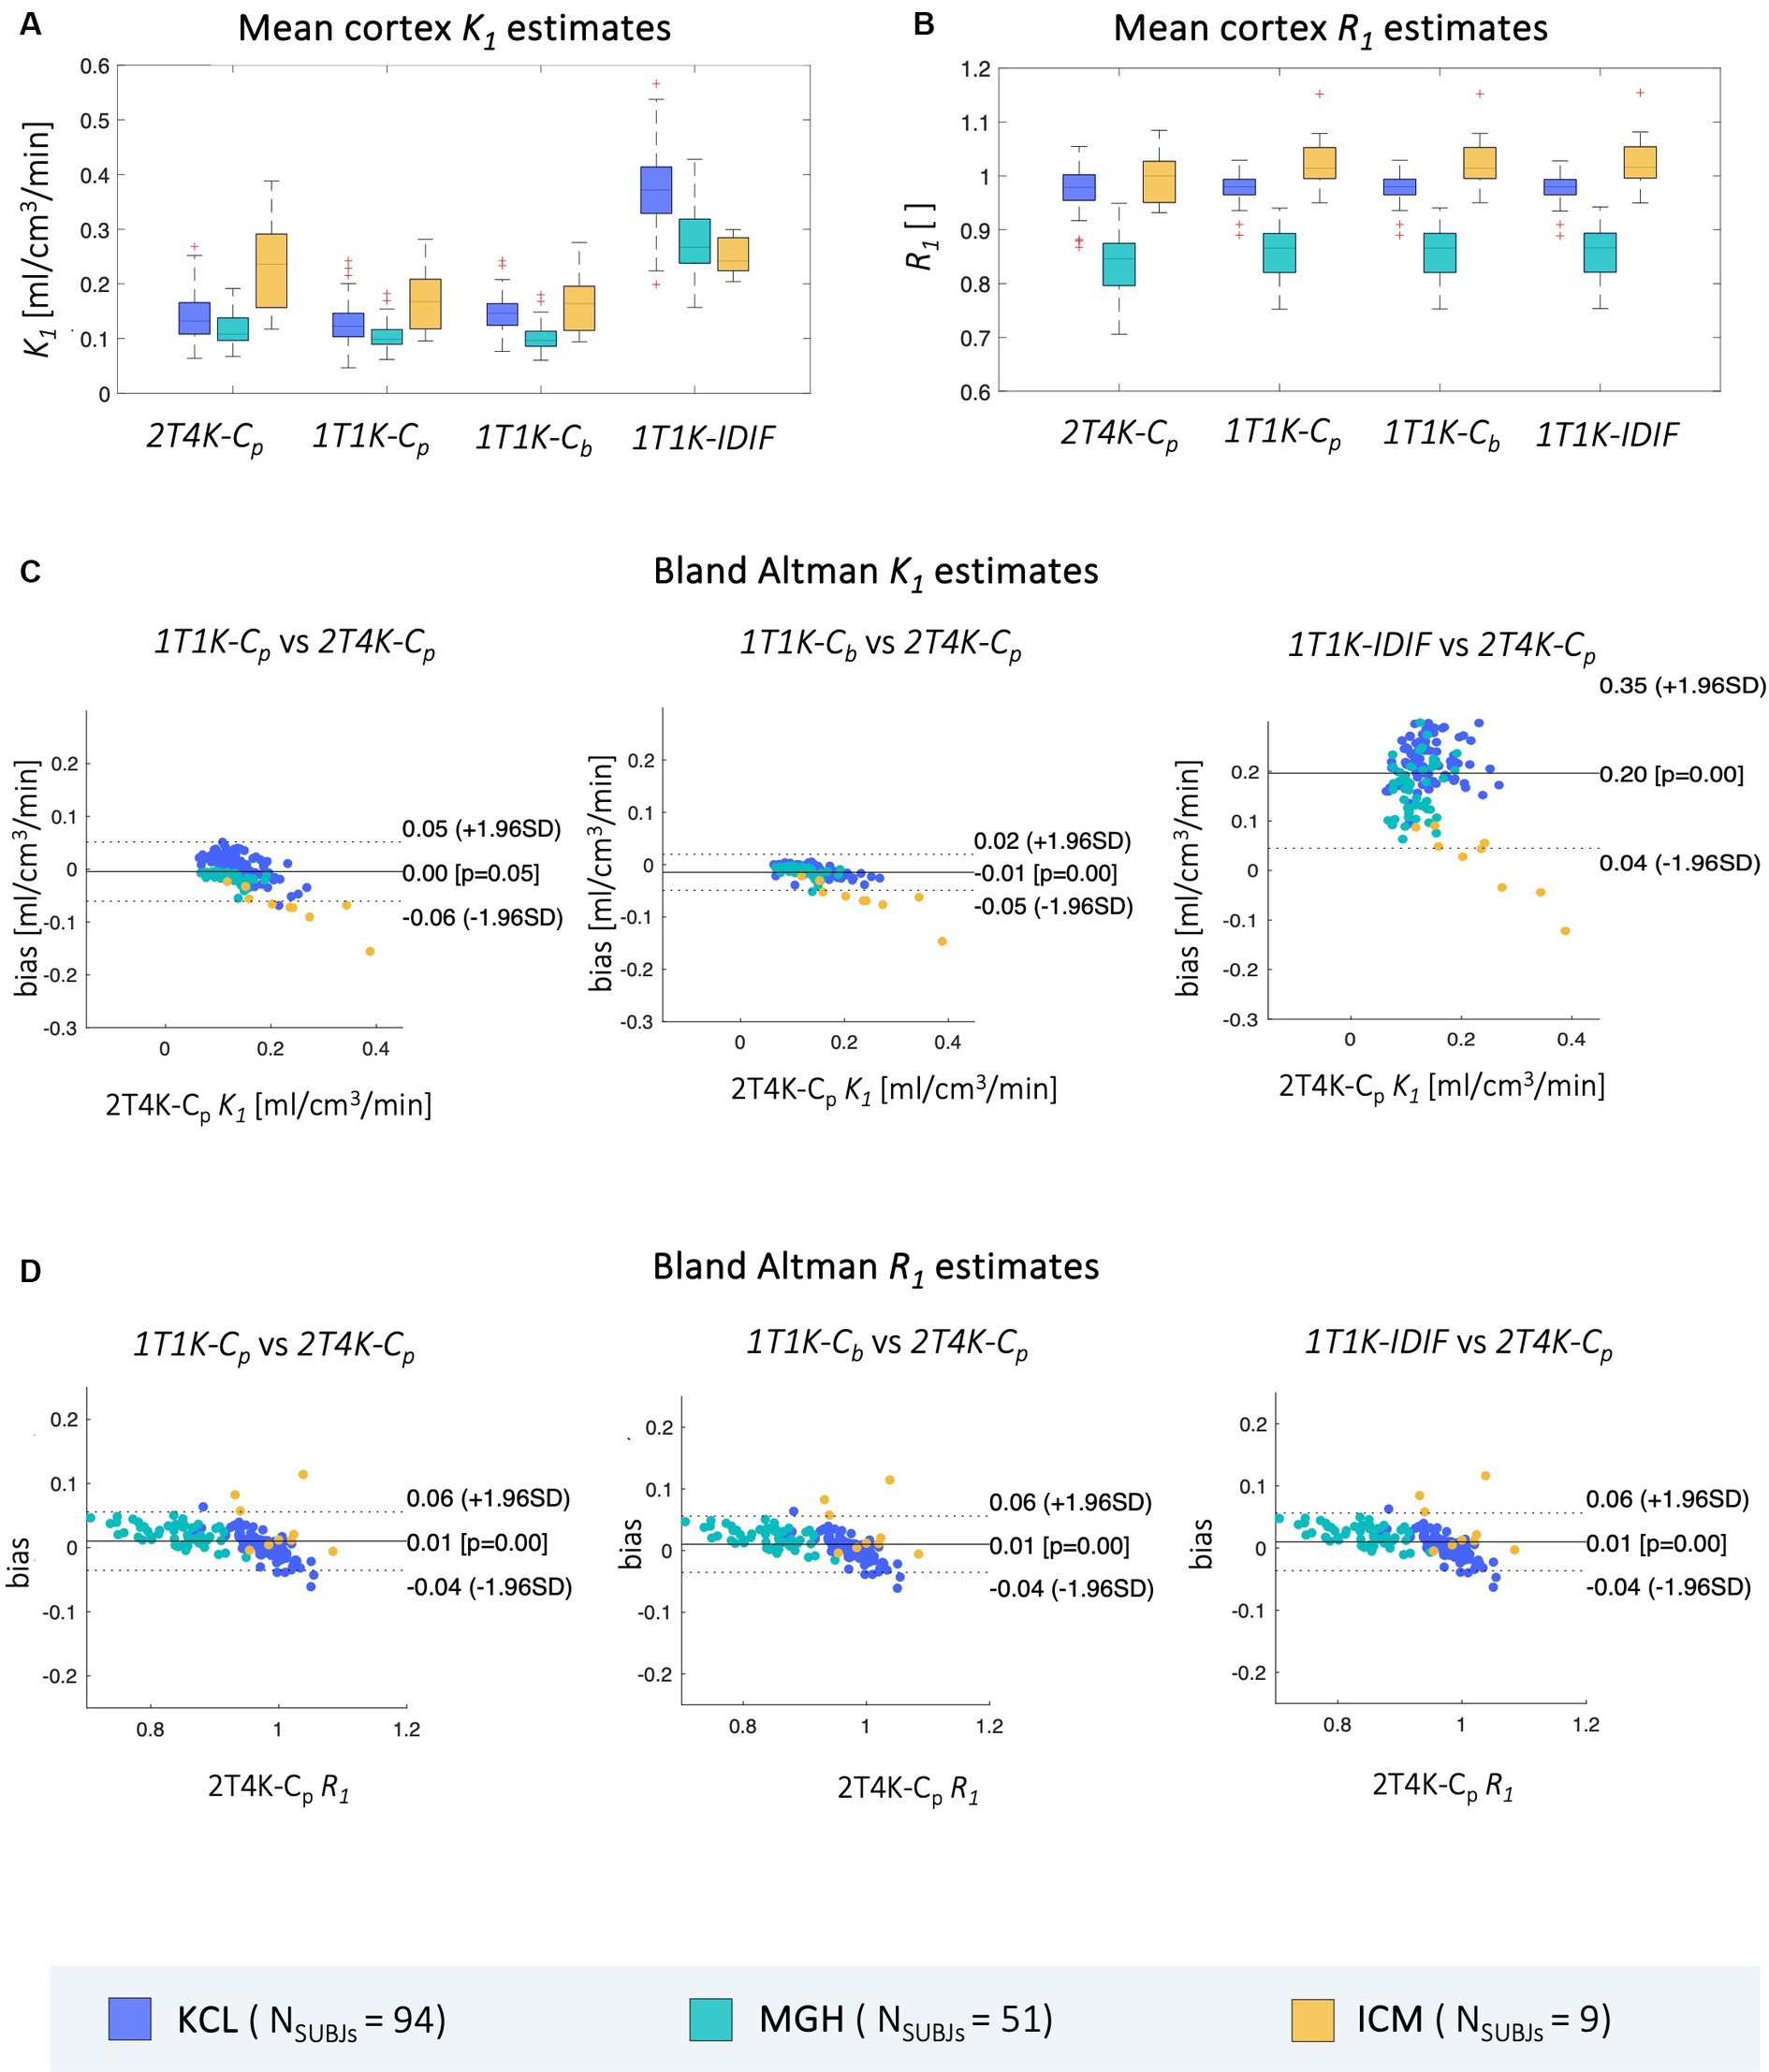
Figure 4. Comparison of mean cortex K1 and R1 estimates. Panel A,B show, respectively, the distribution across subjects of mean cortex K1 and R1 estimates computed via each of the aforementioned methods (2T4K-Cp, 1T1K-Cp, 1T1K-Cb, 1T1K-IDIF); panel C,D show the Bland Altman plots for the comparison between the results of each of the reduced methodologies (1T1K-Cp, 1T1K-Cb, 1T1K-IDIF) and the standard-reference 2T4K-Cp estimates for K1 and R1 respectively; results are shown in different colors for the three PET centers (KCL, MGH, ICM).
As for K1 estimates, the highest bias is observed for the 1T1K-IDIF K1 when compared with the ground truth 2T4K-Cp K1, with the biggest bias shown in the case of the KCL dataset and the lowest bias in the case of ICM data (relBias [min max] %: relBiasKCL = [64.38324.57], relBiasMGH = [49.18310.50], relBiasICM = [12.39 75.00]). relBias from 2T4K-Cp K1 estimates results significantly reduced when Cp (relBiasKCL = [1.86 36.14], relBiasMGH = [3.15 35.07], relBiasICM = [17.79 36.95]) and Cb (relBiasKCL = [3.23 47.64], relBiasMGH = [4.00 37.60], relBiasICM = [19.55 39.34]) are adopted as input to the 1T1K model, with an average relBias across subjects, respectively, of 10 and 16%. The relative bias for R1 estimates is under 16% for all comparisons and centers.
Relative bias between 2T4K-Cp and 1T1K-IDIF K1 estimates shows a statistically significant correlation with the AUCratio (Figure 5); genotype classification and scan site also result as significant predictors in the regression model (AUCratio: p = 1.29*10−8, tstat = −6.03; genotype (HAB w.r.t. MAB): p = 0.0004, tstat = −3.66; PET center (MGH w.r.t. KCL): p = 0.04, tstat = −2.06; PET center (ICM w.r.t. KCL): p = 0.0003, tstat = −3.69; adjusted R2 = 0.51).
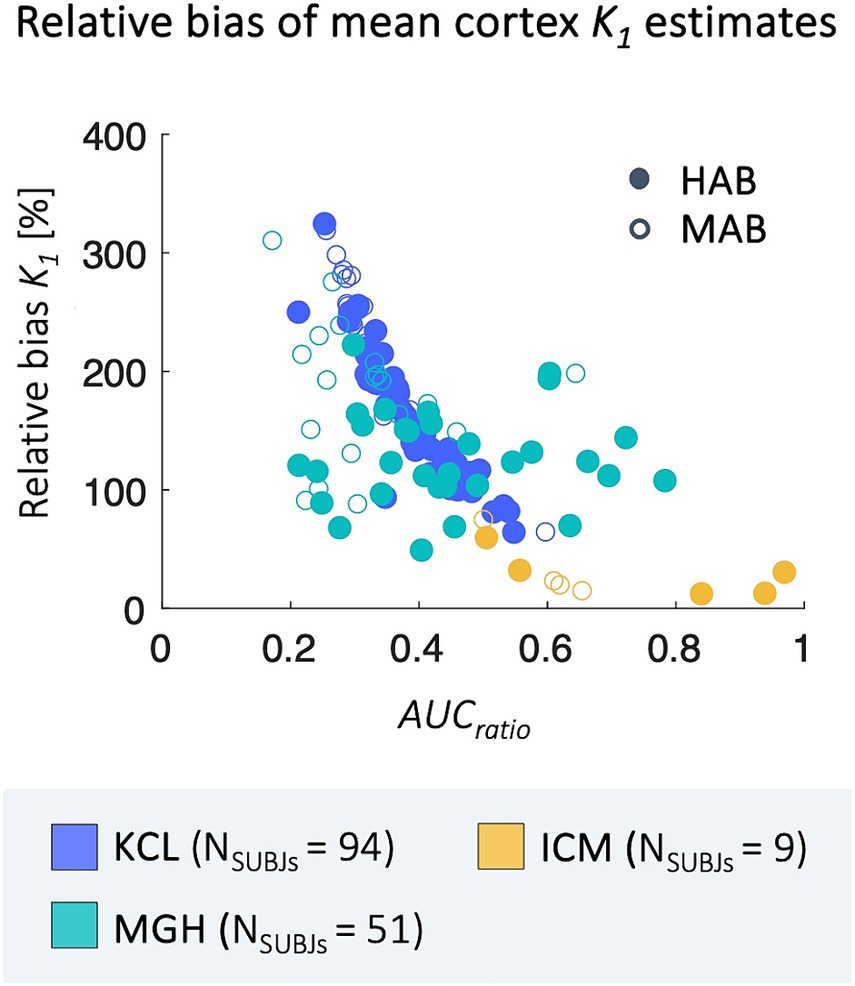
Figure 5. Correlation between relBias and AUCratio. Figure shows the correlation between subjects’ average relBias between the 1T1K-IDIF and the 2T4K-Cp K1 and respective values of AUCratio; results are shown in different colors for the three PET centers (KCL, MGH, ICM) and with different shapes for HAB and MAB subjects.
Between-subjects correlation analysis shows a similar pattern to bias, with the lowest Pearson’s coefficients reported when IDIF is adopted as the input function of the model. Comparable results are reported for the three sites (ρ = mean ± standard deviation; ρBetweenKCL = 0.66 ± 0.03, ρBetweenMGH = 0.63 ± 0.06, ρBetweenICM = 0.67 ± 0.11). When comparing 1T1K-Cb with 2T4K-Cp K1 estimates, KCL dataset shows the lowest correlation (ρBetweenKCL = 0.84 ± 0.02, ρBetweenMGH = 0.93 ± 0.04, ρBetweenICM = 0.94 ± 0.05) while comparable results among the three sites are shown for the between-subject correlation between 1T1K-Cp and 2T4K-Cp (ρBetweenKCL = 0.97 ± 0.01, ρBetweenMGH = 0.93 ± 0.04, ρBetweenICM = 0.94 ± 0.04; Figure 6A). As for the R1 estimates, model performance in terms of between-subject correlation resulted almost independent from the input function adopted (ρBetweenKCL = 0.7 ± 0.1, ρBetweenMGH = 0.9 ± 0.1, ρBetweenICM = 0.6 ± 0.3; Figure 6B).
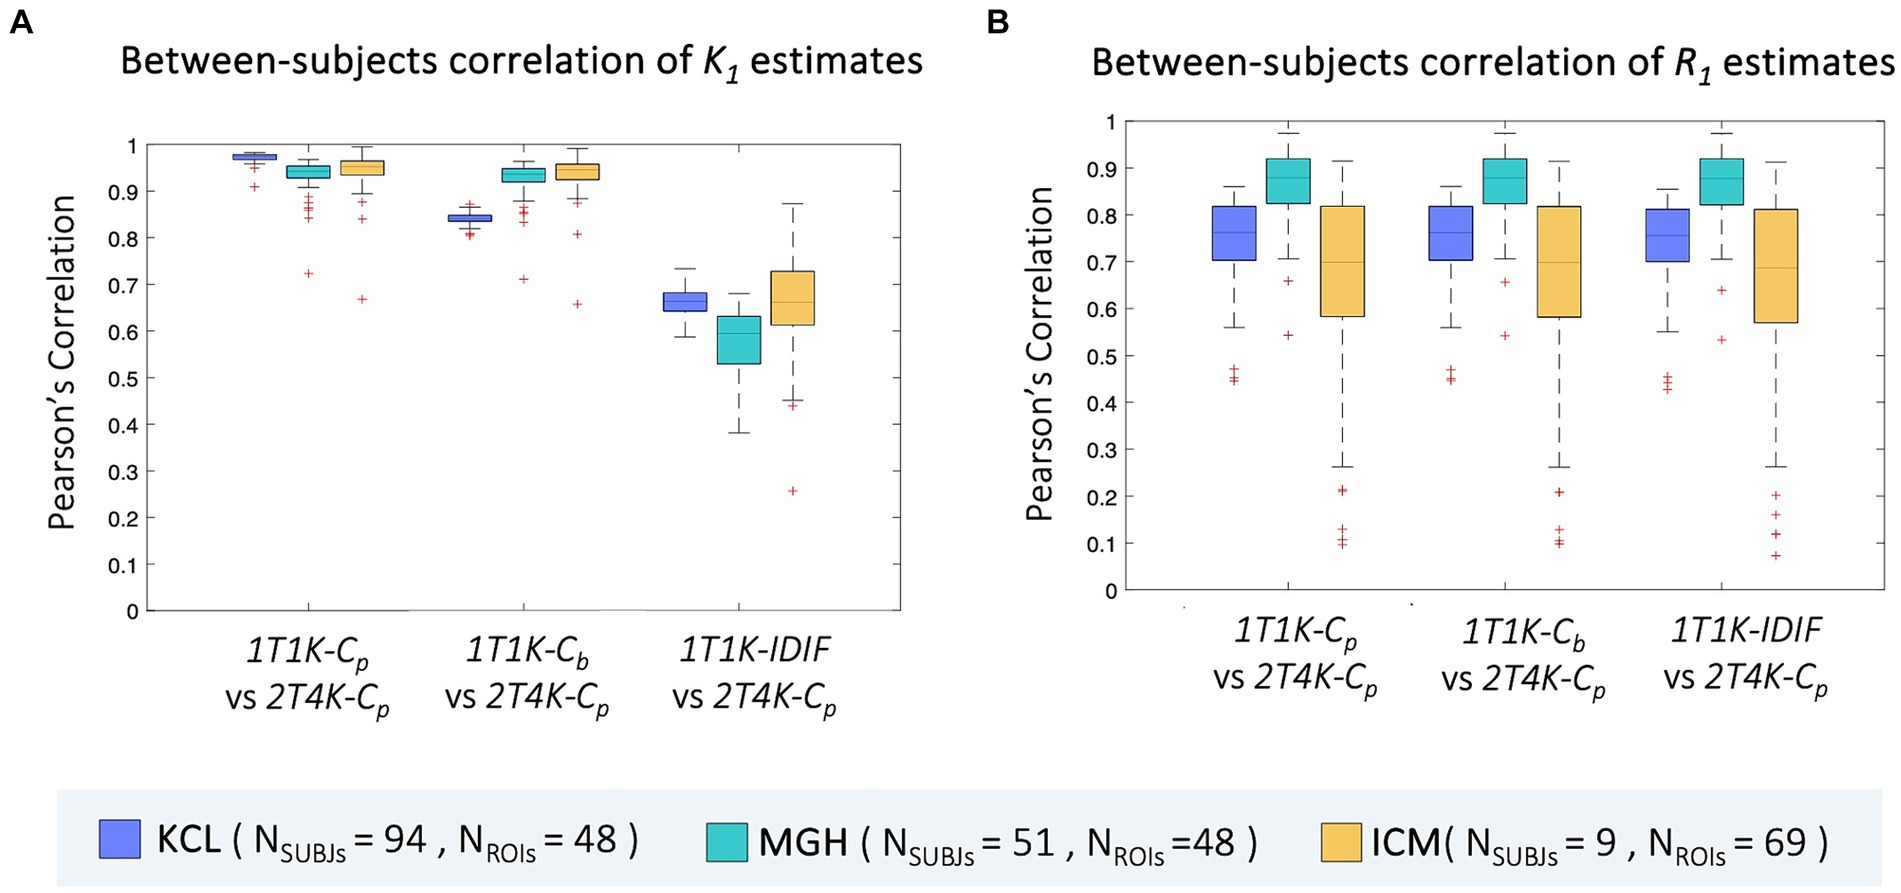
Figure 6. Between-subjects correlation of ROIs K1 and R1 estimates. Panel A,B show, respectively for the ROIs K1 and R1 estimates, the distribution of the between-subjects Pearson’s correlation coefficients between each of the reduced models (1T1K-Cp, 1T1K-Cb, 1T1K-IDIF) and the full model (2T4K-Cp); results are shown in different colors for the three PET centers (KCL, MGH, ICM).
Good-to-high intra-subject correlations were reported between the regional K1 estimates obtained with the simplified and full model, independently from the input function adopted (ρIntraKCL = 0.93 ± 0.07, ρIntraMGH = 0.94 ± 0.08, ρIntraICM = 0.89 ± 0.13; Figure 7).
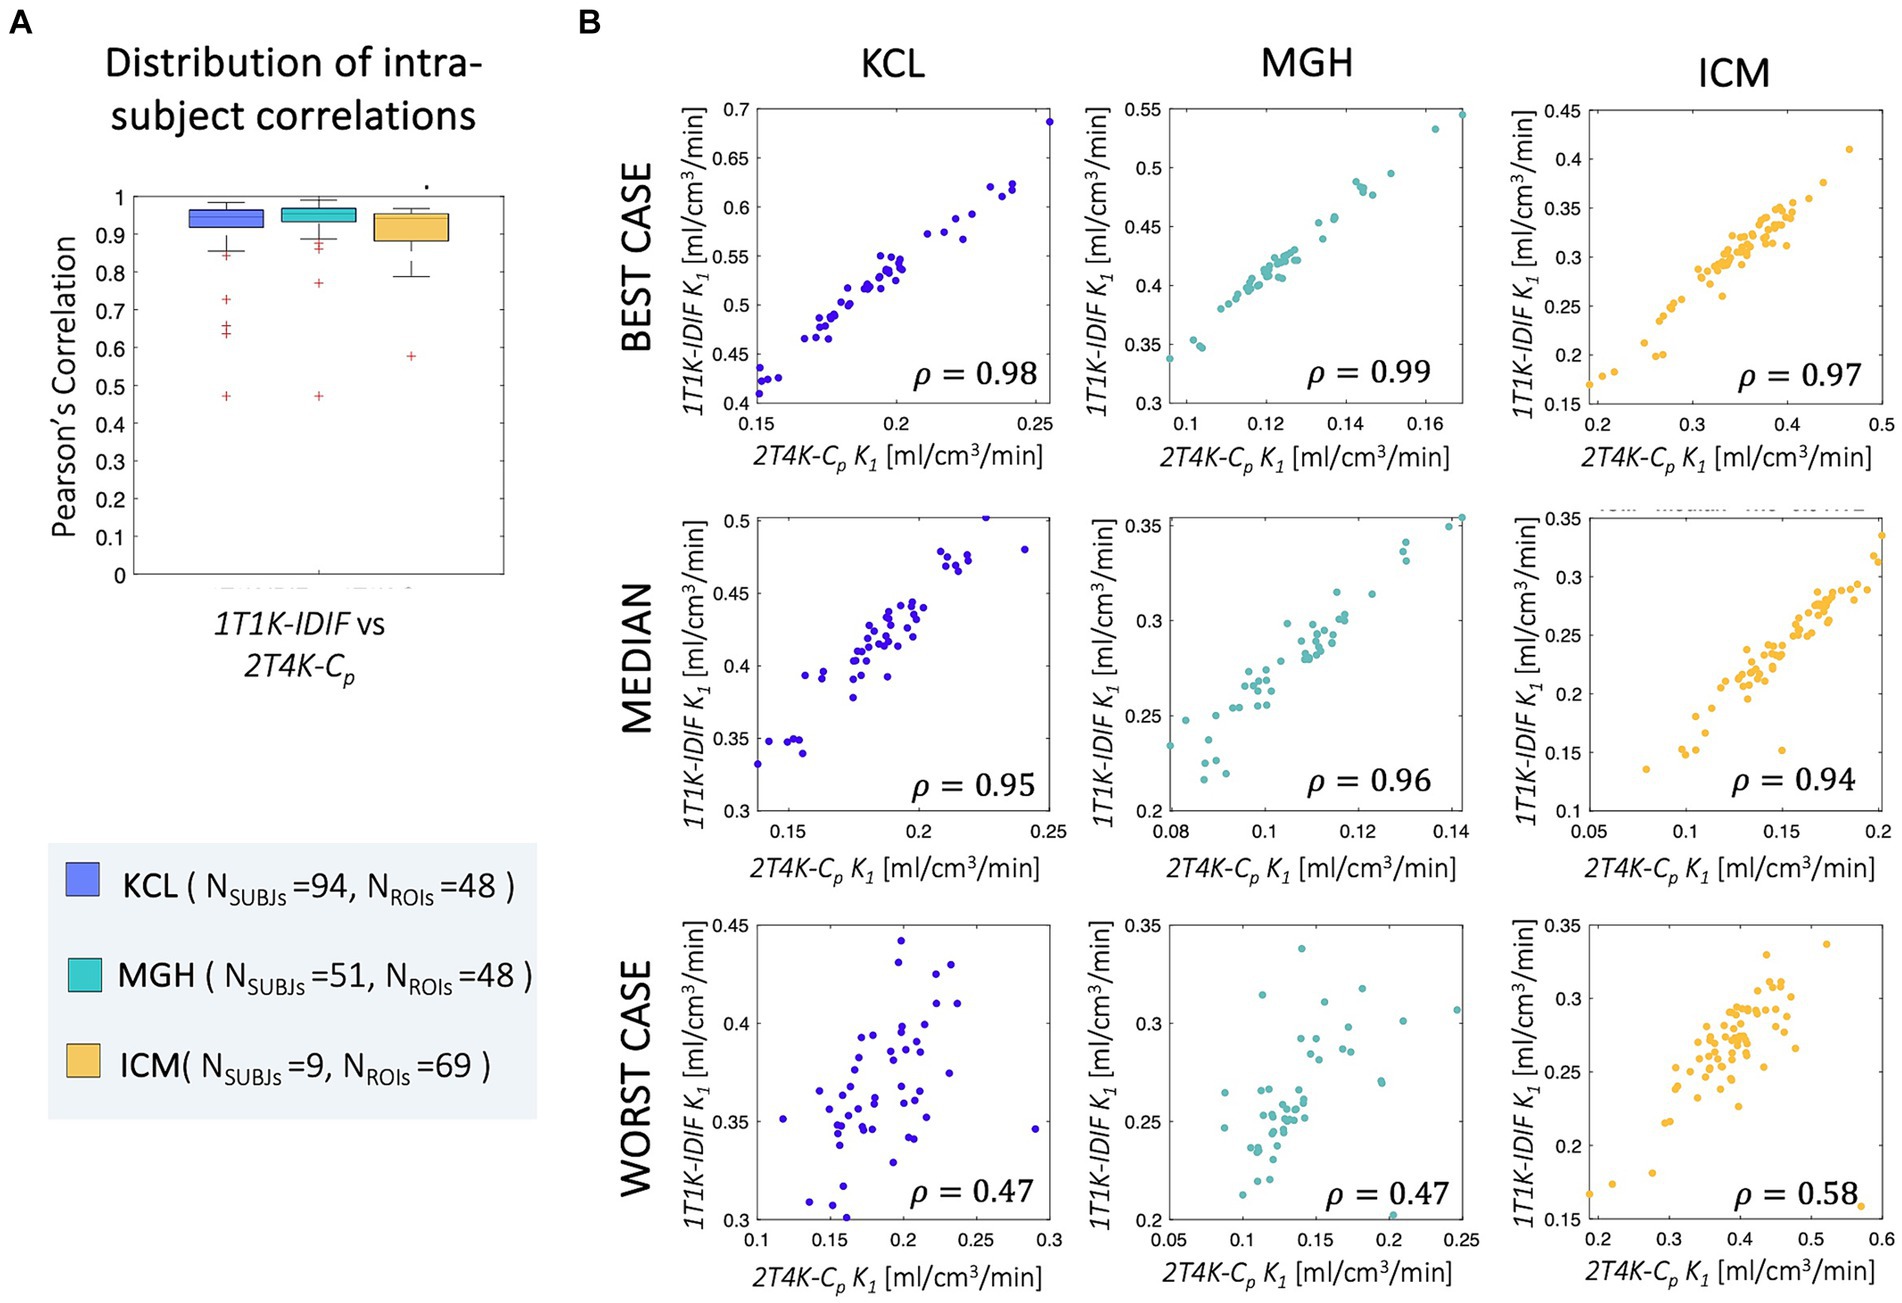
Figure 7. Intra-subject correlation of ROIs K1 estimates. Panel A shows the distribution of the intra-subjects Pearson’s correlation coefficients between 1T1K-IDIF and 2T4K-Cp regional K1 estimates; panel B shows representative examples of the intra-subject correlation between 1T1K-IDIF and 2T4K-Cp regional K1 estimates; results are shown in different colors for the three PET centers (KCL, MGH, ICM).
3.3 IFN-α challenge-[11C]PBR28 scans
Despite the limitations of 1T1K-IDIF methodology in providing an absolute estimate of the K1 parameter, consistent with previous results, comparisons of mean cortex K1 estimates before and 24 h after the injection of INF-α revealed a significant difference in terms of both 2T4K-Cp (paired t = 5.61; p = 0.001) and 1T1K-IDIF (paired t = 3.42; p = 0.01) estimates. Figure 8 shows the distribution across subjects of average cortex K1. The higher inter-subject variability of 1T1K-IDIF with respect to 2T4K-Cp K1 estimates hampers the identification of group effects, thus resulting in lower statistical power when comparing the K1 parameter in physiological on peripherally inflamed conditions (for 2T4K-Cp: Cohen’s d effect size = 1.08 and relative difference = −29% K1 estimates; for 1T1K-IDIF: Cohen’s d effect size = 0.75 and relative difference = −13%).
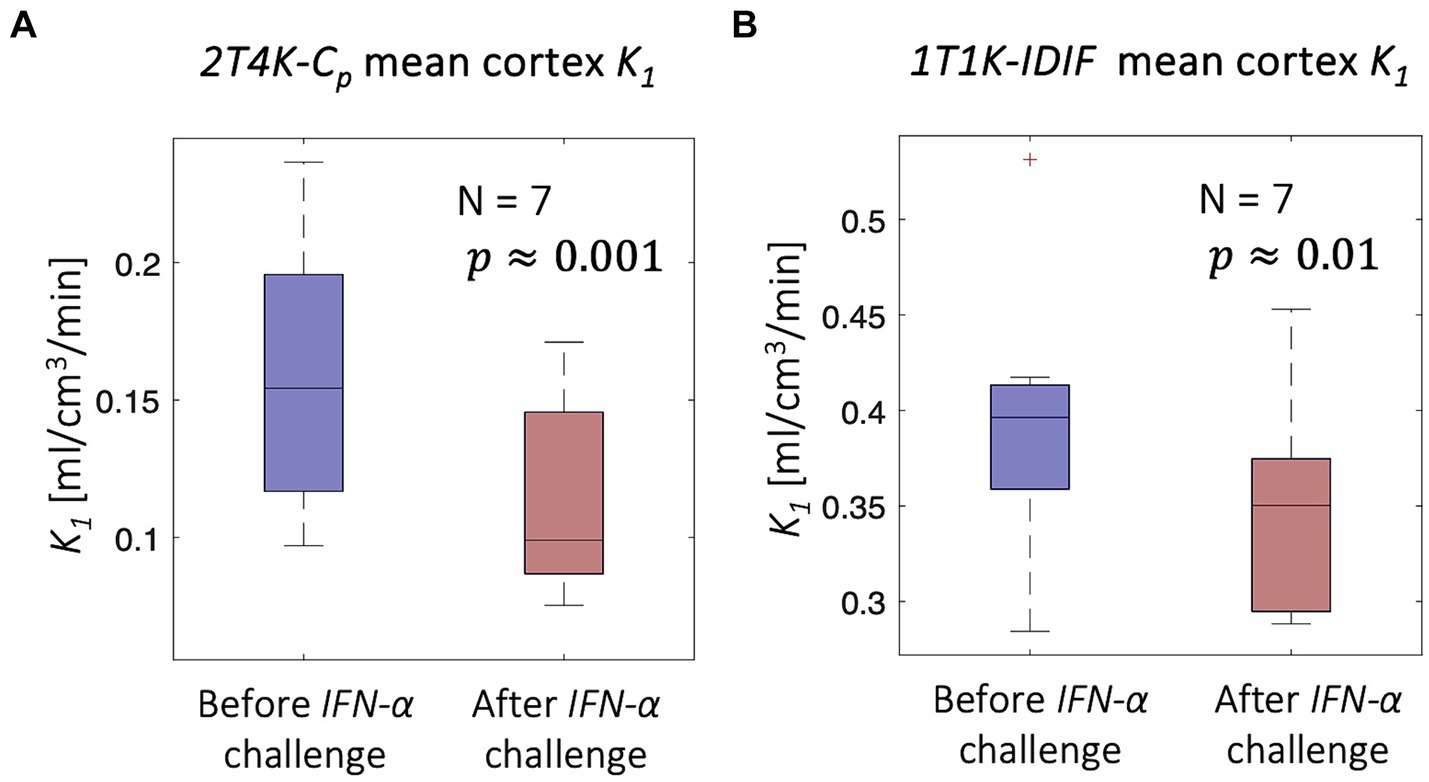
Figure 8. IFN-α challenge - [11C]PBR28 scans. Figure shows a significant reduction in the mean cortex K1 associated with peripheral inflammation induced with IFN-α challenge; the significant reduction is unveiled both in terms of 2T4K-Cp K1 (panel A) and 1T1K-IDIF K1 (panel B).
3.4 Test–retest reproducibility of K1 estimates-[18F]DPA714 scans
Good-to-high reproducibility of 1T1K-IDIF K1 estimates was reported for each of the test–retest subjects (Figure 9), with a Pearson’s Correlation coefficient of 0.97 ± 0.01. MRD between estimates ranged from −19.60 to 32.47%.
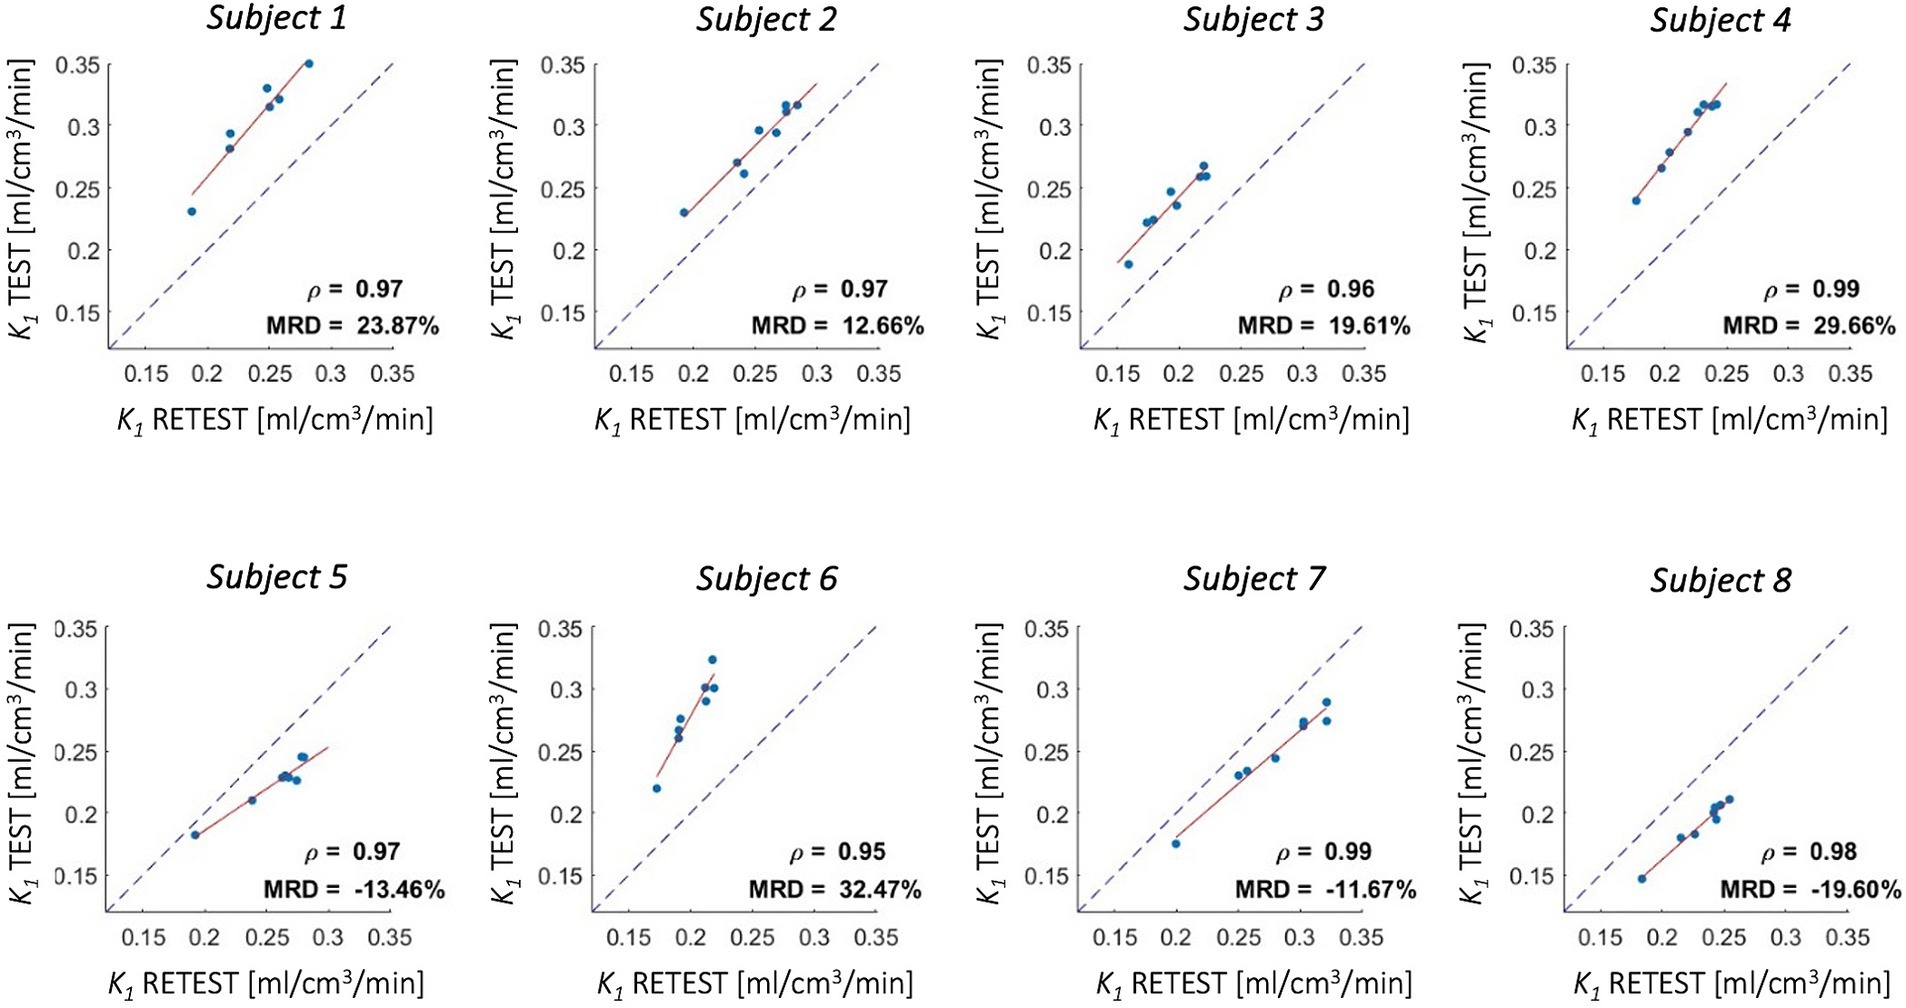
Figure 9. Test–retest reproducibility of K1 estimates - [18F]DPA714 scans. Figure shows correlation between K1 estimates computed from test and retest scans for 4 cortical lobes, insula, cerebellum, thalami, and brainstem (red solid line: regression line; gray dotted line: identity line); Pearson’s correlation coefficient (ρ) and mean root distance (MRD) between test and retest estimates are reported in each panel.
4 Discussion
4.1 Model validation
The proposed method represents a completely non-invasive quantification approach for the K1 PET imaging parameter via the fitting of the early phase of the tracer dynamic. We tested our method on three independent TSPO PET datasets. The validation by comparison with the reference-standard blood-based estimates showed high intra-subject correlations between the 2T4K-Cp and the 1T1K-IDIF K1 estimates with each of the three tested input functions. On the other hand, while a reduced bias was reported when comparing 1T1K-Cp and 1T1K-Cb to 2T4K-Cp K1 estimates, high and variable bias was reported for the 1T1K-IDIF, depending on the IDIF variability to approximate blood input functions. This resulted in lower values of between-subject correlations when IDIF was adopted as input function of the model. Despite this, the 1T1K-IDIF estimate allowed us to replicate the significant reduction in the K1 values associated with peripheral inflammation after the immune challenge IFN-α (Nettis et al., 2020; Turkheimer et al., 2021).
These results suggest that:
1. 1T1K-IDIF can be used to reliably measure topological differences in tracer delivery within an individual brain. Practically, this approach has the potential to map subtle changes in the BBB affecting individual patients and even single brain lesions within those patients, presenting particularly relevant applications in conditions such as multiple sclerosis.
2. 1T1K-IDIF can be used to quantify between-subjects differences in terms of tracer delivery, although the high bias makes it unusable for absolute quantification. Our results demonstrated the ability of the non-invasive 1T1K-IDIF method to unveil alterations in tracers’ blood-to-brain delivery following IFN-α challenge, despite the higher variability in K1 estimates and lower sensitivity compared to full blood-based quantification.
3. Given the similarity of performances between 1T1K-Cp and 1T1K-Cb with the reference standard, the most penalizing assumption for 1T1K-IDIF is the use of IDIF as a proxy of blood input (Hypothesis #3), rather than those on simplified modeling (Hypothesis #1) or negligible metabolites (Hypothesis #2).
4.2 Interpretation of K1 measures
According to the Fick principle and Renkin-Crone model, the blood-to-brain delivery rate K1 depends on blood perfusion and the product of capillary permeability and capillary surface area (Renkin, 1959; Crone, 1963). Previous studies have suggested the potential use of the influx rate constant K1 as a biomarker for alterations of brain barrier permeability that are associated with acute or chronic inflammation. In a group of 7 healthy volunteers, increased serum peripheral C-reactive protein, induced by the injection of IFN-α, was associated with reduced brain barrier permeability measured by the rate constants K1 of the TSPO tracer [11C]PBR28 (Nettis et al., 2020; Turkheimer et al., 2021). In a dataset of dynamic [11C]PBR28 scans from 11 patients with small vessel disease, kinetic modeling also showed a reduction when comparing white matter hyperintensities to normal appearing white matter (Wright et al., 2020).
Although Sander et al. (2021) showed no significant changes in [11C]PBR28 radiotracer kinetic associated with alterations in cerebral blood flow, this evidence is not sufficient to exclude the influence of cerebral blood perfusion on TSPO tracers delivery and uptake. Study by Mackowiak et al. (1998) showed alterations in cerebral perfusion, with a focal increase in the basal ganglia after IFN-β, while a decreased level of regional blood perfusion was reported in patients treated for hepatitis with IFN-α (Tanaka et al., 2006). It is thus not possible to disentangle an effect of blood perfusion rate alterations from alterations more related to endothelial status of BBB and its permeability. Pharmacological studies with perfusion-manipulating interventions could help to provide more biologically specific insights on the interpretation of K1 changes measured with TSPO PET tracers.
Importantly, variations in K1 estimates are reflected in the calculations of binding parameters, such as the distribution volume VT and other kinetic modeling macro-parameters. These variations may be misinterpreted as changes in TSPO density. In fact, changes in tracer blood-to-tissue transport have been shown to cause up to 77% of the variation in VT measures in the case of [11C]PBR28 PET data (Nettis et al., 2020). When blood data are available and more robust quantifications are possible, such as the full blood-based compartmental modeling used for VT quantification, the K1 parameter can be directly computed with minimal bias by fitting the standard 2T4K model. However, when the blood input function is not available and simpler semi-quantitative measures of TSPO binding, such as the standardized uptake value (SUV) are adopted, the 1T1K-IDIF methodology can add value by providing a non-invasive measure of tracer influx and allowing the correction of the SUV parameter for differences in tracer delivery.
4.3 Generalizability of the method
The method was tested on two second-generation TSPO PET tracers and data collected both on healthy volunteers and patients (psychiatric disorders, chronic pain), in three different PET centers using different scanners and acquisition protocols. In the case of TSPO PET imaging, the application of 1T1K-IDIF approach would provide information on tracers delivery on top of neuroinflammation measures. However, the proposed methodological framework has the advantage of being potentially generalizable to other families of tracers - provided the previously described model hypotheses are respected and the method is validated for each new tracer, acquisition protocol, and scanner - especially in the case of radiotracers not actively transported in or out of brain (Tournier et al., 2011). In the case of tracers with relatively high BBB permeability and extraction fraction (e.g., β-amyloid PET imaging), the K1 parameter could potentially be adopted as a proxy of cerebral blood flow.
4.4 Methodological considerations and study limitations
4.4.1 Blood data
Different blood sampling and analysis procedures were adopted across the three PET centers, thus introducing differences in available blood data for the different datasets under study. Firstly, while in the case of KCL scans, both Cb and Cp_uncor curves (in addition to Cp) were provided, thus allowing an investigation of both POB and PPf effects when using the Cb instead of traditional Cp as input function of the reduced model, only the Cp_uncor was available for the MGH and ICM datasets. Additionally, tracer fp - (which is very low for TSPO ligands and difficult to measure Turkheimer et al., 2015), thus discouraging several PET imaging centers from its measurement - was solely available for KCL data; for this reason, the impact of plasma proteins on blood tracer activity was not taken into account in this study. Finally, in the case of MGH and ICM data, for which a continuous blood sampling was not performed, temporal resolution of blood and plasma concentration curves was relatively low, potentially affecting the accuracy of model fitting.
4.4.2 Image derived input function
Operatively, the main challenge in the application of the method was linked to the extraction of a reliable input function from the tracer dynamic PET images. In our analysis the AUCratio acts as a measure of goodness of performance for IDIF extraction: the AUC approaches 1 as accuracy improves, while worse results are reflected by lower AUCratio values, since the IDIF approach tends generally to underestimate the blood kinetic peak.
An accurate description of the activity peak in the early phase of the tracer blood kinetic was not trivial, due to the relatively low spatial and temporal resolution in PET dynamic data, which caused, respectively, relevant partial volume effects (PVEs), and the impossibility of following the fast rising and descending part of the curve (Volpi et al., 2023), thus introducing variable bias across subjects. In this study no correction for PVEs was applied to computed IDIF. To the best of our knowledge, there is not a current standard in the application of PVEs approaches (Volpi et al., 2023) and effectiveness of these methods strongly depends on image quality, tracer kinetics, and brain anatomy, leading to uncertainty in the corrected IDIF and the risk of over-correcting and thus obtaining artificially inflated or distorted concentration time curves. These effects can ultimately result in biased estimates of kinetic parameters as well. Further analyses and a robust validation would be necessary to select the optimal method of PVEs correction (depending on scanner and imaging protocols), assess the reliability of the corrected IDIF, and evaluate the impact of correction on study outcomes. These two objectives were beyond the aim of this study.
The strong correlation between bias and AUCratio suggests how the use of more sophisticated pipelines for vessel segmentation, blood voxels selection and correction for IDIF extraction could possibly enhance the performance of the proposed method. The introduction of new generation PET scanners, with better sensitivity, improved spatial resolution and temporal resolution, and larger scanner field of view, opens the promise of a high enhancement in the performances of IDIF extraction (Volpi et al., 2023). It should be noted that K1 bias in the case of MGH PET scans appears less correlated to AUCratio. This could be linked to different reasons. Firstly, it is worth mentioning that the AUCratio, here assumed as a measure of goodness of IDIF approximation of the arterial Cp, simply counts for differences in the area under the two curves, but not for differences in curves shapes. Secondly, IDIF extraction and time resolution are dependent on PET experimental protocol over which we did not have control being the study performed over pre-existing data. Moreover, as previously highlighted, the blood protocols which will affect the gold standard K1 estimation are different for the sites.
In general, the use of a limited time window after tracer injection has the strong advantage of allowing to reasonably ignore the metabolite production, which, so far, represents the main unresolved issue and one of the main obstacles to a wider application of IDIF approach (Zanotti-Fregonara et al., 2011a). The radio-metabolites activity in the late phase of blood TACs is indeed known to strongly affect the estimation of tracer binding parameters (Volpi et al., 2023). In a pilot study conducted on [11C]PBR28 PET scans from MGH (Dataset3), VT estimates obtained with the adoption of the IDIF, without any correction for metabolites activity, showed high inconsistency (Pearson’s coefficient ρ = 0.35) with standard VT estimates obtained with arterial input function (Whitehead et al., 2023).
4.4.3 Fitting time window
The time window for 1T1K model fitting was experimentally chosen for each dataset and tracer, considering the kinetic of the tracer, tracer metabolism, and the temporal resolution of the dynamic PET scan that would determine the total number of samples used for model fitting for a fixed time window. To note, the relatively low time resolution of tissue TACs in the early phase following tracer injection represents one of the major limitations in this study, strongly affecting the accuracy of model fit and K1 estimates. Sensitivity analysis showed robustness of model performances with respect to the adopted fitting-time-window (Supplementary Figures 2, 3), although higher between-subjects correlation for K1 estimates was obtained with longer time windows. Of note, the longer the window and the higher the number of data samples adopted for model fitting and thus the precision of the K1 estimates (i.e., lower coefficient of variation). In the case of [18F]DPA714, the adoption of an excessively short time window (3.5 or 4.5 min) resulted in a strong reduction of between-subjects correlation of 1T1K-IDIF with respect to 2T4K-Cp K1 estimates.
4.4.4 Comparison of different modeling choices
The analysis of the impact of Vb parametrization on model performance showed modest to no significant difference in K1 estimates but a slight improvement in the precision of estimates in the case the Vb parametrization was included (Supplementary Figure 4). This assumption should be further confirmed for those tissues with a higher blood volume fraction. Also, the minor effect of setting the Vb to 0 could be the consequence of the poor fit of the Vb parameter, due to the poor timing resolution at the early phase of tissue tracers kinetic (e.g., initial frame length of 15 s in the case of KCL scans). Interestingly, comparisons of results obtained with different modeling choices (different input functions and compartmental models, both reversible and irreversible) showed better data fits, as assessed by the Akaike Information Criterion (Golla et al., 2017), for 1T2K compared to 1T1K model, but at the cost of higher variability, as well as higher bias and less consistency (in terms of both intra- and inter-subjects correlations) to the standard 2T4K-Cp ROIs K1 estimates (Supplementary Figure 5).
4.4.5 Tracer and scanner effects
In this study, results obtained for [18F]DPA714 seemed to demonstrate different performances with respect to [11C]PBR28 in terms of bias and intra- and between-subjects correlation of K1 and R1 estimates. The higher AUCratio and lower relative bias between 1T1K-IDIF and 2T4K-Cp K1 in the ICM cohort may be explained by the higher spatial resolution of dynamic PET images, with the consequent reduction of the partial volume effects, and the relative slow bolus injection causing the arterial peak to be smoother. Of note, a smaller number of [18F]DPA714 scans, with respect to [11C]PBR28 scans, were included in the study. Additionally, the acquisition of data in different PET centers and scanners introduces relevant batch effects (Joshi et al., 2009), which could result for example in a different level of noise on the image.
Independently from the specific model adopted, differences across sites were also reported in ROIs K1 estimates derived from the quantification of KCL and MGH [11C]PBR28 scans. Supplementary Figure 6 shows how between-subjects pairwise correlations of ROIs 2T4K-Cp K1 estimates of healthy controls of Dataset 1 (KCL) and Dataset3 (MGH) are high when comparing subjects from the same dataset and lower when comparing subjects from different datasets, thus revealing differences in terms of K1 topological patterns across the two sites. However, it is important to note that the same pattern reported for 2T4K-Cp is detected by 1T1K-IDIF K1 estimates. The investigation of the causes of this disagreement is beyond the purposes of this study and not necessarily uniquely related to scanner differences. It is worth mentioning indeed that a significant difference in healthy controls’ age (Wilcoxon rank-sum test p < 10−4) was found between the two datasets, which could partially explain differences in K1 values between the two scanners.
In general, no effort for data harmonization was performed across the three sites, reflecting the aim of the study to test the performance and general applicability of the proposed methodology for the quantification of K1 on datasets with different characteristics and experimental settings, rather than performing a comparison between sites. However, the specific dependency of the results on tracers, scanners (resolution, sensitivity, noise on data), and acquisition protocols was not systemically investigated. Nonetheless, we managed to provide good preliminary evidence in support of the 1T1K-IDIF K1 methodology. Further studies including [11C]PK11195 and third-generation TSPO tracers (e.g., [18F]LW223 (MacAskill et al., 2021) and [11C]ER176; Ikawa et al., 2017) would shed additional light on the relationship between method performance and tracers pharmacokinetic.
5 Conclusion
Our results validated the use of the 1T1K-IDIF method as a blood-free alternative for assessing blood-to-brain tracer exchange in TSPO PET studies and exploring topological differences in blood–brain-barrier permeability at an individual level.
The proposed method has the main advantage of overcoming the practical limitations of standard compartmental modeling quantification and could potentially be applied to a different family of tracers after proper validation.
The dependence of K1 bias on IDIF variability to describe the arterial blood input function suggests that adopting more sophisticated IDIF extraction pipelines, in combination with the current development of new generation highly performant PET scanners, could potentially lead to a significant improvement in the 1T1K-IDIF performance.
Data availability statement
The data analyzed in this study is subject to the following licenses/restrictions: data were used under license for the current study and are not publicly available. Requests to access these datasets should be directed to MV, bWF0dGlhLnZlcm9uZXNlQHVuaXBkLml0.
Ethics statement
The studies involving humans were approved by local research ethics committee, including the Queen Square London Ethical committee, ref. 16/LO/ 1,520, the Partners institutional review board (IRB) and the radioactive drug research committee (RDRC) at Massachusetts General Hospital (MGH), Boston, MA, and the Medical Bioethics Committee of Ile de France Region. The studies were conducted in accordance with the local legislation and institutional requirements. The participants provided their written informed consent to participate in this study.
Author contributions
LM: Conceptualization, Methodology, Validation, Visualization, Writing – original draft, Writing – review & editing, Formal analysis. MC: Validation, Visualization, Writing – review & editing, Formal analysis. LB: Writing – review & editing. ES: Writing – review & editing, Methodology. AB: Writing – review & editing, Methodology. JS: Writing – review & editing. MN: Writing – review & editing. VM: Writing – review & editing. OH: Writing – review & editing. FT: Writing – review & editing. MB: Writing – review & editing. BB: Writing – review & editing. BS: Writing – review & editing. ML: Writing – review & editing. MV: Writing – review & editing, Methodology, Supervision, Writing – original draft.
Funding
The author(s) declare that financial support was received for the research, authorship, and/or publication of this article. LM is supported by Fondazione Ing. Aldo Gini scholarship. MV is supported by EU funding within the MUR PNRR “National Center for HPC, BIG DATA AND QUANTUM COMPUTING (Project no. CN00000013 CN1), the Ministry of University and Research within the Complementary National Plan PNC DIGITAL LIFELONG PREVENTION—DARE (Project no PNC0000002_DARE), and by Fondo per il Programma Nazionale di Ricerca e Progetti di Rilevante Interesse Nazionale (PRIN), (Project no 2022RXM3H7). ML is supported by NIH grants R01NS095937-01A1 and R01NS094306-01A1. MB is supported by ANR grant MNP2008-007125.
Acknowledgments
We would like to thank all the participants who took part in these imaging studies and all the scientists who in the name of collaborative science provided us access to their data. We want to thank Minhae Kim, Erin Morrissey, and Paulina Knight for their support on MGH data collection, and all the radio-pharmacy and nuclear medicine technologists.
Conflict of interest
The authors declare that the research was conducted in the absence of any commercial or financial relationships that could be construed as a potential conflict of interest.
The author(s) declared that they were an editorial board member of Frontiers, at the time of submission. This had no impact on the peer review process and the final decision.
Publisher’s note
All claims expressed in this article are solely those of the authors and do not necessarily represent those of their affiliated organizations, or those of the publisher, the editors and the reviewers. Any product that may be evaluated in this article, or claim that may be made by its manufacturer, is not guaranteed or endorsed by the publisher.
Supplementary material
The Supplementary material for this article can be found online at: https://www.frontiersin.org/articles/10.3389/fnins.2024.1395769/full#supplementary-material
Footnotes
References
Albrecht, D. S., Granziera, C., Hooker, J. M., and Loggia, M. L. (2016). In vivo imaging of human Neuroinflammation. ACS Chem. Neurosci. 7, 470–483. doi: 10.1021/acschemneuro.6b00056
Albrecht, D. S., Normandin, M. D., Shcherbinin, S., Wooten, D. W., Schwarz, A. J., Zürcher, N. R., et al. (2018). Pseudoreference regions for glial imaging with11C-PBR28: investigation in 2 clinical cohorts. J. Nucl. Med. 59, 107–114. doi: 10.2967/jnumed.116.178335
Bauer, M. E., and Teixeira, A. L. (2019). Inflammation in psychiatric disorders: what comes first? Ann. N. Y. Acad. Sci. 1437, 57–67. doi: 10.1111/nyas.13712
Bertoldo, A., Rizzo, G., and Veronese, M. (2014). Deriving physiological information from PET images: from SUV to compartmental modelling. Clin. Translat. Imaging 2, 239–251. doi: 10.1007/s40336-014-0067-x
Bloomfield, P. S., Selvaraj, S., Veronese, M., Rizzo, G., Bertoldo, A., Owen, D. R., et al. (2016). Microglial activity in people at ultra high risk of psychosis and in schizophrenia: an [(11)C]PBR28 PET brain imaging study. AJP 173, 44–52. doi: 10.1176/appi.ajp.2015.14101358
Brooks, T. A., Hawkins, B. T., Huber, J. D., Egleton, R. D., and Davis, T. P. (2005). Chronic inflammatory pain leads to increased blood-brain barrier permeability and tight junction protein alterations. Am. J. Phys. Heart Circ. Phys. 289, H738–H743. doi: 10.1152/ajpheart.01288.2004
Carson, E. R., Cobelli, C., and Finkelstein, L. (1983). The mathematical modeling of metabolic and endocrine systems: Model formulation, identification, and validation, biomedical engineering and health systems. New York: Wiley.
Chen, Y. J., Rosario, B. L., Mowrey, W., Laymon, C. M., Lu, X., Lopez, O. L., et al. (2015). Relative 11 C-PiB delivery as a proxy of relative CBF: quantitative evaluation using single-session 15 O-water and 11 C-PiB PET. J. Nucl. Med. 56, 1199–1205. doi: 10.2967/jnumed.114.152405
Crone, C. (1963). The permeability of capillaries in various organs as determined by use of the ‘Indicator diffusion’ method. Acta Physiol. Scand. 58, 292–305. doi: 10.1111/j.1748-1716.1963.tb02652.x
Dahoun, T., Calcia, M. A., Veronese, M., Bloomfield, P., Reis Marques, T., Turkheimer, F., et al. (2019). The association of psychosocial risk factors for mental health with a brain marker altered by inflammation: a translocator protein (TSPO) PET imaging study. Brain Behav. Immun. 80, 742–750. doi: 10.1016/j.bbi.2019.05.023
De Picker, L. J., and Haarman, B. C. M. (2021). Applicability, potential and limitations of TSPO PET imaging as a clinical immunopsychiatry biomarker. Eur. J. Nucl. Med. Mol. Imaging 49, 164–173. doi: 10.1007/s00259-021-05308-0
Desikan, R. S., Ségonne, F., Fischl, B., Quinn, B. T., Dickerson, B. C., Blacker, D., et al. (2006). An automated labeling system for subdividing the human cerebral cortex on MRI scans into gyral based regions of interest. NeuroImage 31, 968–980. doi: 10.1016/j.neuroimage.2006.01.021
Dimitrova-Shumkovska, J., Krstanoski, L., and Veenman, L. (2020). Diagnostic and therapeutic potential of TSPO studies regarding neurodegenerative diseases, psychiatric disorders, alcohol use disorders, traumatic brain injury, and stroke: an update. Cells 9:870. doi: 10.3390/cells9040870
Erickson, M. A., Dohi, K., and Banks, W. A. (2012). Neuroinflammation: a common pathway in CNS diseases as mediated at the blood-brain barrier. Neuroimmunomodulation 19, 121–130. doi: 10.1159/000330247
García-Lorenzo, D., Lavisse, S., Leroy, C., Wimberley, C., Bodini, B., Remy, P., et al. (2018). Validation of an automatic reference region extraction for the quantification of [(18)F]DPA-714 in dynamic brain PET studies. J. Cereb. Blood Flow Metab. 38, 333–346. doi: 10.1177/0271678X17692599
Goldsmith, D. R., Haroon, E., Miller, A. H., Addington, J., Bearden, C., Cadenhead, K., et al. (2019). Association of baseline inflammatory markers and the development of negative symptoms in individuals at clinical high risk for psychosis. Brain Behav. Immun. 76, 268–274. doi: 10.1016/j.bbi.2018.11.315
Golla, S. S. V., Adriaanse, S. M., Yaqub, M., Windhorst, A. D., Lammertsma, A. A., van Berckel, B. N. M., et al. (2017). Model selection criteria for dynamic brain PET studies. EJNMMI Phys 4:30. doi: 10.1186/s40658-017-0197-0
Guzman-Martinez, L., Maccioni, R. B., Andrade, V., Navarrete, L. P., Pastor, M. G., and Ramos-Escobar, N. (2019). Neuroinflammation as a common feature of neurodegenerative disorders. Front. Pharmacol. 10:1008. doi: 10.3389/fphar.2019.01008
Han, R. T., Kim, R. D., Molofsky, A. V., and Liddelow, S. A. (2021). Astrocyte-immune cell interactions in physiology and pathology. Immunity 54, 211–224. doi: 10.1016/j.immuni.2021.01.013
Iida, H., Higano, S., Tomura, N., Shishido, F., Kanno, I., Miura, S., et al. (1988). Evaluation of regional differences of tracer appearance time in cerebral tissues using [15O]water and dynamic positron emission tomography. J. Cereb. Blood Flow Metab. 8, 285–288. doi: 10.1038/jcbfm.1988.60
Ikawa, M., Lohith, T. G., Shrestha, S., Telu, S., Zoghbi, S. S., Castellano, S., et al. (2017). 11 C-ER176, a Radioligand for 18-kDa translocator protein, has adequate sensitivity to robustly image all three affinity genotypes in human brain. J. Nucl. Med. 58, 320–325. doi: 10.2967/jnumed.116.178996
Innis, R. B., Cunningham, V. J., Delforge, J., Fujita, M., Gjedde, A., Gunn, R. N., et al. (2007). Consensus nomenclature for in vivo imaging of reversibly binding Radioligands. J. Cereb. Blood Flow Metab. 27, 1533–1539. doi: 10.1038/sj.jcbfm.9600493
Izquierdo-Garcia, D., Hansen, A. E., Förster, S., Benoit, D., Schachoff, S., Fürst, S., et al. (2014). An SPM8-based approach for attenuation correction combining segmentation and nonrigid template formation: application to simultaneous PET/MR brain imaging. J. Nucl. Med. 55, 1825–1830. doi: 10.2967/jnumed.113.136341
Jain, P., Chaney, A. M., Carlson, M. L., Jackson, I. M., Rao, A., and James, M. L. (2020). Neuroinflammation PET imaging: current opinion and future directions. J. Nucl. Med. 61, 1107–1112. doi: 10.2967/jnumed.119.229443
Joshi, A., Koeppe, R. A., and Fessler, J. A. (2009). Reducing between scanner differences in multi-center PET studies. NeuroImage 46, 154–159. doi: 10.1016/j.neuroimage.2009.01.057
Kirk, J., Plumb, J., Mirakhur, M., and McQuaid, S. (2003). Tight junctional abnormality in multiple sclerosis white matter affects all calibres of vessel and is associated with blood–brain barrier leakage and active demyelination. J. Pathol. 201, 319–327. doi: 10.1002/path.1434
Lavisse, S., García-Lorenzo, D., Peyronneau, M.-A., Bodini, B., Thiriez, C., Kuhnast, B., et al. (2015). Optimized quantification of translocator protein Radioligand 18 F-DPA-714 uptake in the brain of genotyped healthy volunteers. J. Nucl. Med. 56, 1048–1054. doi: 10.2967/jnumed.115.156083
Loggia, M. L., Chonde, D. B., Akeju, O., Arabasz, G., Catana, C., Edwards, R. R., et al. (2015). Evidence for brain glial activation in chronic pain patients. Brain 138, 604–615. doi: 10.1093/brain/awu377
Lyoo, C. H., Ikawa, M., Liow, J.-S., Zoghbi, S. S., Morse, C. L., Pike, V. W., et al. (2015). Cerebellum can serve as a Pseudo-reference region in Alzheimer disease to detect Neuroinflammation measured with PET Radioligand binding to translocator protein. J. Nucl. Med. 56, 701–706. doi: 10.2967/jnumed.114.146027
MacAskill, M. G., Stadulyte, A., Williams, L., Morgan, T. E. F., Sloan, N. L., Alcaide-Corral, C. J., et al. (2021). Quantification of macrophage-driven inflammation during myocardial infarction with 18 F-LW223, a novel TSPO radiotracer with binding independent of the rs6971 human polymorphism. J. Nucl. Med. 62, 536–544. doi: 10.2967/jnumed.120.243600
Mackowiak, P. A., Siegel, E., Wasserman, S. S., Cameron, E., Nessaiver, M. S., and Bever, C. T. (1998). Effects of IFN-β on human cerebral blood flow distribution. J. Interf. Cytokine Res. 18, 393–397. doi: 10.1089/jir.1998.18.393
Marques, T. R., Veronese, M., Owen, D. R., Rabiner, E. A., Searle, G. E., and Howes, O. D. (2021). Specific and non-specific binding of a tracer for the translocator-specific protein in schizophrenia: an [11C]-PBR28 blocking study. Eur. J. Nucl. Med. Mol. Imaging 48, 3530–3539. doi: 10.1007/s00259-021-05327-x
Morrissey, E. J., Alshelh, Z., Knight, P. C., Saha, A., Kim, M., Torrado-Carvajal, A., et al. (2023). Assessing the potential anti-neuroinflammatory effect of minocycline in chronic low back pain: protocol for a randomized, double-blind, placebo-controlled trial. Contemp. Clin. Trials 126:107087. doi: 10.1016/j.cct.2023.107087
Nettis, M. A., Veronese, M., Nikkheslat, N., Mariani, N., Lombardo, G., Sforzini, L., et al. (2020). PET imaging shows no changes in TSPO brain density after IFN-α immune challenge in healthy human volunteers. Transl. Psychiatry 10:89. doi: 10.1038/s41398-020-0768-z
Nutma, E., Fancy, N., Weinert, M., Tsartsalis, S., Marzin, M. C., Muirhead, R. C. J., et al. (2023). Translocator protein is a marker of activated microglia in rodent models but not human neurodegenerative diseases. Nat. Commun. 14:5247. doi: 10.1038/s41467-023-40937-z
Nutma, E., Stephenson, J. A., Gorter, R. P., De Bruin, J., Boucherie, D. M., Donat, C. K., et al. (2019). A quantitative neuropathological assessment of translocator protein expression in multiple sclerosis. Brain 142, 3440–3455. doi: 10.1093/brain/awz287
Parsey, R. V., Slifstein, M., Hwang, D.-R., Abi-Dargham, A., Simpson, N., Mawlawi, O., et al. (2000). Validation and reproducibility of measurement of 5-HT 1A receptor parameters with [carbonyl - 11 C]WAY-100635 in humans: comparison of arterial and reference tissue input functions. J. Cereb. Blood Flow Metab. 20, 1111–1133. doi: 10.1097/00004647-200007000-00011
Peyronneau, M., Kuhnast, B., Nguyen, D.-L., Jego, B., Sayet, G., Caillé, F., et al. (2023). [18F]DPA-714: effect of co-medications, age, sex, BMI and TSPO polymorphism on the human plasma input function. Eur. J. Nucl. Med. Mol. Imaging 50, 3251–3264. doi: 10.1007/s00259-023-06286-1
Renkin, E. M. (1959). Transport of potassium-42 from blood to tissue in isolated mammalian skeletal muscles. American J. Physiol.-Legacy Content 197, 1205–1210. doi: 10.1152/ajplegacy.1959.197.6.1205
Rizzo, G., Veronese, M., Tonietto, M., Zanotti-Fregonara, P., Turkheimer, F. E., and Bertoldo, A. (2014). Kinetic modeling without accounting for the vascular component impairs the quantification of [(11)C]PBR28 brain PET data. J. Cereb. Blood Flow Metab. 34, 1060–1069. doi: 10.1038/jcbfm.2014.55
Sander, C. Y., Bovo, S., Torrado-Carvajal, A., Albrecht, D., Deng, H., Napadow, V., et al. (2021). [(11)C]PBR28 radiotracer kinetics are not driven by alterations in cerebral blood flow. J. Cereb. Blood Flow Metab. 41, 3069–3084. doi: 10.1177/0271678X211023387
Silvestri, E. (2018). Simultaneous PET/MRI for connectivity mapping: Quantitative methods in clinical setting : University of Padova. Available at: https://hdl.handle.net/11577/3426715
Takata, F., Nakagawa, S., Matsumoto, J., and Dohgu, S. (2021). Blood-brain barrier dysfunction amplifies the development of Neuroinflammation: understanding of cellular events in brain microvascular endothelial cells for Prevention and treatment of BBB dysfunction. Front. Cell. Neurosci. 15:661838. doi: 10.3389/fncel.2021.661838
Tanaka, H., Maeshima, S., Shigekawa, Y., Ueda, H., Hamagami, H., Kida, Y., et al. (2006). Neuropsychological impairment and decreased regional cerebral blood flow by interferon treatment in patients with chronic hepatitis: a preliminary study. Clin. Exper.Med. 6, 124–128. doi: 10.1007/s10238-006-0107-6
Tonietto, M., Rizzo, G., Veronese, M., Borgan, F., Bloomfield, P. S., Howes, O., et al. (2019). A unified framework for plasma data modeling in dynamic positron emission tomography studies. IEEE Trans. Biomed. Eng. 66, 1447–1455. doi: 10.1109/TBME.2018.2874308
Tonietto, M., Rizzo, G., Veronese, M., Fujita, M., Zoghbi, S. S., Zanotti-Fregonara, P., et al. (2016). Plasma radiometabolite correction in dynamic PET studies: insights on the available modeling approaches. J. Cereb. Blood Flow Metab. 36, 326–339. doi: 10.1177/0271678X15610585
Tournier, N., Valette, H., Peyronneau, M.-A., Saba, W., Goutal, S., Kuhnast, B., et al. (2011). Transport of selected PET radiotracers by human P-glycoprotein (ABCB1) and breast Cancer resistance protein (ABCG2): an in vitro screening. J. Nucl. Med. 52, 415–423. doi: 10.2967/jnumed.110.079608
Turkheimer, F. E., Althubaity, N., Schubert, J., Nettis, M. A., Cousins, O., Dima, D., et al. (2021). Increased serum peripheral C-reactive protein is associated with reduced brain barriers permeability of TSPO radioligands in healthy volunteers and depressed patients: implications for inflammation and depression. Brain Behav. Immun. 91, 487–497. doi: 10.1016/j.bbi.2020.10.025
Turkheimer, F. E., Rizzo, G., Bloomfield, P. S., Howes, O., Zanotti-Fregonara, P., Bertoldo, A., et al. (2015). The methodology of TSPO imaging with positron emission tomography. Biochem. Soc. Trans. 43, 586–592. doi: 10.1042/BST20150058
Turkheimer, F. E., Veronese, M., Mondelli, V., Cash, D., and Pariante, C. M. (2023). Sickness behaviour and depression: an updated model of peripheral-central immunity interactions. Brain Behav. Immun. 111, 202–210. doi: 10.1016/j.bbi.2023.03.031
Tziortzi, A. C., Searle, G. E., Tzimopoulou, S., Salinas, C., Beaver, J. D., Jenkinson, M., et al. (2011). Imaging dopamine receptors in humans with [11C]-(+)-PHNO: dissection of D3 signal and anatomy. NeuroImage 54, 264–277. doi: 10.1016/j.neuroimage.2010.06.044
Vicente-Rodríguez, M., Singh, N., Turkheimer, F., Peris-Yague, A., Randall, K., Veronese, M., et al. (2021). Resolving the cellular specificity of TSPO imaging in a rat model of peripherally-induced neuroinflammation. Brain. Behavi. Immun. 96, 154–167. doi: 10.1016/j.bbi.2021.05.025
Vivash, L., and O’Brien, T. J. (2016). Imaging microglial activation with TSPO PET: lighting up neurologic diseases? J. Nucl. Med. 57, 165–168. doi: 10.2967/jnumed.114.141713
Volpi, T., Maccioni, L., Colpo, M., Debiasi, G., Capotosti, A., Ciceri, T., et al. (2023). An update on the use of image-derived input functions for human PET studies: new hopes or old illusions? EJNMMI Res. 13:97. doi: 10.1186/s13550-023-01050-w
Weerasekera, A., Morrissey, E., Kim, M., Saha, A., Lin, Y., Alshelh, Z., et al. (2021). Thalamic neurometabolite alterations in patients with knee osteoarthritis before and after total knee replacement. Pain 162, 2014–2023. doi: 10.1097/j.pain.0000000000002198
Werry, E. L., Bright, F. M., Piguet, O., Ittner, L. M., Halliday, G. M., Hodges, J. R., et al. (2019). Recent developments in TSPO PET imaging as a biomarker of Neuroinflammation in neurodegenerative disorders. IJMS 20:3161. doi: 10.3390/ijms20133161
Whitehead, A., Brusaferri, L., Maccioni, L., Ferrante, M., Inglese, M., Alshelh, Z., et al. (2023). A Bayesian neural network-based method for the extraction of a metabolite corrected arterial input function from dynamic [11 C]PBR28 PET.
Wimberley, C., Lavisse, S., Hillmer, A., Hinz, R., Turkheimer, F., and Zanotti-Fregonara, P. (2021). Kinetic modeling and parameter estimation of TSPO PET imaging in the human brain. Eur. J. Nucl. Med. Mol. Imaging 49, 246–256. doi: 10.1007/s00259-021-05248-9
Wright, P., Veronese, M., Mazibuko, N., Turkheimer, F. E., Rabiner, E. A., Ballard, C. G., et al. (2020). Patterns of mitochondrial TSPO binding in cerebral small vessel disease: an in vivo PET study with neuropathological comparison. Front. Neurol. 11:541377. doi: 10.3389/fneur.2020.541377
Zanotti-Fregonara, P., Chen, K., Liow, J.-S., Fujita, M., and Innis, R. B. (2011a). Image-derived input function for brain PET studies: many challenges and few opportunities. J. Cereb. Blood Flow Metab. 31, 1986–1998. doi: 10.1038/jcbfm.2011.107
Zanotti-Fregonara, P., Liow, J.-S., Fujita, M., Dusch, E., Zoghbi, S. S., Luong, E., et al. (2011b). Image-derived input function for human brain using high resolution PET imaging with [11C](R)-rolipram and [11C]PBR28. PLoS One 6:e17056. doi: 10.1371/journal.pone.0017056
Zhang, L., Hu, K., Shao, T., Hou, L., Zhang, S., Ye, W., et al. (2021). Recent developments on PET radiotracers for TSPO and their applications in neuroimaging. Acta Pharm. Sin. B 11, 373–393. doi: 10.1016/j.apsb.2020.08.006
Keywords: BBB, IDIF, kinetic modeling, PET, TSPO, neuroinflammation
Citation: Maccioni L, Michelle CM, Brusaferri L, Silvestri E, Bertoldo A, Schubert JJ, Nettis MA, Mondelli V, Howes O, Turkheimer FE, Bottlaender M, Bodini B, Stankoff B, Loggia ML and Veronese M (2024) A blood-free modeling approach for the quantification of the blood-to-brain tracer exchange in TSPO PET imaging. Front. Neurosci. 18:1395769. doi: 10.3389/fnins.2024.1395769
Edited by:
Adriaan Anthonius Lammertsma, University Medical Center Groningen, NetherlandsReviewed by:
Maqsood Yaqub, VU Medical Center, NetherlandsCatriona Wimberley, University of Edinburgh, United Kingdom
Copyright © 2024 Maccioni, Carranza Mellana, Brusaferri, Silvestri, Bertoldo, Schubert, Nettis, Mondelli, Howes, Turkheimer, Bottlaender, Bodini, Stankoff, Loggia and Veronese. This is an open-access article distributed under the terms of the Creative Commons Attribution License (CC BY). The use, distribution or reproduction in other forums is permitted, provided the original author(s) and the copyright owner(s) are credited and that the original publication in this journal is cited, in accordance with accepted academic practice. No use, distribution or reproduction is permitted which does not comply with these terms.
*Correspondence: Lucia Maccioni, bHVjaWEubWFjY2lvbmkuMUBwaGQudW5pcGQuaXQ=; Mattia Veronese, bWF0dGlhLnZlcm9uZXNlQHVuaXBkLml0