
95% of researchers rate our articles as excellent or good
Learn more about the work of our research integrity team to safeguard the quality of each article we publish.
Find out more
ORIGINAL RESEARCH article
Front. Neurosci. , 29 February 2024
Sec. Neuroprosthetics
Volume 18 - 2024 | https://doi.org/10.3389/fnins.2024.1364338
This article is part of the Research Topic Human-in-the-loop System Design and Control Adaptation for Behavior-Assistant Robots View all 11 articles
 Yuhan Ying1,2,3†
 Xin Huang4†Guoli Song1,2Yiwen Zhao1,2
 XinGang Zhao1,2
 Lin Shi5
 Ziqi Gao1,2,3
 Andi Li1,2,3Tian Gao6Hua Lu7*
 Guoguang Fan4*
In clinical practice and research, the classification and diagnosis of neurological diseases such as Parkinson’s Disease (PD) and Multiple System Atrophy (MSA) have long posed a significant challenge. Currently, deep learning, as a cutting-edge technology, has demonstrated immense potential in computer-aided diagnosis of PD and MSA. However, existing methods rely heavily on manually selecting key feature slices and segmenting regions of interest. This not only increases subjectivity and complexity in the classification process but also limits the model’s comprehensive analysis of global data features. To address this issue, this paper proposes a novel 3D context-aware modeling framework, named 3D-CAM. It considers 3D contextual information based on an attention mechanism. The framework, utilizing a 2D slicing-based strategy, innovatively integrates a Contextual Information Module and a Location Filtering Module. The Contextual Information Module can be applied to feature maps at any layer, effectively combining features from adjacent slices and utilizing an attention mechanism to focus on crucial features. The Location Filtering Module, on the other hand, is employed in the post-processing phase to filter significant slice segments of classification features. By employing this method in the fully automated classification of PD and MSA, an accuracy of 85.71%, a recall rate of 86.36%, and a precision of 90.48% were achieved. These results not only demonstrates potential for clinical applications, but also provides a novel perspective for medical image diagnosis, thereby offering robust support for accurate diagnosis of neurological diseases.
In clinical practice, Parkinson’s Disease (PD) and Multiple System Atrophy (MSA) are two neurodegenerative diseases. Despite their obvious differences in prognosis, treatment, and pathologic features, they are extremely similar in early symptoms (Palma et al., 2018). This poses a great challenge for doctors in their diagnosis (Song et al., 2007; Antonini, 2010). Parkinson’s disease has a high degree of heterogeneity, with different clinical subtypes, which makes diagnosis difficult (Wullner et al., 2023). According to statistics, the misdiagnosis rate of early-stage Parkinson’s disease can be as high as 20–30% (Poewe and Wenning, 2002). Misdiagnosis can potentially lead to doctors providing patients with incorrect treatment plans, resulting in disease progression and even irreversible neurological damage. Therefore, it is evident that diagnostic methods that rely solely on the personal experience of physicians may not be sufficiently reliable. As a result, there is an urgent need for a scientifically validated auxiliary diagnostic approaches to assist doctors in making diagnoses.
In recent years, with the development of medical imaging technology, many studies have been conducted to differentiate PD and MSA using advanced medical imaging. Among them, machine learning-based methods for extracting medical image features have shown promising results. For example, Chen et al. (2017, 2023) explored the differences in brain functional connectivity patterns between patients with PD and MSA, provided a diagnostic tool for PD and MSA using machine learning methods. Pang et al. (2020) extracted radiomics features on Susceptibility-weighted-imaging using machine learning methods for differential diagnosis of PD and MSA. Kim et al. (2022) constructed a machine learning model to extract radiological features using medical images, successfully differentiating various types of Parkinsonian syndromes. Bu et al. (2023) utilized different kinds of medical images to build a radiological model based on machine learning to differentiate PD from MSA. Although the above methods have shown good results in the diagnosis of PD and MSA, they all rely on manually selecting key feature slices and segmenting regions of interest. In addition, the features extracted by machine learning methods are filtered from a fixed set, which also presents limitations.
Currently, deep learning, as a cutting-edge technology of machine learning, shows great potential in the field of computer-aided diagnosis (Greenspan et al., 2016) and has made remarkable achievements in many aspects such as medical image analysis, pathology diagnosis and clinical decision support (Litjens et al., 2017; Panayides et al., 2020; Rehman et al., 2021). Some scholars have started applying deep learning techniques to studies on PD or MSA (Zhao et al., 2019; Jyotiyana et al., 2022; Wu et al., 2022). Among them, for the specific task of PD and MSA classification, some scholars have achieved considerable results by applying deep learning methods based on medical images. For example, Huseyn (2020) utilized Magnetic Resonance Imaging (MRI) with an improved AlexNet network structure to diagnose Parkinson’s disease, multiple system atrophy, and healthy individuals. Rau et al. (2023) proposed a deep learning algorithm capable of precisely segmenting the nucleus and shell, applying it to the diagnosis of PD and MSA. Compared to the aforementioned machine learning algorithms, although the features extracted by these methods are no longer limited to a fixed set of features, they still need to rely on manually selecting key feature slices and segmenting regions of interest, which does not allow for fully automated classification and diagnosis of diseases.
Therefore, we urgently need to develop a fully automatic classification model that can achieve classification diagnosis of PD and MSA without the need for manually selecting key feature slices and segmenting regions of interest. This approach would allow the model to comprehensively utilize data from the entire brain, enabling a comprehensive analysis of lesion features across various brain regions, thereby providing more reliable support for accurate diagnosis. In this study, we propose a novel 3D context-aware modeling framework called 3D-CAM. It allows a suitable convolutional neural network to be freely selected and embedded according to the dataset features in order to construct a classification model. The framework employs a 2D slicing-based strategy to process 3D Regional homogeneity (ReHo) data from brain Blood Oxygenation Level Dependent (BOLD) sequences (Zang et al., 2004). It segments the data into multiple 2D slices and uses them to train the classification model. The framework integrates two innovative modules: the Contextual Information Module and the Location Filtering Module. The Contextual Information Module is a feature enhancement module that can be inserted into any feature layer. It not only introduces features of adjacent slices, but also utilizes an attention mechanism to analyze the feature similarity between adjacent slices, enhancing focus on crucial features. This step effectively complements the inadequacy of 2D classification models in handling spatial information and contextual relationships. The Location Filtering Module is a post-processing module that not only leverages the 2D slice information to enable the model to concentrate on the slice segments with key features, but also analyzes and integrates the 2D slice information into the final 3D classification results. This step contributes to enhancing the model’s classification performance and enables it to identify key features more accurately.
The main contributions of this paper are as follows:
• A feature extraction framework called 3D-CAM is proposed for neurological disease classification. The framework achieves automatic classification with significant results in the classification tasks of PD and MSA.
• We propose a Contextual Information Module that can fuse the features of adjacent slices in any feature layer, enabling the network to emphasize key features and capture the spatial correlation between slices.
• We propose a Location Filtering Module that accurately concentrates on slice segments with key features, effectively enhancing the model’s classification performance by analyzing and integrating 2D slice information into 3D classification results.
The dataset for this study was obtained from the Neurology Outpatient Department of the First Hospital of China Medical University, covering patient data from July 2020 to August 2023.
For data acquisition, a 3.0 T MRI scanner outfitted with a 32-channel head coil was employed to acquire high-resolution T1 weighted MRI sequence and BOLD sequences in accordance with standardized scanning protocols. Subsequently, these sequences underwent processing to derive ReHo data. All processing procedures were executed using the Data Processing & Analysis of Brain Imaging (DPABI, RRID:SCR_010501), encompassing artifact removal, motion correction, temporal adjustments, and spatial normalization, as documented in pertinent literature (ChaoGan and YuFeng, 2010). Rigorous data quality assurance measures were undertaken, including meticulous data cleansing with manual exclusion of motion exceeding 3 mm, to ensure the integrity of the dataset.
Finally, we successfully obtained ReHo data from 189 patients, including 105 PD cases and 84 MSA cases. To ensure the effectiveness of model training, tuning, and evaluation, we divided these datasets into training set, validation set, and testing set according to the ratio of 7:1:2. Detailed sample information is shown in Figure 1.
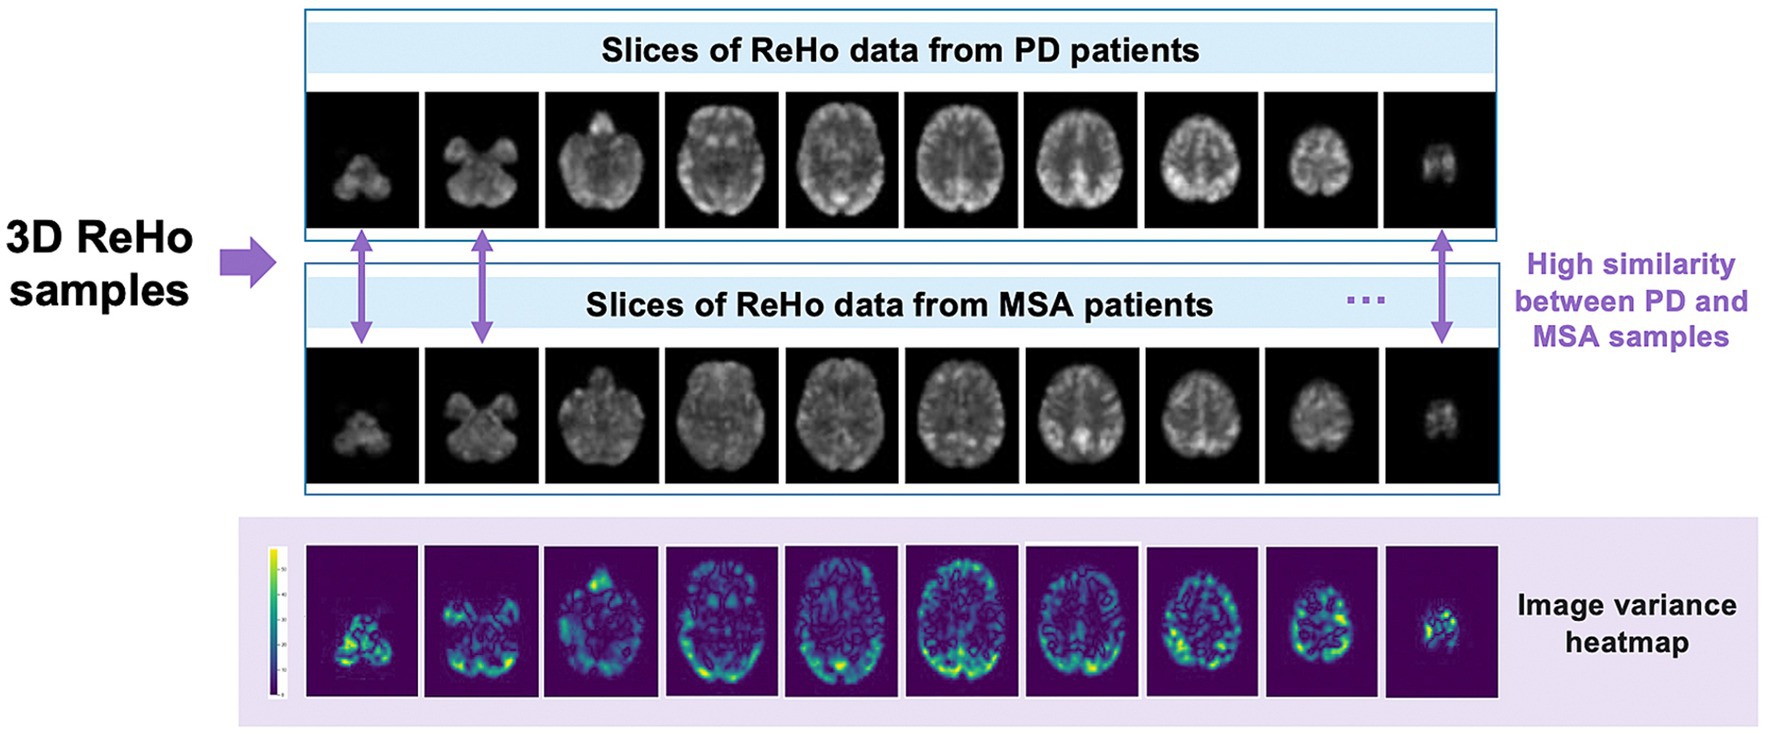
Figure 1. Example of ReHo data slices for PD patients and MSA patients.
The classification models in this paper are programmed using Python and Pytorch. We performed all experiments on a personal workstation with an Nvidia GeForce RTX 3080 GPU. For the optimizer, we chose a learning rate of 0.0001, a weight decay of 0.0001, and used a stochastic gradient descent algorithm with a momentum of 0.9. The batch size for training was set to 32. In addition, we chose the cross-entropy loss function during the training process. This loss function is widely used in classification problems and can effectively measure the difference between the model output and the real labels, which helps to optimize the network parameters to improve the classification accuracy.
In evaluating the network’s classification performance, various evaluation metrics were introduced, including accuracy, precision, and recall. These indices are defined by Equations (1)–(3). Where TP, FN, FP and TN represent correctly classified positive samples, misclassified positive samples, misclassified negative samples and correctly classified negative samples, respectively. In this paper, positive samples are PD patient data and negative samples are MSA patient data.
In addition, we introduce the Receiver Operating Characteristic (ROC) curve and the Area Under the Curve (AUC). The ROC curve is a curve plotted with the True Positive Rate (TPR) as the vertical coordinate and the False Positive Rate (FPR) as the horizontal coordinate at different thresholds. The AUC value is the area under the ROC curve, which is used as a measure of the quality of the classifier’s prediction. The closer the AUC value is to 1, the better the performance of the classifier. In order to verify the robustness and generalization ability of the model, several experiments were conducted and the results were statistically analyzed and compared.
In this work, we propose a novel deep learning-based framework for 3D medical image classification, named 3D-CAM. The framework of 3D-CAM is illustrated in Figure 2. 3D-CAM employs a 2D slicing-based strategy to slice the 3D ReHo data into multiple 2D slices for putting into the network. Unlike traditional training methods, we incorporate several adjacent slices surrounding the current slice as inputs to the network. 3D-CAM can be divided into two main stages as follows.
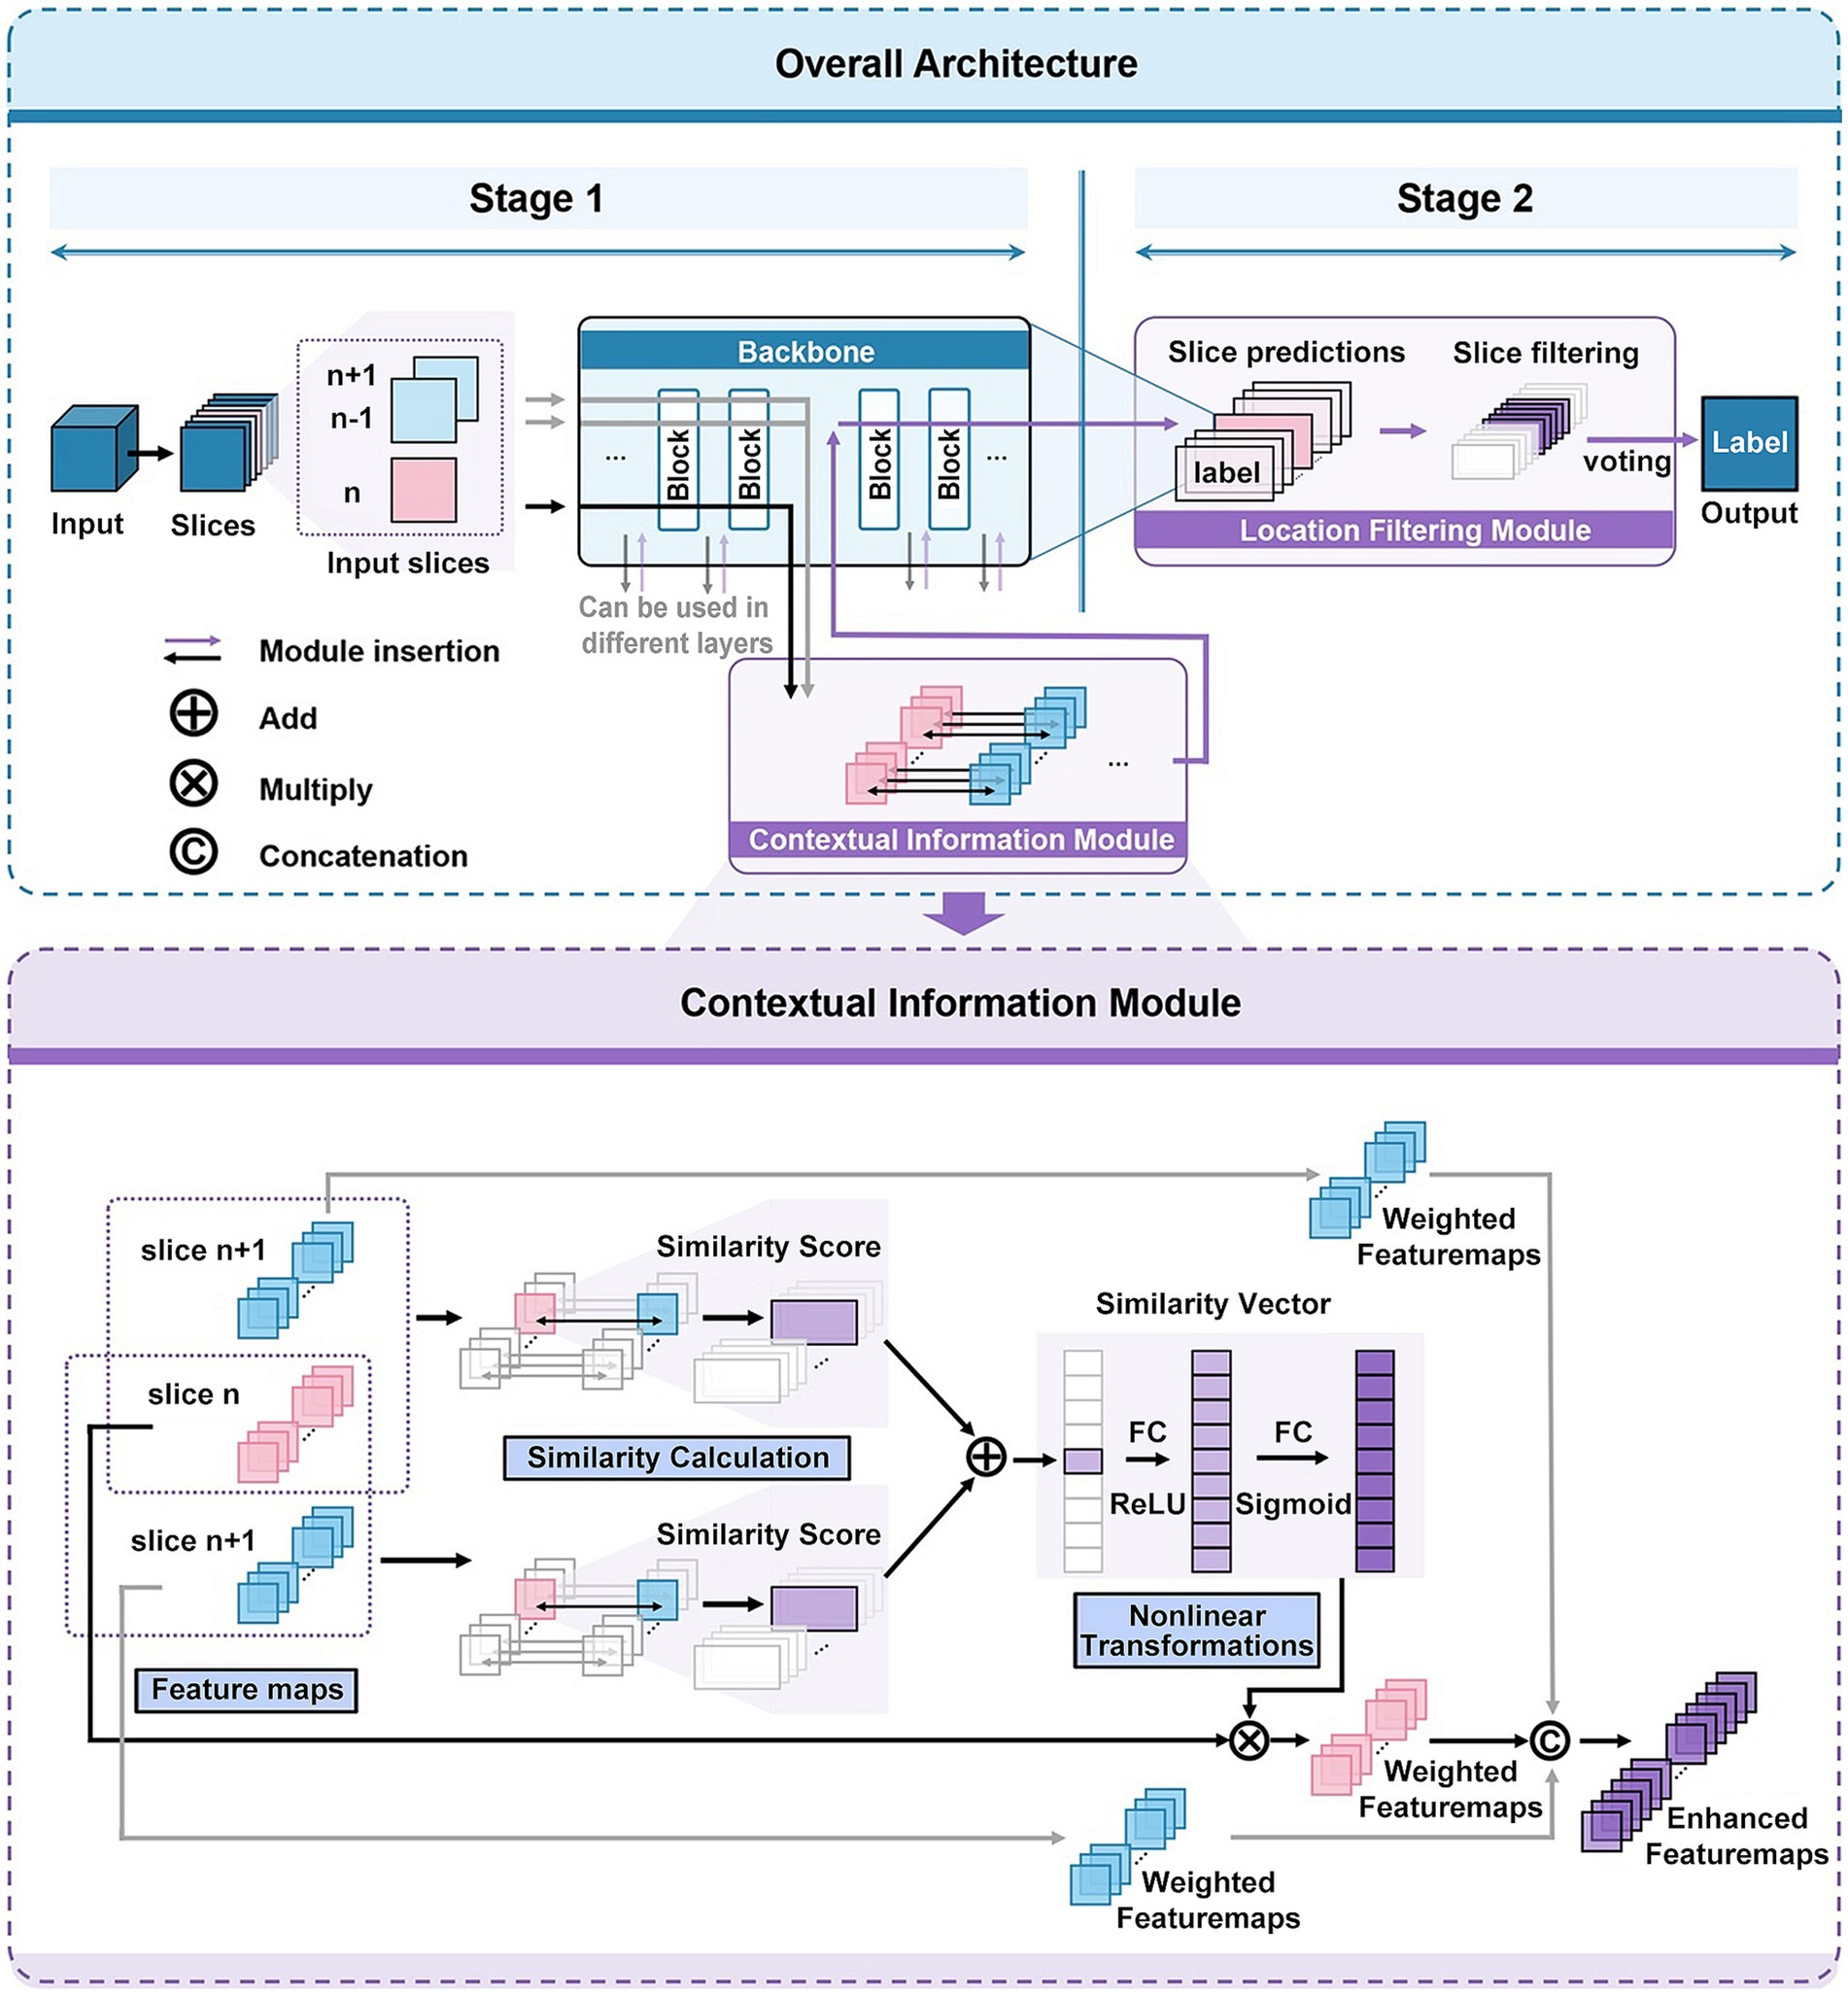
Figure 2. Network architecture of 3D-CAM. The upper part depicts the overall structure of 3D-CAM, including the specific configuration of the Location Filtering Module. The lower part depicts the detailed structure of the Contextual Information Module.
In the first stage, we freely choose a suitable convolutional network, such as ResNet (He et al., 2016), and embed it into the 3D-CAM framework. As the convolutional network extracts features from the current slice layer by layer, it also simultaneously extracts features from adjacent slices. During the feature extraction process, we introduce a Contextual Information Module at an optimal location. This module can simultaneously receive feature maps of the current slice and its adjacent slices as inputs, thereby achieving the effect of introducing contextual information. In order to make the network focused on overall features and capture the spatial correlation between slices, we introduce attention mechanism in this module. By analyzing the similarity between the features of the current slice and its adjacent slices, we reassign weights to different features for feature enhancement. Afterwards, the enhanced features are further processed by convolutional networks to obtain the prediction results of 2D slices.
In the second stage, we introduce a Location Filtering Module to enhance the classification performance and integrate the 2D classification information into 3D classification results. This module is designed to filter the sliced segments with more significant classification features. In this step, we categorize all the 2D slice data used for training by location and compute the prediction accuracies of the slices with different locations in validation set. Based on this analysis, we filter out the consecutive slices with high prediction accuracy as the key prediction segments of the sample. Following this, we apply a voting mechanism to integrate the prediction results of each 2D slice within the segment to obtain 3D prediction results. This process aims to optimize and accurately extract segments with significant classification features serving as the basis for 3D classification.
When a 2D slicing-based strategy is used to process 3D data, the connection between different 2D slices is usually ignored, which leads to the loss of some spatial information. Therefore, to comprehensively capture data features and conduct a holistic analysis, we propose a Contextual Information Module, depicted in specific structure as illustrated in Figure 2.
When inserting a Contextual Information Module at the th layer of a neural network with a depth of to extract features, each input slice, following the initial layers of the neural network, generates a collection of feature maps denoted as (4). denotes the set of feature maps obtained by extracting the th input slice in the th layer of the neural network. denotes the number of feature maps in the th layer, and denotes the th feature map extracted from the th input slice after passing through layers of the neural network.
When the network acquires , its adjacent slices features and are also acquired at the same time and stored in the contextual feature module.
Next, to enhance the neural network’s attention to the overall features as well as to capture the spatial correlation between slices, we introduce attention mechanism. We compute the similarity between the feature map obtained from the current slice and the feature maps and of its adjacent slices. The Structural Similarity Index (SSIM) (Wang et al., 2004) is used here as a similarity measure. SSIM is an effective image similarity metric and its computation includes the consideration of statistics such as mean, variance and covariance. The SSIM formula (5) for calculating the similarity between two feature maps A and B is as follows:
In this formula, and denote the pixel mean values of feature maps and , and denote their respective pixel variances, is their pixel covariance, and and are constants introduced for stability.
Based on the aforementioned SSIM formula, we define the weight (6) as the average value of the similarity between the feature map and its adjacent slices of the feature maps , . The formula for this weight is as follows:
In this formula, denotes the similarity between feature maps and , while denotes the similarity between feature maps and . The introduction of such weights aims to make the network paying more attention to the consistency of overall features while capturing spatial correlations between slices.
In order to better capture the correlation between feature maps, we specially design a neural network (7, 8) structure to dynamically adjust the original weight . This structure comprises two linear layers and two activation functions. Here, and denote the weight matrix and bias terms of the first linear layer, and denotes the activation function of the first layer. and denote the weight matrix and bias terms of the second linear layer, and denotes the activation function of the second layer. The formulas are as follows:
Then, applying the adjusted weight to the original feature map, the weighted feature map (9) can be obtained.
After that, each feature map in is weighted based on the previously mentioned steps to form a new set (10) of feature maps:
By introducing the attention mechanism, we adjust the weight of each feature map. The new set of feature maps contains more spatially relevant and globally consistent features. It is conducive to better integrating spatial information into the feature extraction process, improving the perceptual ability and performance of the network.
In order to better incorporate the spatial information into the feature extraction network, we embed the feature maps and of adjacent slices together into the network, so as to comprehensively considering the contribution of adjacent slices features to the current features. We use weights α, β to perform weighted summation on the feature map sets , and to obtain the final feature (11) after enhancement, where α is a smaller weight than β to emphasize the importance of the current slice. The formula of is:
This approach efficiently integrates the features of adjacent slices into the current feature maps, enhancing the capacity for global information representation of features.
After processing in the Contextual Information Module, we obtain a set of enhanced feature maps. These feature maps contain more spatial information and help the network to focus more on overall feature consistency while taking into account the importance of different features. Using similarity information to enhance the perception of spatial correlation can improve the feature representation capability of the network.
In order to improve the classification performance and integrate the 2D classification information into 3D classification results, this paper introduces a Location Filtering Module. In many 3D medical datasets, such as the dataset used in this paper, the slices at both ends usually contain less image information. Therefore, we want to filter the slice segments with more significant classification features located in the center location and vote them as key slice segments to obtain more accurate classification results.
First, we calculated the prediction accuracies of slices at different locations in the validation set. Let the number of 2D slices for each sample be and the location number be (from 1 to ). The accuracy of each location is (12). Here, denotes the number of correctly predicted samples at location , and denotes the total number of samples at location .
Next, we aim to find a contiguous segment among all possible slice segments where the average accuracy within that segment exceeds the threshold . Additionally, this segment should be the longest among all possible segments, in order to retain as much information as possible while maintaining a high level of accuracy. This selected segment can be considered as the key slice segment and will be involved in subsequent voting and analyses. The formula to find this segment (13) is shown below:
In this equation, and are parameters used to search for the longest segment. represents the starting position, while represents the length of the segment. is an indicator function that returns 1 if and 0 otherwise. Through this step, we finally identify the region of interest with a starting position and length with high prediction accuracy and use it as the key prediction segment.
Next, we adopt a voting mechanism to integrate the prediction results of each 2D slice located at the key slice segment aforementioned (14). The specific formula is as follows:
In this equation, denotes the probability that the final weighted voting prediction result is class . denotes the total number of filtered slices in the key slice segment. is an indicator function, which indicates 1 when , and 0 otherwise. denotes the prediction category of the th slice. Finally, 3D prediction results can be obtained based on the prediction probability .
In order to verify the reliability of the proposed method in this paper and to propose new methods for automatic diagnosis of PD and MSA, we conducted the following experiments.
We applied our proposed innovative framework, 3D-CAM, to the classification tasks of PD and MSA. Specifically, we applied the two innovative modules, the Contextual Information Module and the Location Filtering Module, to specific layers of the classical model in order to enhance its performance. To ensure consistency, we inserted the Contextual Information Module in the layers corresponding to the 32 × 32 feature maps of each model. Additionally, we have investigated several families of classical convolutional neural network models, including EfficientNet (Tan and Le, 2020), DenseNet (Huang et al., 2018), ResNet (He et al., 2016), and Inception (Szegedy et al., 2015) as backbones. In order to identify the model with the best performance in our task, we compared multiple versions in each model family. Finally, we selected the best-performing model from each family for further analysis. The experimental results are detailed in Table 1.
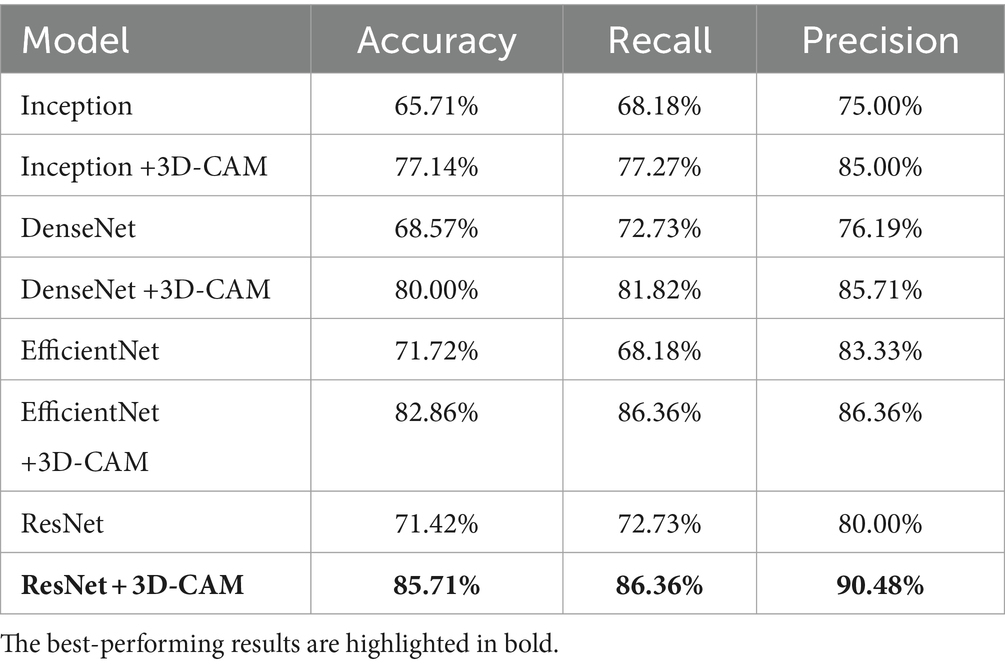
Table 1. Comparative experimental results of different models.
In our experiments, we observe that different feature extraction networks can be embedded into 3D-CAM, while all of them show different degrees of improvement in classification accuracy. We also find that for our task, ResNet34-based 3D-CAM shows the best performance with 85.71% accuracy on the test set.
To verify the effect of our proposed two modules on the model performance, we conducted ablation experiments. On the currently best-performing model, we gradually removed these two modules and obtained two sets of ablation experimental results, as detailed in Table 2. Here, Module 1 represents the Contextual Information Module, and Module 2 represents the Location Filtering Module.
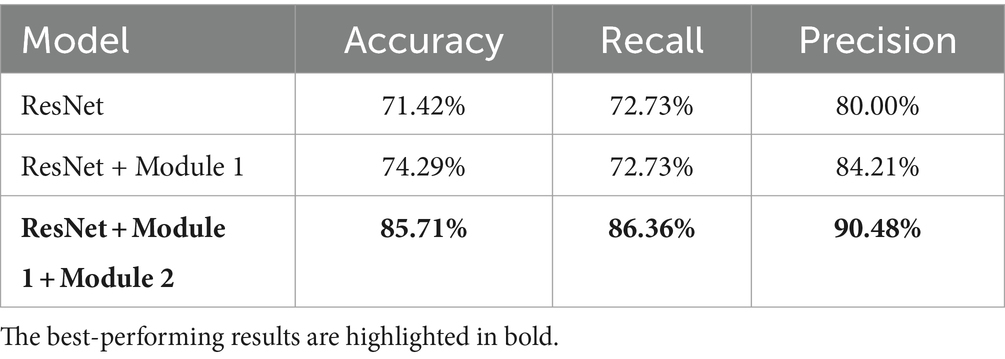
Table 2. Ablation experiments.
The results of the ablation experiments showed that the removal of either module resulted in a significant decrease in model performance. This validates the importance of both modules to the model performance. These results strongly support the validity of our proposed modules and confirm their positive impact on the overall model performance.
In order to determine the optimal insertion location of the Contextual Information Module, we conducted additional experiments. On the base of the currently best-performing model, we adjusted the insertion location of the Contextual Information Module and observed its effect on the model performance. We attempted to insert the modules at locations with different feature map sizes and recorded the optimal performance of the model performance in each case, as shown in Table 3.
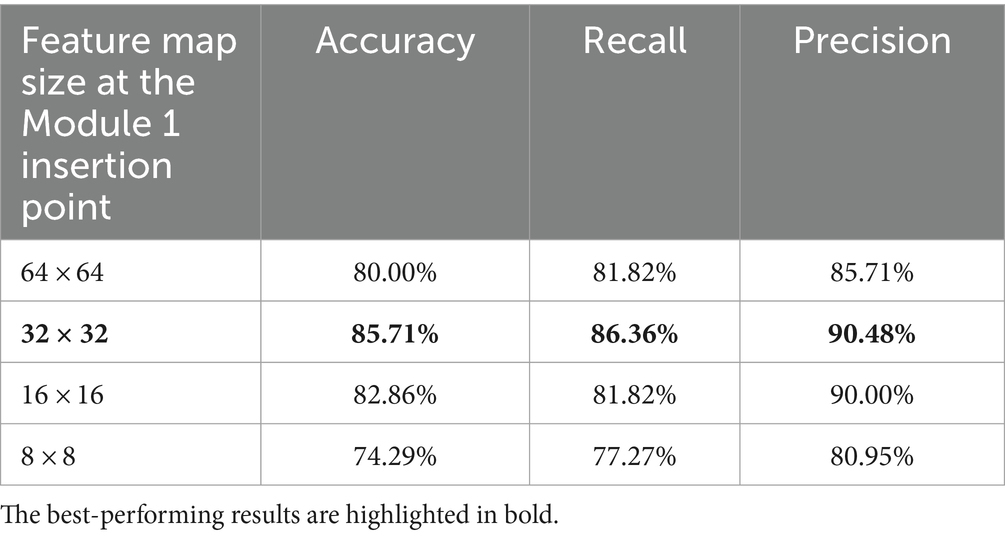
Table 3. Experimental results inserted by the Module 1 at different locations on the optimal model.
The results above show that inserting the Contextual Information Module after a feature map of 32×32 size can bring the maximum performance improvement to the model with an accuracy of 85.71%. The ROC curve of the best-performing model is shown in Figure 3, with an AUC value of 0.85. This result also demonstrates the impact of different insertion locations of the Contextual Information Module on the model performance. These results strongly support the necessity of exploring the optimal insertion location for the Contextual Information Module and provide important ideas for improving the model performance.
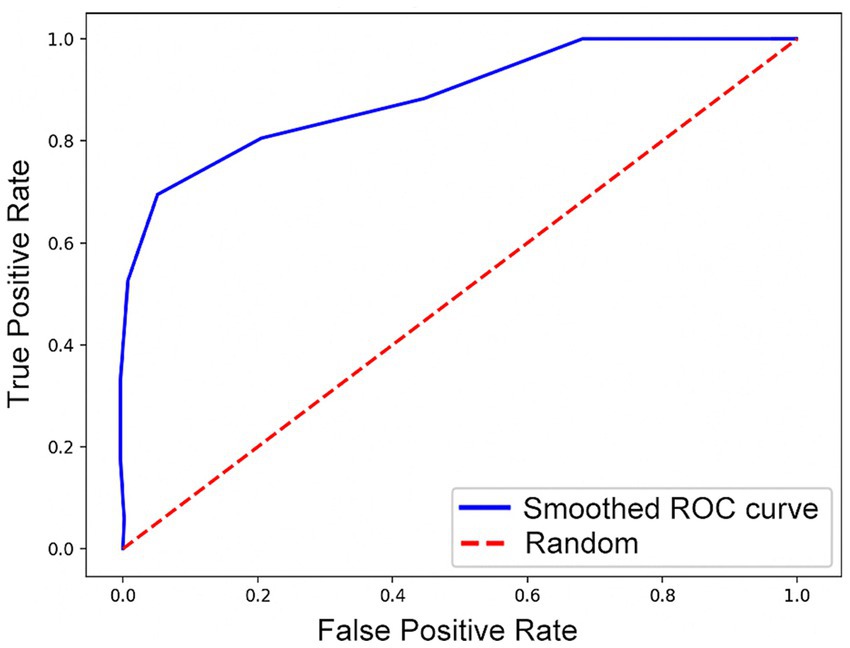
Figure 3. ROC curve.
In summary, through all the aforementioned experiments, we have successfully determined the optimal model for this task. This process not only validates the effectiveness of the proposed innovative modules, but also provides an effective method for the automatic classification of PD and MSA.
Our experimental results demonstrate that the deep learning framework 3D-CAM can effectively classify PD and MSA based on medical images, achieving a classification accuracy of 85.71% and an AUC value of 0.85. This outcome shows the capability of our research method to learn disease-related image features from medical imaging data in an effective manner.
We speculate that the reason why the 3D-CAM framework performs well in experiments and outperforms other classical deep learning models is because it is specifically designed for PD and MSA classification tasks. It not only learns features from the current slice but also integrates key features from adjacent slices. At the same time, by utilizing attention mechanisms, it allows the network to focus more on overall features and the segment of slices that contain crucial features.
Recently, several studies have shown promising results in the diagnosis of PD and MSA using machine learning methods, such as Chen et al. (2017), Pang et al. (2020), Bu et al. (2023), and Chen et al. (2023). Among them, the dataset volume used by Pang et al. (2020) is comparable to our research, making it highly relevant. They obtained an AUC value of 0.862 in the classification task of PD and MSA on the test set, slightly higher than our result of 0.85. Although their results slightly outperforms the one we proposed, the approach by Pang et al. (2020) relies on manually selecting key feature slices and segmenting regions of interest, which greatly increases the subjectivity and complexity of the classification process. Moreover, the features extracted by machine learning methods are selected from a fixed set, which also presents limitations. The other studies based on machine learning methods mentioned above also suffer from these issues.
Some researchers have attempted to diagnose PD and MSA through deep learning methods, such as Huseyn (2020) and Rau et al. (2023). Among them, Huseyn (2020) proposed an innovative deep learning model, achieving an accuracy of about 88% in the classification task of PD and MSA, slightly higher than our proposed model’s accuracy of 85.71%. However, the aforementioned deep learning methods still rely on manually selecting key feature slices and segmenting regions of interest, which does not allow for fully automated classification and diagnosis of diseases. In addition, neurodegenerative diseases affect the entire brain of patients, and relying solely on local brain information within the regions of interest limits exploration of lesion features in other brain regions.
Compared to previous studies, 3D-CAM framework has achieved significant progress in the classification of PD and MSA. It no longer rely on manual selection of slices and regions of interest, successfully achieving fully automated classification. This method significantly reduces the investment of manpower and time. Additionally, by conducting direct analysis of global brain data instead of restricting to specific regions of interest, it enables the capture of more comprehensive feature information from the entire brain, leading to a significant enhancement in diagnostic accuracy and efficiency.
However, despite the promising results achieved by our approach, it is important to note some potential limitations. Firstly, although we have conducted our research using a large amount of data, the outcomes are still constrained by the current dataset. In the future, with the increase of data volume, we are expected to further optimize the model to obtain more reliable and comprehensive diagnostic results. Secondly, our study has focused solely on the classification tasks of PD and MSA, and applications to other neurological disorders have not been explored. Therefore, future research can further investigate the applicability of this framework in classifying other diseases.
In conclusion, our research has proposed an effective deep learning framework that offers a reliable solution for the classification of PD and MSA based on medical imaging, achieving satisfactory classification accuracy. This study offers strong support for early detection of neurodegenerative diseases and has broad prospect for clinical application. Additionally, our research provides new ideas and tools for the diagnosis and treatment of neurodegenerative diseases, and is expected to provide solid support for the future advancement of related fields.
The raw data supporting the conclusions of this article will be made available by the authors, without undue reservation.
The studies involving humans were approved by the Medical Research Ethics Committee of the First Affiliated Hospital of China Medical University. The studies were conducted in accordance with the local legislation and institutional requirements. The participants provided their written informed consent to participate in this study. Written informed consent was obtained from the individual(s) for the publication of any potentially identifiable images or data included in this article.
YY: Writing – original draft, Writing – review & editing, Methodology, Project administration. XH: Writing – original draft, Writing – review & editing, Project administration. GS: Funding acquisition, Resources, Writing – review & editing. YZ: Funding acquisition, Resources, Writing – review & editing. XZ: Funding acquisition, Resources, Writing – review & editing. LS: Funding acquisition, Resources, Writing – review & editing. ZG: Funding acquisition, Resources, Writing – review & editing. AL: Funding acquisition, Resources, Writing – review & editing. TG: Funding acquisition, Resources, Writing – review & editing. HL: Funding acquisition, Resources, Writing – review & editing. GF: Supervision, Writing – review & editing.
The author(s) declare financial support was received for the research, authorship, and/or publication of this article. This work was supported by the National Natural Science Foundation of China (62073314 and 92048203), Liaoning Provincial Natural Science Foundation of China (2022-YQ-06), Beijing Hospitals Authority Clinical Medicine Development of special funding support (YGLX202321), Beijing Natural Science Foundation (JQ23038), and Wuxi Science and Technology Bureau’s Research Project Plan (Y20222022).
We are grateful to all the patients who provided data for this study.
The authors declare that the research was conducted in the absence of any commercial or financial relationships that could be construed as a potential conflict of interest.
All claims expressed in this article are solely those of the authors and do not necessarily represent those of their affiliated organizations, or those of the publisher, the editors and the reviewers. Any product that may be evaluated in this article, or claim that may be made by its manufacturer, is not guaranteed or endorsed by the publisher.
Antonini, A. (2010). Imaging for early differential diagnosis of parkinsonism. Lancet Neurol. 9, 130–131. doi: 10.1016/S1474-4422(09)70360-6
Bu, S., Pang, H., Li, X., Zhao, M., Wang, J., Liu, Y., et al. (2023). Multi-parametric radiomics of conventional T1 weighted and susceptibility-weighted imaging for differential diagnosis of idiopathic Parkinson's disease and multiple system atrophy. BMC Med. Imaging 23:204. doi: 10.1186/s12880-023-01169-1
ChaoGan, Y., and YuFeng, Z. (2010). DPARSF: a MATLAB toolbox for "pipeline" data analysis of resting-state fMRI. Front. Syst. Neurosci. 4:13. doi: 10.3389/fnsys.2010.00013
Chen, B., Cui, W., Wang, S., Sun, A., Yu, H., Liu, Y., et al. (2023). Functional connectome automatically differentiates multiple system atrophy (parkinsonian type) from idiopathic Parkinson's disease at early stages. Hum. Brain Mapp. 44, 2176–2190. doi: 10.1002/hbm.26201
Chen, B., Fan, G., Sun, W., Shang, X., Shi, S., Wang, S., et al. (2017). Usefulness of diffusion-tensor MRI in the diagnosis of Parkinson variant of multiple system atrophy and Parkinson's disease: a valuable tool to differentiate between them? Clin. Radiol. 72, 610.e9–610.e15. doi: 10.1016/j.crad.2017.02.005
Greenspan, H., Ginneken, B. V., and Summers, R. M. (2016). Guest editorial deep learning in medical imaging: overview and future promise of an exciting new technique. IEEE Trans. Med. Imaging 35, 1153–1159. doi: 10.1109/TMI.2016.2553401
He, K., Zhang, X., Ren, S., and Sun, J. (2016). Deep residual learning for image recognition. in Proceedings of the IEEE Conference on Computer Vision and Pattern Recognition, 770–778.
Huang, G., Liu, Z., Van Der Maaten, L., and Weinberger, K. Q. (2018). Densely connected convolutional networks. in Proceedings of the IEEE Conference on Computer Vision and Pattern Recognition, 2261–2269.
Huseyn, E. (2020). Deep learning based early diagnostics of Parkinsons disease. arXiv arXiv:2008.01792
Jyotiyana, M., Kesswani, N., and Kumar, M. (2022). A deep learning approach for classification and diagnosis of Parkinson’s disease. Soft. Comput. 26, 9155–9165. doi: 10.1007/s00500-022-07275-6
Kim, Y. S., Lee, J. H., and Gahm, J. K. (2022). Automated differentiation of atypical parkinsonian syndromes using brain Iron patterns in susceptibility weighted imaging. Diagnostics 12:637. doi: 10.3390/diagnostics12030637
Litjens, G., Kooi, T., Bejnordi, B. E., Setio, A. A. A., Ciompi, F., Ghafoorian, M., et al. (2017). A survey on deep learning in medical image analysis. Med. Image Anal. 42, 60–88. doi: 10.1016/j.media.2017.07.005
Palma, J. A., Norcliffe-Kaufmann, L., and Kaufmann, H. (2018). Diagnosis of multiple system atrophy. Auton. Neurosci. 211, 15–25. doi: 10.1016/j.autneu.2017.10.007
Panayides, A. S., Amini, A., Filipovic, N. D., Sharma, A., Tsaftaris, S. A., Young, A., et al. (2020). AI in medical imaging informatics: current challenges and future directions. IEEE J. Biomed. Health Inform. 24, 1837–1857. doi: 10.1109/JBHI.2020.2991043
Pang, H., Yu, Z., Li, R., Yang, H., and Fan, G. (2020). MRI-based Radiomics of basal nuclei in differentiating idiopathic Parkinson's disease from parkinsonian variants of multiple system atrophy: a susceptibility-weighted imaging study. Front. Aging Neurosci. 12:587250. doi: 10.3389/fnagi.2020.587250
Poewe, W., and Wenning, G. (2002). The differential diagnosis of Parkinson's disease. Eur. J. Neurol. 9, 23–30. doi: 10.1046/j.1468-1331.9.s3.3.x
Rau, A., Schroter, N., Rijntjes, M., Bamberg, F., Jost, W. H., Zaitsev, M., et al. (2023). Deep learning segmentation results in precise delineation of the putamen in multiple system atrophy. Eur. Radiol. 33, 7160–7167. doi: 10.1007/s00330-023-09665-2
Rehman, A., Ahmed Butt, M., and Zaman, M. (2021). A survey of medical image analysis using deep learning approaches. in Proceedings of 5th International Conference on Computing Methodologies and Communication (ICCMC), 1334–1342.
Song, Y. J., Lundvig, D. M., Huang, Y., Gai, W. P., Blumbergs, P. C., Hojrup, P., et al. (2007). p25alpha relocalizes in oligodendroglia from myelin to cytoplasmic inclusions in multiple system atrophy. Am. J. Pathol. 171, 1291–1303. doi: 10.2353/ajpath.2007.070201
Szegedy, C., Liu, W., Jia, Y., Sermanet, P., Reed, S., Anguelov, D., et al. (2015). Going deeper with convolutions. in Proceedings of the IEEE Conference on Computer Vision and Pattern Recognition, 2818–2826.
Tan, M., and Le, Q. (2020). EfficientNet: rethinking model scaling for convolutional neural networks. in Proceedings of the International Conference on Machine Learning. PMLR, 6105–6114.
Wang, Z., Bovik, A. C., Sheikh, H. R., and Simoncelli, E. P. (2004). Image quality assessment: from error visibility to structural similarity. IEEE Trans. Image Process. 13, 600–612. doi: 10.1109/tip.2003.819861
Wu, P., Zhao, Y., Wu, J., Brendel, M., Lu, J., Ge, J., et al. (2022). Differential diagnosis of parkinsonism based on deep metabolic imaging indices. J. Nucl. Med. 63, 1741–1747. doi: 10.2967/jnumed.121.263029
Wullner, U., Borghammer, P., Choe, C. U., Csoti, I., Falkenburger, B., Gasser, T., et al. (2023). The heterogeneity of Parkinson's disease. J. Neural Transm. (Vienna) 130, 827–838. doi: 10.1007/s00702-023-02635-4
Zang, Y., Jiang, T., Lu, Y., He, Y., and Tian, L. (2004). Regional homogeneity approach to fMRI data analysis. NeuroImage 22, 394–400. doi: 10.1016/j.neuroimage.2003.12.030
Zhao, Y., Wu, P., Wang, J., Li, H., Navab, N., Yakushev, I., et al. (2019). A 3D deep residual convolutional neural network for differential diagnosis of parkinsonian syndromes on 18F-FDG PET images. in 2019 41st Annual International Conference of the IEEE Engineering in Medicine and Biology Society (EMBC), 3531–3534.
Keywords: medical image analysis, computer-aided diagnosis, deep learning, Parkinson’s disease, multiple system atrophy, regional Homogeneity, general feature extraction network
Citation: Ying Y, Huang X, Song G, Zhao Y, Zhao X, Shi L, Gao Z, Li A, Gao T, Lu H and Fan G (2024) 3D-CAM: a novel context-aware feature extraction framework for neurological disease classification. Front. Neurosci. 18:1364338. doi: 10.3389/fnins.2024.1364338
Edited by:
Ningbo Yu, Nankai University, ChinaReviewed by:
Xufeng Yao, University of Shanghai for Science and Technology, ChinaCopyright © 2024 Ying, Huang, Song, Zhao, Zhao, Shi, Gao, Li, Gao, Lu and Fan. This is an open-access article distributed under the terms of the Creative Commons Attribution License (CC BY). The use, distribution or reproduction in other forums is permitted, provided the original author(s) and the copyright owner(s) are credited and that the original publication in this journal is cited, in accordance with accepted academic practice. No use, distribution or reproduction is permitted which does not comply with these terms.
*Correspondence: Guoguang Fan, ZmFuZ3VvZ0BzaW5hLmNvbQ==; Hua Lu, bHVodWExOTY5QGhvdG1haWwuY29t
†These authors have contributed equally to this work and share first authorship
Disclaimer: All claims expressed in this article are solely those of the authors and do not necessarily represent those of their affiliated organizations, or those of the publisher, the editors and the reviewers. Any product that may be evaluated in this article or claim that may be made by its manufacturer is not guaranteed or endorsed by the publisher.
Research integrity at Frontiers
Learn more about the work of our research integrity team to safeguard the quality of each article we publish.