 Jessie Mosso1,2†
 Guillaume Briand1,2†
 Katarzyna Pierzchala1,2
 Dunja Simicic1,2
 Alejandra Sierra3
 Ali Abdollahzadeh4
 Ileana O. Jelescu5,6
 Cristina Cudalbu1,2*
- 1CIBM Center for Biomedical Imaging, Lausanne, Switzerland
- 2Animal Imaging and Technology, École polytechnique fédérale de Lausanne (EPFL), Lausanne, Switzerland
- 3A.I. Virtanen Institute for Molecular Sciences, University of Eastern Finland, Kuopio, Finland
- 4Center for Biomedical Imaging, Department of Radiology, New York University Grossman School of Medicine, New York, NY, United States
- 5Department of Radiology, Lausanne University Hospital (CHUV), Lausanne, Switzerland
- 6Faculty of Biology and Medicine, University of Lausanne, Lausanne, Switzerland
Introduction: Type C hepatic encephalopathy (HE) is a decompensating event of chronic liver disease leading to severe motor and cognitive impairment. The progression of type C HE is associated with changes in brain metabolite concentrations measured by 1H magnetic resonance spectroscopy (MRS), most noticeably a strong increase in glutamine to detoxify brain ammonia. In addition, alterations of brain cellular architecture have been measured ex vivo by histology in a rat model of type C HE. The aim of this study was to assess the potential of diffusion-weighted MRS (dMRS) for probing these cellular shape alterations in vivo by monitoring the diffusion properties of the major brain metabolites.
Methods: The bile duct-ligated (BDL) rat model of type C HE was used. Five animals were scanned before surgery and 6- to 7-week post-BDL surgery, with each animal being used as its own control. 1H-MRS was performed in the hippocampus (SPECIAL, TE = 2.8 ms) and dMRS in a voxel encompassing the entire brain (DW-STEAM, TE = 15 ms, diffusion time = 120 ms, maximum b-value = 25 ms/μm2) on a 9.4 T scanner. The in vivo MRS acquisitions were further validated with histological measures (immunohistochemistry, Golgi-Cox, electron microscopy).
Results: The characteristic 1H-MRS pattern of type C HE, i.e., a gradual increase of brain glutamine and a decrease of the main organic osmolytes, was observed in the hippocampus of BDL rats. Overall increased metabolite diffusivities (apparent diffusion coefficient and intra-stick diffusivity—Callaghan’s model, significant for glutamine, myo-inositol, and taurine) and decreased kurtosis coefficients were observed in BDL rats compared to control, highlighting the presence of osmotic stress and possibly of astrocytic and neuronal alterations. These results were consistent with the microstructure depicted by histology and represented by a decline in dendritic spines density in neurons, a shortening and decreased number of astrocytic processes, and extracellular edema.
Discussion: dMRS enables non-invasive and longitudinal monitoring of the diffusion behavior of brain metabolites, reflecting in the present study the globally altered brain microstructure in BDL rats, as confirmed ex vivo by histology. These findings give new insights into metabolic and microstructural abnormalities associated with high brain glutamine and its consequences in type C HE.
1 Introduction
Diffusion-weighted MRI (dMRI) has emerged as a promising “super-resolution” technique that can provide information about tissue microstructure non-invasively in the order of a micron. dMRI uses the diffusion of water molecules and their interaction with tissue cellular components to generate image contrast. This signal originates from ubiquitous water molecules present in all cell types and extracellular spaces, thus limiting its specificity to any tissue compartment, cell type, or physiological phenomenon. In contrast, brain metabolites measured by magnetic resonance spectroscopy (MRS) are predominantly intracellular, and some metabolites have preferential localization within specific brain cell types (Najac et al., 2016). Myo-inositol (Ins) and glutamine (Gln) concentrations are higher in astrocytes, and N-acetylaspartate (NAA) and glutamate (Glu) concentrations are higher in neurons (Brand et al., 1993; Urenjak et al., 1993; Harris et al., 2015). Although the representation of metabolite localization in one cell type is over-simplistic in vivo (Rae, 2014), it constitutes a useful assumption for MRS studies.
The combination between diffusion weighting and MRS, diffusion-weighted MRS (dMRS), enables the measurement of metabolite diffusion properties, which are expected to reflect properties of intracellular space (i.e., cell-type geometry, structure, cytosol viscosity, and molecular crowding). Different dMRS modeling approaches have been proposed to quantify cell microstructure (Ligneul et al., 2024), and, among others, alterations of astrocytic morphology were observed in a mouse model of reactive astrocytes and cuprizone-fed mice as a model of glial inflammation (Ligneul et al., 2019; Genovese et al., 2021).
Type C hepatic encephalopathy (HE) is a severe neurological condition that arises as a consequence of chronic liver disease (Monfort et al., 2009; Dharel and Bajaj, 2015; Häussinger et al., 2022). In type C HE, the high ammonium delivery to the brain, due to impaired urea cycle in the cirrhotic liver, is causing Gln accumulation and the gradual release of other metabolites (Ins, taurine (Tau), total choline (tCho)) as an osmotic response (Rackayova et al., 2016; Lanz et al., 2017; Braissant et al., 2019; Cudalbu and Taylor-Robinson, 2019; Rackayová et al., 2021; Pierzchala et al., 2023). In spite of this apparent osmoregulation, a mild increase in the apparent diffusion coefficient (ADC) of water has sometimes been observed in patients with type C HE (Kale et al., 2006). It has been associated with edema without a clear consensus on its compartmentalization (Cudalbu and Taylor-Robinson, 2019; Pierzchala et al., 2023). The overall interpretation of diffusion data is difficult and sometimes controversial, as extracting quantitative metrics that characterize the underlying tissue microstructure requires modeling of the diffusion signal (Jelescu and Budde, 2017; Jelescu et al., 2020), which has not yet been proposed in type C HE. Furthermore, the presence of brain edema and/or increased brain water content is still controversial in type C HE, as type C HE, in contrast to acute HE, is characterized by lower blood ammonium values and a longer disease time course, allowing for the presence of compensatory mechanisms (Pierzchala et al., 2023). Gln synthesis in the central nervous system is largely confined to astrocytes (the site of glutamine synthetase activity) (Martinez-Hernandez et al., 1977). Thus, it has been postulated that HE is the clinical manifestation of astrocyte swelling and/or astrocyte reactivity due to increased osmotic pressure triggered by Gln accumulation, with Gln acting as an osmolyte driving water into the cells. Although the pathological role of astrocytes in animal models and humans with severe hyperammonemia and liver failure has been confirmed, it has also become clear that additional cell types in the brain are also involved in the pathogenesis of HE. To date, the direct effects of Gln accumulation on astrocytes and potentially on other cell morphology concomitant with the appearance of brain edema in type C HE are not clear, mainly due to a limited number of in vivo studies. An increase in brain Gln will eventually lead to cellular microstructural changes despite osmoregulation (i.e., release of other brain osmolytes). Diffusion-weighted MRS is a powerful tool to study these alterations non-invasively and in vivo in an animal model of type C HE.
The aim of our study was to follow in vivo the longitudinal evolution of brain Gln and other metabolite diffusion properties in a rat model of type C HE using dMRS, thus providing information on potential microstructural alterations during type C HE. Furthermore, histological assessment of the brain tissue was performed to validate the in vivo dMRS findings, and short TE 1H-MRS measurements in the hippocampus were performed to validate the well-known metabolic changes in type C HE.
2 Materials and methods
2.1 Animal model of chronic liver disease induced type C HE
All experiments were approved by the Committee on Animal Experimentation for the Canton de Vaud, Switzerland (VD3022.1). Adult male Wistar rats underwent bile duct ligation (BDL; Charles River Laboratories, L’Arbresle, France, 175–200 g at surgery) to create a model of chronic liver disease-induced type C HE, as previously described (Braissant et al., 2019; DeMorrow et al., 2021), and SHAM surgery as controls for histology assessment only. BDL animals were scanned longitudinally under isoflurane anesthesia (~1.5%, in a mixture of 50% oxygen and 50% air). A first scan was performed before surgery (n = 5, “week 0”), and a second scan between 6- and 7-week post-BDL (same animals, n = 5, “week 6”); the long duration of the MRI/MRS experiments did not allow us to scan all animals on the same day. For the MRI/MRS scans, all animals were placed in an in-house-built holder, with the head fixed in a stereotaxic system using a bite bar and a pair of ear bars. A small-animal monitor system (SA Instruments, New York, NY, USA) was used to monitor the body temperature (maintained at 37.7 ± 0.2°C by warm circulating water and measured with a rectal thermosensor) and the respiration rate. Blood samples of bilirubin (Reflotron Plus system, F. Hoffmann-La Roche Ltd.) and ammonium (PocketChem™ BA PA-4140) were performed before the MRI/MRS scans (before BDL and at week 6–7 post-BDL) to validate the model of chronic liver disease.
2.2 MRI, 1H-MRS and dMRS
All experiments were performed on a 9.4 T, actively shielded MRI system with a 31-cm horizontal bore (Magnex Scientific, Oxford, United Kingdom), featuring a 12-cm gradient coil insert (400 mT/m, 120 μs) interfaced to an Agilent/Varian Direct Drive console (Palo Alto, CA, USA). An in-house-built 1H quadrature transceiver was used (25-mm inner diameter).
Fast T2-weighted images (multislice turbo-spin-echo sequence, TR = 4,000 ms, TEeff = 52 ms, echo train length = 8, field of view (FOV) = 23 × 23 mm2, slice thickness = 1 mm, 15 slices, matrix size = 256 × 256, two averages) were acquired in the axial direction to position the volumes of interest (VOIs) for 1H-MRS. First, a 1H-MRS scan was performed in the hippocampus (2 × 2.8 × 2 mm3, 11.8 μL) using the SPECIAL sequence (TE = 2.8 ms, TR = 4 s, 160 shots) to measure neurometabolism, as previously described (Braissant et al., 2019). Then, dMRS data were acquired using a localized STEAM-based spectroscopic pulse sequence (Kunz et al., 2010; Ligneul et al., 2024) (TE/TM = 15/112 ms, 5 kHz spectral width, 4,096 spectral points, single shot acquisitions) in a voxel ranging from 162 to 245 μL depending on the animal. The dMRS voxel size was increased compared to the hippocampus MRS voxel due to the lower signal-to-noise ratio (SNR) in the diffusion experiments as compared to a simple MRS acquisition. FASTESTMAP (Gruetter, 1993; Gruetter and Tkác, 2000) was used for shimming, leading to water linewidths of 9–10 Hz in the hippocampus and of 18–20 Hz for the dMRS VOI (Figure 1A). Outer volume suppression blocks were interleaved with the VAPOR water suppression module. Diffusion gradients were applied simultaneously along three orthogonal directions (gradient duration δ = 6 ms, diffusion time Δ = 120 ms, direction [1,1,1]). A total of nine b-values (in ms/μm2, corrected for cross-terms (Kunz et al., 2010; Mosso et al., 2024)) with the following number of shots were acquired: 0.4 (160), 1.5 (160), 6.0 (160), 7.6 (160), 9.3 (160), 13.3 (320), 15.6 (480), 20.8 (480), and 25.1 (480).
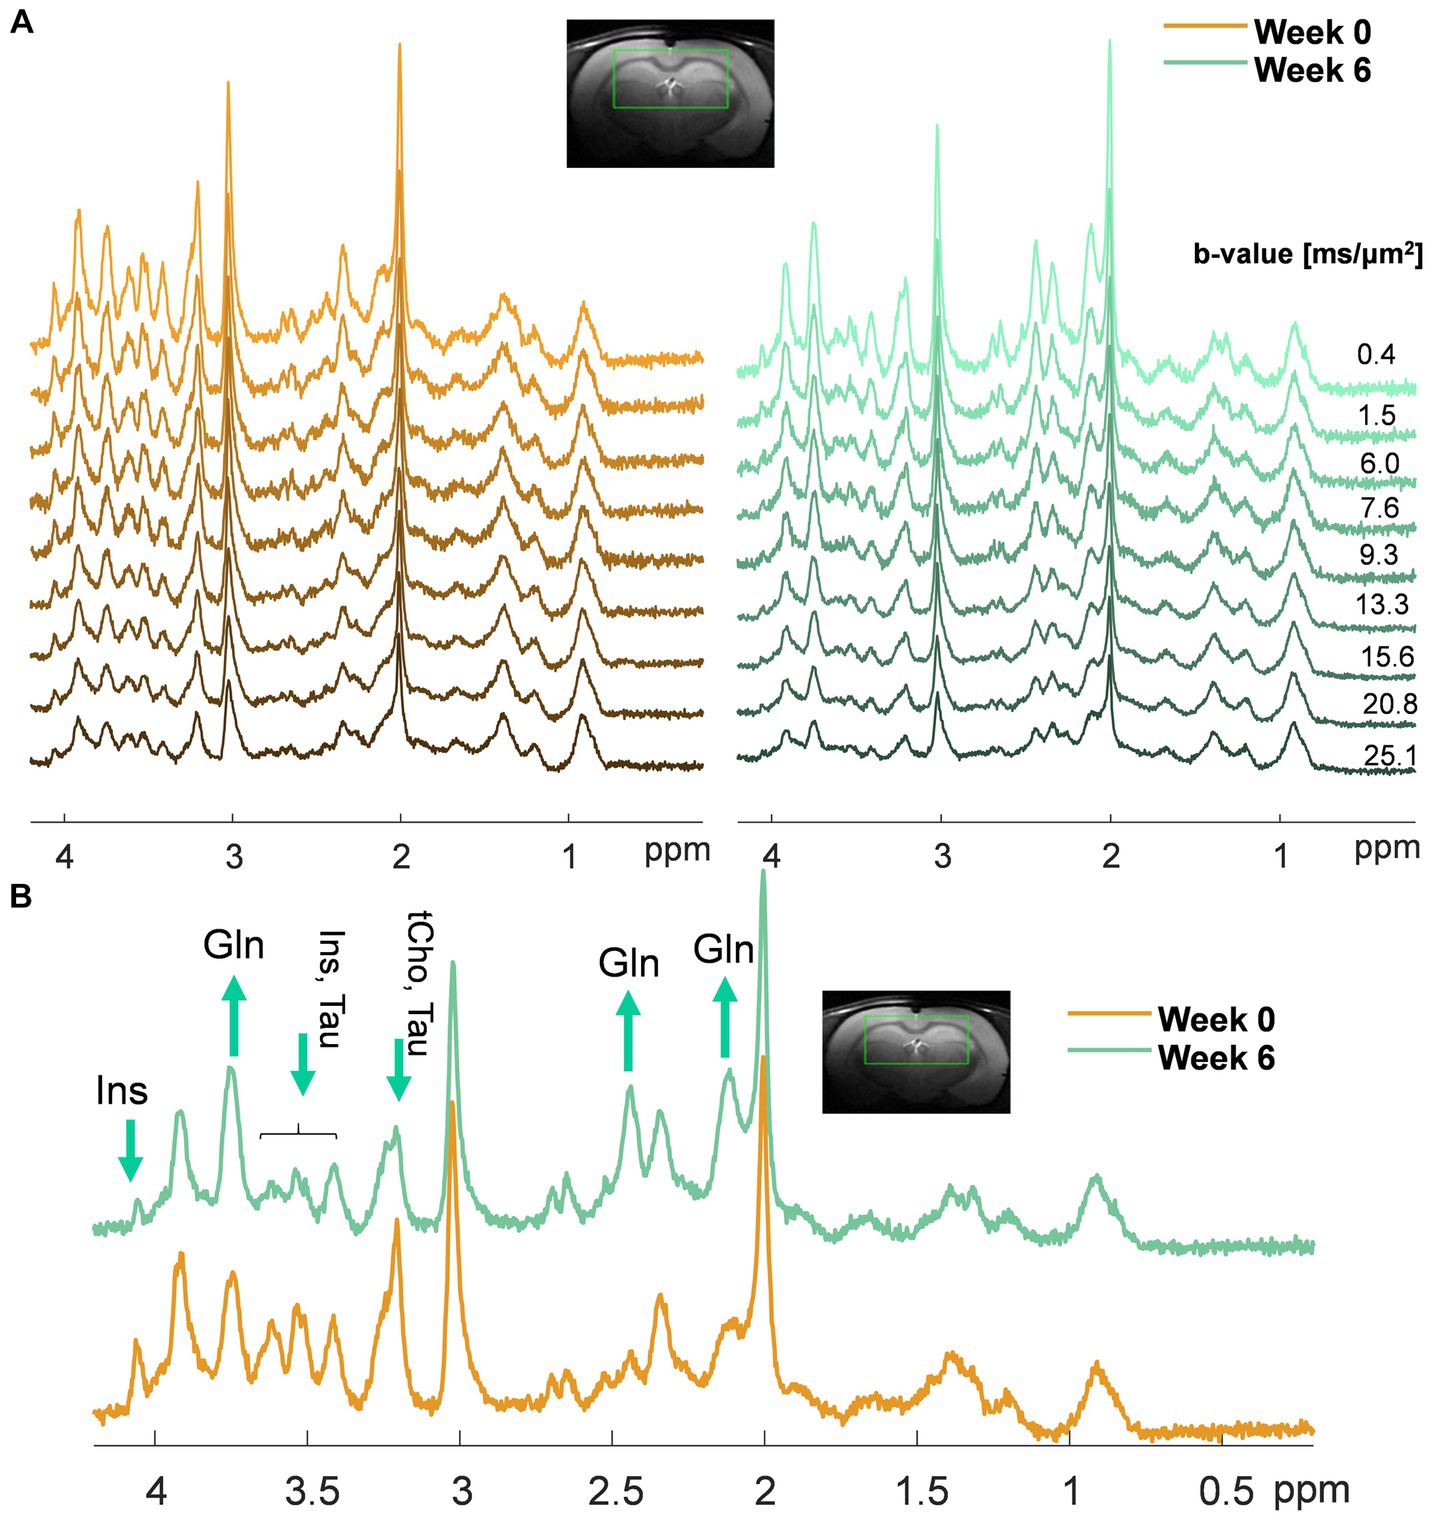
Figure 1. (A) Representative sets of diffusion-weighted spectra in one animal at week 0 (orange, left) and week 6 post-BDL surgery (green, right) acquired with diffusion-weighted STEAM. The voxel position and the b-values used are displayed at the top. Of note, the differences in noise level among the spectra are due to a different number of shots for each on the b-value (less noise at high b-values due to more shots); (B) Example of spectra acquired in the same animal at week 0 (orange) and week 6 post-BDL surgery (green) at b = 0.4 ms/μm2, highlighting with arrows the increase in brain Gln and decrease of the main brain osmolytes (i.e., Ins, tCho, Tau) observed qualitatively.
Spectra were collected as single shots (consecutive ISIS acquisitions from SPECIAL were directly combined, with each combination being labeled as “shot” in this article) and corrected for eddy current distortions and phase and frequency drifts. Outlier shots with manifest signal drops (>50%) were removed, and all shots were averaged. Metabolite signals were quantified using LCModel (Version 6.3-1 N) combined with an in vitro measured metabolite basis set for 1H-MRS hippocampus spectra and a simulated metabolite basis set for dMRS spectra using published values of J-coupling constants and chemical shifts (Govindaraju et al., 2000; Govind et al., 2015). The following metabolites were included in the basis sets: alanine (Ala), ascorbate (Asc), aspartate (Asp), β-hydroxybutyrate (bHB), glycerophosphocholine (GPC), phosphocholine (PCho), creatine (Cr), phosphocreatine (PCr), glycine (Gly), GABA, glucose (Glc), Gln, glutamate (Glu), glutathione (GSH), Ins, lactate (Lac), N-acetylaspartate (NAA), N-acetylaspartylglutamate (NAAG), phosphoethanolamine (PE), scyllo-inositol (Scyllo), and Tau. In addition, an in vivo macromolecule spectrum acquired under the same conditions as in vivo 1H-MRS and dMRS data was included in each of the corresponding metabolite basis sets (single inversion recovery, TI = 750 ms, TR = 2,500 ms, no diffusion weighting, and metabolite residuals eliminated as described previously (Cudalbu et al., 2021; Simicic et al., 2021)). For 1H-MRS, metabolites with relative Cramer Rao Lower Bounds (CRLB) below 25% at week 0 for all animals were reported (selecting reported metabolites but not individual values), a purposely loose criterion to avoid filtering out low-concentrated metabolites (Kreis, 2016). For dMRS, to limit error propagation, only metabolites with relative CRLBs below 6% at the lowest b-value for all animals were reported.
Metabolite signal decays as a function of b-value were then fitted using two different approaches, using a non-linear least squares algorithm in MATLAB (fit function, Trust-Region method): First, Callaghan’s model of randomly oriented sticks (Callaghan et al., 1979) (mimicking neurites or processes) with metabolite diffusivity Dintra along the neurite/process:
Second, the cumulant expansion at second order:
Yielding the apparent diffusion coefficient D and kurtosis K, where b refers to the b-value and erf refers to the error function. Assuming an underlying isotropic distribution of sticks (Callaghan’s model) (Equation 1), the radius of convergence of the cumulant expansion is given by the first zero of the error function in the complex plane (Kiselev and Il'yasov, 2007), whereby assuming a diffusivity of about 0.3 μm2/ms, bc = 19 ms/μm2. b-values up to bc were used for this fit. For each metabolite, the fits were performed on the individual animal diffusion signal decay, and the fitted parameters were reported as mean and SD across animals. The fits were also performed on the group-averaged diffusion signal decay for each metabolite, yielding a mean coefficient.
A detailed table of the acquisition and processing parameters following the experts’ consensus recommendations on minimum reporting standards in in vivo MRS (Lin et al., 2021) is presented in Supplementary Table S1.
2.3 Histology assessments
2.3.1 Fluorescence and Brightfield microscopy
Animals (SHAM and BDL animals) were sacrificed for histological evaluation between week 6 and 7 post-BDL. The deeply anesthetized (4% isoflurane for 5 min) animals were injected with analgesic (Temgesic [Essex Pharma], 0.1 mg/kg) before transcardiac perfusion with PBS. Due to the complexity of the experiments, additional groups of animals (in addition to the ones scanned by dMRS) were used for histological evaluation and electron microscopy, and SHAM animals were not used for electron microscopy. All animals were controlled for blood bilirubin and ammonium values to ensure that the presence and evolution of CLD were in fact reflective of the dMRS group.
2.3.2 Immunohistochemistry (IHC)
Brains (SHAM n = 3, BDL n = 3) were fixed in a 4% formaldehyde PBS solution overnight at 4°C, washed with PBS, and cryopreserved in a 30% sucrose PBS solution at 4°C for 48 h. They were then embedded in Tissue-Tek® O.C.T. compound and cut into 16-μm sagittal sections. Astrocyte morphological alterations were depicted using mouse monoclonal anti-GFAP antibody (MAB360 Merck Millipore) (2 h at RT, 1:100 dilution) with secondary Alexa Fluor® 594-AffiniPure+ Rat Anti-Mouse IgG (H + L) antibody (415–585-166 Jackson ImmunoResearch Europe Ltd.) (1 h at RT, 1:200 dilution). Nuclei were stained with DAPI (D1306, Thermo Fisher Scientific). The stained sections were mounted with ProLong™ Diamond Antifade Mountant and covered with coverslip. Morphometric measurements (processes number/cell and processes length) were performed using Sholl analysis, as previously described (Braissant et al., 2019). A total of 200 astrocytes from each group were randomly selected and traced for all processes identified through GFAP staining. An average of 350 astrocytic processes were measured per sample, amounting to approximately 1,000 processes per group (seven slides/rat).
2.3.3 Golgi-cox staining
Golgi-Cox staining was performed to unveil the detailed morphology of the CA1 hippocampus neurons (Zaqout and Kaindl, 2016). Extracted brains were directly immersed in the Golgi-Cox staining solution, then stored in the dark at room temperature for 25 days prior to being washed with PBS, and cryopreserved for 48 h in 30% sucrose in PBS at 4°C. Brains were sliced into 115-μm-thick sagittal sections using a Leica VT1200 S vibratome (25 slides/hemisphere, SHAM n = 3, BDL n = 7). After the staining procedure and dehydration, the slides were mounted with Neo-Mount (EMD Millipore). For quantitative analysis, only uniformly stained tissue with clearly apparent dendritic segments and spines was used. The surface of the neuronal soma was measured, and dendritic spines were manually counted (CA1 neurons: BDL soma ~200 cells, apical and basal dendrites ~100 each; SHAM soma ~120 cells, apical and basal dendrites ~60 each). The images were acquired using a Meiji Techno TC5600 Microscope (INFINITYX-32 camera, picture size: 6,464× 4,864 pixels). The image processing and the quantitative immunohistochemical analysis were performed with INFINITY ANALYZE 7 software (Lumenera, Canada).
2.3.4 Electron microscopy (EM)
Deeply anesthetized BDL rats (n = 3) received an intraperitoneal injection of sodium pentobarbital. Afterward, a cardiac perfusion with 20 mL of isotonic PBS followed immediately with 300 mL of 2.5% glutaraldehyde and 2% formaldehyde in phosphate buffer (0.1 M, pH 7.4) was performed. The brains were removed 2 h after perfusion, and 100-μm-thick coronal sections were cut through the somatosensory cortex, striatum, hippocampus, and cerebellum (vibratome Leica VT1200; Leica Microsystems). Following a cacodylate buffer wash (0.1 m, pH 7.4), the sections were postfixed for 1 h in 1.5% potassium ferrocyanide and 2% osmium tetroxide in 0.13 M ice-cold cacodylate buffer, followed by 30 min in 2% osmium tetroxide alone, each in the same buffer, and then overnight (O/N) at 4°C in 1% uranyl acetate in water. After dehydrating in alcohol, the sections were infiltrated O/N with Durcupan resin (Fluka, Buchs, Switzerland). The sections were flat embedded between glass slides in fresh resin and left O/N at 65°C for the resin to harden. The images were acquired using a Carl ZEISS Merlin With 3View (Gatan) Scanning Electron Microscope (SEM) (current: 300 pA, voltage: 1.6 kV, image size: 6 nm/pixel, and z-axis: 50 nm) and analyzed with ImageJ FiJi16.
2.3.4.1 Edema reconstruction
We imaged 21 × 21 × 14.75 μm3 of the hippocampus using the SEM method with a voxel size of 6 × 6 × 50 nm3, 3,500 × 3,500 × 295 voxel3. We applied the DeepACSON pipeline (Abdollahzadeh et al., 2021a,b) for the semantic segmentation of the extracellular edema in the acquired 3D-EM dataset. We used a small training set—six 2D planar images manually segmented for edema. The images were tiled into 350 × 350 voxel2 non-overlapping patches to initiate the training. To deal with the small training sets, we enhanced the performance of the networks by sequentially giving feedback as manual corrections to the network predictions. The training procedure for the networks follows the description in Abdollahzadeh et al. (2021a,b). For the instance segmentation of the extracellular edema, we applied a bottom-up percentile-based region agglomeration technique to merge over-segmented watersheds to perform instance segmentation of the intra-axonal spaces (Behanova et al., 2022).
2.4 Statistics
Data are presented as mean ± SD. For MRS, differences in metabolite concentration estimates were assessed with a repeated measure two-way analysis of variance (ANOVA) (Prism 5.03, GraphPad, La Jolla, CA, United States), with metabolites and disease (weeks 0 and 6) factors. For dMRS, differences in diffusion parameters based on individual animal fitting were assessed with a repeated measures two-way ANOVA on each parameter individually (ADC, AKC, Dintra), with metabolites and disease (weeks 0 and 6) factors. For both MRS and dMRS, Bonferroni’s multi-comparisons post-hoc test was applied, where the number of comparisons was set to the number of metabolites passing the CRLB criteria (n = 17 comparisons for MRS and n = 7 for dMRS). For the histological measures, a two-way ANOVA with post-hoc Tukey HSD was used to test for statistical significance. All tests were two-tailed. The significance level in all tests was attributed as follows: *p < 0.05, **p < 0.01, ***p < 0.001, ****p < 0.0001.
3 Results
The characteristic 1H-MRS pattern of type C HE, i.e., a gradual increase of Gln as a result of ammonia detoxification and a decrease in the main organic osmolytes as an osmoregulatory response (Rackayova et al., 2016; Flatt et al., 2017; Braissant et al., 2019; Rackayová et al., 2021; Mosso et al., 2022), was present in the rats investigated in the current study. 1H-MRS in the hippocampus showed a significant increase of brain Gln (+178 ± 95%****), a decrease of Ins (−29 ± 14%**), trends of decrease for Tau, tCho, Glu, Asc, tCr (Cr + PCr), and GSH, and no difference for GABA, Lac, PE, tNAA (NAA + NAAG), and the macromolecules (Supplementary Figure S1). Alanine, aspartate, bHB, glycine, glucose, and scyllo-inositol, often poorly quantified even at high fields, were not reported as they did not survive the 1H-MRS CRLB criterion.
Similar patterns were observed in the dMRS voxel on low b-value spectra (qualitative results in Figure 1B): an increase in Gln (2.1 ppm and 3.7 ppm, observed from its relative amplitude compared to NAA), together with a decrease in the main osmolyte Ins (3.5 ppm).
Furthermore, all BDL rats displayed an increase in plasma bilirubin (from undetectable to 9.1 ± 2.1 mg/dL) and blood ammonium (from 25.9 ± 7.5 to 59.3 ± 30.9 μM) at 6-week post-BDL, both validating the BDL surgery and thus the chronic liver disease.
The quality of the acquired dMRS spectra both at week 0 and week 6 (Figure 1A) allowed the estimation of diffusion parameters of Gln, Glu, NAA, Ins, Tau, tCho (GPC + PCho), and tCr (Cr + PCr) and a fair comparison between the two time points. Supplementary Figure S2 displays the quality of the LCModel fits in a representative set of diffusion-weighted spectra acquired in one animal at weeks 0 and 6 post-BDL.
Figure 2 displays the metabolite signal diffusion decays with b-value, averaged over the cohort of animals at weeks 0 (green) and 6 (orange) after normalization to b = 0.4 ms/μm2. A good quality fit was obtained with some minor discrepancies for tCho, tCr, and Tau at high b-values. To further evaluate data quality, the metabolite signal diffusion decays of individual animals are also plotted in Supplementary Figures S3,S4. The derived metabolites ADC before surgery (Figure 3, first panel, orange, “week 0”) were in good agreement with results in the healthy rodent brain (Ligneul et al., 2019). After a 6-week period after surgery, an increase in intra-neurite/process diffusivity Dintra was measured for all metabolites (disease effect: **** with +58 ± 16% increase for Gln:**, n = 5 rats), as estimated from the sticks model (Equation 1) (Figure 3). The cumulant expansion fit (Equation 2) confirmed this trend: an increase in ADC (disease effect:****, subject-matching:* with +35 ± 14% increase for Gln:*, +29 ± 21% increase for Ins:*, +17 ± 18% increase for Tau:*, n = 5 rats) and a trend of decrease in kurtosis for some metabolites were observed, although the latter was not significant (Figure 3).
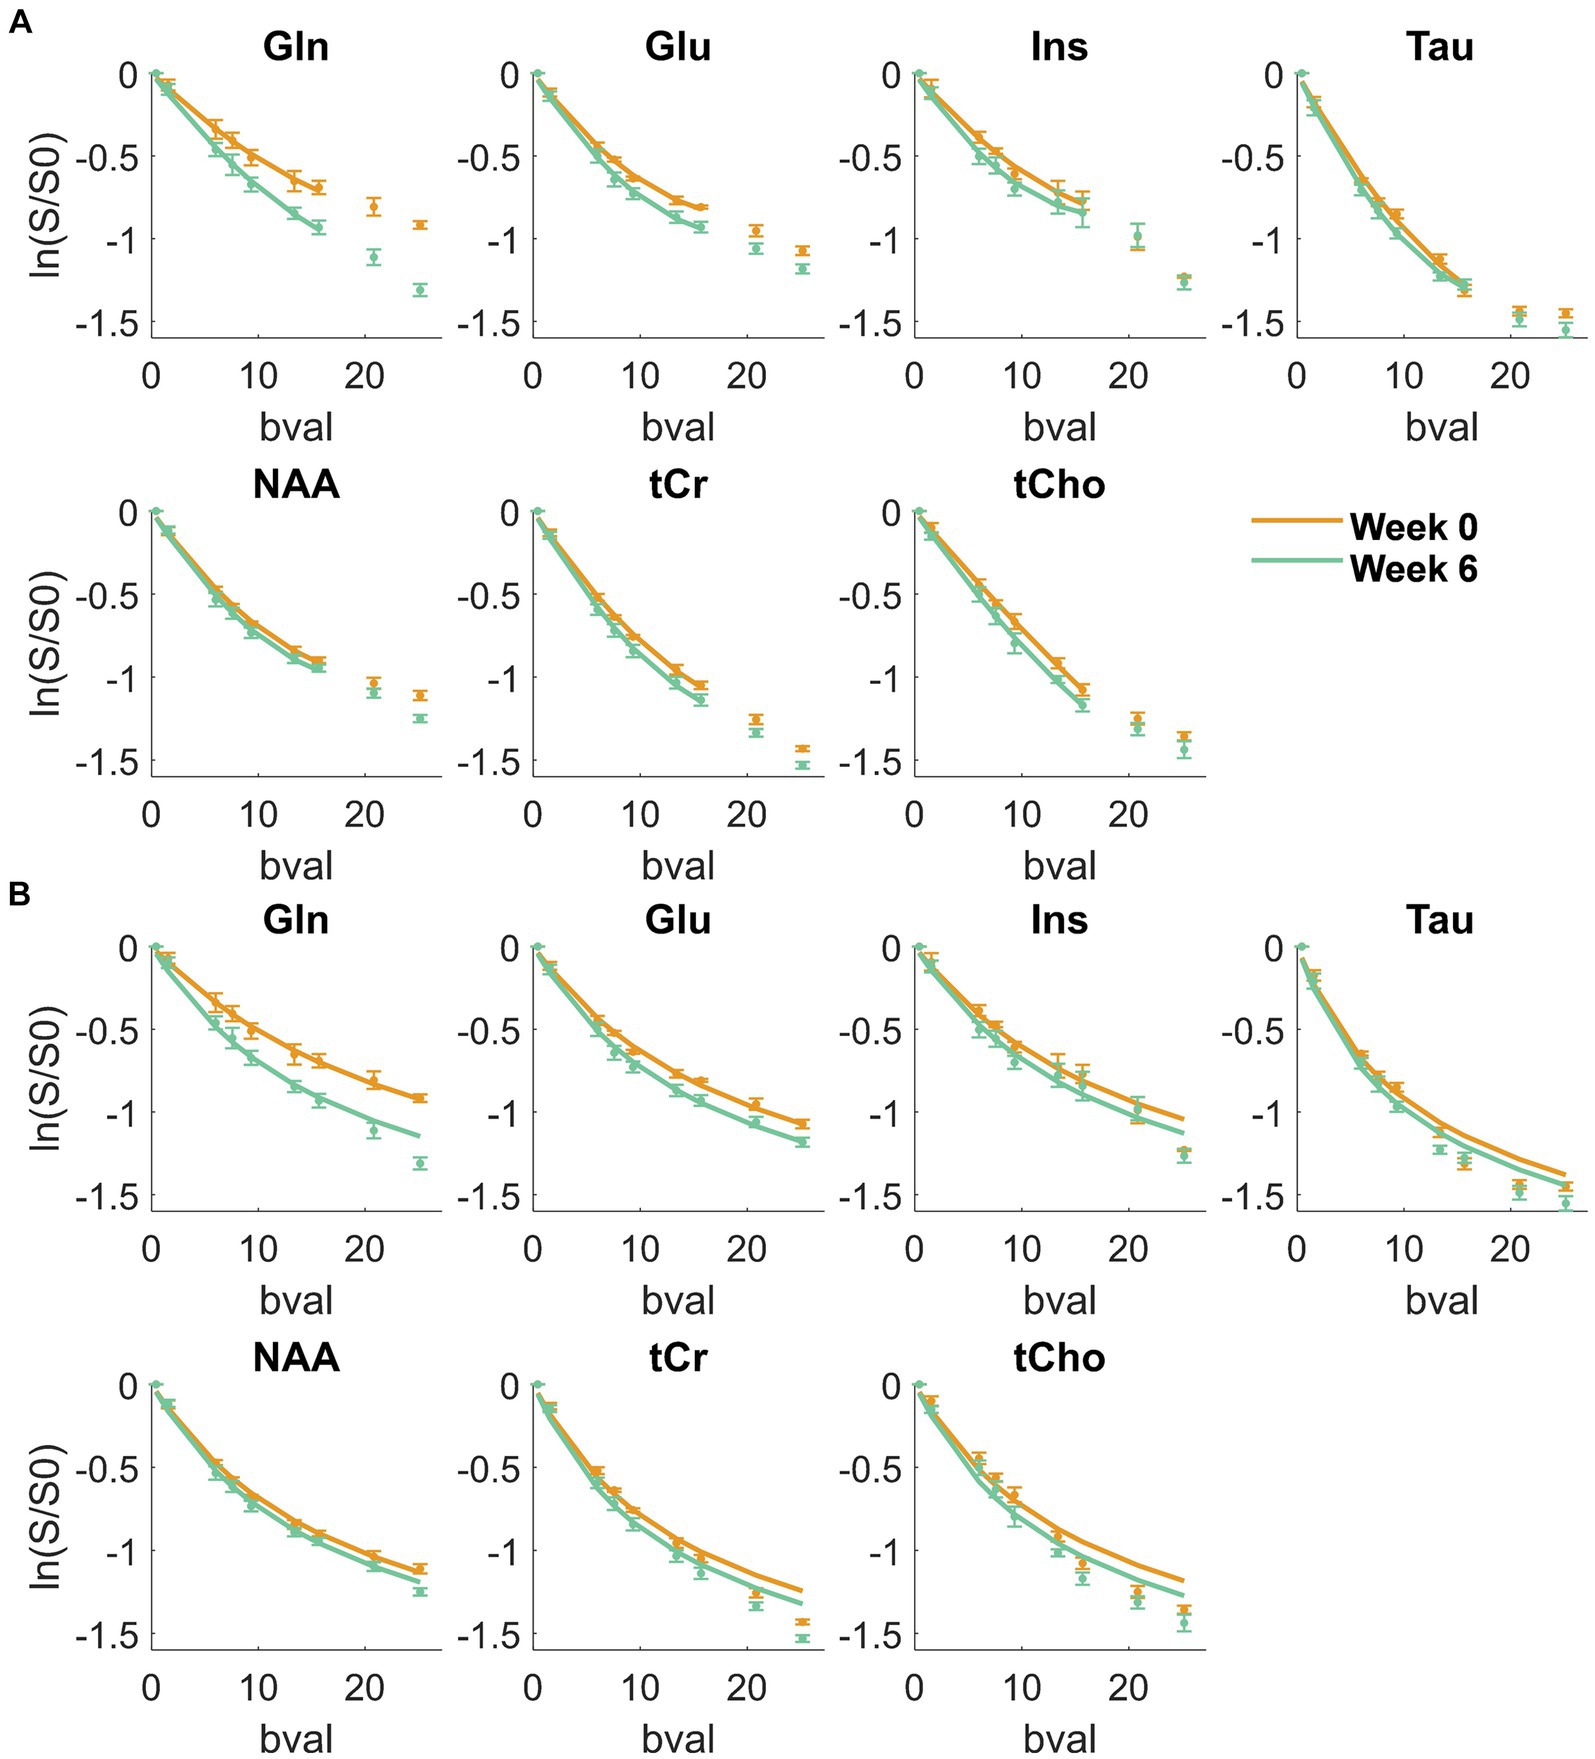
Figure 2. Metabolite signal diffusion decay with b-value, averaged over the cohort of animals at week 0 (green) and week 6 (orange) after normalization to b = 0.4 ms/μm2. Solid line: kurtosis fit up to b = 15.7 ms/μm2 (A) and Dintra fit from the randomly oriented sticks model (Equation 1) up to b = 25 ms/μm2 (B) Bval are in ms/μm2.
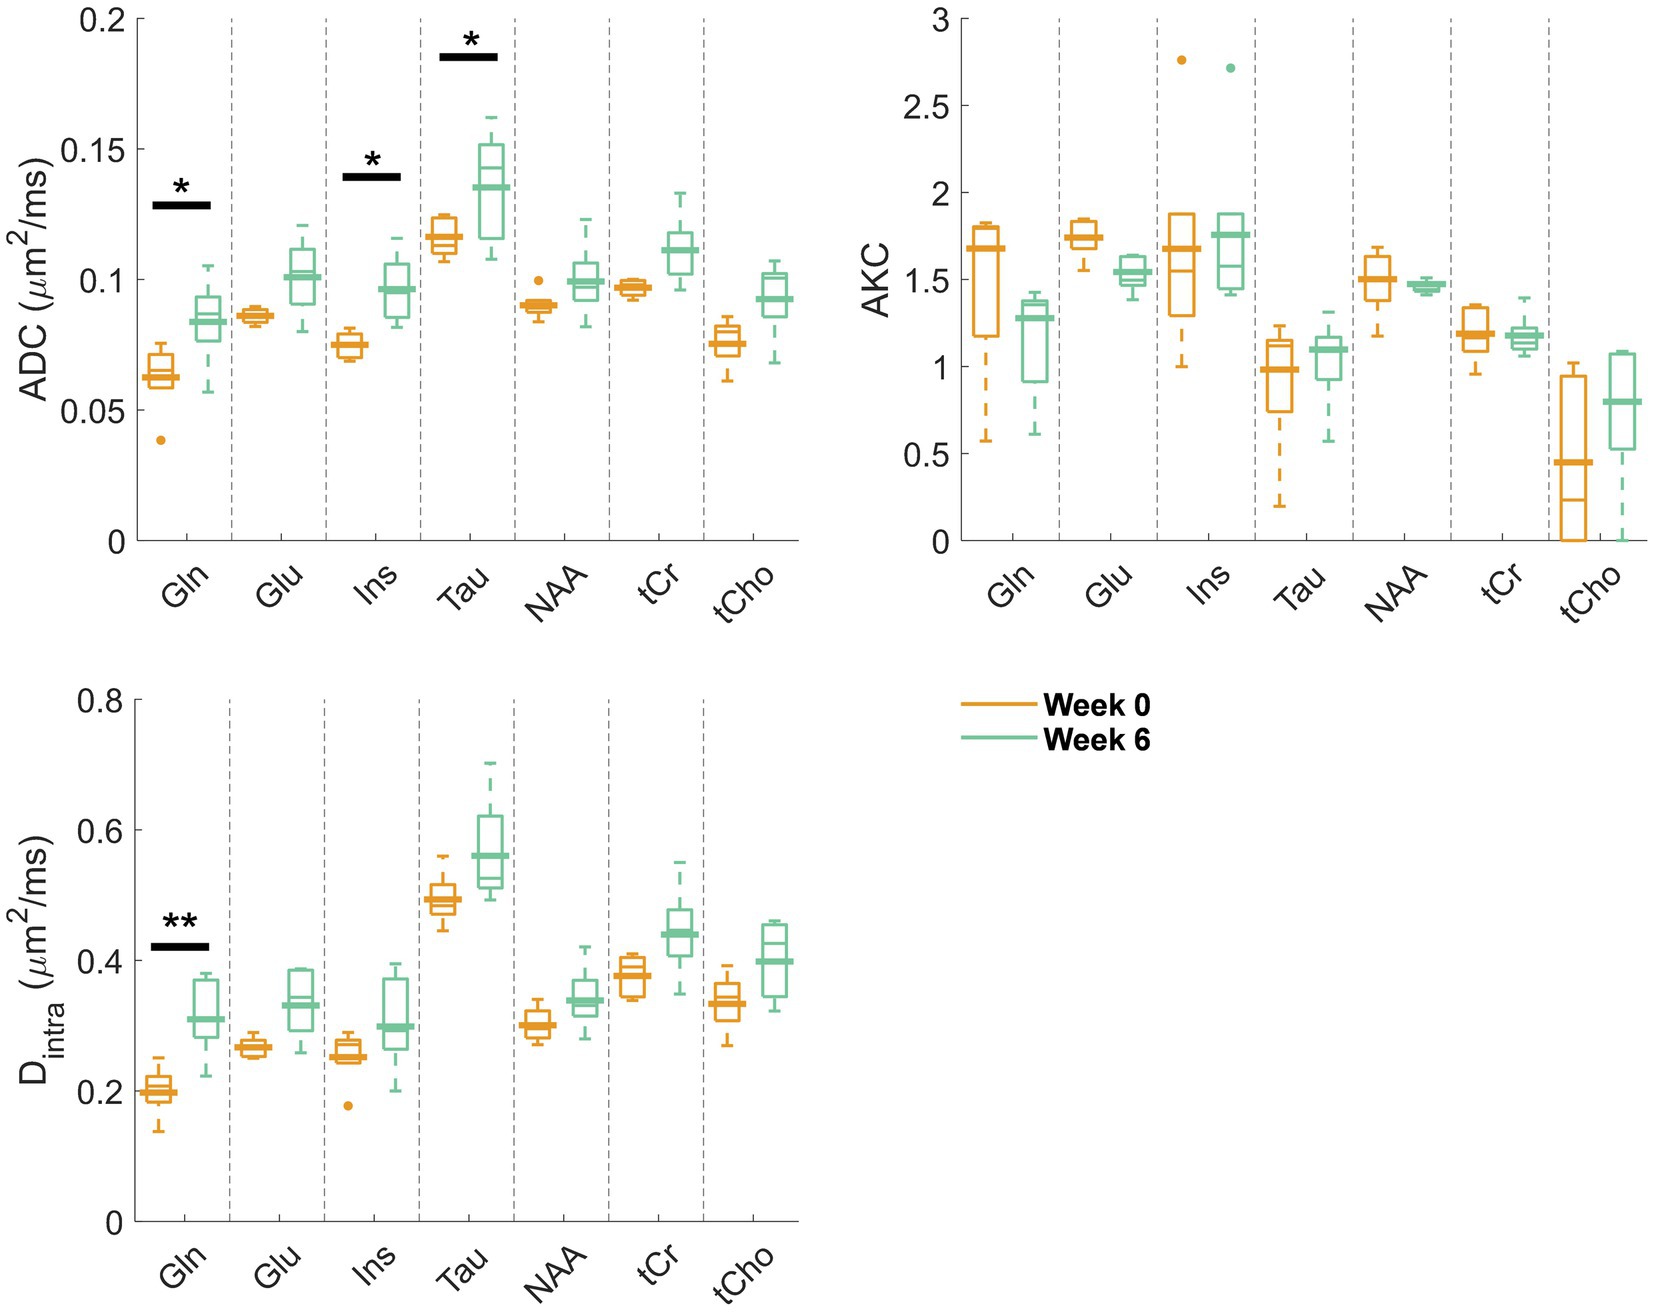
Figure 3. Estimated diffusion parameters from the kurtosis fit (ADC and AKC) and from the randomly oriented sticks model (Equation 1) (Dintra) for the reliably estimated metabolites (Gln, Glu, Ins, Tau, NAA, tCr, and tCho) at week 0 (orange) and week 6 (green). Box plots: parameters fitted on the individual animal signal decays (line: median, top and bottom edges: 25th and 75th percentiles, whiskers: extreme values, dots: outliers); bold lines: parameters fitted to the mean signal decay as plotted and fitted in Figure 2. Significant differences from a two-way ANOVA (metabolite and disease factors) with a Bonferroni post-hoc test are indicated. **p < 0.01, *p < 0.05.
The Sholl analysis of the GFAP-stained astrocytes showed morphological alterations with a significant shortening of the processes (~30%****) and a decrease in the number of processes per cell (~18%****) at week 6 post-BDL (Figure 4A). In addition, the Golgi-Cox staining showed a significant increase in CA1 hippocampal neuronal soma surface (~65%***) and a significant loss of dendritic spines density, both apical and basal (both ~50%***) (Figure 4B). Electron microscopy of the BDL rats’ brains revealed changes in the ultrastructure, as shown in Figures 4C,D, which were not observed in the healthy rat brain (Nahirney and Tremblay, 2021). Electron-dense lipofuscin granules were found in the perikaryal cytoplasm of neurons and in the cytoplasm of astrocytes, and aggregates are indicated in Figure 4C, together with elongated/fused mitochondria. A pattern of myelin sheath degeneration/breakdown was also observed (Figure 4C). The hippocampus was characterized by loss of tissue integrity and enlarged extracellular spaces, indicating increased extracellular water content in the area surrounding the astrocytes (Figure 4D). Automatic segmentation of extracellular space allowed reconstruction of the edema volume (938.743 μm3), corresponding to 14.5% of the whole dataset volume (6504.75 μm3).
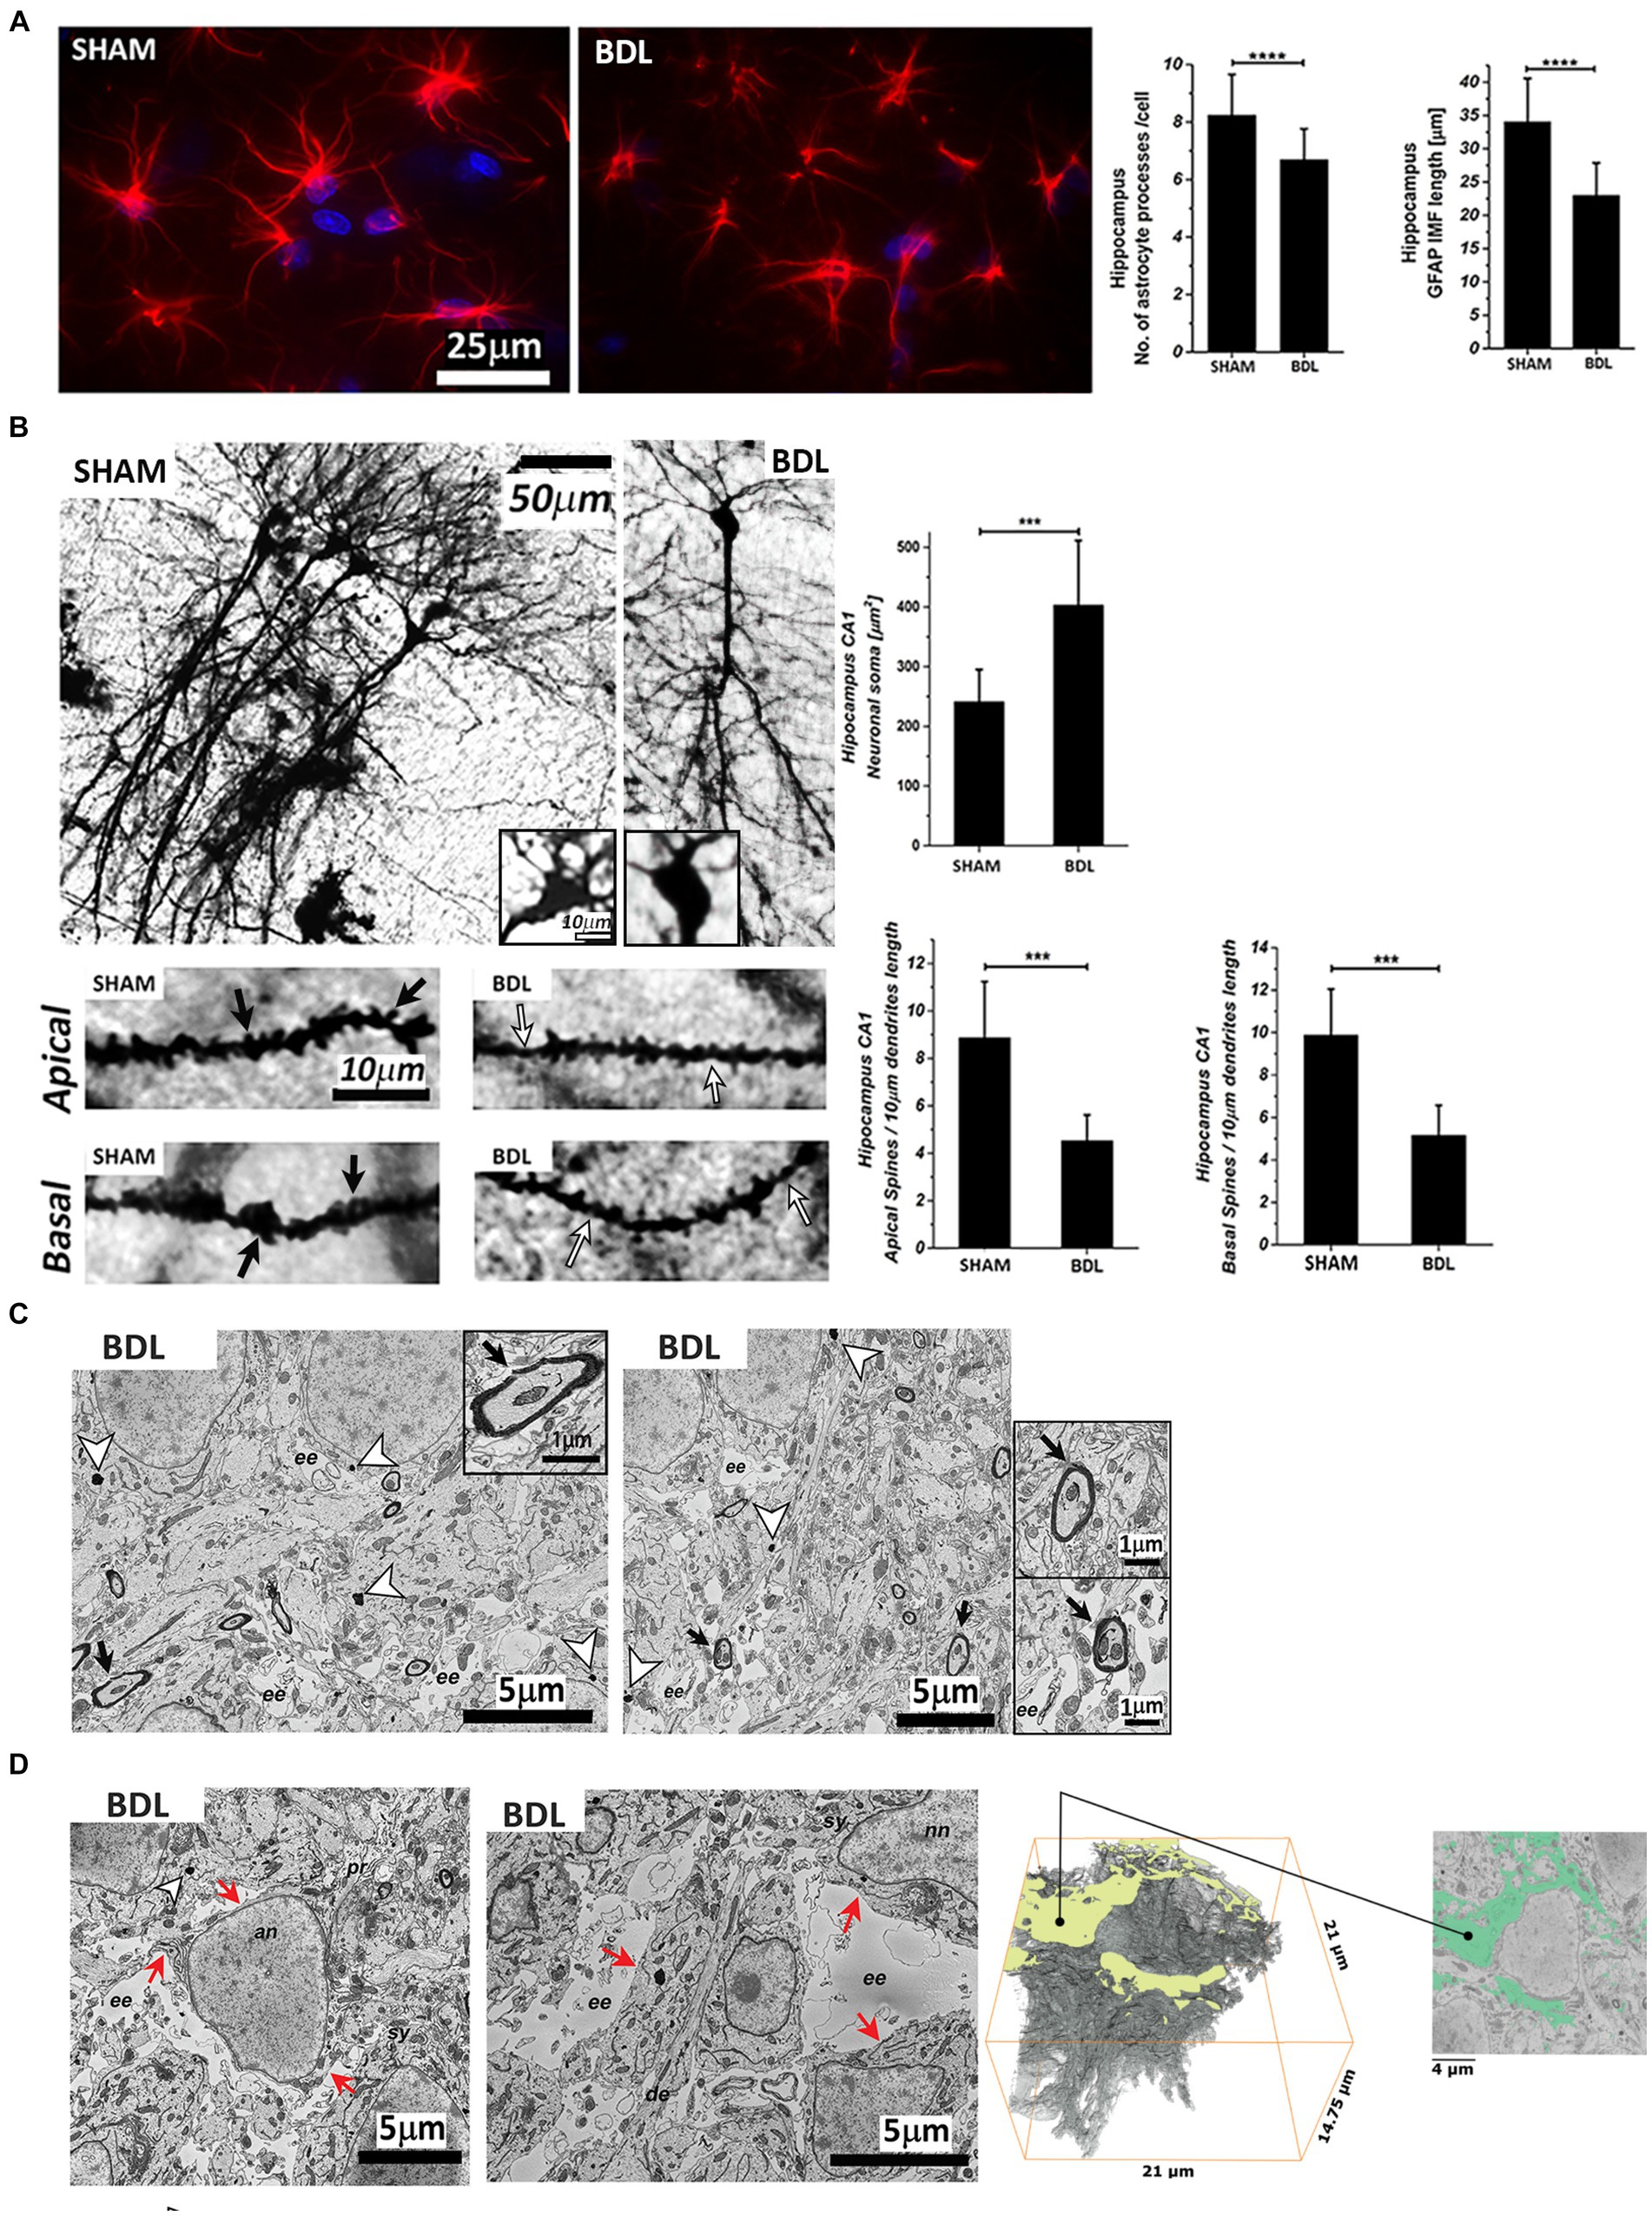
Figure 4. Hippocampal sections from SHAM and BDL rats. (A) Astrocytes stained with anti-GFAP (red) and DAPI-nuclei (blue) and morphological characterization of the number and length of processes. (B) Representative micrographs of Golgi-Cox staining and neuronal morphology analysis of pyramidal CA1 neurons. Black arrows indicate the spines, and the white arrows indicate spine pruning. (C) Analysis of the ultrastructure alterations of the hippocampus CA1 area. White arrowheads indicate granular electron-dense lipofuscin, and black arrowheads indicate myelin degeneration. (D) Extracellular edema reconstruction. Red arrows indicate the continuity of the plasma membrane. (C) and (D): an—astrocyte nuclei; nn—neuronal nuclei; ee—extracellular edema; sy—synapse; se—synaptic edema; pr—processes; de—dendrite. Data are presented as mean ± SD and statistical significance (two-way ANOVA with post-hoc Tukey HSD): *p < 0.05, **p < 0.01, ***p < 0.001, ****p < 0.0001.
4 Discussion
The present study describes the first in vivo implementation of single-voxel MRS, dMRS, and histology in rats with chronic liver disease-induced HE. It evaluates the potential of dMRS to highlight microstructural changes in the rat brain with type C HE through the measurement of metabolite diffusion properties. 1H-MRS probed an increase in Gln and a decrease in the main osmolytes (Ins) in the hippocampus of BDL rats at 6-week post-surgery, indicating the presence of osmotic stress. The additional use of dMRS in the same animals enabled the characterization of changes in the diffusion behavior of brain Gln, Glu, Ins, Tau, tCr, and tCho (an overall increase as a disease effect, with Gln, Ins, and Tau showing significant changes), highlighting the presence of microstructural changes in this animal model, which were validated by different histological measures (astrocytes: decreased number and length of GFAP-stained intermediate filaments; neurons: decreased density of dendritic spines; and enlarged extracellular spaces). Taken together, our data suggest a loss of tissue integrity, providing new insights into metabolic and microstructural alterations linked to increased brain Gln and its consequences in type C HE. Furthermore, our results confirm that type C HE is characterized by complex and multicellular alterations that go beyond the hypothesis of intracellular edema, with astrocytes being the only target.
4.1 Brain metabolism alterations in the hippocampus
The increase in brain Gln in the hippocampus, mainly due to increased blood ammonium as a consequence of chronic liver disease, led to an osmotic imbalance resulting in a gradual decrease of other brain osmolytes (Ins), and contributed to morphological astrocytic alterations (shortening of process length together with a decrease in their number) (Häussinger et al., 2000), among other mechanisms. Of note, osmotic stress is not the sole mechanism involved in type C HE; oxidative stress and inflammation are complementary mechanisms acting synergistically (Simicic et al., 2022; Andersen and Schousboe, 2023; Pierzchala et al., 2023). Consistent with our previous findings (Braissant et al., 2019), we also identified some trends (not significant) in the changes of other metabolites. These changes included a decrease in Tau and tCho due to the osmotic response, the neurotransmitter Glu, and the antioxidants Asc and GSH. Moreover, the EM-observed intracellular accumulation of lipofuscin aggregates is a sign of lipid peroxidation and thus the presence of oxidative stress, which is in agreement with our previous studies (Pierzchala et al., 2022; Simicic et al., 2022), and we observed herein a decrease in antioxidants, a sign of redox homeostasis alterations. The same trends in metabolite changes were also observed in the bigger VOI used for dMRS. The quantification of these data was not used for characterizing the brain metabolism due to the longer TE of the dMRS sequence and the lack of T2 corrections for water and metabolites.
4.2 Brain microstructural alterations revealed by dMRS and histology
In the BDL group at week 6, increased diffusivities of brain Gln and of the main brain osmolytes (Ins, Tau) were observed when compared to week 0. This observation is a possible consequence of the osmotic stress caused by intra-astrocytic Gln increase: brain osmolytes may be temporarily present in the extracellular space, therein experiencing freer diffusion compared to intracellular space, before being cleared out, as supported by the steady-state net decrease of osmolyte concentrations observed with MRS. The electron microscopy results revealed a loss of tissue integrity and enlarged extracellular spaces in the hippocampus, indicating increased extracellular water content in the area surrounding the astrocytes.
Furthermore, the increased diffusivities of Gln and Ins in the BDL rats, metabolites assumed to be glial markers (Martinez-Hernandez et al., 1977; Häussinger et al., 1994), may also reflect astrocyte alterations following the strong Gln increase. Changes in diffusivity in vivo are usually associated with microstructural changes (Najac et al., 2014, 2016; Palombo et al., 2018; Ligneul et al., 2019; Genovese et al., 2021), and the diffusion time used in the present study (120 ms, characteristic 2D diffusion length of assuming μm2/ms) is likely to probe metabolite diffusion along fibers (astrocytic processes or neuronal dendrites) rather than confinement in cell bodies, as shown with dMRS in the human (Najac et al., 2016) and macaque brain (Najac et al., 2014). These dMRS findings are supported by the GFAP histological observations (i.e., decreased length and number of astrocytic processes) pointing toward a less restricted and ramified cellular architecture, explaining increased diffusivities for astrocytic metabolites in the BDL rats. A recent study showed increased serum GFAP levels in cirrhotic patients (Gairing et al., 2023), suggesting that the presence of astrocyte injury and astrocyte activation are two mechanisms that may lead to increased serum GFAP concentrations. It is worth mentioning that, using dMRS in a model of reactive astrocytes, Ins has been revealed as a specific intra-astrocytic marker whose diffusion closely reflects astrocytic morphology, enabling the non-invasive detection of astrocyte hypertrophy (Ligneul et al., 2019). In addition, the diffusion of astrocytic metabolites can mirror their altered morphology and pro-inflammatory phenotype (de Marco et al., 2022), since, during neuroinflammation, both astrocytes and microglia undergo metabolic, functional, and morphological changes (Heneka et al., 2014). In our previous studies, significantly elevated levels of IL-6 and reactive oxygen species were observed in the brains of BDL rats as compared to the SHAM animals (Pierzchala et al., 2022), suggesting the presence of neuroinflammation. IL-6 levels, together with oxidative stress, have also been associated with increased blood–brain barrier permeability, allowing neurotoxins to enter the brain and impair neurological functions (Simicic et al., 2022). Recent studies promoted dMRS as a tool sensitive to glial cytomorphological changes induced by inflammation following LPS administration in humans (de Marco et al., 2022) or in cuprizone-fed mice (Genovese et al., 2021), where Ins and tCho apparent diffusion coefficients were significantly elevated. Following these studies, tCho diffusivity changes were related to the presence of inflammation, even though tCho has a limited specificity for glial cells. Similarly, an increased diffusivity for tCho (a trend of ~20% increase) was measured in this study, possibly reflecting here also the presence of neuroinflammation, as shown previously in BDL rats ex vivo (Pierzchala et al., 2022). Neuroinflammation will impact the astrocyte cytoskeleton, which may lead to an increase in intracellular and extracellular space, as observed in our study. Furthermore, the EM data depicted a breakdown of myelin sheaths and myelin outfolding formation in BDL rats, which could also impact tCho diffusivity as tCho is required for membrane phospholipid synthesis and myelination (Zeisel et al., 1986), although only a few studies have validated the association between myelin status and tCho (Laule et al., 2007; Rae, 2014, Skripuletz et al., 2015).
Glu and NAA, both expected to be preferentially located in neurons (MOFFETT et al., 2007; Fendt and Verstreken, 2017), exhibited a trend of increased diffusivity in BDL rats at week 6 post-BDL. Golgi-Cox measures probed an increased soma surface of CA1 hippocampal neurons and a loss of dendritic spines density (which is made of filamentous actin cytoskeleton; Hering and Sheng, 2001) in BDL rats. Numerical simulations (Palombo et al., 2018) have suggested that decreased dendritic spines density would increase the ADC of neuronal metabolites, consistent with the trend of increased Glu and NAA diffusivity observed herein. Furthermore, additional studies using two-photon microscopy on brain slices (Santamaria et al., 2006, 2011) have shown that the diffusional characteristics of dendrites are greatly affected by the dendritic spines density, being slower in the dendrite with the higher density of spines due to anomalous diffusion, and significantly faster in smooth/low spines density dendrites. Of note, Glu is the main precursor of Gln synthesis in the astrocytes, and the observed increased diffusivity trend can also reflect the reduced number and shortening of astrocyte processes. Total Cr also showed a trend of increased diffusivity in this study. Creatine is located in most cell types, has different roles in energy metabolism and cytoprotection, and also appears to act in osmoregulation and neurotransmission (Rackayova et al., 2017; Braissant et al., 2019).
Metabolite kurtosis coefficients overall tended to decrease in the BDL group, suggesting that the intracellular space might be less heterogeneous with reduced structural disorder. Although previous numerical simulations have shown that the number of processes departing from the soma has almost no influence on the measured ADC at any diffusion time (Palombo et al., 2016), the former, observed here by histology, might have an influence on Dintra, which is higher in HE rats compared to control rats for most metabolites. Overall, we believe that increased diffusivities in type C HE rats versus control rats reflect (1) intracellular space alteration with reduced structural disorder, supported by decreased neuronal spines density, decreased length of astrocyte processes and number of ramifications shown by histology, and (2) a higher contribution of extracellular space diffusion in BDL rats compared to controls due to osmolytes leaving the cells counteracting intracellular Gln increase.
4.3 Limitations
dMRS is a challenging measurement, and different factors might affect the estimated diffusion metrics (Ligneul et al., 2024). In the present study, motion artifacts due to simple linear translational motion were compensated on individual shots by phase correction, while data affected by rotational and compressive motion were discarded in the outlier removal process. Consequently, we do not expect any significant effect of motion on the calculated metabolite diffusion metrics, i.e., an overall overestimation. Additionally, a change in metabolite concentration is unlikely to affect diffusivity through a change in cytosol viscosity given the small metabolite concentrations (1–10 M) compared to water (45–50 M) (Kinsey et al., 2011).
For some metabolites (i.e., Tau, tCr, and tCho), the sticks model (Equation 1) showed some discrepancies with the measured data at high b-values. These discrepancies may result from a poorer LCModel spectral fit quality at higher b-values, exemplified by the high inter-animal variability of estimated concentrations for the highest b-values (Supplementary Figures S3,S4). Such variability might be partially alleviated by the use of simultaneous 2D fitting of the spectral and diffusion dimensions (Adalid et al., 2017).
The strict CRLB criterion for dMRS ensures a fair comparison between the groups. The use of each animal as its own control with a scan before the BDL surgery was beneficial as it ruled out possible inter-animal differences in brain microstructure or metabolism that could have biased the group comparison. A good concordance between individual and group-average fit for diffusion estimates was obtained in the current study. The possibility of fitting diffusion coefficients on individual animal signal decays provides an error estimation better representing the group dispersion than the one evaluated from the group-averaged signal decay. dMRS is also characterized by an overall low signal-to-noise ratio (SNR) compared to a simple MRS acquisition. In the present study, the LCModel SNR ranged from 15–20 to 45 depending on the b-value, guiding the choice of the randomly oriented sticks model (Equation 1) instead of the randomly oriented cylinder model (i.e., fitting, in addition, the radius of processes) (Vangelderen et al., 1994). This finding is highlighted in a recent dMRS consensus article showing that fitting the cylinder model would require a higher SNR and higher b-values than what was accessible in the present study (Ligneul et al., 2024). Finally, the increased brain Gln combined with the relatively short TE (15 ms) and high magnetic field allowed us to report brain Gln diffusivity for the first time.
Our study reports an overall increased diffusivity for all investigated metabolites, which was confirmed by histological measures. However, additional studies with an increased number of samples would be required to confirm this trend together with EM data on SHAM animals. dMRI could provide additional information with respect to dMRS, the former also informing on the extracellular space and on exchange between intracellular and extracellular spaces. An increased membrane permeability in BDL rats would also contribute to reduced compartmentalization (intracellular vs. extracellular) of metabolites (Ins, Gln, and Tau) and faster diffusion, which could be evaluated from joint dMRS and dMRI acquisitions in future studies. Future dMRS studies in this animal model should focus on targeting a specific brain region (the dMRS voxel here included several brain regions): brain regional differences in the neurometabolic profiles of BDL rats have been suggested, with the cerebellum exhibiting a stronger Gln increase than other brain regions (Simicic et al., 2019).
5 Conclusion
In conclusion, this study highlights the potential of dMRS as a unique tool to non-invasively monitor neuronal and astrocytic structural alterations in the rat model of type C HE via the measurement of cell-specific metabolite diffusion properties. The increased diffusivity and reduced kurtosis in BDL versus control rats, measured in vivo with dMRS, are consistent with an altered microstructure probed ex vivo by fluorescence, brightfield, and electron microscopy. Overall, dMRS evidenced that type C HE is characterized by complex and multicellular alterations beyond astrocyte swelling and holds enormous potential for future HE studies.
Data availability statement
The raw data supporting the conclusions of this article will be made available by the authors, without undue reservation.
Ethics statement
The animal study was approved by Committee on Animal Experimentation for the Canton de Vaud, Switzerland (VD 3022.1). The study was conducted in accordance with the local legislation and institutional requirements.
Author contributions
JM: Formal analysis, Methodology, Software, Visualization, Writing – review & editing. GB: Formal analysis, Methodology, Software, Visualization, Writing – review & editing. KP: Formal analysis, Methodology, Visualization, Writing – review & editing, Investigation, Writing – original draft. DS: Methodology, Writing – review & editing. AS: Methodology, Writing – review & editing, Formal analysis, Visualization. AA: Formal analysis, Methodology, Writing – review & editing, Visualization. IJ: Methodology, Software, Writing – review & editing. CC: Methodology, Software, Writing – review & editing, Conceptualization, Formal analysis, Funding acquisition, Investigation, Project administration, Resources, Supervision, Visualization, Writing – original draft.
Funding
The author(s) declare that financial support was received for the research, authorship, and/or publication of this article. CC, KP, and JM were supported by the CIBM Center for Biomedical Imaging of the UNIL, UNIGE, HUG, CHUV, EPFL, the Leenaards and Jeantet Foundations, and the SNSF project no. 310030_201218. IJ was supported by SNSF grant PCEFP2_194260. AS was supported by the Academy of Finland Research Project (#323385).
Acknowledgments
We would like to acknowledge the EPFL BioImaging & Optics Core Facility and, in particular, thank Knott Graham, Dubois Anaëlle Fabienne, and Rosset Stéphanie for their assistance in imaging and Julien Valette for his help with dMRS interpretation. The authors thank Stefanita Mitrea (CIBM) and Dario Sessa (HUG) for their help during BDL surgery, animal follow-up, sample collection, and for their assistance with histology.
Conflict of interest
The authors declare that the research was conducted in the absence of any commercial or financial relationships that could be construed as a potential conflict of interest.
Publisher’s note
All claims expressed in this article are solely those of the authors and do not necessarily represent those of their affiliated organizations, or those of the publisher, the editors and the reviewers. Any product that may be evaluated in this article, or claim that may be made by its manufacturer, is not guaranteed or endorsed by the publisher.
Supplementary material
The Supplementary material for this article can be found online at: https://www.frontiersin.org/articles/10.3389/fnins.2024.1344076/full#supplementary-material
References
Abdollahzadeh, A., Belevich, I., Jokitalo, E., Sierra, A., and Tohka, J. (2021a). DeepACSON automated segmentation of white matter in 3D electron microscopy. Commun. Biol. 4, 179–114. doi: 10.1038/s42003-021-01699-w
Abdollahzadeh, A., Sierra, A., and Tohka, J. (2021b). Cylindrical shape decomposition for 3D segmentation of tubular objects. IEEE Access 9, 23979–23995. doi: 10.1109/ACCESS.2021.3056958
Adalid, V., Döring, A., Kyathanahally, S. P., Bolliger, C. S., Boesch, C., and Kreis, R. (2017). Fitting interrelated datasets: metabolite diffusion and general lineshapes. MAGMA 30, 429–448. doi: 10.1007/s10334-017-0618-z
Andersen, J. V., and Schousboe, A. (2023). Glial glutamine homeostasis in health and disease. Neurochem. Res. 48, 1100–1128. doi: 10.1007/s11064-022-03771-1
Behanova, A., Abdollahzadeh, A., Belevich, I., Jokitalo, E., Sierra, A., and Tohka, J. (2022). gACSON software for automated segmentation and morphology analyses of myelinated axons in 3D electron microscopy. Comput. Methods Prog. Biomed. 220:106802. doi: 10.1016/j.cmpb.2022.106802
Braissant, O., Rackayová, V., Pierzchala, K., Grosse, J., McLin, V. A., and Cudalbu, C. (2019). Longitudinal neurometabolic changes in the hippocampus of a rat model of chronic hepatic encephalopathy. J. Hepatol. 71, 505–515. doi: 10.1016/j.jhep.2019.05.022
Brand, A., Richter-Landsberg, C., and Leibfritz, D. (1993). Multinuclear NMR studies on the energy metabolism of glial and neuronal cells. Dev. Neurosci. 15, 289–298. doi: 10.1159/000111347
Callaghan, P. T., Jolley, K. W., and Lelievre, J. (1979). Diffusion of water in the endosperm tissue of wheat grains as studied by pulsed field gradient nuclear magnetic resonance. Biophys. J. 28, 133–141. doi: 10.1016/S0006-3495(79)85164-4
Cudalbu, C., Behar, K. L., Bhattacharyya, P. K., Bogner, W., Borbath, T., de Graaf, R. A., et al. (2021). Contribution of macromolecules to brain 1 H MR spectra: experts’ consensus recommendations. NMR Biomed. 34:e4393. doi: 10.1002/nbm.4393
Cudalbu, C., and Taylor-Robinson, S. D. (2019). Brain Edema in chronic hepatic encephalopathy. J. Clin. Exp. Hepatol. 9, 362–382. doi: 10.1016/j.jceh.2019.02.003
de Marco, R., Ronen, I., Branzoli, F., Amato, M. L., Asllani, I., Colasanti, A., et al. (2022). Diffusion-weighted MR spectroscopy (DW-MRS) is sensitive to LPS-induced changes in human glial morphometry: a preliminary study. Brain Behav. Immun. 99, 256–265. doi: 10.1016/j.bbi.2021.10.005
DeMorrow, S., Cudalbu, C., Davies, N., Jayakumar, A. R., and Rose, C. F. (2021). 2021 ISHEN guidelines on animal models of hepatic encephalopathy. Liver Int. 41, 1474–1488. doi: 10.1111/liv.14911
Dharel, N., and Bajaj, J. S. (2015). Definition and nomenclature of hepatic encephalopathy. J. Clin. Exp. Hepatol. 5, S37–S41. doi: 10.1016/j.jceh.2014.10.001
Fendt, S.-M., and Verstreken, P. (2017). Neurons eat glutamate to stay alive. J. Cell Biol. 216, 863–865. doi: 10.1083/jcb.201702003
Flatt, E., Cudalbu, C., Braissant, O., Mitrea, S., Sessa, D., Gruetter, R., et al. (2017). ‘Rifaximin in Chronic Liver Disease-induced Hepatic Encephalopathy: An in vivo longitudinal study of brain metabolism on BDL rats’, J. Clin. Exp. Hepatol. 7, S55–S56. doi: 10.1016/j.jceh.2017.01.072
Gairing, S. J., Danneberg, S., Kaps, L., Nagel, M., Schleicher, E. M., Quack, C., et al. (2023). Elevated serum levels of glial fibrillary acidic protein are associated with covert hepatic encephalopathy in patients with cirrhosis. JHEP Rep. 5:100671. doi: 10.1016/j.jhepr.2023.100671
Genovese, G., Palombo, M., Santin, M. D., Valette, J., Ligneul, C., Aigrot, M. S., et al. (2021). Inflammation-driven glial alterations in the cuprizone mouse model probed with diffusion-weighted magnetic resonance spectroscopy at 11.7 T. NMR Biomed. 34:e4480. doi: 10.1002/nbm.4480
Govind, V., Young, K., and Maudsley, A. A. (2015). Corrigendum: proton NMR chemical shifts and coupling constants for brain metabolites. Govindaraju V, Young K, Maudsley AA, NMR biomed. 2000; 13: 129-153. NMR Biomed. 28, 923–924. doi: 10.1002/nbm.3336
Govindaraju, V., Young, K., and Maudsley, A. A. (2000). Proton NMR chemical shifts and coupling constants for brain metabolites. NMR Biomed. 13, 129–153. doi: 10.1002/1099-1492(200005)13:3<129::aid-nbm619>3.0.co;2-v
Gruetter, R. (1993). Automatic, localized in vivo adjustment of all first- and second-order shim coils. Magn. Reson. Med. 29, 804–811. doi: 10.1002/mrm.1910290613
Gruetter, R., and Tkác, I. (2000). Field mapping without reference scan using asymmetric echo-planar techniques. Magn. Reson. Med. 43, 319–323. doi: 10.1002/(sici)1522-2594(200002)43:2<319::aid-mrm22>3.0.co;2-1
Harris, J. L., Choi, I.-Y., and Brooks, W. M. (2015). Probing astrocyte metabolism in vivo: proton magnetic resonance spectroscopy in the injured and aging brain. Front. Aging Neurosci. 7:202. doi: 10.3389/fnagi.2015.00202
Häussinger, D., Dhiman, R. K., Felipo, V., Görg, B., Jalan, R., Kircheis, G., et al. (2022). Hepatic encephalopathy. Nat. Rev. Dis. Primers 8:43. doi: 10.1038/s41572-022-00366-6
Häussinger, D., Kircheis, G., Fischer, R., Schliess, F., and Dahl, S. (2000). Hepatic encephalopathy in chronic liver disease: a clinical manifestation of astrocyte swelling and low-grade cerebral edema? J. Hepatol. 32, 1035–1038. doi: 10.1016/s0168-8278(00)80110-5
Häussinger, D., Laubenberger, J., Vom Dahl, S., Ernst, T., Bayer, S., Langer, M., et al. (1994). Proton magnetic resonance spectroscopy studies on human brain myo-inositol in hypo-osmolarity and hepatic encephalopathy. Gastroenterology 107, 1475–1480. doi: 10.1016/0016-5085(94)90552-5
Heneka, M. T., Kummer, M. P., and Latz, E. (2014). Innate immune activation in neurodegenerative disease. Nat. Rev. Immunol. 14, 463–477. doi: 10.1038/nri3705
Hering, H., and Sheng, M. (2001). Dendritic spines: structure, dynamics and regulation. Nat. Rev. Neurosci. 2, 880–888. doi: 10.1038/35104061
Jelescu, I. O., and Budde, M. D. (2017). Design and validation of diffusion MRI models of white matter. Front. Phys. 5:61. doi: 10.3389/fphy.2017.00061
Jelescu, I. O., Palombo, M., Bagnato, F., and Schilling, K. G. (2020). Challenges for biophysical modeling of microstructure. J. Neurosci. Methods 344:108861. doi: 10.1016/j.jneumeth.2020.108861
Kale, R. A., Gupta, R. K., Saraswat, V. A., Hasan, K. M., Trivedi, R., Mishra, A. M., et al. (2006). Demonstration of interstitial cerebral edema with diffusion tensor MR imaging in type C hepatic encephalopathy. Hepatology 43, 698–706. doi: 10.1002/hep.21114
Kinsey, S. T., Locke, B. R., and Dillaman, R. M. (2011). Molecules in motion: influences of diffusion on metabolic structure and function in skeletal muscle. J. Exp. Biol. 214, 263–274. doi: 10.1242/jeb.047985
Kiselev, V. G., and Il'yasov, K. A. (2007). Is the “biexponential diffusion” biexponential? Magn. Reson. Med. 57, 464–469. doi: 10.1002/mrm.21164
Kreis, R. (2016). The trouble with quality filtering based on relative Cramér-Rao lower bounds. Magn. Reson. Med. 75, 15–18. doi: 10.1002/mrm.25568
Kunz, N., Cudalbu, C., Mlynarik, V., Hüppi, P. S., Sizonenko, S. V., and Gruetter, R. (2010). Diffusion-weighted spectroscopy: a novel approach to determine macromolecule resonances in short-echo time 1H-MRS. Magn. Reson. Med. 64, 939–946. doi: 10.1002/mrm.22490
Lanz, B., Rackayova, V., Braissant, O., and Cudalbu, C. (2017). MRS studies of neuroenergetics and glutamate/glutamine exchange in rats: extensions to hyperammonemic models. Anal. Biochem. 529, 245–269. doi: 10.1016/j.ab.2016.11.021
Laule, C., Vavasour, I. M., Kolind, S. H., Li, D. K. B., Traboulsee, T. L., Moore, G. R. W., et al. (2007). Magnetic resonance imaging of myelin. Neurotherapeutics 4, 460–484. doi: 10.1016/j.nurt.2007.05.004
Ligneul, C., Najac, C., Döring, A., Beaulieu, C., Branzoli, F., Clarke, W. T., et al. (2024). Diffusion-weighted MR spectroscopy: consensus, recommendations, and resources from acquisition to modeling. Magn. Reson. Med. 91, 860–885. doi: 10.1002/mrm.29877
Ligneul, C., Palombo, M., Hernández-Garzón, E., Carrillo-de Sauvage, M. A., Flament, J., Hantraye, P., et al. (2019). Diffusion-weighted magnetic resonance spectroscopy enables cell-specific monitoring of astrocyte reactivity in vivo. NeuroImage 191, 457–469. doi: 10.1016/j.neuroimage.2019.02.046
Lin, A., Andronesi, O., Bogner, W., Choi, I. Y., Coello, E., Cudalbu, C., et al. (2021). Minimum reporting standards for in vivo magnetic resonance spectroscopy (MRSinMRS): experts’ consensus recommendations. NMR Biomed. 34:e4484. doi: 10.1002/nbm.4484
Martinez-Hernandez, A., Bell, K. P., and Norenberg, M. D. (1977). Glutamine synthetase: glial localization in brain. Science (New York, N.Y.) 195, 1356–1358. doi: 10.1126/science.14400
MOFFETT, J., ROSS, B., ARUN, P., MADHAVARAO, C., and NAMBOODIRI, A. (2007). N-Acetylaspartate in the CNS: from neurodiagnostics to neurobiology. Prog. Neurobiol. 81, 89–131. doi: 10.1016/j.pneurobio.2006.12.003
Monfort, P., Cauli, O., Montoliu, C., Rodrigo, R., Llansola, M., Piedrafita, B., et al. (2009). Mechanisms of cognitive alterations in hyperammonemia and hepatic encephalopathy: therapeutical implications. Neurochem. Int. 55, 106–112. doi: 10.1016/j.neuint.2009.01.021
Mosso, J., Simicic, D., Lanz, B., Gruetter, R., and Cudalbu, C. (2024). Diffusion-weighted SPECIAL improves the detection of J-coupled metabolites at ultrahigh magnetic field. Magn. Reson. Med. 91, 4–18. doi: 10.1002/mrm.29805
Mosso, J., Yin, T., Poitry-Yamate, C., Simicic, D., Lepore, M., McLin, V. A., et al. (2022). ‘PET CMRglc mapping and 1H-MRS show altered glucose uptake and neurometabolic profiles in BDL rats’, Anal. Biochem. 647:114606. doi: 10.1016/j.ab.2022.114606
Nahirney, P. C., and Tremblay, M.-E. (2021). Brain Ultrastructure: Putting the Pieces Together. Front. Cell Dev. Biol. 9:629503. doi: 10.3389/fcell.2021.629503
Najac, C., Branzoli, F., Ronen, I., and Valette, J. (2016). Brain intracellular metabolites are freely diffusing along cell fibers in grey and white matter, as measured by diffusion-weighted MR spectroscopy in the human brain at 7 T. Brain Struct. Funct. 221, 1245–1254. doi: 10.1007/s00429-014-0968-5
Najac, C., Marchadour, C., Guillermier, M., Houitte, D., Slavov, V., Brouillet, E., et al. (2014). Intracellular metabolites in the primate brain are primarily localized in long fibers rather than in cell bodies, as shown by diffusion-weighted magnetic resonance spectroscopy. NeuroImage 90, 374–380. doi: 10.1016/j.neuroimage.2013.12.045
Palombo, M., Ligneul, C., Najac, C., le Douce, J., Flament, J., Escartin, C., et al. (2016). New paradigm to assess brain cell morphology by diffusion-weighted MR spectroscopy in vivo. Proc. Natl. Acad. Sci. USA 113, 6671–6676. doi: 10.1073/pnas.1504327113
Palombo, M., Shemesh, N., Ronen, I., and Valette, J. (2018). Insights into brain microstructure from in vivo DW-MRS. NeuroImage 182, 97–116. doi: 10.1016/j.neuroimage.2017.11.028
Pierzchala, K., Hadjihambi, A., Mosso, J., Jalan, R., Rose, C. F., and Cudalbu, C. (2023). Lessons on brain edema in HE: from cellular to animal models and clinical studies. Metab. Brain Dis. doi: 10.1007/s11011-023-01269-5
Pierzchala, K., Simicic, D., Sienkiewicz, A., Sessa, D., Mitrea, S., Braissant, O., et al. (2022). Central nervous system and systemic oxidative stress interplay with inflammation in a bile duct ligation rat model of type C hepatic encephalopathy. Free Radic. Biol. Med. 178, 295–307. doi: 10.1016/j.freeradbiomed.2021.12.011
Rackayova, V., Braissant, O., McLin, V. A., Berset, C., Lanz, B., and Cudalbu, C. (2016). 1H and 31P magnetic resonance spectroscopy in a rat model of chronic hepatic encephalopathy: in vivo longitudinal measurements of brain energy metabolism. Metab. Brain Dis. 31, 1303–1314. doi: 10.1007/s11011-015-9715-8
Rackayova, V., Cudalbu, C., Pouwels, P. J. W., and Braissant, O. (2017). Creatine in the central nervous system: from magnetic resonance spectroscopy to creatine deficiencies. Anal. Biochem. 529, 144–157. doi: 10.1016/j.ab.2016.11.007
Rackayová, V., Flatt, E., Braissant, O., Grosse, J., Capobianco, D., Mastromarino, P., et al. (2021). Probiotics improve the neurometabolic profile of rats with chronic cholestatic liver disease. Sci. Rep. 11:2269. doi: 10.1038/s41598-021-81871-8
Rae, C. D. (2014). A guide to the metabolic pathways and function of metabolites observed in human brain 1H magnetic resonance spectra. Neurochem. Res. 39, 1–36. doi: 10.1007/s11064-013-1199-5
Santamaria, F., Wils, S., de Schutter, E., and Augustine, G. J. (2006). Anomalous diffusion in Purkinje cell dendrites caused by spines. Neuron 52, 635–648. doi: 10.1016/j.neuron.2006.10.025
Santamaria, F., Wils, S., de Schutter, E., and Augustine, G. J. (2011). The diffusional properties of dendrites depend on the density of dendritic spines. Eur. J. Neurosci. 34, 561–568. doi: 10.1111/j.1460-9568.2011.07785.x
Simicic, D., Cudalbu, C., and Pierzchala, K. (2022). Overview of oxidative stress findings in hepatic encephalopathy: from cellular and ammonium-based animal models to human data. Anal. Biochem. 654:114795. doi: 10.1016/j.ab.2022.114795
Simicic, D., Pierzchala, K., Rackayová, V., Braissant, O., Mitrea, S. O., Sessa, D., et al. (2019). P: 33 in vivo longitudinal 1H MRS study of hippocampal, Cereberal and striatal metabolic changes in the adult brain using an animal model of chronic hepatic encephalopathy. Am. J. Gastroenterol. 114:S17. doi: 10.14309/01.ajg.0000582108.29364.13
Simicic, D., Rackayova, V., Xin, L., Tkáč, I., Borbath, T., Starcuk, Z. Jr., et al. (2021). In vivo macromolecule signals in rat brain 1H-MR spectra at 9.4T: parametrization, spline baseline estimation, and T2 relaxation times. Magn. Reson. Med. 86, 2384–2401. doi: 10.1002/mrm.28910
Skripuletz, T., Manzel, A., Gropengießer, K., Schäfer, N., Gudi, V., Singh, V., et al. (2015). Pivotal role of choline metabolites in remyelination. Brain J. Neurol. 138, 398–413. doi: 10.1093/brain/awu358
Urenjak, J., Williams, S. R., Gadian, D. G., and Noble, M. (1993). Proton nuclear magnetic resonance spectroscopy unambiguously identifies different neural cell types. J. Neurosci. 13, 981–989. doi: 10.1523/JNEUROSCI.13-03-00981.1993
Vangelderen, P., Despres, D., Vanzijl, P. C. M., and Moonen, C. T. W. (1994). Evaluation of restricted diffusion in cylinders. Phosphocreatine in rabbit leg muscle. J. Magn. Reson. B 103, 255–260. doi: 10.1006/jmrb.1994.1038
Zaqout, S., and Kaindl, A. M. (2016). Golgi-Cox Staining Step by Step. Front. Neuroanat. 10:38. doi: 10.3389/fnana.2016.00038
Keywords: in vivo magnetic resonance spectroscopy, diffusion-weighted magnetic resonance spectroscopy, brain metabolism, hepatic encephalopathy, rat brain, bile duct ligation, ultra high magnetic field
Citation: Mosso J, Briand G, Pierzchala K, Simicic D, Sierra A, Abdollahzadeh A, Jelescu IO and Cudalbu C (2024) Diffusion of brain metabolites highlights altered brain microstructure in type C hepatic encephalopathy: a 9.4 T preliminary study. Front. Neurosci. 18:1344076. doi: 10.3389/fnins.2024.1344076
Edited by:
Maryam Afzali, University of Leeds, United KingdomReviewed by:
Yuhei Takado, National Institutes for Quantum and Radiological Science and Technology (Japan), JapanJens Velde Andersen, University of Copenhagen, Denmark
Copyright © 2024 Mosso, Briand, Pierzchala, Simicic, Sierra, Abdollahzadeh, Jelescu and Cudalbu. This is an open-access article distributed under the terms of the Creative Commons Attribution License (CC BY). The use, distribution or reproduction in other forums is permitted, provided the original author(s) and the copyright owner(s) are credited and that the original publication in this journal is cited, in accordance with accepted academic practice. No use, distribution or reproduction is permitted which does not comply with these terms.
*Correspondence: Cristina Cudalbu, Y3Jpc3RpbmEuY3VkYWxidUBlcGZsLmNo
†These authors have contributed equally to this work and share first authorship