
95% of researchers rate our articles as excellent or good
Learn more about the work of our research integrity team to safeguard the quality of each article we publish.
Find out more
ORIGINAL RESEARCH article
Front. Neurosci. , 11 December 2023
Sec. Auditory Cognitive Neuroscience
Volume 17 - 2023 | https://doi.org/10.3389/fnins.2023.1254423
This article is part of the Research Topic The Effects of Auditory Neural Disorders on Speech Production and Perception View all 8 articles
 Min Zhu1
 Qin Gong1,2*
Tailor-made notched music training (TMNMT) is a promising therapy for tinnitus. Residual inhibition (RI) is one of the few interventions that can temporarily inhibit tinnitus, which is a useful technique that can be applied to tinnitus research and explore tinnitus mechanisms. In this study, RI effect of TMNMT in tinnitus was investigated mainly using behavioral tests, EEG spectral and microstate analysis. To our knowledge, this study is the first to investigate RI effect of TMNMT. A total of 44 participants with tinnitus were divided into TMNMT group (22 participants; ECnm, NMnm, RInm represent that EEG recordings with eyes closed stimuli-pre, stimuli-ing, stimuli-post by TMNMT music, respectively) and Placebo control group (22 participants; ECpb, PBpb, RIpb represent that EEG recordings with eyes closed stimuli-pre, stimuli-ing, stimuli-post by Placebo music, respectively) in a single-blind manner. Behavioral tests, EEG spectral analysis (covering delta, theta, alpha, beta, gamma frequency bands) and microstate analysis (involving four microstate classes, A to D) were employed to evaluate RI effect of TMNMT. The results of the study showed that TMNMT had a stronger inhibition ability and longer inhibition time according to the behavioral tests compared to Placebo. Spectral analysis showed that RI effect of TMNMT increased significantly the power spectral density (PSD) of delta, theta bands and decreased significantly the PSD of alpha2 band, and microstate analysis showed that RI effect of TMNMT had shorter duration (microstate B, microstate C), higher Occurrence (microstate A, microstate C, microstate D), Coverage (microstate A) and transition probabilities (microstate A to microstate B, microstate A to microstate D and microstate D to microstate A). Meanwhile, RI effect of Placebo decreased significantly the PSD of alpha2 band, and microstate analysis showed that RI effect of Placebo had shorter duration (microstate C, microstate D), higher occurrence (microstate B, microstate C), lower coverage (microstate C, microstate D), higher transition probabilities (microstate A to microstate B, microstate B to microstate A). It was also found that the intensity of tinnitus symptoms was significant positively correlated with the duration of microstate B in five subgroups (ECnm, NMnm, RInm, ECpb, PBpb). Our study provided valuable experimental evidence and practical applications for the effectiveness of TMNMT as a novel music therapy for tinnitus. The observed stronger residual inhibition (RI) ability of TMNMT supported its potential applications in tinnitus treatment. Furthermore, the temporal dynamics of EEG microstates serve as novel functional and trait markers of synchronous brain activity that contribute to a deep understanding of the neural mechanism underlying TMNMT treatment for tinnitus.
Tinnitus is a distressing condition characterized by a persistent perceived ringing or buzzing sound in the absence of any external sound source (Baguley et al., 2013). The prevalence of tinnitus has been reported to range from 6 to 22% (Axelsson and Ringdahl, 1989; Kim et al., 2015; Wu et al., 2015), and tends to increase with age (Oiticica and Bittar, 2015; Wu et al., 2015; McCormack et al., 2016), posing a significant social burden in an aging society. Unfortunately, there is currently no known cure for tinnitus, which is attributed to the great heterogeneity in the symptom characteristics of individuals (Cederroth et al., 2019).
Tinnitus is generally considered to be not only a consequence of cochlear damage, but also a symptom involving the plasticity of the central nervous system (Lanting et al., 2009; van Der Loo et al., 2009; Chen et al., 2016). The underlying mechanisms of tinnitus can be divided into three broad categories: (a) peripheral auditory afferentation and central maladaptive plasticity changes, (b) hyperactivity of spontaneous auditory neurons, and (c) increased cross-fiber synchronization between neurons (Eggermont and Roberts, 2012; Baguley et al., 2013). Neuroimaging, electrophysiology and invasive and non-invasive neuromodulation techniques are widely used in the study of chronic tinnitus (Claes et al., 2014; De Ridder and Vanneste, 2014; De Ridder et al., 2015a; Mohan et al., 2016, 2017; Hullfish et al., 2018a,b; Hullfish et al., 2019).
Pathological oscillatory activity in the brain has found considerable support in the theory of tinnitus etiology. In fact, differences in oscillatory activity within different frequency bands may indicate functional lesions, since focal low-frequency activity is often associated with abnormal brain function (Papanicolaou, 2009). Therefore, extensive research has been devoted to identifying neural correlates of conscious tinnitus perception by comparing spontaneous resting state brain activity oscillations in individuals with and without tinnitus, using non-invasive recording methods obtained in non-invasive silence, such as magnetoencephalography (MEG) or electroencephalography (EEG). In response to the theory of abnormal oscillatory behavior in tinnitus and its supporting evidence, many proposed treatments aim to directly or indirectly alter oscillatory activity with the aim of alleviating symptoms, such as transcranial magnetic stimulation (Londero et al., 2018; Dong et al., 2020; Pink et al., 2021), transcranial direct current stimulation (Santos et al., 2018; Wang et al., 2018; Labree et al., 2021), neurofeedback (Güntensperger et al., 2017; Kleinjung et al., 2018; Czornik et al., 2022), alternating current stimulation, transcranial random noise stimulation, transcutaneous vagus nerve stimulation, and bimodal stimulation (Langguth, 2020; Yakunina and Nam, 2021; Herrera-Murillo et al., 2022).
In 1971, Feldmann found that the presence of noise caused tinnitus symptoms to be suppressed after noise cancelation for about 1 min (Feldmann, 1971; Roberts et al., 2006; Roberts, 2007), a phenomenon known as “residual inhibition” (RI; Vernon, 1977; Henry and Meikle, 2000). RI can be observed with various types of sounds, including pure tones (Feldmann, 1971; Roberts et al., 2008; Reavis et al., 2012; Tyler et al., 2014; Neff et al., 2017, 2019), narrow-band noise (Roberts et al., 2008), amplitude-modulated sound (Reavis et al., 2012; Tyler et al., 2014; Neff et al., 2017, 2019; Schoisswohl et al., 2020), frequency-modulated sound (Reavis et al., 2012; Neff et al., 2017), white noise (WN) (Henry et al., 2004; Sedley et al., 2012, 2015), or broadband noise (Feldmann, 1971, 1983; Tyler et al., 1984; Kaltenbach, 2006; Roberts et al., 2006, 2008; Kahlbrock and Weisz, 2008; Fournier et al., 2018). RI is one of the few interventions that can temporarily inhibit tinnitus. Its potential as a valuable measure is evident in the clinic, especially as a diagnostic marker of subtypes and a prognostic indicator of an individual’s response to therapeutic acoustic stimuli. Consequently, RI proves to be an invaluable asset in investigating the intricate mechanisms underlying tinnitus and is expected to be a suitable technique to detect the resting-state neural networks underlying tinnitus perception (Sedley et al., 2015; Hu et al., 2019).
Sound therapy is a non-invasive method recommended for the treatment of tinnitus, as stated in the 2014 American Academy of Otolaryngology–Head and Neck Surgery Foundation (AO-HNSF) clinical practice guidelines (CPGs) (Tunkel et al., 2014). A novel and effective technique for non-invasive neuromodulation of the auditory cortex in patients with chronic tinnitus is tailor-made notched music training (TMNMT) (Pantev et al., 2012). In 2010, Okamoto et al. (2010) proposed TMNMT to modify pleasant music by filtering out an octave range of individual’s tinnitus frequency as the central frequency band, which strengthens lateral inhibition and inhibits the hyperactivity of auditory cortical neurons, thereby potentially eliminating or weakening tinnitus (Okamoto et al., 2010; Teismann et al., 2011, 2014; Pantev et al., 2014; Pape et al., 2014; Stein et al., 2015a,b, 2016).
Microstates refer to electric potential topographies recorded in a multichannel array across the scalp, that remain quasi-stable for 60–120 ms before rapidly transitioning to a different microstate (Michel and Koenig, 2018). In contrast to some other techniques, microstate analysis simultaneously considers signals from all electrodes to build a global representation of a functional state. The rich syntax of the microstate time series provides a range of novel quantifications of the EEG signal with potential neurophysiological relevance. Indeed, many studies have demonstrated that characteristics of the EEG microstate time series vary across behavioral states (Stevens and Kircher, 1998; Lehmann et al., 2010), personality types (Schlegel et al., 2012), consciousness (Bréchet and Michel, 2022), sleep (Peng et al., 2021), pain (May et al., 2021) and neuropsychiatric disorders, such as Alzheimer’s disease (Dierks et al., 1997; Hanoglu et al., 2022), Parkinson’s disease (Pal et al., 2021; Hanoglu et al., 2022), Huntington’s disease (Faber et al., 2021), schizophrenia (Lehmann et al., 2005; Kim et al., 2021), panic (Kikuchi et al., 2011), dementia (Lin et al., 2021). Multiple evidence suggest that the microstate time series may provide insights into the neural activity of the brain in the resting state (Britz et al., 2010; Musso et al., 2010; Yuan et al., 2012). Microstate analysis of EEG presents a potent, cost-effective, high-time resolution and clinically applicable neurophysiological approach to study and evaluate the global functional states of the brain in both health and disease.
To our knowledge, however, there is a lack of research examining the residual inhibition (RI) of tinnitus induced by tailor-made notched music training (TMNMT). Therefore, the objective of this study is to utilize scalp EEG recordings technology to investigate the phenomenon of RI in tinnitus by TMNMT, we aim to provide valuable experimental evidence and practical implications for the potential applications of TMNMT in tinnitus treatment.
The study consisted of 44 participants recruited from the faculty and students of Tsinghua University, who had been experiencing tinnitus for a duration of more than 6 months. During the recruitment process, we have established specific requirements for potential subjects beyond tinnitus, including proficiency in language expression, as well as the ability to identify and comprehend frequency and loudness. Certain exclusion criteria were applied, included Meniere’s disease, chronic ear infections, otosclerosis, tumors, mental disorders, a history of drug/alcohol abuse, chronic headaches, and pulsating tinnitus. Eligible participants, with 22 in each group of TMNMT (nm) and Placebo (pb), were kept unaware of their group assignment as part of a single-blind study, using a prespecified label. A participant in TMNMT group who was unable to identify and comprehend the frequency and loudness of tinnitus was reassigned to Placebo group. Prior to conducting the study, the Medical Ethics Committee of Tsinghua University granted approval, and all participants provided their informed consent.
All participants underwent a pure-tone hearing test, which obtained hearing thresholds of 125, 250, 500, 1,000, 2,000, 3,000, 4,000, 6,000 and 8,000 Hz according to the procedures prescribed by the British Academy of Audiology. The mean hearing threshold of all participants was below 70 dB HL. The mean hearing threshold was calculated as the average of the hearing thresholds at 500, 1000, 2,000 and 4,000 Hz (Dispenza et al., 2011; Bing et al., 2018). Furthermore, Tinnitus Handicap Inventory (THI), Tinnitus functional index (TFI), and Visual Analogue Scale (VAS, included Loudness and Annoyance) were employed to evaluate the distress and impact of tinnitus-related on participants’ daily lives.
Tinnitus pitch and loudness matching tests were conducted using a portable instrument named QingEr Tinnitus Treatment Instrument (QEHS-TI01, designed and manufactured by Wuxi QingEr HuaSheng Technology Co., LTD). A comprehensive set of 188 pure tone frequencies ranging from 125 Hz to 8.5 kHz, divided by 1/30 octave intervals, was utilized to match the pitch of the participants’ tinnitus (Gong et al., 2022). The participants were asked to compare the tones they heard with the pitch of individual tinnitus until they achieved a tone that exactly matched their tinnitus pitch. Following confirming the tinnitus pitch, an approximate tinnitus loudness level was given using the same instrument, which the level was adjusted in 1 dB sound pressure level (SPL) steps until participants reported that the loudness accurately matched their perception of tinnitus loudness (Kim et al., 2016). This process allowed for the fine-tuning of the loudness level to align with the subjective experience of each participant.
In TMNMT group, the participants underwent a series of EEG recordings during different stages of the experiment. Initially, a 5-min resting-state EEG with eyes closed (ECnm subgroup) was recorded. Following this, there was a brief period of rest with eyes open. Subsequently, a 5-min segment of notched music with a loudness of 10 dB SPL above the threshold of tinnitus loudness was played by QEHS-TI01, which specifically filtered out the tinnitus central frequency and increased the lateral inhibition effect on the edge frequency bands of the notch area, associated with each participant’s individual tinnitus. To better target tinnitus participants with notched music, the music energy spectrum was equalized by digitally redistributing energy from lower to higher-frequency ranges, a process often referred to as “flattening” (Teismann et al., 2011), thereby enriching the energy spectrum in the higher-frequency range (Figure 1). The music was delivered to the both ears via a pair of insert earphones. The EEG data was simultaneously recorded with eyes closed at the same time (NMnm subgroup). Finally, another 5-min EEG recording was conducted with eyes closed, known as residual inhibition (RInm subgroup).
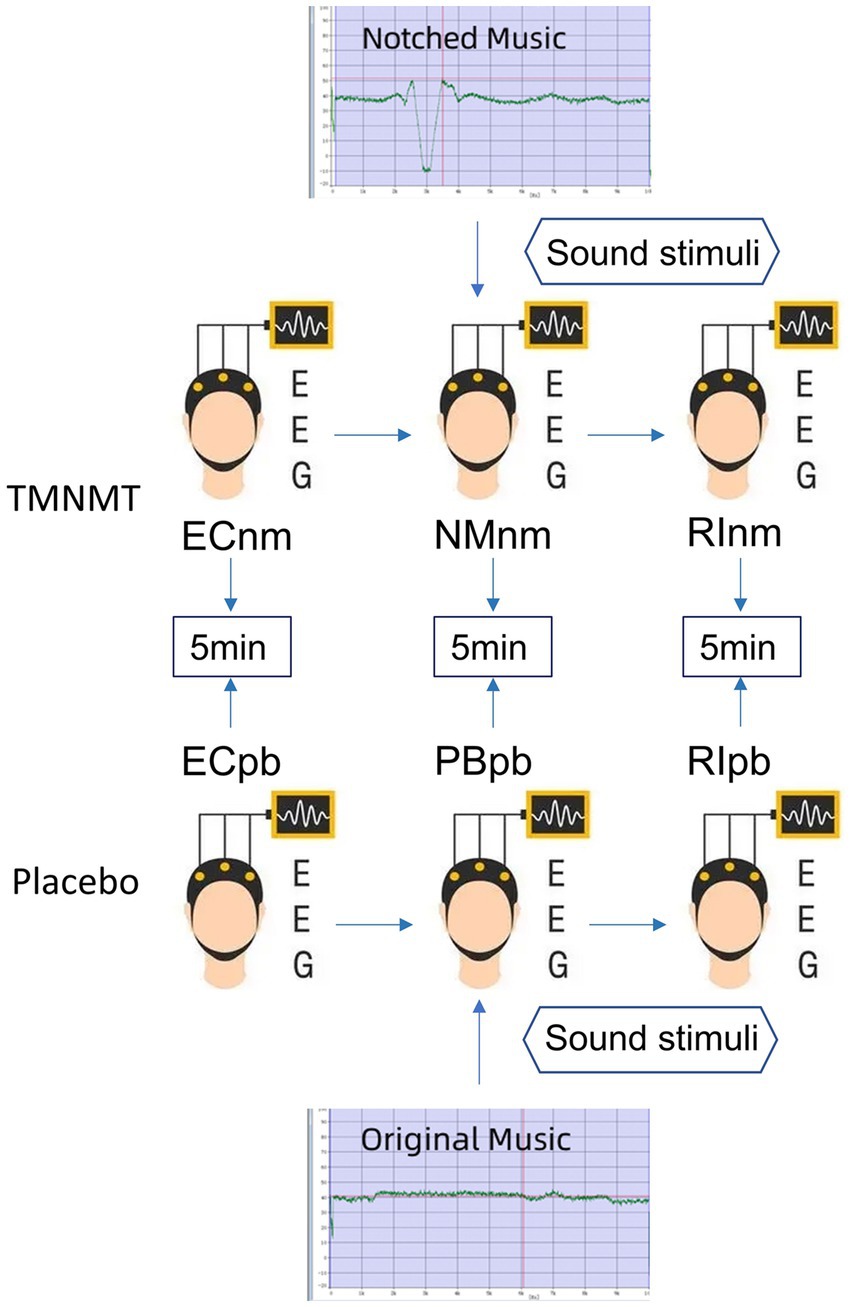
Figure 1. Experimental pipeline. ECnm, NMnm, RInm subgroups in TMNMT group and ECpb, PBpb, RIpb subgroups in Placebo group. ECnm, EEG recordings with eyes closed stimuli-pre by TMNMT music; NMnm, EEG recordings with eyes closed stimuli-ing by TMNMT music; RInm, EEG recordings with eyes closed stimuli-post by TMNMT music; ECpb, EEG recordings with eyes closed stimuli-pre by Placebo music; PBpb, EEG recordings with eyes closed stimuli-ing by Placebo music; RIpb, EEG recordings with eyes closed stimuli-post by Placebo music.
In contrast, Placebo group, as control group, underwent a similar procedure but with slight variations. The participants in Placebo group also underwent a 5-min resting-state EEG with eyes closed (ECpb subgroup). However, instead of the notched music intervention, a 5-min segment of original music with a loudness of 10 dB SPL above the threshold of tinnitus loudness without any specific processing was played by QEHS-TI01. The EEG data was recorded simultaneously with eyes closed during this period (PBpb subgroup). Similar to TMNMT group, a subsequent 5-min EEG recording for the residual inhibition (RIpb subgroup) was conducted with eyes closed. A schematic representation of these procedures can be seen in Figure 1.
TMNMT and Placebo music were derived from the nature environmental sounds (Strauss et al., 2017), such as rain, streams, wind and waves, etc., which were sounds comfortable and relaxed. The distinction between TMNMT music and Placebo music is subtle, and participants were unable to discern their respective groups based solely on the auditory stimuli they received.
The electroencephalography (EEG) data were acquired using the Neuroscan system1 in a quiet room, with each participant seated in a comfortable chair in an upright position. To minimize potential interference from alcohol, coffee, cola, and tea on EEG recordings (Barry et al., 2011; Foxe et al., 2012; Vanneste and De Ridder, 2012a), participants were instructed to abstain from consuming these substances for 24 h prior to the study. Cleaned scalp with a scrub to ensure optimal signal quality before recording baseline EEG. The 64-channel Neuroscan synnamps2 Quick Cap placed in the international standard 10–20 system was utilized to collect EEG, and the EEG signals was sampled at a rate of 1,000 Hz using a Neuroscan synnamps2 amplifier to check that the impedance levels remained below 5 kΩ throughout the recording session. The midline reference point was located at the vertex (Cz), and the ground electrode was located at the AFZ.
The acquired EEG data were preprocessed using MATLAB and EEGLAB. The preprocessing steps consisted of the following procedures: Removal of irrelevant electrodes and resampling the data to 512 Hz. a Finite Impulse Response (FIR) filter performed for bandpass filtering in the frequency range of 0.5 to 100 Hz, with additional notch filtering at 50 Hz and 100 Hz, re-selected average reference and divided the data into 2 s epochs, identified and rejected the bad epochs via visual inspection, including instances of swallowing, gnashing, chewing and excessive muscle artifacts. Subsequently, performed a spherical interpolation algorithm to interpolate the removed channels, to ensure that have an equal number of channels for all participants. Data from the remaining electrodes were performed using the infomax algorithms for independent component analysis (ICA) (Jung et al., 1998) to remove eye blinks, saccades, muscle artifacts, electrocardiogram (ECG) signals, head movements, channel noise, and other transient noises. Artifact detection was detected on all epochs by a voltage threshold of ±100 μV, and any epochs not within this threshold were excluded.
These preprocessing steps helped ensure the data’s quality and remove unwanted artifacts, allowing for more accurate subsequent analysis and interpretation.
Spectral analysis was performed by Welch’s method. The Welch’s method involves dividing the signal of N samples into K data segments of M samples, with an overlap of D samples. If D = M/2, the overlap is 50%; while D = 0, the overlap is 0%. The overlapping segments are then windowed (i.e., multiplied by a symmetric bell-shaped window). Subsequently, the Discrete Fourier Transform (DFT) is computed for each windowed data segment, resulting in the periodogram. The final spectral estimate is obtained by averaging the periodograms of all data segments. The Welch’s method can lead to a reduction in the variance of spectral estimate as 1/K. The power spectral density [PSD, 10 log10 (V2/Hz, dB)] for each channel based on the periodogram was calculated and averaged across channels to measure comparisons between groups in each frequency band.
Spectral estimation was applied on the EEG recordings in a specific time period to calculate the power of various certain rhythms: delta (0.5 ~ 4 Hz), theta (4 ~ 8 Hz), alpha1 (8 ~ 10 Hz), alpha2 (10 ~ 13 Hz), beta1 (13 ~ 18 Hz), beta2 (18 ~ 21 Hz), beta3 (21 ~ 30 Hz), gamma1 (30 ~ 45 Hz), gamma2 (55 ~ 100 Hz). By examining the power values within these frequency bands, comparisons between different groups could be made, shedding light on potential differences in neural activity.
Microstate analysis can be considered as a method to reveal the topographic steady period (80–120 ms) from EEG signals. In fact, applying spatial reduction using a clustering algorithm allows extraction of a certain number of fixed topologies (global templates), called microstates. By fitting such topographic maps to the EEG time processes, it is possible to obtain a discrete sequence of microstates (Prete et al., 2022). Microstate analysis aims at identifying major topographic configurations (global templates or microstates) that alternate over the course of EEG time to describe the ongoing brain dynamics (Khanna et al., 2015). By quantitative measures, characteristics characterizing the specific sequences of microstates can be calculated.
The Microstate analysis was conducted using EEGLAB plug-in2 for artifact-free EEG data analysis. The EEG data performed digital bandpass filtering in the range of 2 ~ 20 Hz (Koenig et al., 2002; Kindler et al., 2011; Nishida et al., 2013). A resting-state EEG microstate analysis is implemented as shown in Figure 2, including global field power extraction, microstate clustering, back-fitting (Pascual-Marqui et al., 1995). EEG microstate analysis begins with a bottom-up extraction of EEG microstate templets from the spontaneous EEG signals (Figures 2A,C). Then, a top-down process termed back-fitting (Figure 2D) is conducted to re-represent the EEG data into a series of dynamic microstate sequences. The global field power (GFP) of multi-channel EEG data represents global brain activity, which is a real-time, reference-independent measure of whole brain neuronal activity (Lehmann and Skrandies, 1980). The EEG topography is stable around the peak of GFP (Koenig et al., 2002). Therefore, EEG data were first simplified to the time point at the local maximum of global field power (GFP), representing the time point at the highest signal-to-noise ratio (Murray et al., 2008; Khanna et al., 2015; Michel and Koenig, 2018). The GFP reflects the potential variances across multiple electrodes at a specific point in time. The timepoints between two GFP peaks were obtained using nearest-neighbor interpolation. GFP can be calculated by the following formula:
Where N represents the number of electrodes in the EEG data (i = 1: 60), V represents the electrical potential measured over the scalp. Vi(t) represents the instantaneous electrical potential at electrode i and time t, and Vmean(t) represents the average electrical potential at all electrodes at time t. The global field power time series (GFP) is calculated as the spatial standard deviation of the EEG topography at each given time to quantify synchronous activity across all the electrodes at each timepoint (Figure 2B) (Skrandies, 1990). At the local GFP maximum (red dots), the spatial configuration of the EEG is considered stable and accounts for most of the variance of the time series (Wackermann et al., 1993), and switch to the next topographic map immediately after the GFP reaches a minimum peak (Lehmann et al., 1987). In microstate analysis, the topographies of GFP peaks are considered to be discrete microstates, whereas dynamic changes in EEG signals as variations of these states (Khanna et al., 2015). The atomize-agglomerate hierarchical cluster (AAHC), a modified k-means that provides a unique cluster for microstate analysis, was used to generate EEG topological clusters (Tibshirani and Walther, 2005; Murray et al., 2008; Britz et al., 2009). In the process of clustering, the algorithm ignores EEG polarity (Schlegel et al., 2012; Kuhn et al., 2015; Pipinis et al., 2017). Cluster analysis is conducted first at the individual template maps level and then at group level, and determine the optimal number of clustering based on cross validation (CV) criterion and Krzanowski-Lai (KL) criteria (Murray et al., 2008). Previous researches have suggested that EEG can typically be clustered into four distinct microstates, categorized as classes A, B, C, and D (Brodbeck et al., 2012; Khanna et al., 2015).
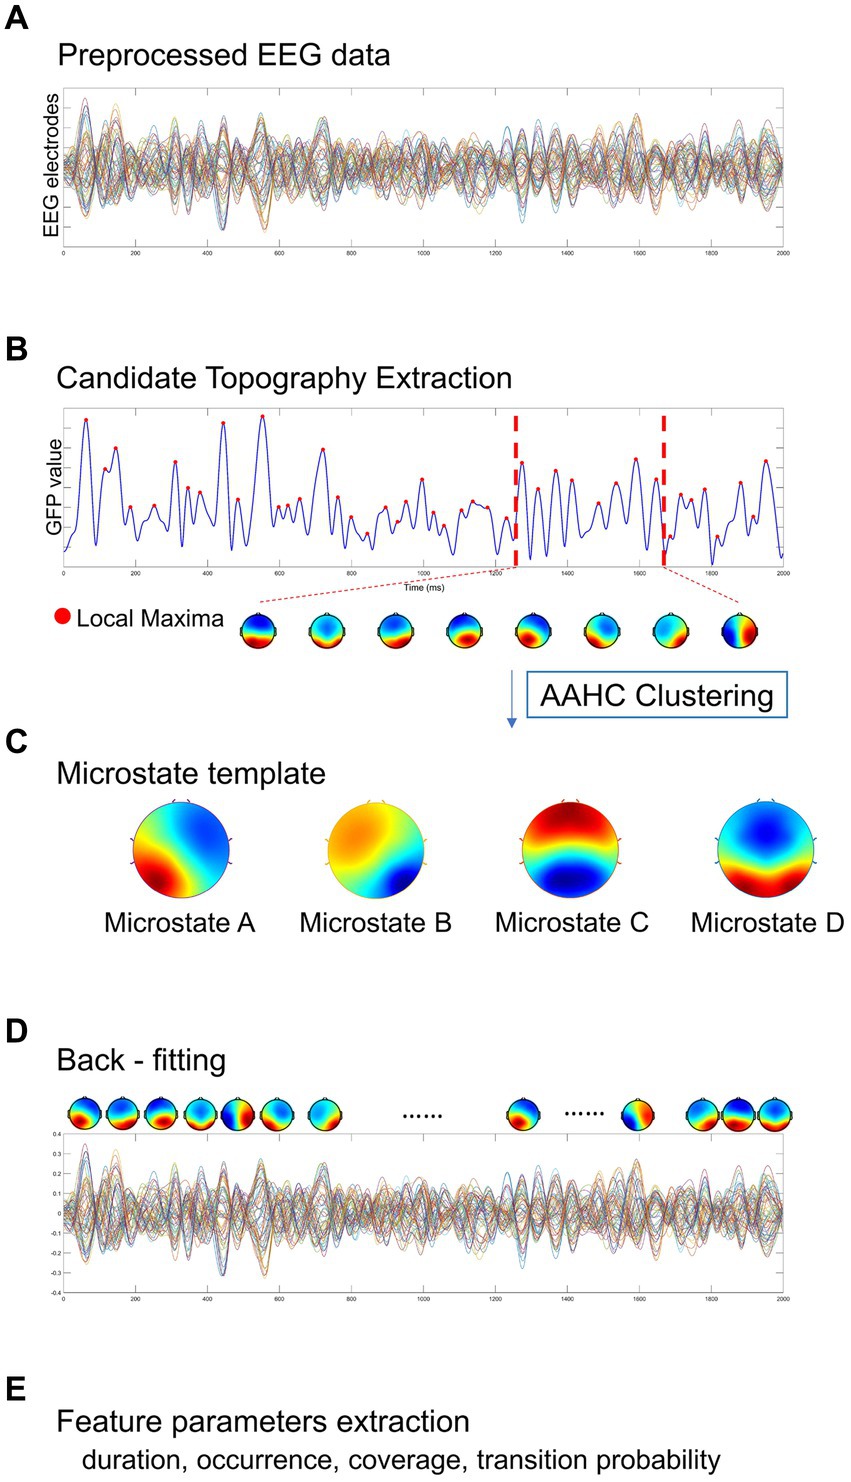
Figure 2. A standard procedure of EEG microstate analysis. Based on (A) the preprocessed EEG data, (B) candidate topographies with high signal-to-noise ratios were extracted from the local maxima of the GFP curve, (C) four templates were obtained after AAHC Clustering. (D) The final detected EEG microstate templates were then fitted back into the preprocessed EEG data by assigning each time point to a predominant microstate. After EEG microstates back-fitting, the original EEG time series were re-represented into EEG microstate sequences covering whole-brain spontaneous spatial–temporal activities. (E) A several of microstate feature metrics were calculated for quantitative measurement, including duration, occurrence, coverage, transition probability.
In this study, we categorized the microstates of each subject and each group. Firstly, the EEG maps of all participants were clustered into four grand subsets from all groups (TMNMT and Placebo). With the mean map of each subset computed, the four grand subsets were assigned to classes A, B, C, and D, respectively. Then, the EEG maps within each group were clustered into four group subsets. Each group subsets were assigned to the same class as the grand subset that exhibited the highest similarity. Finally, the EEG maps of each subject from TMNMT and Placebo groups were clustered and assigned to one of the four microstate classes. Spatial correlations were calculated between each map at group level and the topographies (maps) at the GFP peaks of the original EEG signals at individual level. Therefore, microstate maps were used to determine the back-fitting to the original map topography at each GFP peak according to maximum spatial correlation.
With the obtained microstates sequence, we conducted the computation and analysis of several metrics that hold potential neurophysiological significance (Figure 2E):
1) mean duration (ms) of a microstate class: defined as the average time covered by the same microstate class (Michel and Koenig, 2018).
2) occurrence rate (/s) per second of a microstate class: defined as the number of occurrences of a given microstates class per second across all analyzed epochs (Michel and Koenig, 2018).
3) time coverage (%) of a microstate class: defined as the percentage of the total analysis time in a given microstate class (Lehmann et al., 1987, 2005; Andreou et al., 2014; Khanna et al., 2015; Seitzman et al., 2017).
4) transition probability (%) between microstate classes: defined as the probability of transition from one given class to another one (Khanna et al., 2015; Michel and Koenig, 2018). The transition probability of a microstate means that the microstate is non-random and has the potential significance of sequence transition (Lehmann et al., 2005).
Continuous variables were compared between the two groups using an independent sample t-test, and gender distribution was compared using Pearson’s χ2 test. To compare the power spectral density (PSD), repeated measures analysis of variance (RM-ANOVA) and two-tailed paired t test were performed separately for each group, with corrected effects for multiple comparisons of the false discovery rate (FDR). RM-ANOVA was also applied to analyze inter-group differences, with microstate classes (microstate A, B, C, and D) and microstate metrics (duration, occurrence, coverage, transition probabilities) as within-subject factors and group as between-subject factors. In case where significant group main effects or interactions were found in the RM-ANOVA, univariate ANOVA was then performed to investigate the simple effects. FDR correction was performed to adjust for multiple comparisons.
There were no significant differences in terms of gender, age, mean hearing threshold, tinnitus duration, tinnitus lateralization, THI score, TFI score, and VAS score between TMNMT group and Placebo group. Demographics and clinical characteristics were given in Table 1.

Table 1. Demographics and clinical characteristic of two groups.
A Likert scale was used to assess the effectiveness of TMNMT and Placebo interventions in tinnitus inhibition. The scale ranged from −5 to 5 (−5 indicates that tinnitus disappears after the sound stimuli; 0 indicates that no change in tinnitus loudness; and 5 indicates that tinnitus loudness doubled). We also recorded the duration of residual inhibition (RI), which spanned from the end of the sound stimuli until the tinnitus loudness returned to its initial level. The results showed TMNMT had a significantly stronger inhibition intensity (TMNMT: −3.6 ± 1.3; Placebo: −1.1 ± 1.6, p = 0.0257; Figure 3A) and longer inhibition time (TMNMT: 403 ± 215 s; Placebo: 96 ± 123 s, p = 0.0045; Figure 3B) compared to Placebo group by independent samples t test.
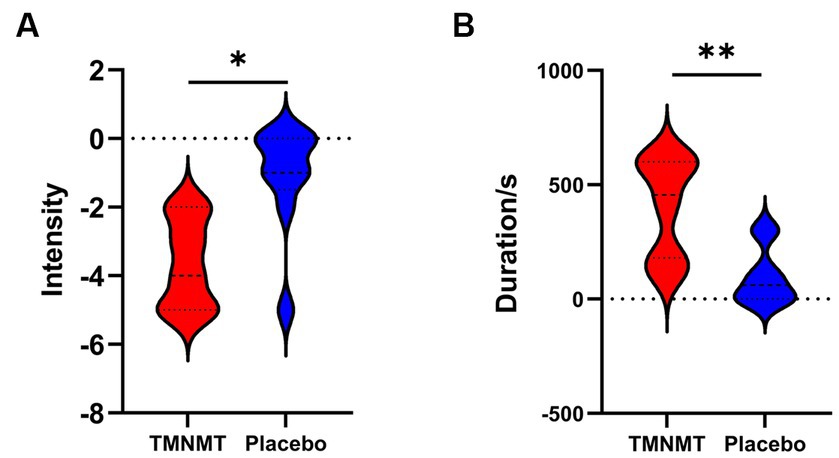
Figure 3. The intensity and duration of residual inhibition (RI) between TMNMT and Placebo groups. (A) TMNMT: −3.6 ± 1.3; Placebo: −1.1 ± 1.6, p = 0.0257; (B) TMNMT: 403 ± 215 s; Placebo: 96 ± 123 s, p = 0.0045; *p < 0.05, **p < 0.01.
The comparison of spectral analysis of the two groups of participants stimuli-pre, stimuli-ing and stimuli-post of different modulated music by repeated measures ANOVA showed different significant differences. The frequency band (delta, theta, alpha1, alpha2, beta1, beta2, beta3, gamma1, gamma2) was regarded as a within-subject factor and group (ECnm, NMnm, RInm, ECpb, PBpb, RIpb) as a between-subject factor. From an analysis of the waveforms, Figure 4A showed the power spectral density (PSD) of whole-brain full bands in TMNMT group, the results of PSD showed that the main effect of frequency band factor (F = 300.7; p < 0.0001) was significant, while the Frequency band ∗ Group interaction effect (F = 0.5583; p = 0.9146) and the main effect of group factor were not significant (F = 0.7915; p = 0.4537). Post-hoc comparisons showed the PSD of delta band (ECnm vs. NMnm, p = 0.0005; ECnm vs. RInm, p = 0.0005; Figure 4B) and theta band (ECnm vs. NMnm, p = 0.0011; ECnm vs. RInm, p = 0.0043; Figure 4C) were significantly increased; alpha2 band (ECnm vs. RInm, p = 0.0026; NMnm vs. RInm, p = 0.0027; Figure 4D), beta2 band (ECnm vs. RInm, p = 0.0431; NMnm vs. RInm, p = 0.0251; Figure 4E), beta3 band (NMnm vs. RInm, p = 0.0234; Figure 4F) and gamma2 band (NMnm vs. RInm, p = 0.0180; Figure 4G) were significantly decreased (Table 2 and Figure 4). Figure 5A showed the PSD of whole-brain full bands in Placebo group, the results of PSD showed that the main effect of frequency band factor (F = 315.2; p < 0.0001) was significant, while the Frequency band ∗ Group interaction effect (F = 0.2623; p = 0.9984) and the main effect of group factor were not significant (F = 0.3160; p = 0.7292). Post-hoc comparisons showed the PSD of alpha2 band (ECpb vs. RIpb, p = 0.0352; PBpb vs. RIpb, p = 0.0033; Figure 5D), beta2 band (PBpb vs. RIpb, p = 0.0088; Figure 5E) and beta3 band (PBpb vs. RIpb, p = 0.0027; Figure 5F) were significantly decreased in Placebo group (Table 3 and Figure 5).
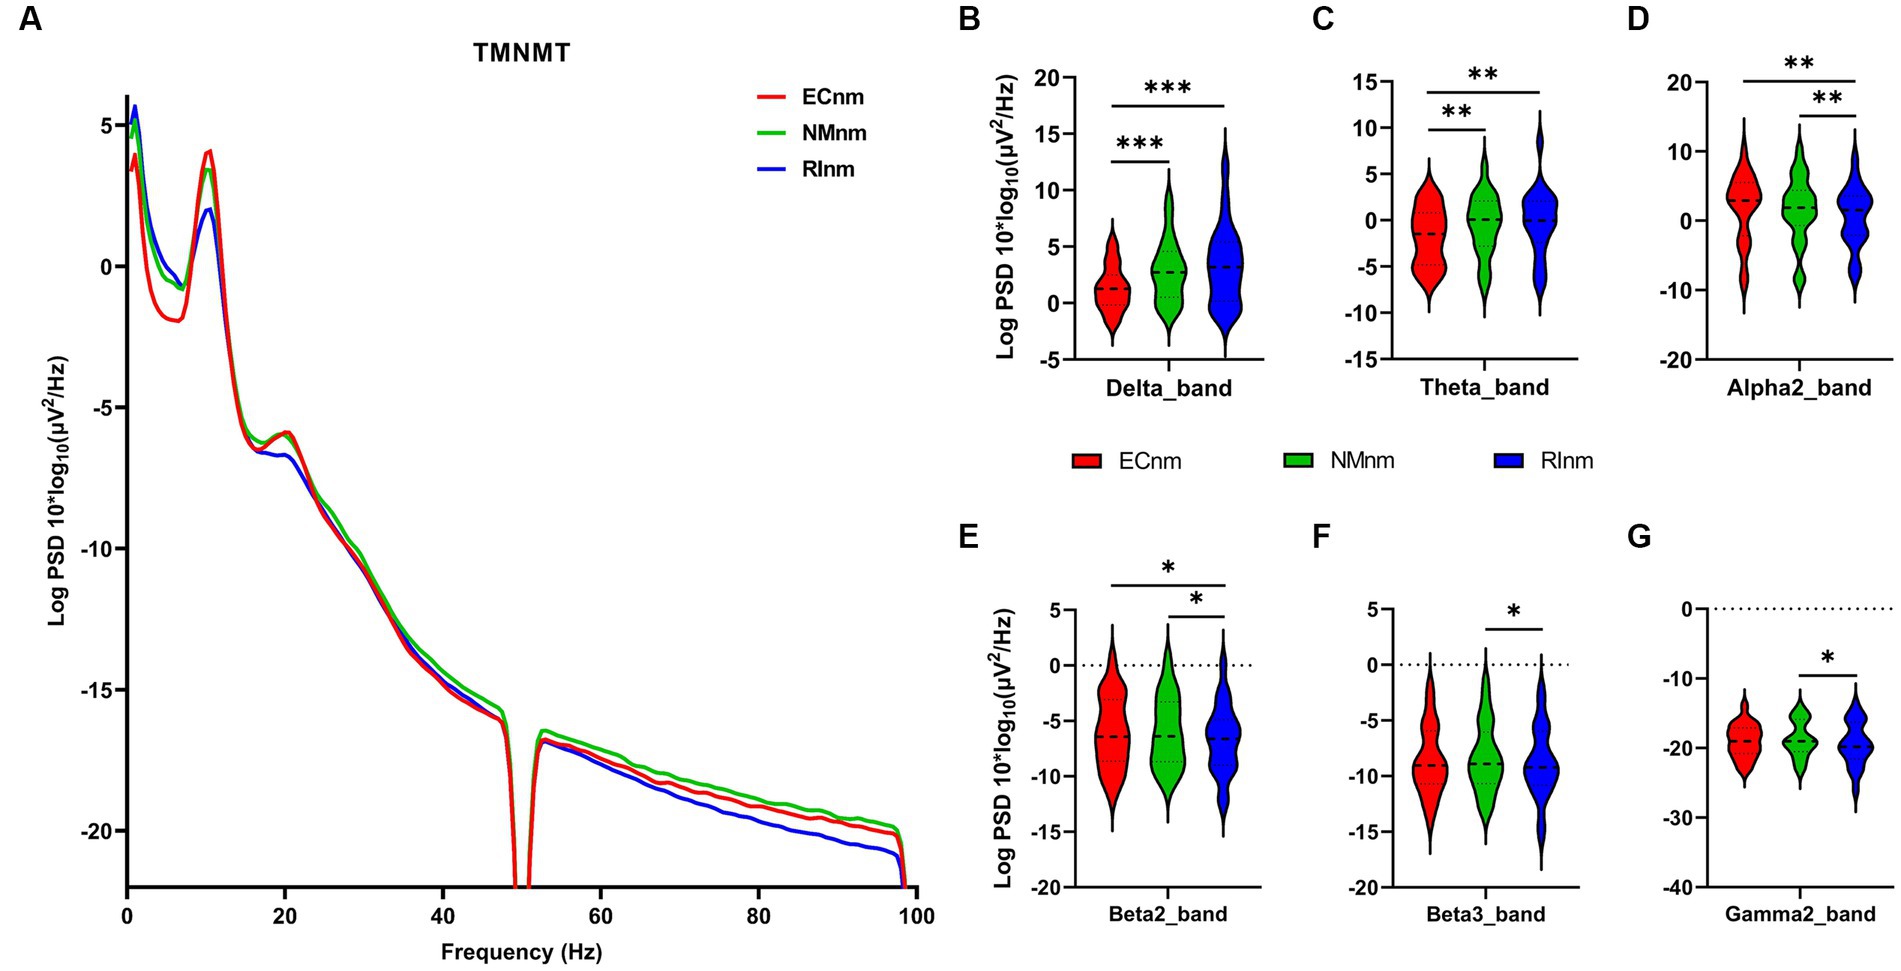
Figure 4. Waveforms of spectral analysis in TMNMT group. (A) The power spectral density (PSD) waveform of full frequency bands in ECnm, NMnm, RInm subgroups of TMNMT group. (B–G) The PSD of delta (B), theta (C), alpha2 (D), beta2 (E), beta3 (F), gamma2 (G) bands in ECnm, NMnm, RInm subgroups of TMNMT group. ECnm, EEG recordings with eyes closed stimuli-pre by TMNMT music; NMnm, EEG recordings with eyes closed stimuli-ing by TMNMT music; RInm, EEG recordings with eyes closed stimuli-post by TMNMT music. *p < 0.05, **p < 0.01, ***p < 0.001.
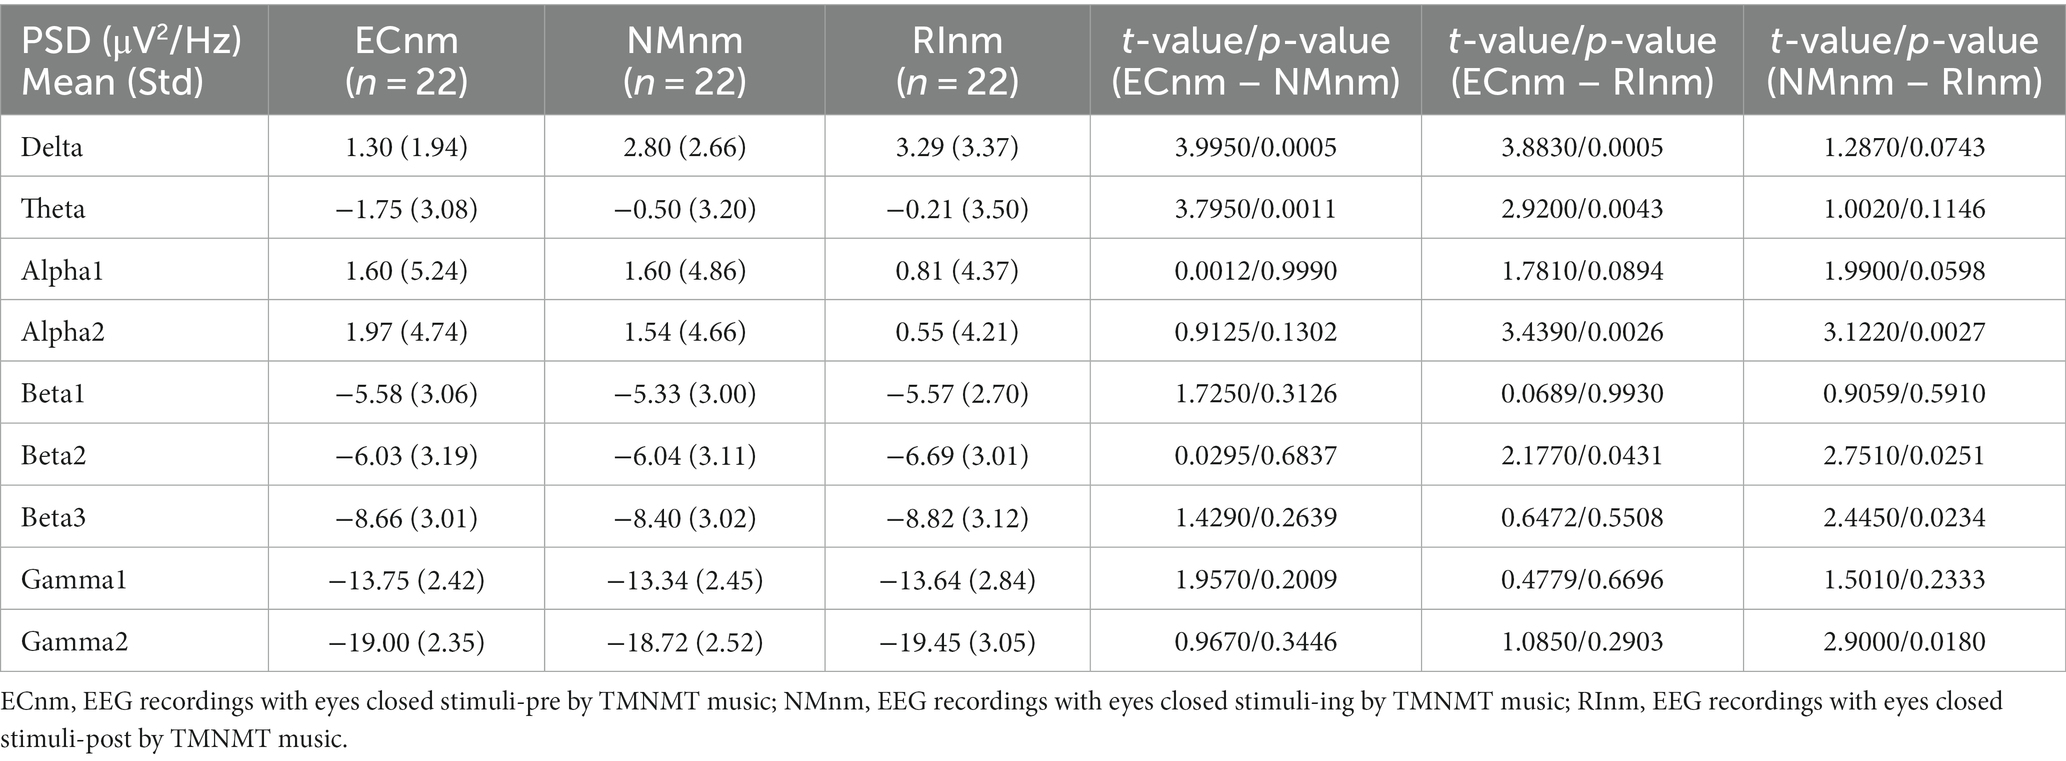
Table 2. The power spectral density (PSD) of whole-brain full bands in TMNMT group (ECnm, NMnm, RInm).
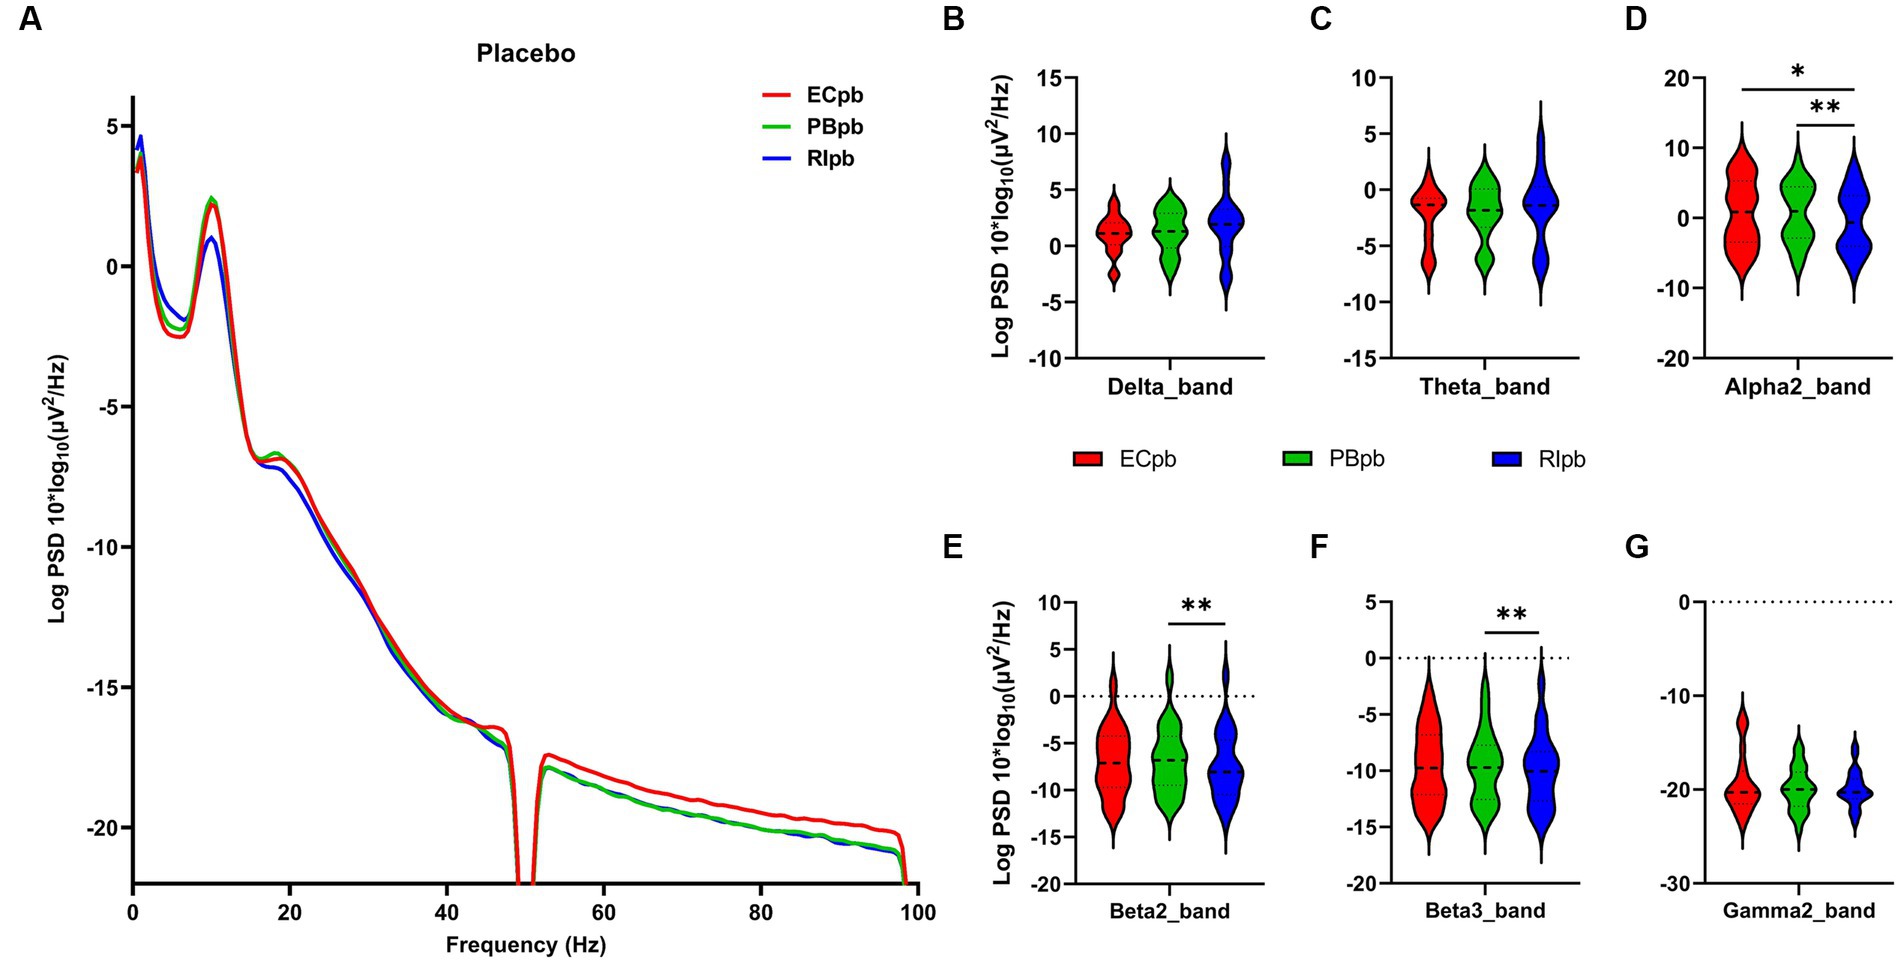
Figure 5. Waveforms of spectral analysis in Placebo group. (A) The power spectral density (PSD) waveform of full frequency bands in ECpb, PBpb, RIpb subgroups of Placebo group. (B–G) The PSD of delta (B), theta (C), alpha2 (D), beta2 (E), beta3 (F), gamma2 (G) bands in ECpb, PBpb, RIpb subgroups of Placebo group. ECpb, EEG recordings with eyes closed stimuli-pre by Placebo music; PBpb, EEG recordings with eyes closed stimuli-ing by Placebo music; RIpb, EEG recordings with eyes closed stimuli-post by Placebo music. *p < 0.05, **p < 0.01.
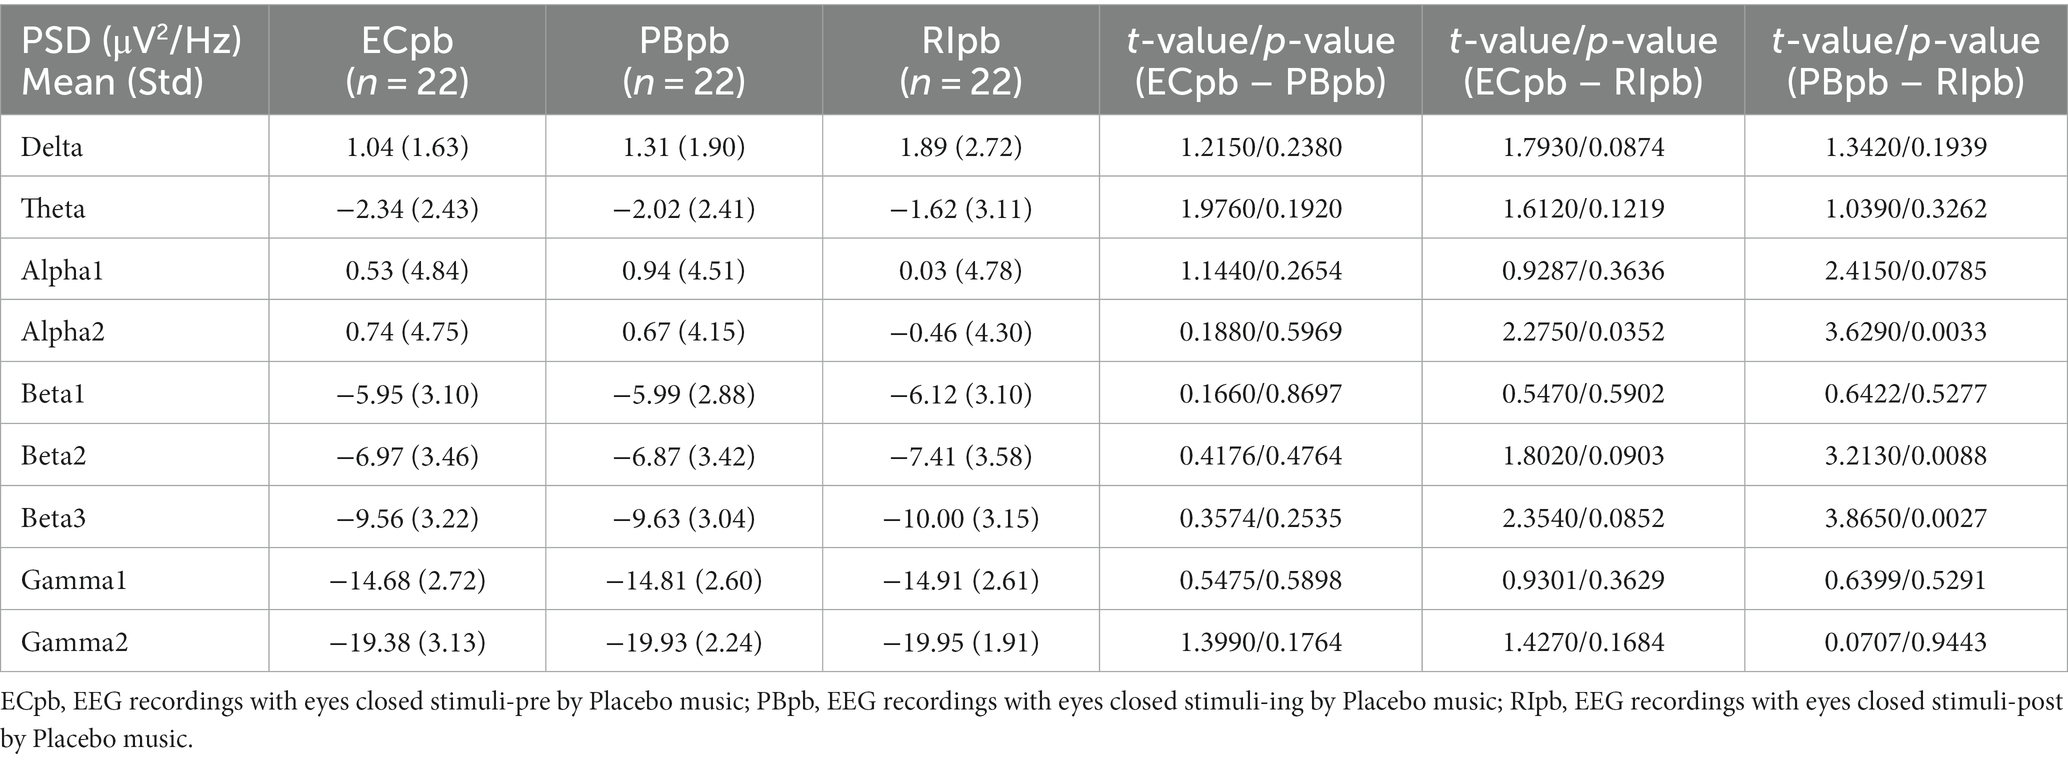
Table 3. The power spectral density (PSD) of whole-brain full bands in Placebo group (ECpb, PBpb, RIpb).
From the scalp topographies, through paired t-test analysis, the PSD of delta band and theta band of TMNMT group increased significantly, both ECnm vs. NMnm and ECnm vs. RInm had significant differences, and these effects survived correction for multiple comparisons of a false discovery rate (FDR) (Figures 6A,B); the PSD of alpha2 band, both ECnm vs. RInm and NMnm vs. RInm decreased significantly, and these effects remained after correction for multiple comparisons (Figure 6C); the PSD of beta2 band of ECnm vs. RInm decreased significantly, but this effect was nonexistent after correction for multiple comparisons of FDR and the PSD of beta2 band of NMnm vs. RInm decreased significantly, and this effect survived correction for multiple comparisons in part regions (Figure 6D); the PSD of beta3 band (NMnm vs. RInm) and gamma2 band (NMnm vs. RInm) decreased significantly, but these effects were nonexistent after correction for multiple comparisons of FDR (Figures 6E,F). In Placebo group, the PSD of delta band and theta band of ECpb vs. PBpb and ECpb vs. RIpb increased significantly in part regions, but these effects were nonexistent after correction for multiple comparisons of FDR (Figures 7A,B); the PSD of alpha2 band of ECpb vs. RIpb decreased significantly, but this effect was nonexistent after correction for multiple comparisons of FDR and the PSD of alpha2 band of PBpb vs. RIpb decreased significantly, and this effect was survival correction for multiple comparisons (Figure 7C); the PSD of beta2 band and beta3 band of PBpb vs. RIpb decreased significantly, and these effects survived correction for multiple comparisons in part regions (Figures 7D,E); the PSD of gamma2 band of ECpb vs. PBpb decreased significantly but this effect was nonexistent after correction for multiple comparisons of FDR (Figure 7F).
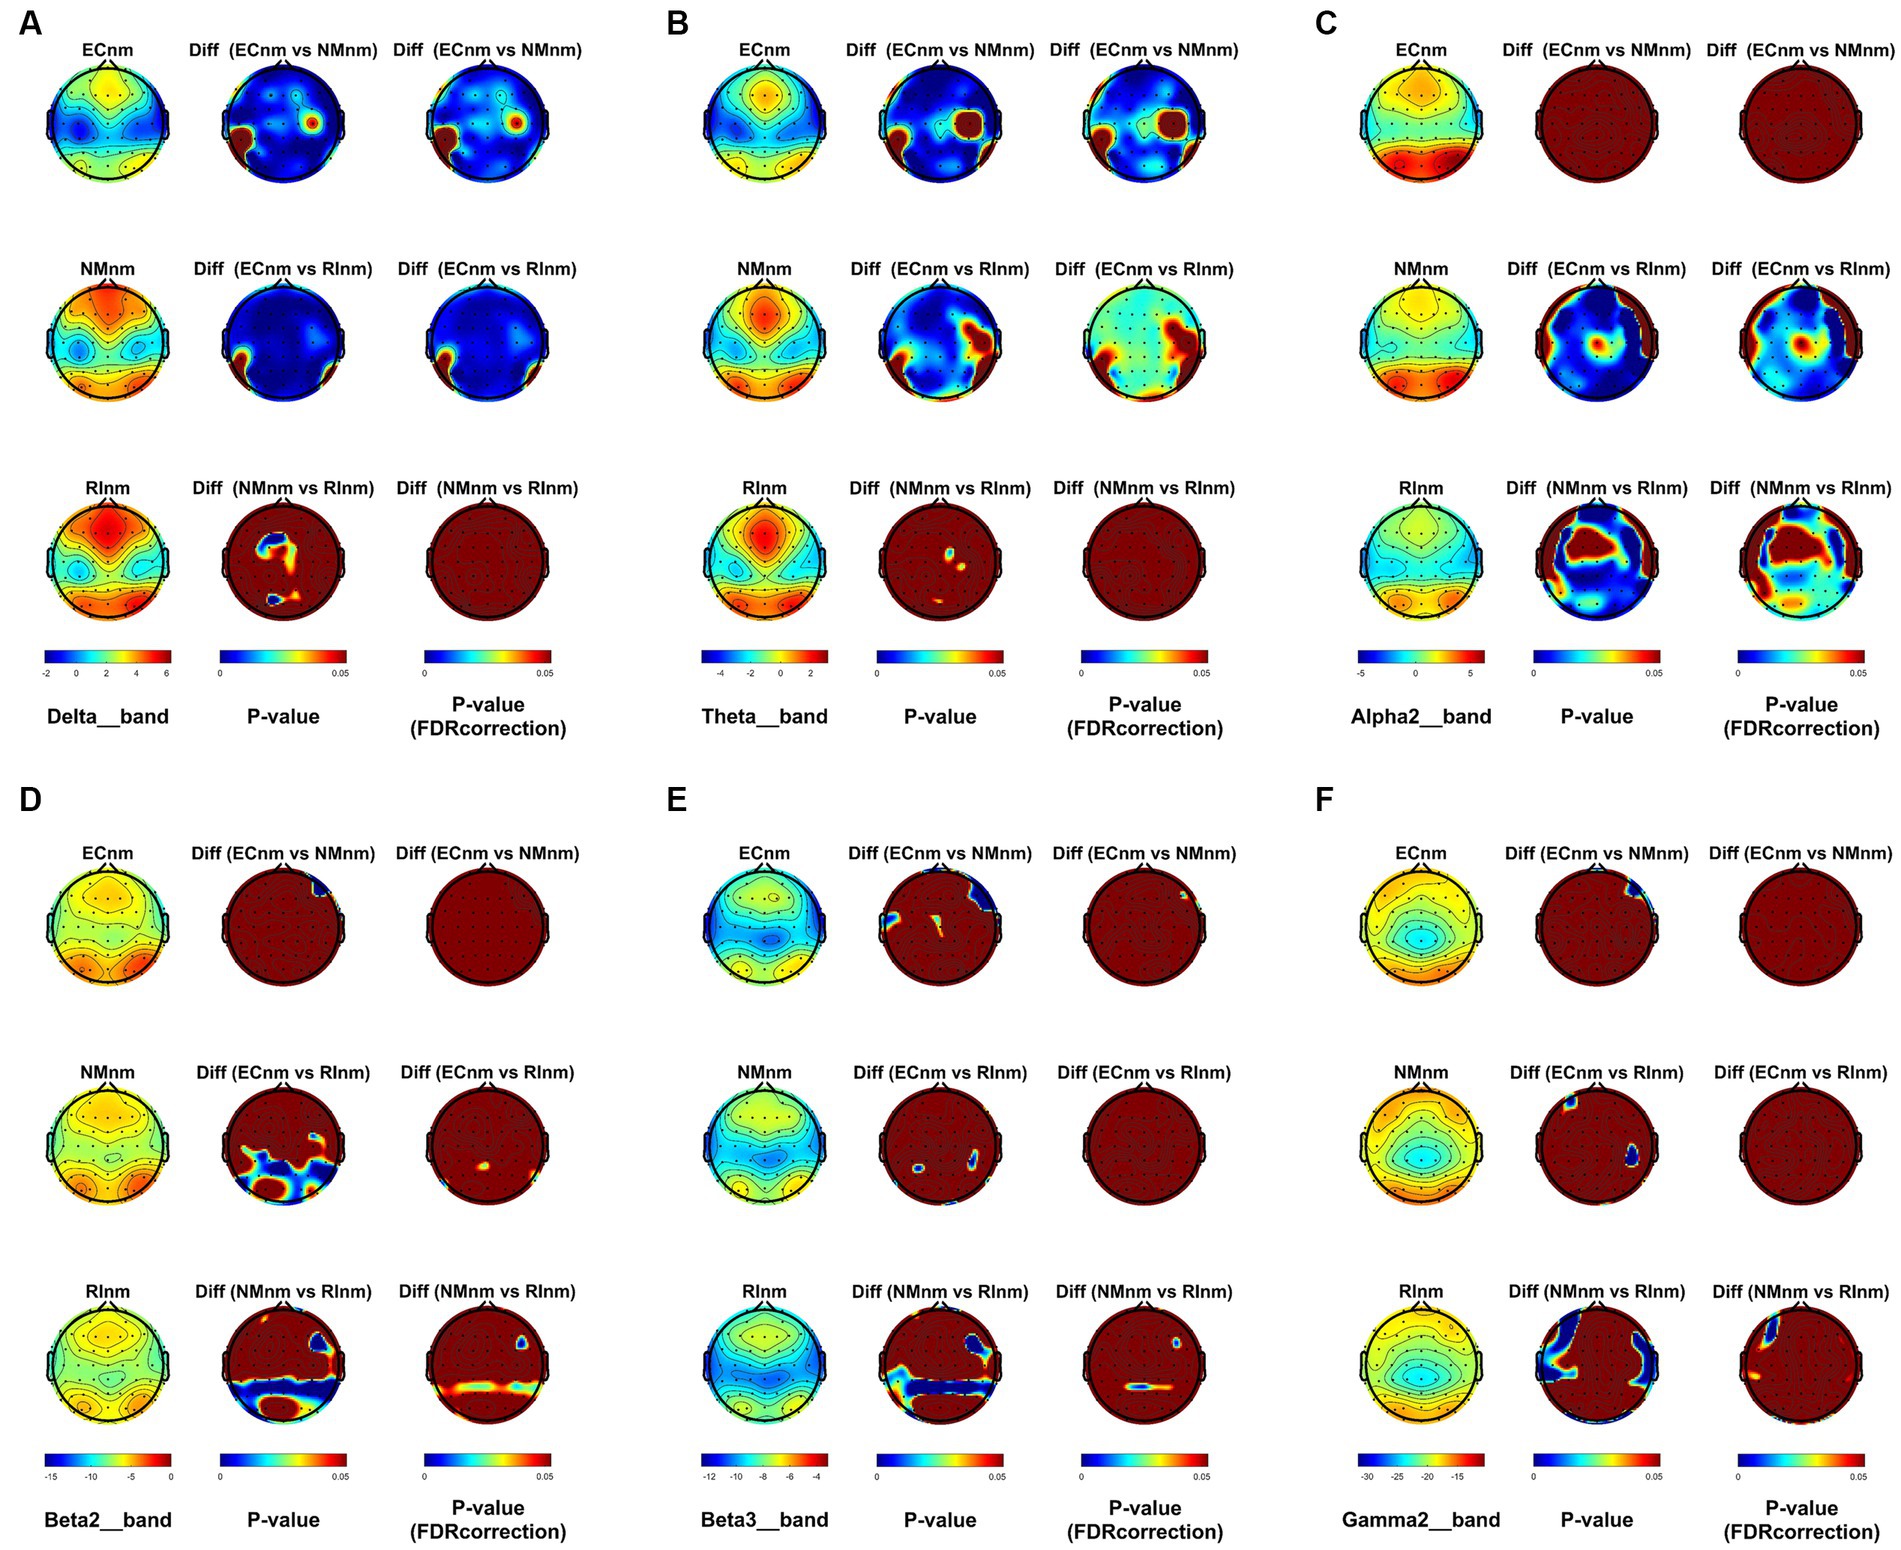
Figure 6. Scalp topographies of spectral analysis in TMNMT group. (A–F) Comparison of ECnm, NMnm, RInm of delta (A), theta (B), alpha2 (C), beta2 (D), beta3 (E), and gamma2 (F) bands. The first column showed the PSD across the whole brain within each subgroup, the second and third column showed the uncorrected p values and corrected p values for multiple comparisons of a false discovery rate (FDR) across the whole brain within each two subgroups, respectively. ECnm, EEG recordings with eyes closed stimuli-pre by TMNMT music; NMnm, EEG recordings with eyes closed stimuli-ing by TMNMT music; RInm, EEG recordings with eyes closed stimuli-post by TMNMT music.
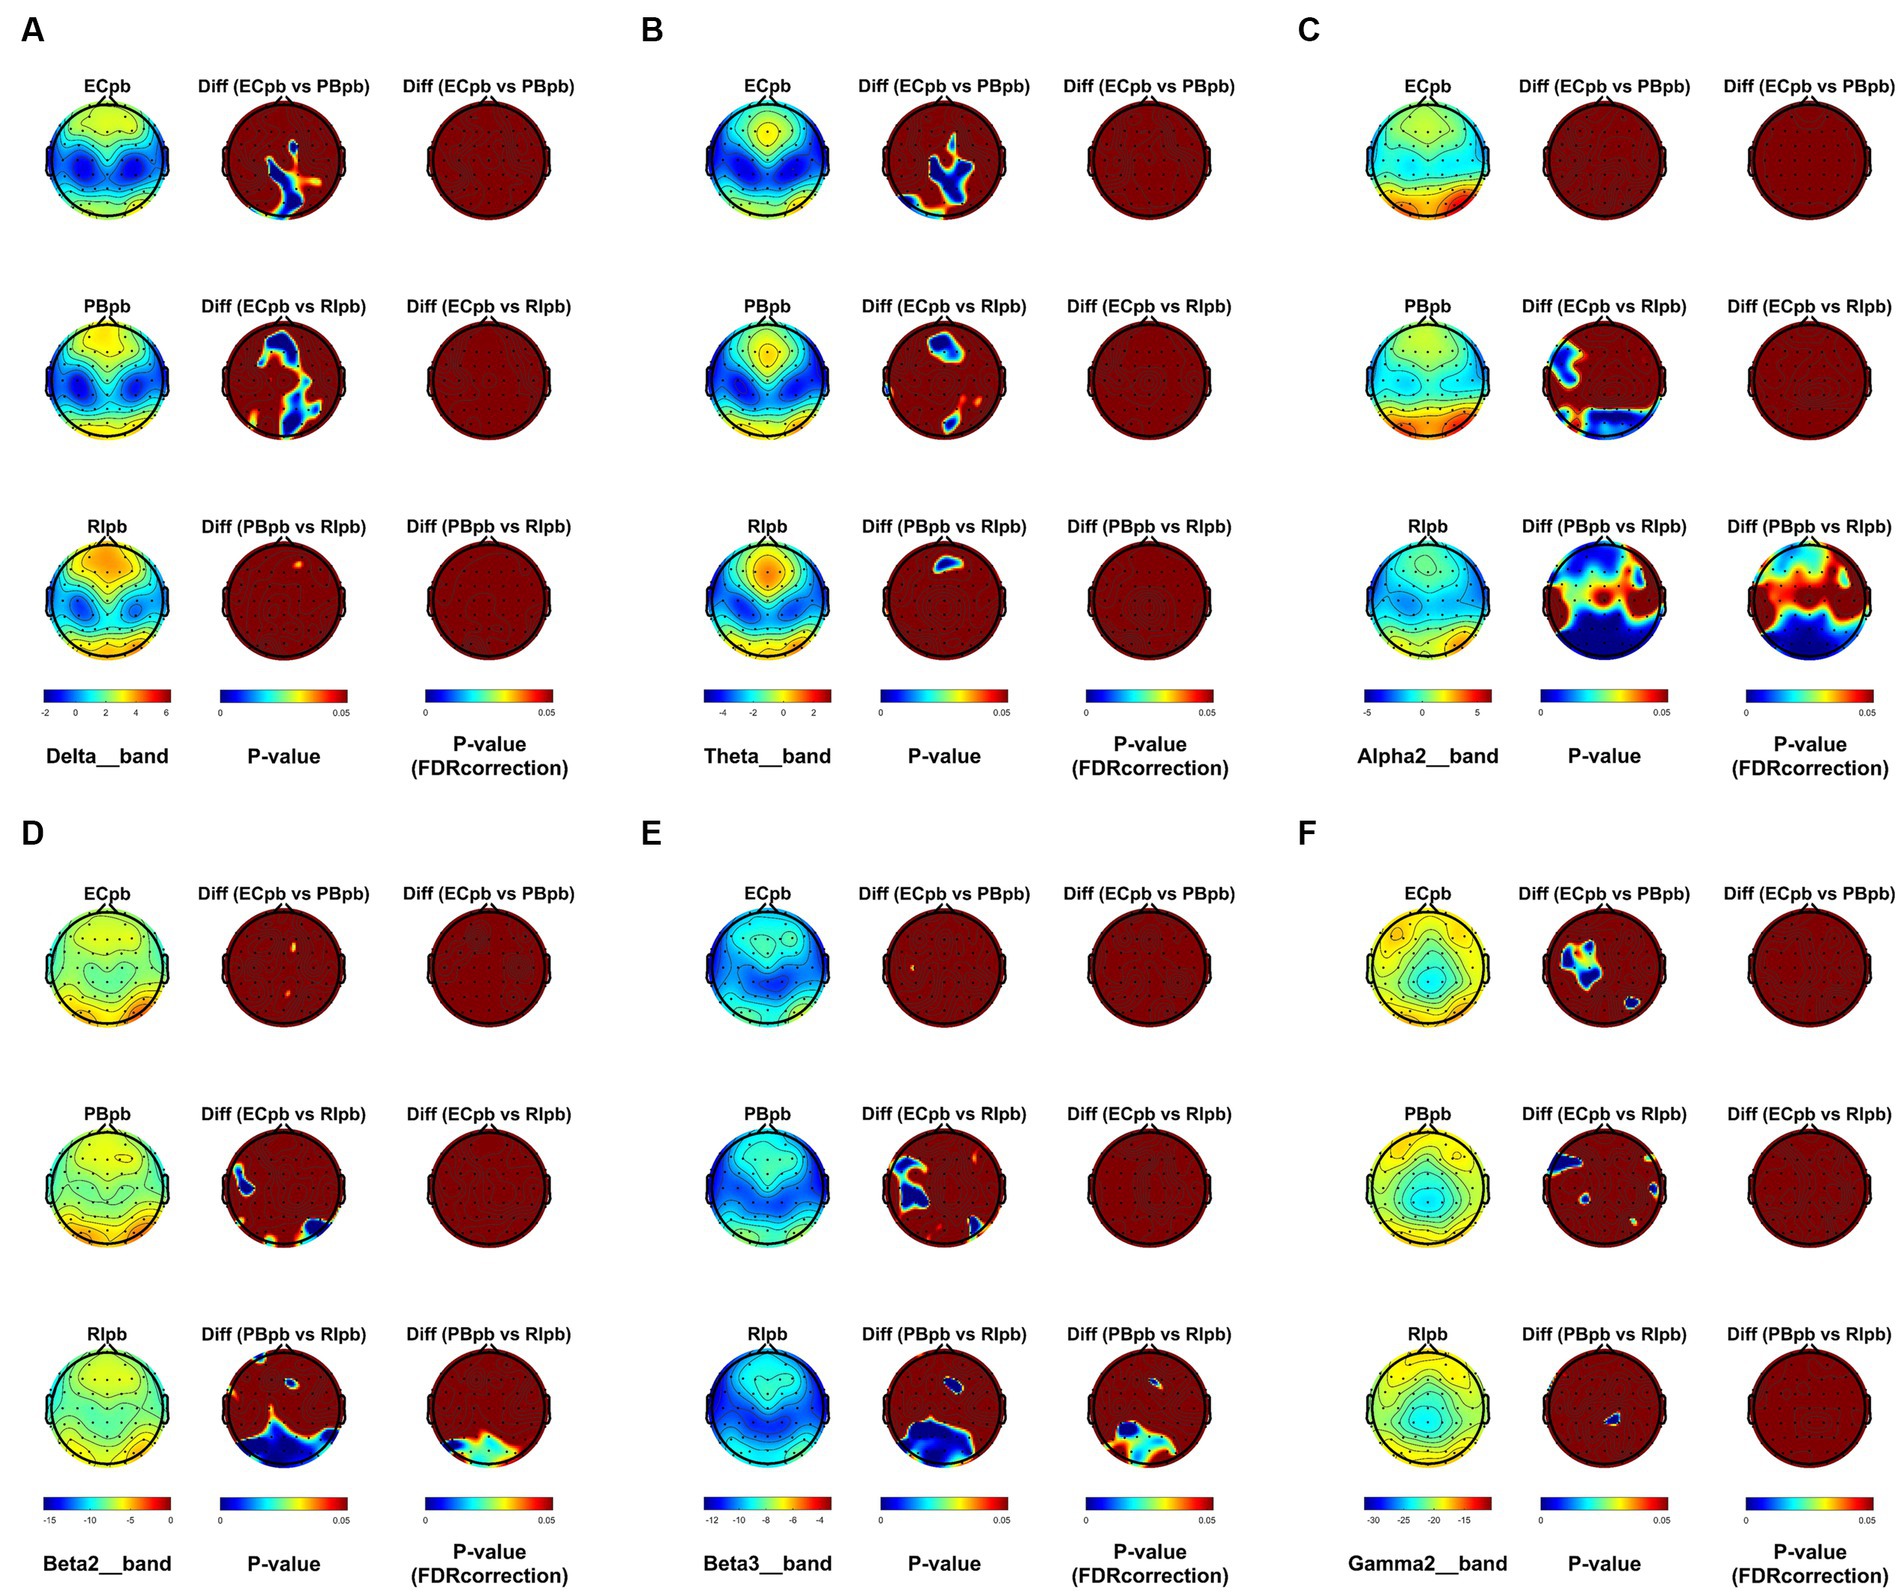
Figure 7. Scalp topographies of spectral analysis in Placebo group. (A–F) Comparison of ECpb, PBpb, RIpb of delta (A), theta (B), alpha2 (C), beta2 (D), beta3 (E), and gamma2 (F) bands. The first column showed the PSD across the whole brain within each subgroup, the second and third column showed the uncorrected p values and corrected p values for multiple comparisons of a false discovery rate (FDR) across the whole brain within each two subgroups, respectively. ECpb, EEG recordings with eyes closed stimuli-pre by Placebo music; PBpb, EEG recordings with eyes closed stimuli-ing by Placebo music; RIpb, EEG recordings with eyes closed stimuli-post by Placebo music.
Microstate analysis revealed that global clustering in TMNMT group (ECnm, NMnm, RInm subgroups) and Placebo group (ECpb, PBpb, RIpb subgroups) generated four microstates, that labeled Microstate A to D. In all groups, the four topographies of microstate classes A, B, C, and D were in accordance with those in previous reports (Lehmann et al., 1998; Custo et al., 2017; Michel and Koenig, 2018; Musaeus et al., 2019; Tait et al., 2020). Scalp topographies exhibited a left posterior-right anterior orientation (Microstate A), a right posterior -left anterior orientation (Microstate B), an anterior–posterior orientation (Microstate C), and a fronto-central maximum (Microstate D), respectively (Figure 8A). Moreover, the topography of microstate class C of ECpb, PBpb and RIpb subgroups was similar to that reported by Qin et al. (2022) and Bréchet et al. (2019), that exhibited in the left middle frontal gyrus, the dorsal part of anterior cingulate and cuneus extending to the posterior cingulate cortex, and thalamus (Custo et al., 2017) (Figure 8B).
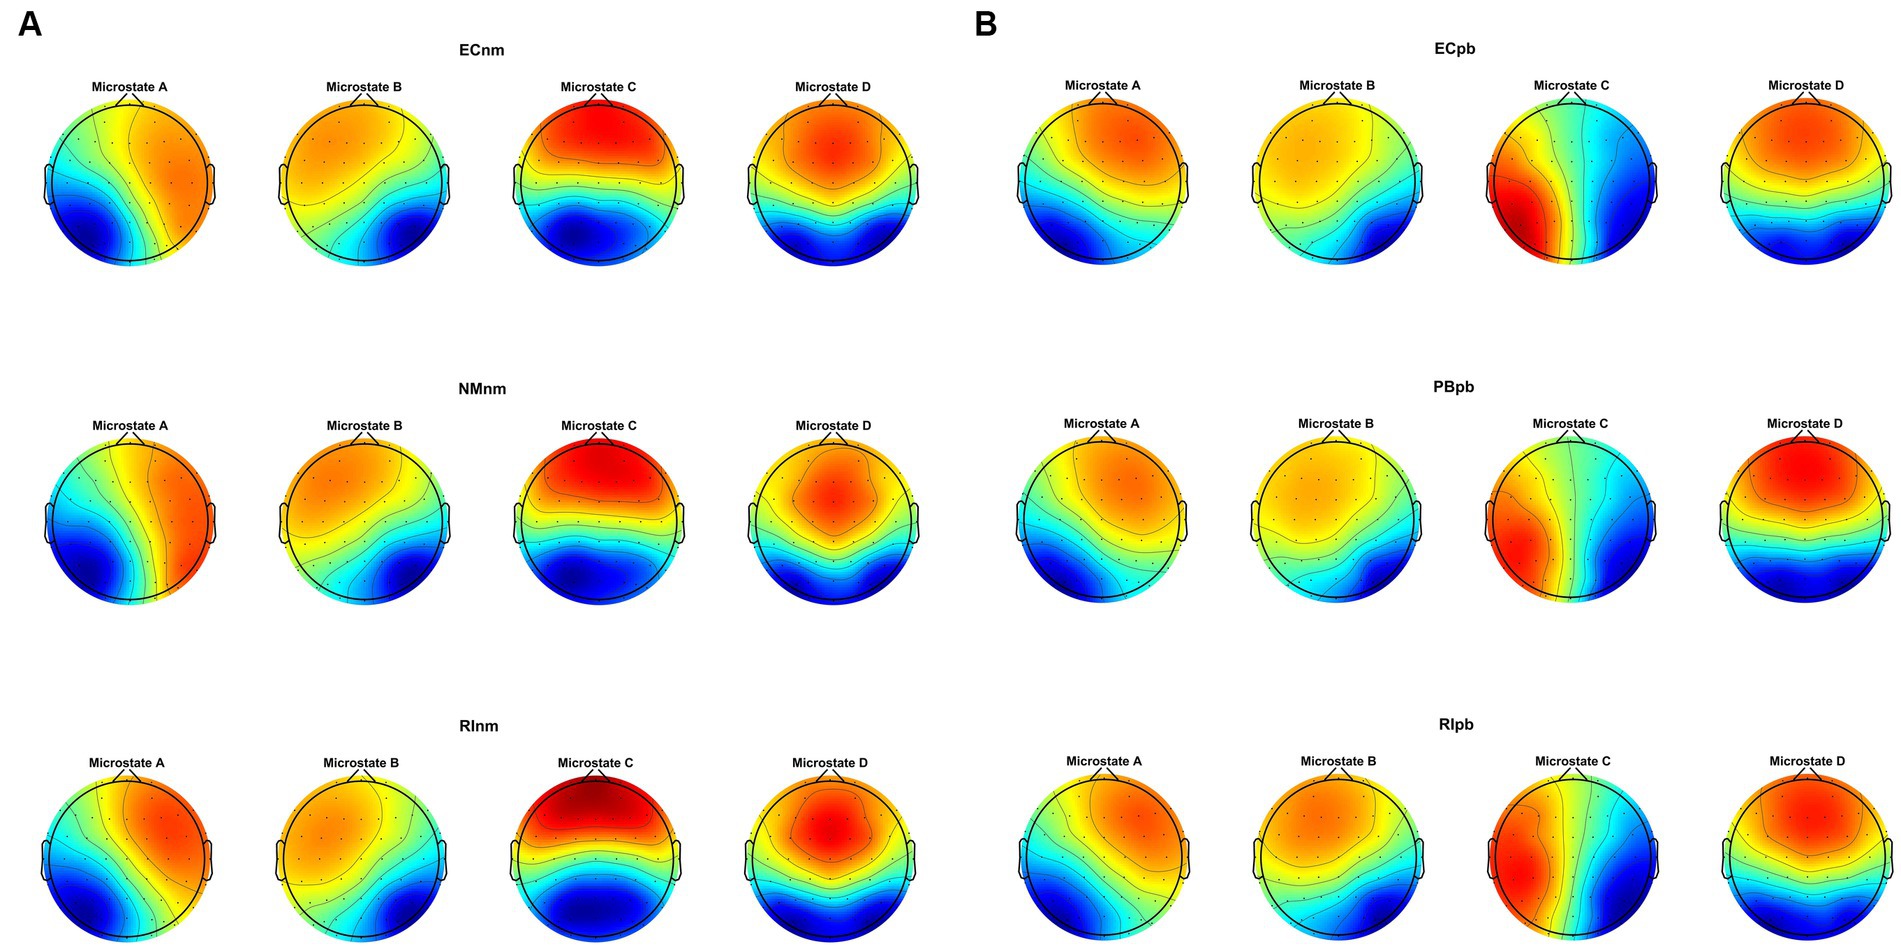
Figure 8. The spatial configuration of the four microstate topographies, separately for (A) TMNMT group and (B) Placebo group. Each row showed the three subgroups of TMNMT group and Placebo group. Each column showed the four topographic configurations (microstate A, B, C, D) for each subgroup. ECnm, EEG recordings with eyes closed stimuli-pre by TMNMT music; NMnm, EEG recordings with eyes closed stimuli-ing by TMNMT music; RInm, EEG recordings with eyes closed stimuli-post by TMNMT music; ECpb, EEG recordings with eyes closed stimuli-pre by Placebo music; PBpb, EEG recordings with eyes closed stimuli-ing by Placebo music; RIpb, EEG recordings with eyes closed stimuli-post by Placebo music.
Repeated measures ANOVA was conducted to compare the duration, occurrence, coverage and transition possibility of the four microstates between TMNMT group and Placebo group. Microstate classes A, B, C and D were regarded as a within-subject factor and group as a between-subject factor.
In TMNMT group, the results of microstate duration showed that the Microstate ∗ Group interaction effect (F = 2.192; p = 0.0461) and the main effect of group factor (F = 6.311; p = 0.00072) were significant, while the main effect of microstate factor was not significant (F = 2.298; p = 0.0834). Post-hoc comparisons showed microstate B of RInm subgroup had a shorter duration compared to ECnm subgroup (p = 0.0208), microstate C of RInm subgroup had a shorter duration compared to NMnm subgroup (p = 0.0041) (Table 4 and Figure 9A).
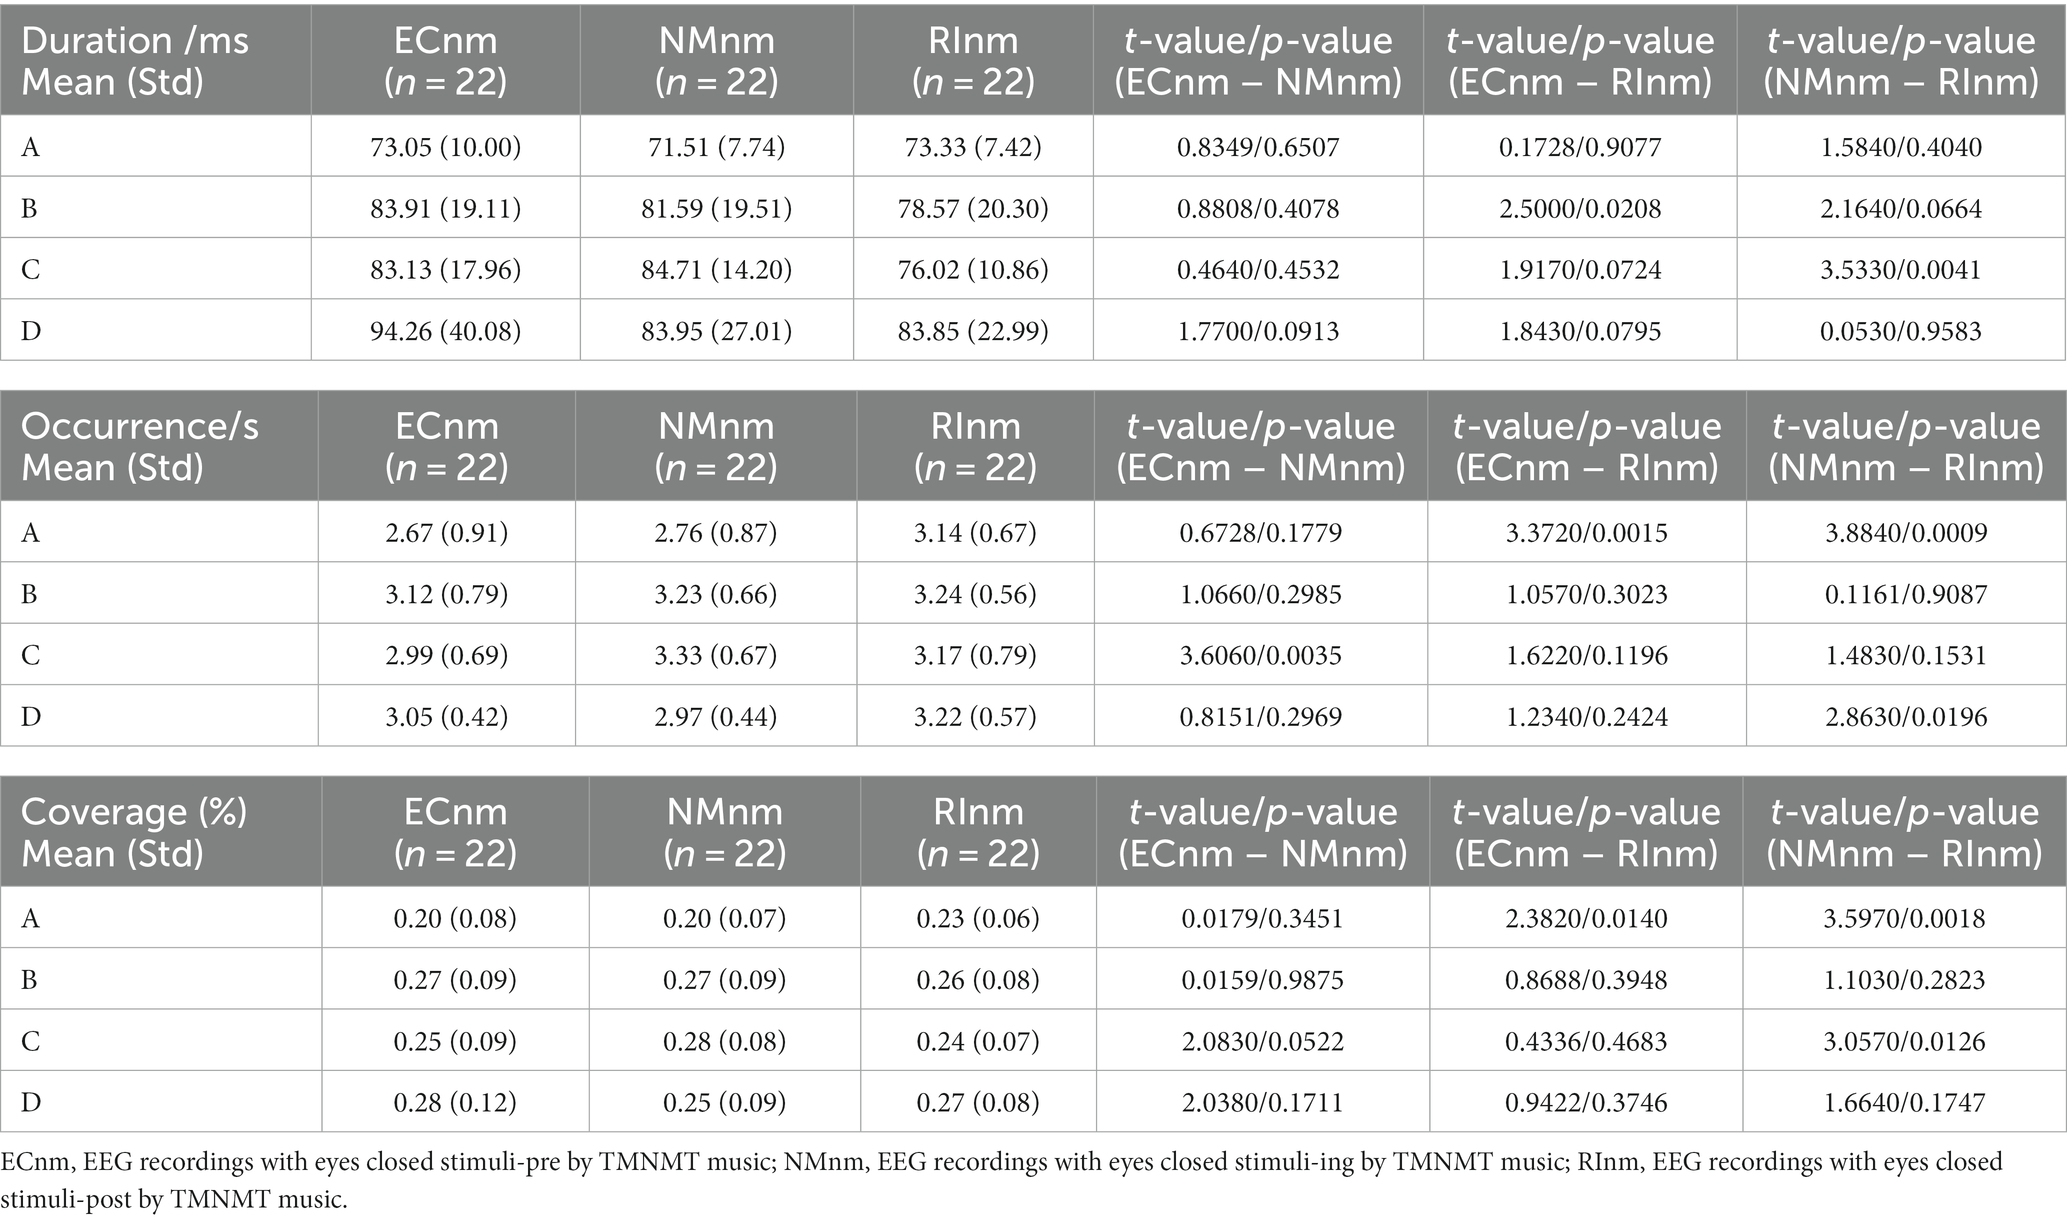
Table 4. The duration, occurrence, coverage of microstate (A–D) in TMNMT group (ECnm, NMnm, RInm).
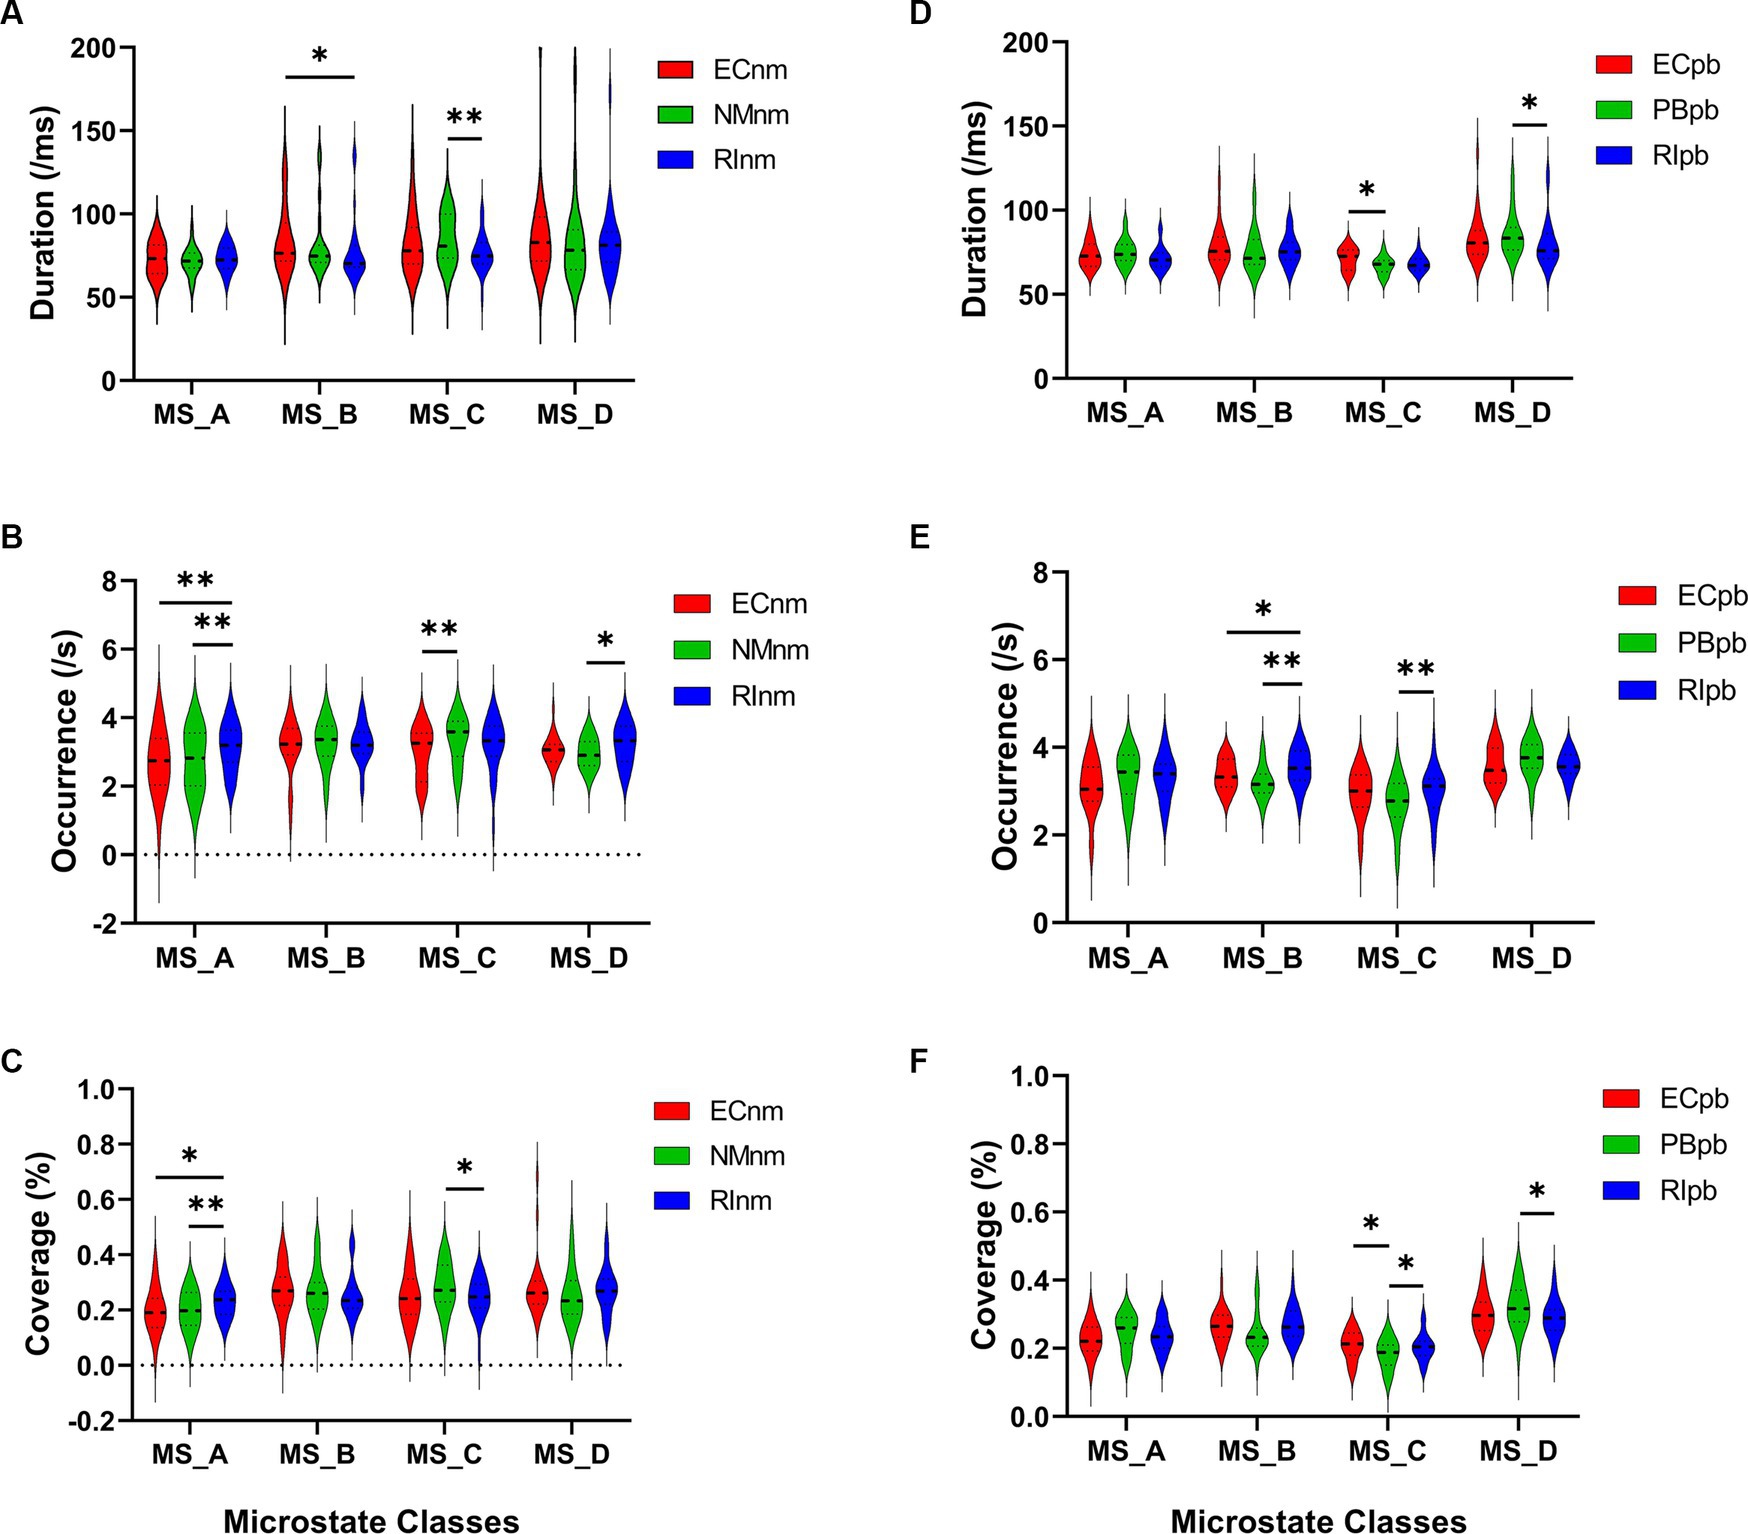
Figure 9. Microstate analysis of temporal metrics results: duration, occurrence, and coverage. Violin plots show each microstate class in the three subgroups of TMNMT and Placebo groups. (A) Microstate B of RInm had a shorter duration compared to ECnm, microstate C of RInm had a shorter duration compared to NMnm. (B) Microstate A of RInm had a higher occurrence compared to ECnm and NMnm, microstate C of NMnm had a higher occurrence compared to ECnm, and microstate D of RInm had a higher occurrence compared to NMnm. (C) microstate A of RInm had a higher coverage compared to ECnm and NMnm, microstate C of RInm had a lower coverage compared to NMnm. (D) Microstate C of PBpb had a shorter duration compared to ECpb, and microstate D of RIpb had a shorter duration compared to PBpb. (E) Microstate B of RIpb had a higher occurrence compared to ECpb and PBpb, microstate C of RIpb had a higher occurrence compared to PBpb. (F) Microstate C of PBpb had a lower coverage compared to ECpb and RIpb had a higher coverage compared to PBpb, microstate D of RIpb had a lower coverage compared to PBpb. ECnm, EEG recordings with eyes closed stimuli-pre by TMNMT music; NMnm, EEG recordings with eyes closed stimuli-ing by TMNMT music; RInm, EEG recordings with eyes closed stimuli-post by TMNMT music; ECpb, EEG recordings with eyes closed stimuli-pre by Placebo music; PBpb, EEG recordings with eyes closed stimuli-ing by Placebo music; RIpb, EEG recordings with eyes closed stimuli-post by Placebo music. *p < 0.05, **p < 0.01.
The results of microstate occurrence showed that the Microstate ∗ Group interaction effect (F = 3.171; p = 0.0057) and the main effect of group factor (F = 8.912; p = 0.0003) were significant, while the main effect of microstate factor was not significant (F = 1.28; p = 0.2866). Post-hoc comparisons showed microstate A of RInm subgroup had a higher occurrence compared to ECnm subgroup (p = 0.0015) and NMnm subgroup (p = 0.0009), microstate C of NMnm subgroup had a higher occurrence compared to ECnm subgroup (p = 0.0035), microstate D of RInm subgroup had a higher occurrence compared to NMnm subgroup (p = 0.0196) (Table 4 and Figure 9B).
For the coverage of microstate, the Microstate ∗ Group interaction effect (F = 4.219; p = 0.0006) and the main effect of microstate factor (F = 2.744; p = 0.0481) were significant, while the main effect of group factor was not significant (F = 0; p = 1). Post-hoc comparisons showed microstate A of RInm subgroup had a higher coverage compared to ECnm subgroup (p = 0.014) and NMnm subgroup (p = 0.0018), microstate C of RInm subgroup had a lower coverage compared to NMnm subgroup (p = 0.0126) (Table 4 and Figure 9C).
In terms of transition probabilities, we compared ECnm subgroup with RInm subgroup. The Microstate ∗ Group interaction effect (F = 4.31; p < 0.0001) and the main effect of microstate factor (F = 3.216; p = 0.0004) were significant, while the main effect of group factor was not significant (F = 0; p = 1). Post-hoc comparisons showed there were a lower possibility of transition from “D to B” in RInm subgroup compared to ECnm subgroup (p = 0.0344), a higher possibility of transition from “A to B” (p = 0.0452), “A to D” (p = 0.0054) and “D to A” (p = 0.0404) in RInm subgroup compared to ECnm subgroup (Table 6 and Figure 10A).
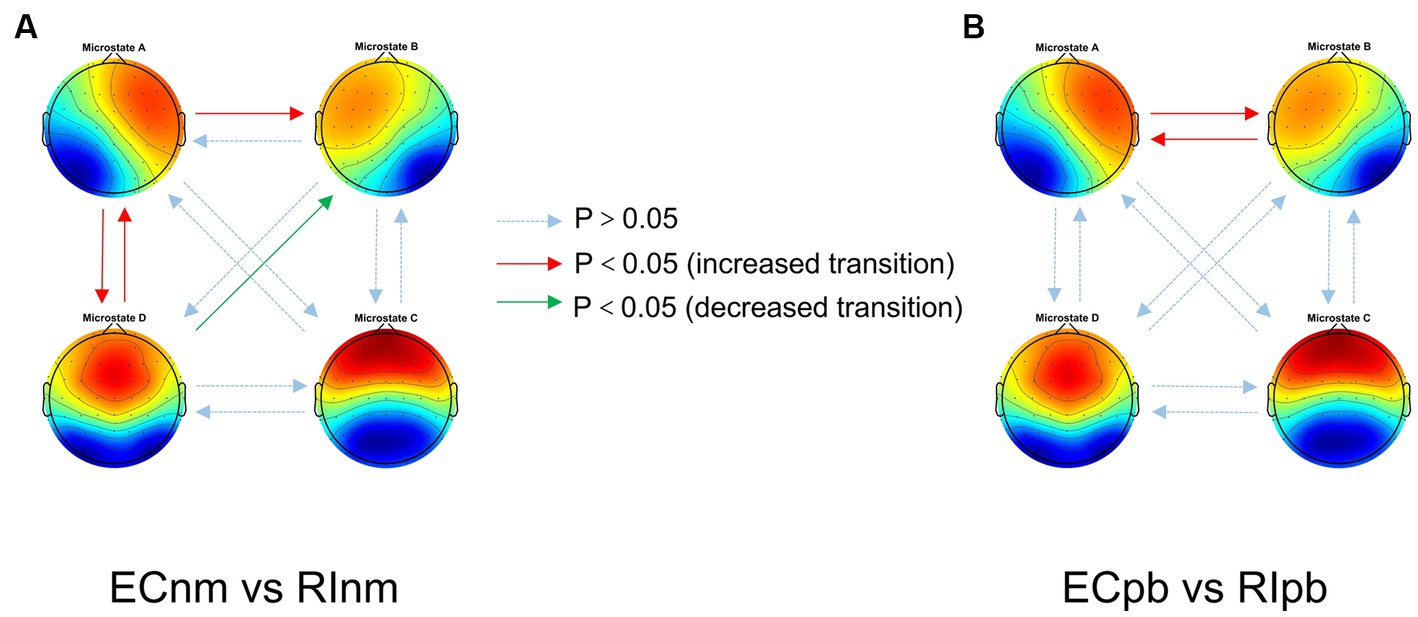
Figure 10. Schematic view of microstate syntax analysis results. A significant difference in transition probabilities for each pair of microstate class between ECnm subgroup and RInm subgroup (A), ECpb subgroup and RIpb subgroup (B). ECnm, EEG recordings with eyes closed stimuli-pre by TMNMT music; RInm, EEG recordings with eyes closed stimuli-post by TMNMT music; ECpb, EEG recordings with eyes closed stimuli-pre by Placebo music; RIpb, EEG recordings with eyes closed stimuli-post by Placebo music.
In Placebo group, the results of microstate duration showed that the Microstate ∗ Group interaction effect was not significant (F = 1.765; p = 0.1090), and the main effect of microstate factor (F = 10.40; p < 0.0001) and group factor (F = 4.003; p = 0.0245) were significant. Post-hoc comparisons showed microstate C of PBpb subgroup had a shorter duration compared to ECpb subgroup (p = 0.0093), microstate D of RIpb subgroup had a shorter duration compared to PBpb subgroup (p = 0.0169) (Table 5 and Figure 9D).
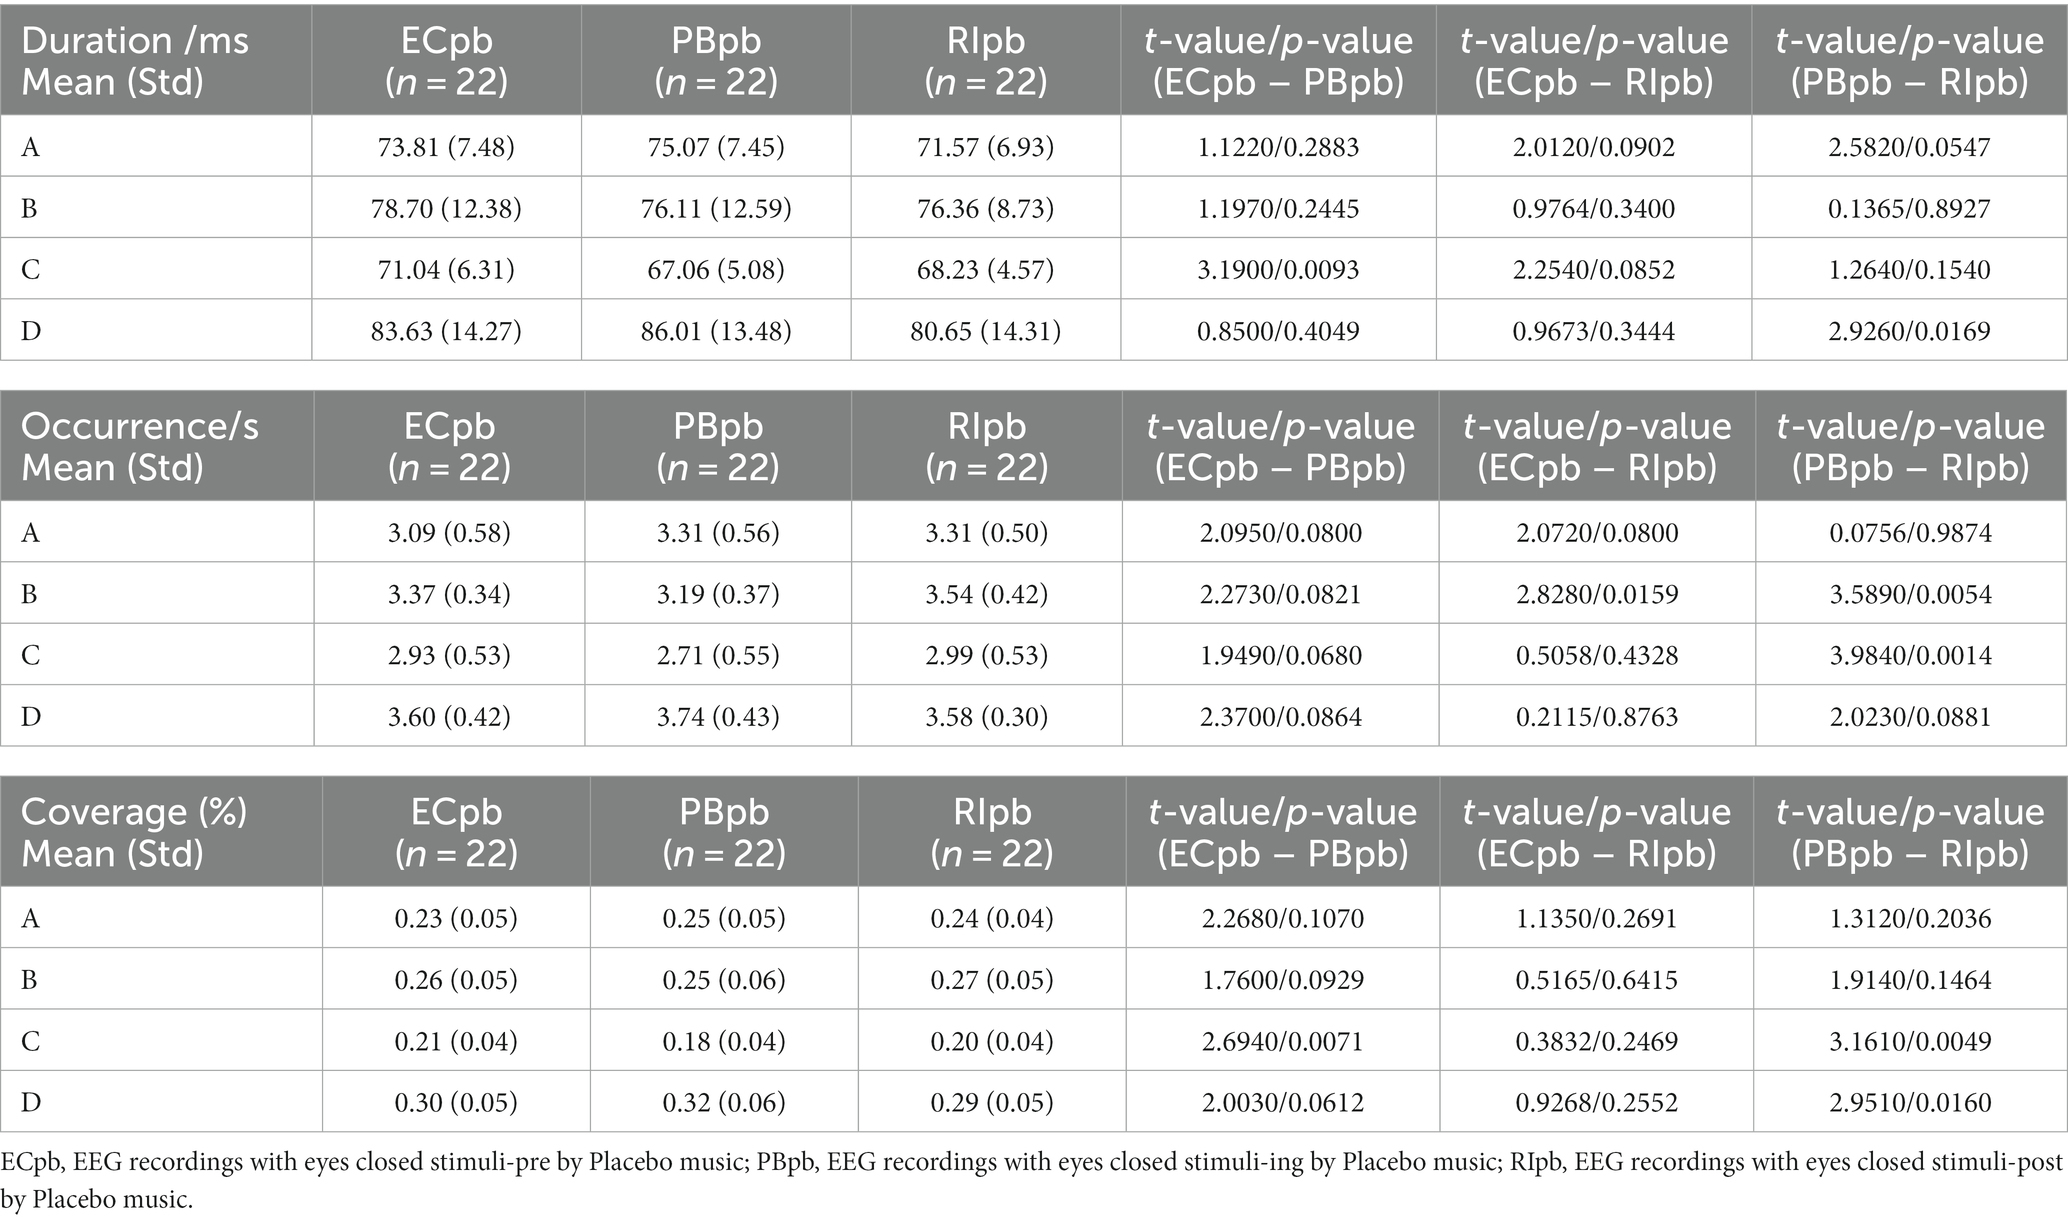
Table 5. The duration, occurrence, coverage of microstate (A–D) in Placebo group (ECpb, PBpb, RIpb).
The results of microstate occurrence showed that the Microstate ∗ Group interaction effect (F = 4.853; p = 0.0001), the main effect of microstate factor (F = 13.03, p < 0.0001) and the main effect of group factor (F = 4.055; p = 0.0199) were significant. Post-hoc comparisons showed microstate B of RIpb subgroup had a higher occurrence compared to ECpb subgroup (p = 0.0159) and PBpb subgroup (p = 0.0054), microstate C of RIpb subgroup had a higher occurrence compared to PBpb subgroup (p = 0.0014) (Table 5 and Figure 9E).
For the coverage of microstate, the Microstate ∗ Group interaction effect (F = 4.811; p = 0.0001) and the main effect of microstate factor (F = 24.27; p < 0.0001) were significant, while the main effect of group factor was not significant (F = 0; p = 1). Post-hoc comparisons showed microstate C of PBpb subgroup had a lower coverage compared to ECpb subgroup (p = 0.0071) and RIpb subgroup had a higher coverage compared to PBpb subgroup (p = 0.0049), microstate D of RIpb subgroup had a lower coverage compared to PBpb subgroup (p = 0.0160) (Table 5 and Figure 9F).
In terms of transition probabilities, we compared ECpb subgroup with RIpb subgroup. The Microstate ∗ Group interaction effect (F = 4.812; p < 0.0001) and the main effect of microstate factor (F = 24.31; p < 0.0001) were significant, while the main effect of group factor was not significant (F = 0; p = 1). Post-hoc comparisons showed there were a higher possibility of transition from “A to B” (p = 0.0026) and “B to A” (p = 0.0061) in RIpb subgroup compared to ECpb subgroup (Table 6 and Figure 10B).
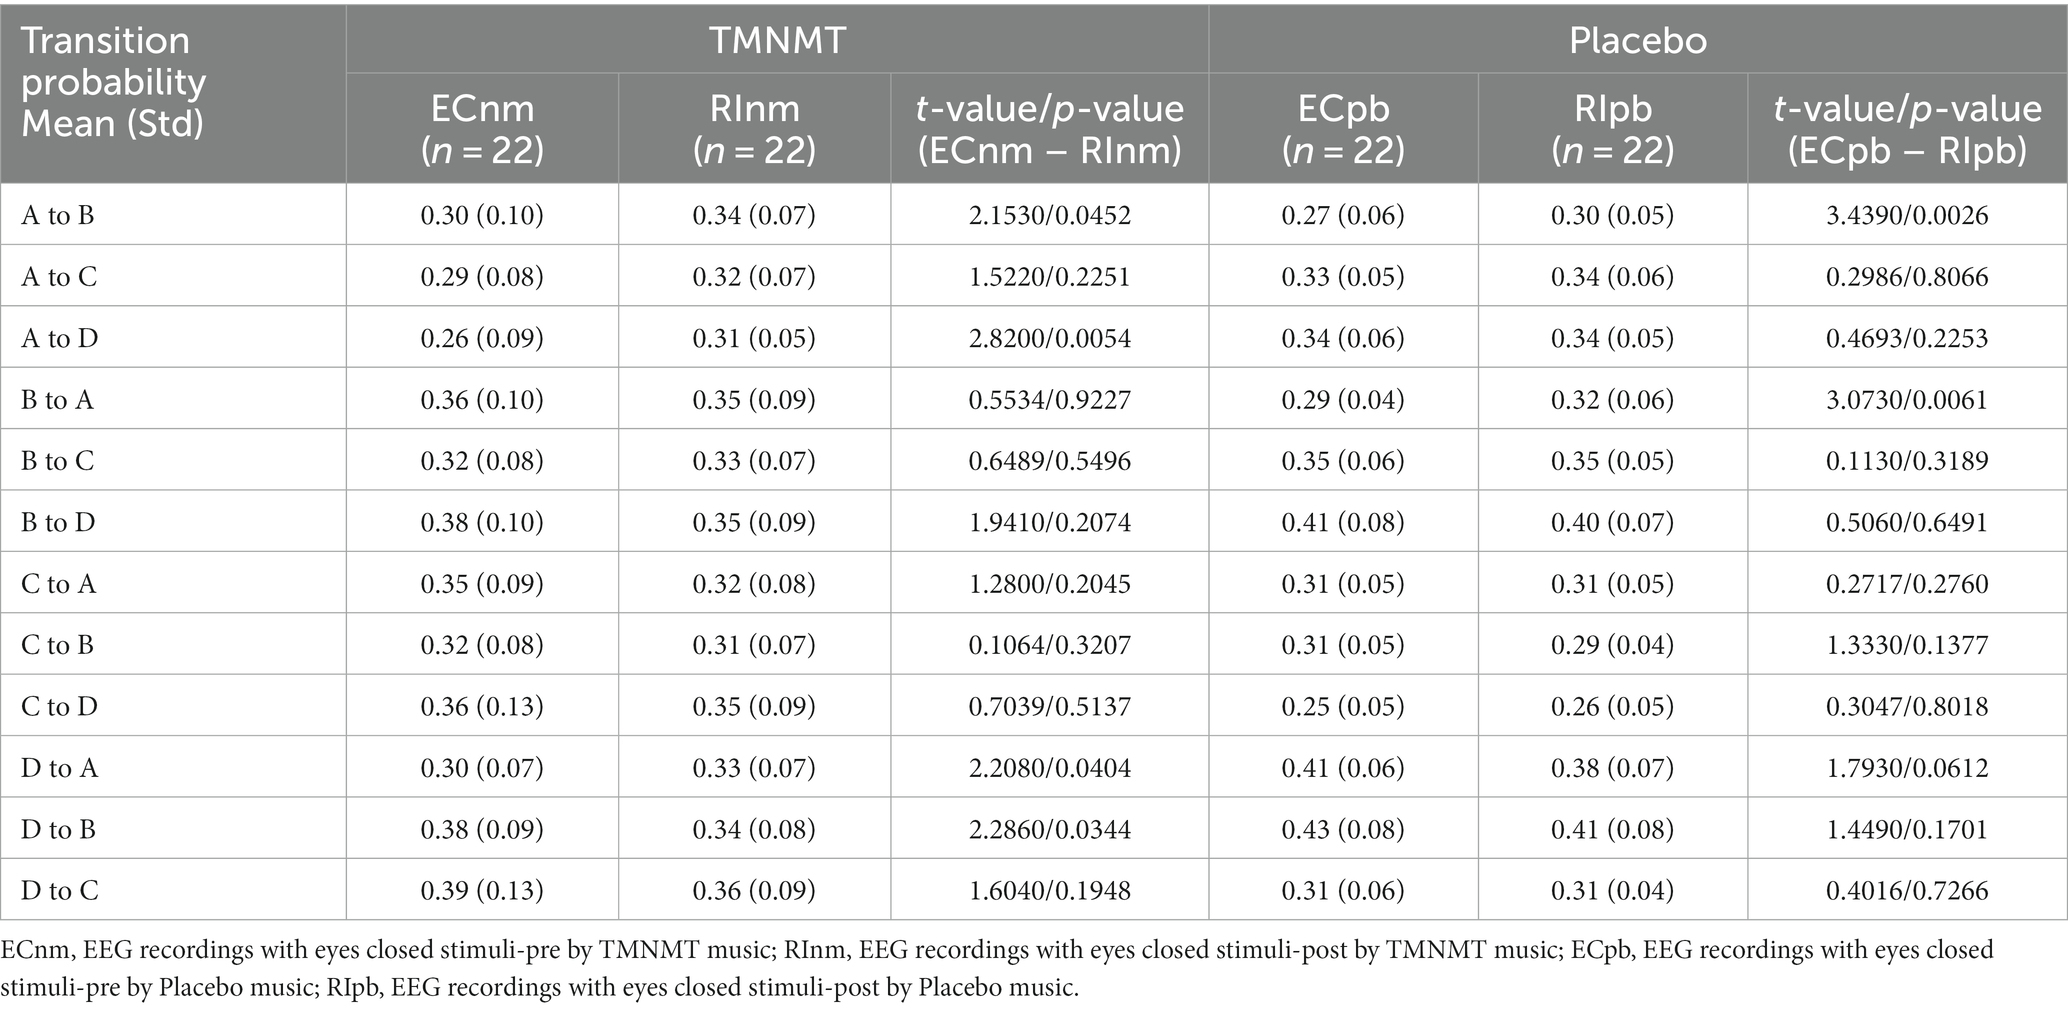
Table 6. Transition probabilities from one microstate class to all other classes in TMNMT and Placebo groups.
All of the above value of ps effect had been corrected for multiple comparisons of FDR.
We performed the Pearson correlation between microstate metrics and TFI score. The results revealed a significant positive correlation between the duration of microstate B and TFI score in ECnm subgroup (r = 0.4233, p = 0.0497), NMnm subgroup (r = 0.4474, p = 0.0368), RInm subgroup (r = 0.5354, p = 0.0102), ECpb subgroup (r = 0.4272, p = 0.0474), PBpb subgroup (r = 0.5359, p = 0.0101), and there was a positive correlation between the duration of microstate B and TFI score in RIpb subgroup, although it was not significant (r = 0.3916, p = 0.0715) (Figure 11). All of the above value of ps effect had been corrected for multiple comparisons of FDR.
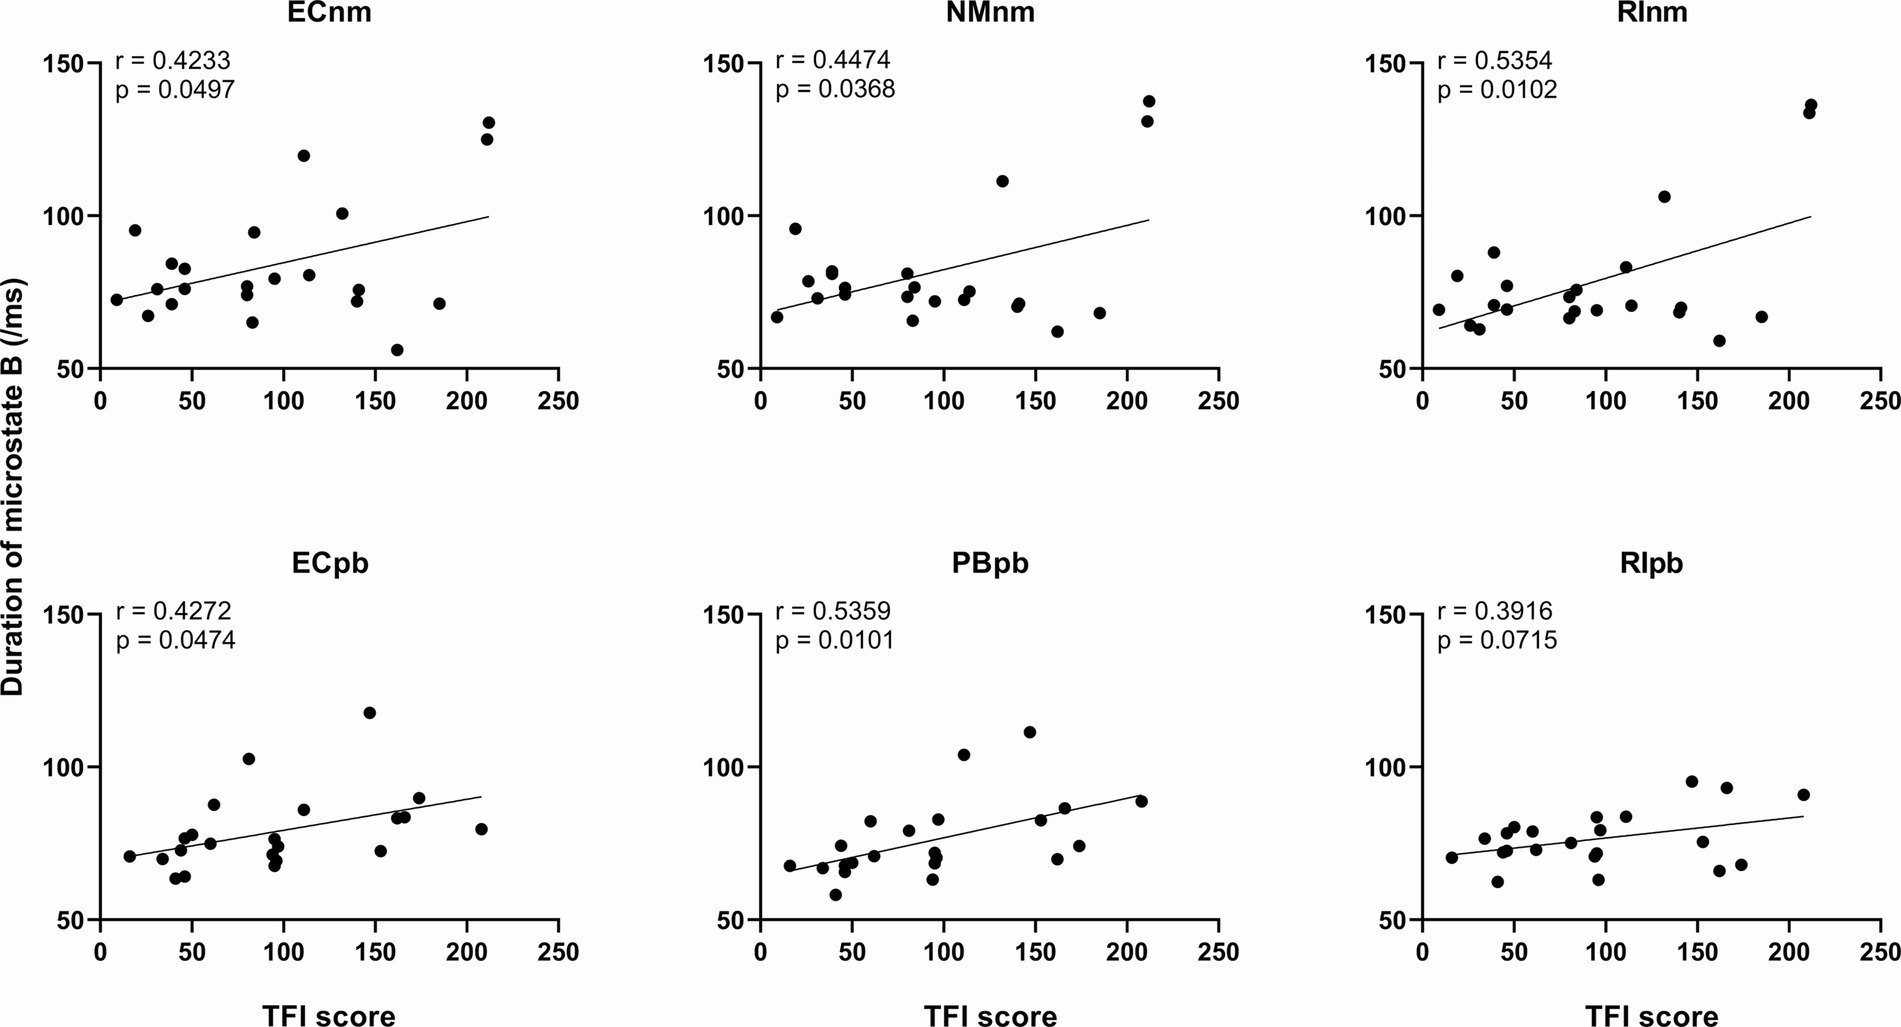
Figure 11. Correlation between the duration of microstate B and each subgroup. ECnm, EEG recordings with eyes closed stimuli-pre by TMNMT music; NMnm, EEG recordings with eyes closed stimuli-ing by TMNMT music; RInm, EEG recordings with eyes closed stimuli-post by TMNMT music; ECpb, EEG recordings with eyes closed stimuli-pre by Placebo music; PBpb, EEG recordings with eyes closed stimuli-ing by Placebo music; RIpb, EEG recordings with eyes closed stimuli-post by Placebo music.
To our knowledge, the current study is the first to investigate the residual inhibition (RI) effect of the tailor-made notched music training (TMNMT), and analyze the power spectral density (PSD) and microstate classes using a resting-state EEG. We also included a placebo group as a control to ensure the credibility of the findings. To ensure the authenticity of the experiment and enhance the reliability of the study’s conclusions, we implemented rigorous criteria during the recruiting tinnitus subjects. Beyond meeting basic conditions, we specifically focused on the severity of tinnitus, preferring to enroll individuals experiencing severe tinnitus. For instance, in this study, the average THI and TFI scores for both groups exceeded 38 and 90, respectively (refer to Table 1). These thresholds, with a THI score of 38 and a TFI score of 50 generally considered as cutoff values indicative of tinnitus-related high distress, were chosen to obtain genuine and accurate data, thereby reinforcing the robustness of our study. These comprehensive approaches provided valuable insights into the effectiveness of TMNMT and enhances the novelty and significance of our research.
To mitigate potential interference from other factors affecting the results, such as baseline differences or confounding variables, we conducted a comparison of the power spectral density (PSD) between the ECnm and ECpb subgroups. Figure 12 showed the power spectral density (PSD) of delta (p = 0.6335), theta (p = 0.4946), alpha2 (p = 0.4073), beta2 (p = 0.3652), beta3 (p = 0.3517) and gamma2 bands (p = 0.6560) between the ECnm and ECpb subgroups. The results revealed there were no significant differences in the above frequency bands (Table 7 and Figure 12). From the scalp topographies, the PSD of delta, theta, alpha2, beta2, beta3 and gamma2 bands were not found significant differences between the ECnm and ECpb subgroups (Figure 13).
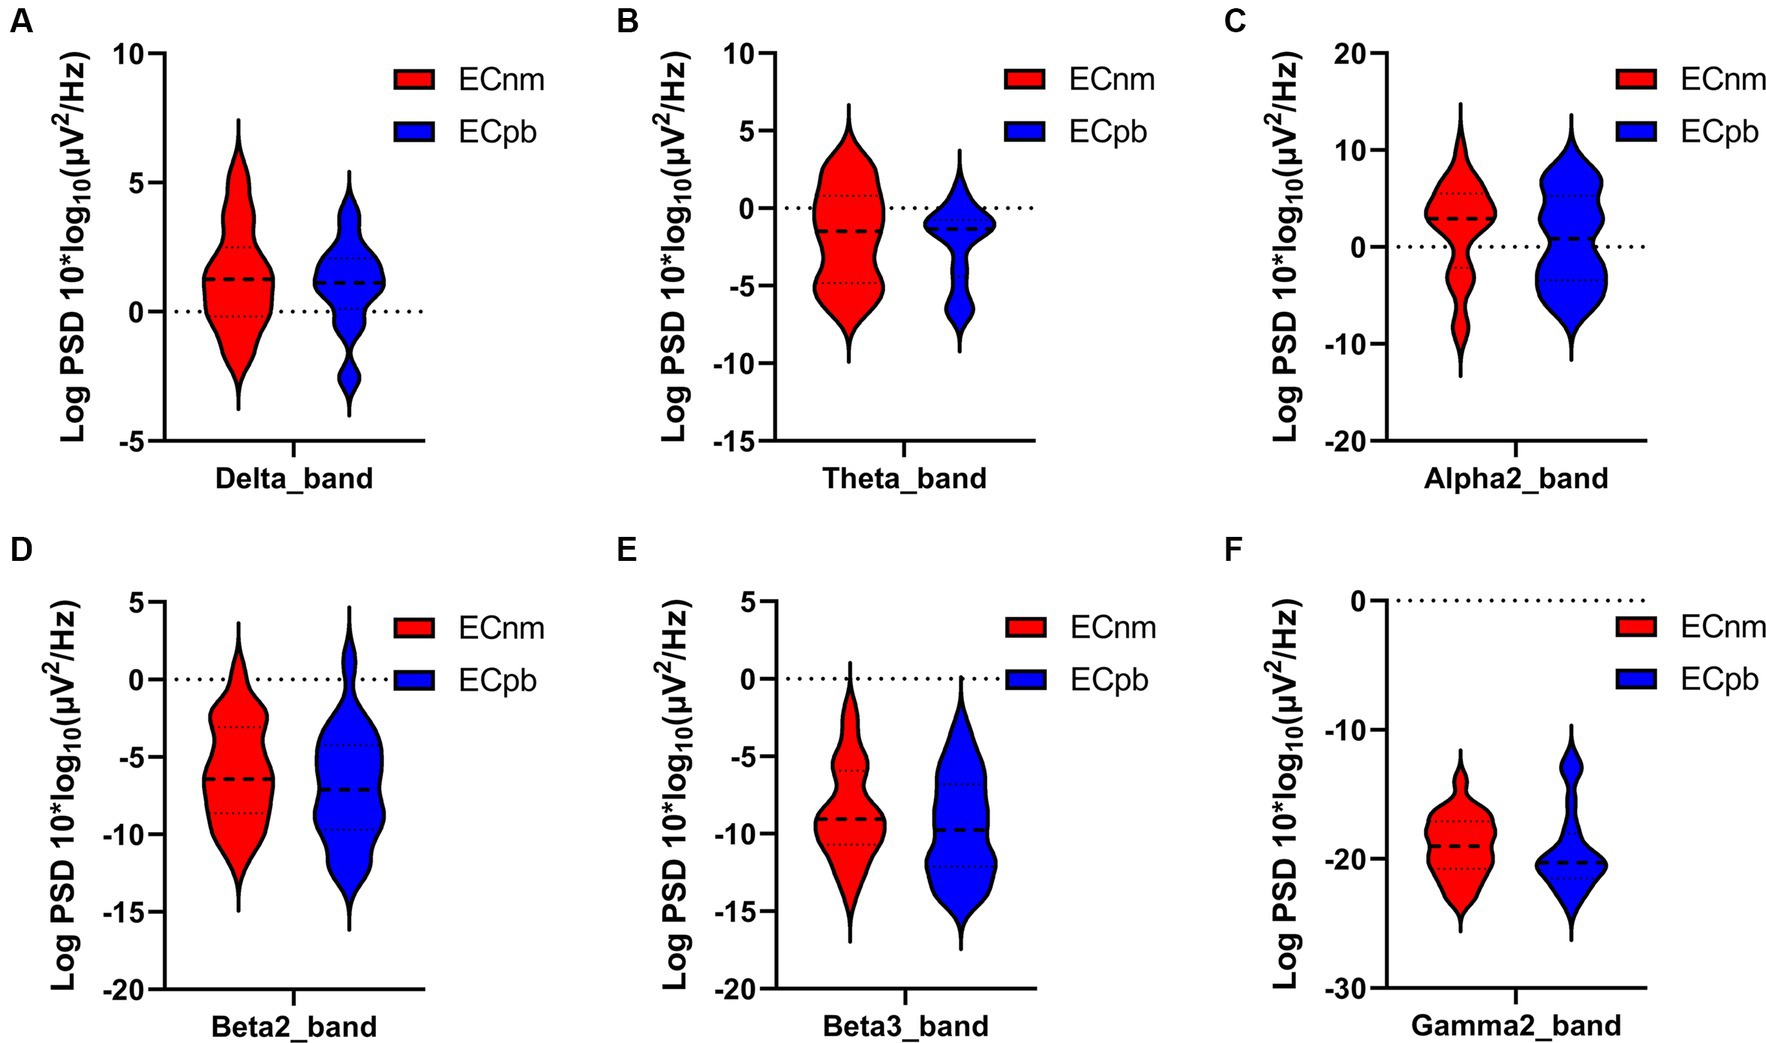
Figure 12. Waveforms of spectral analysis in ECnm vs. ECpb subgroups. (A–F) The PSD of delta (A), theta (B), alpha2 (C), beta2 (D), beta3 (E), gamma2 (F) bands in ECnm vs. ECpb subgroups. ECnm, EEG recordings with eyes closed stimuli-pre by TMNMT music; ECpb, EEG recordings with eyes closed stimuli-pre by Placebo music.
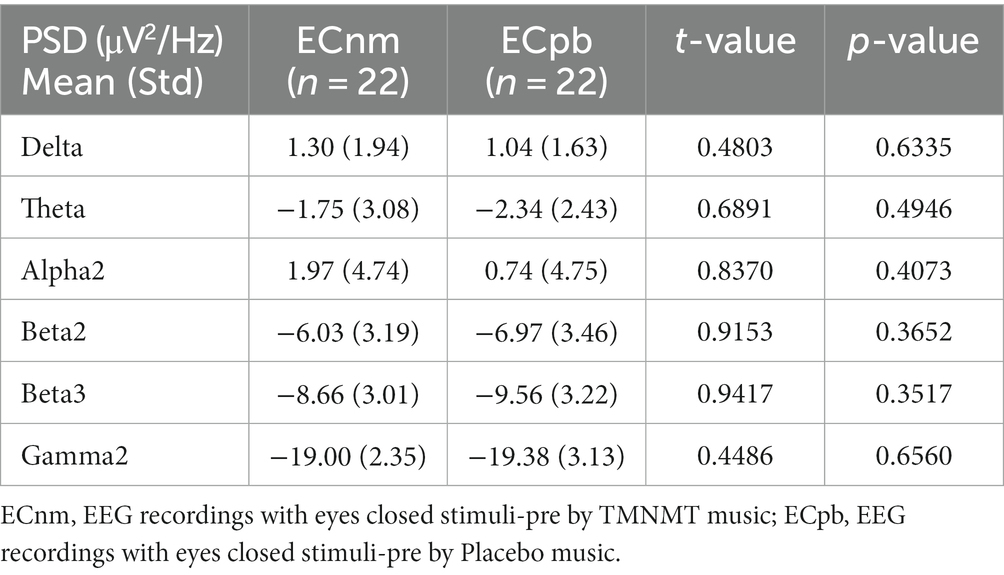
Table 7. The power spectral density (PSD) of whole-brain certain frequency bands in ECnm vs. ECpb subgroups.
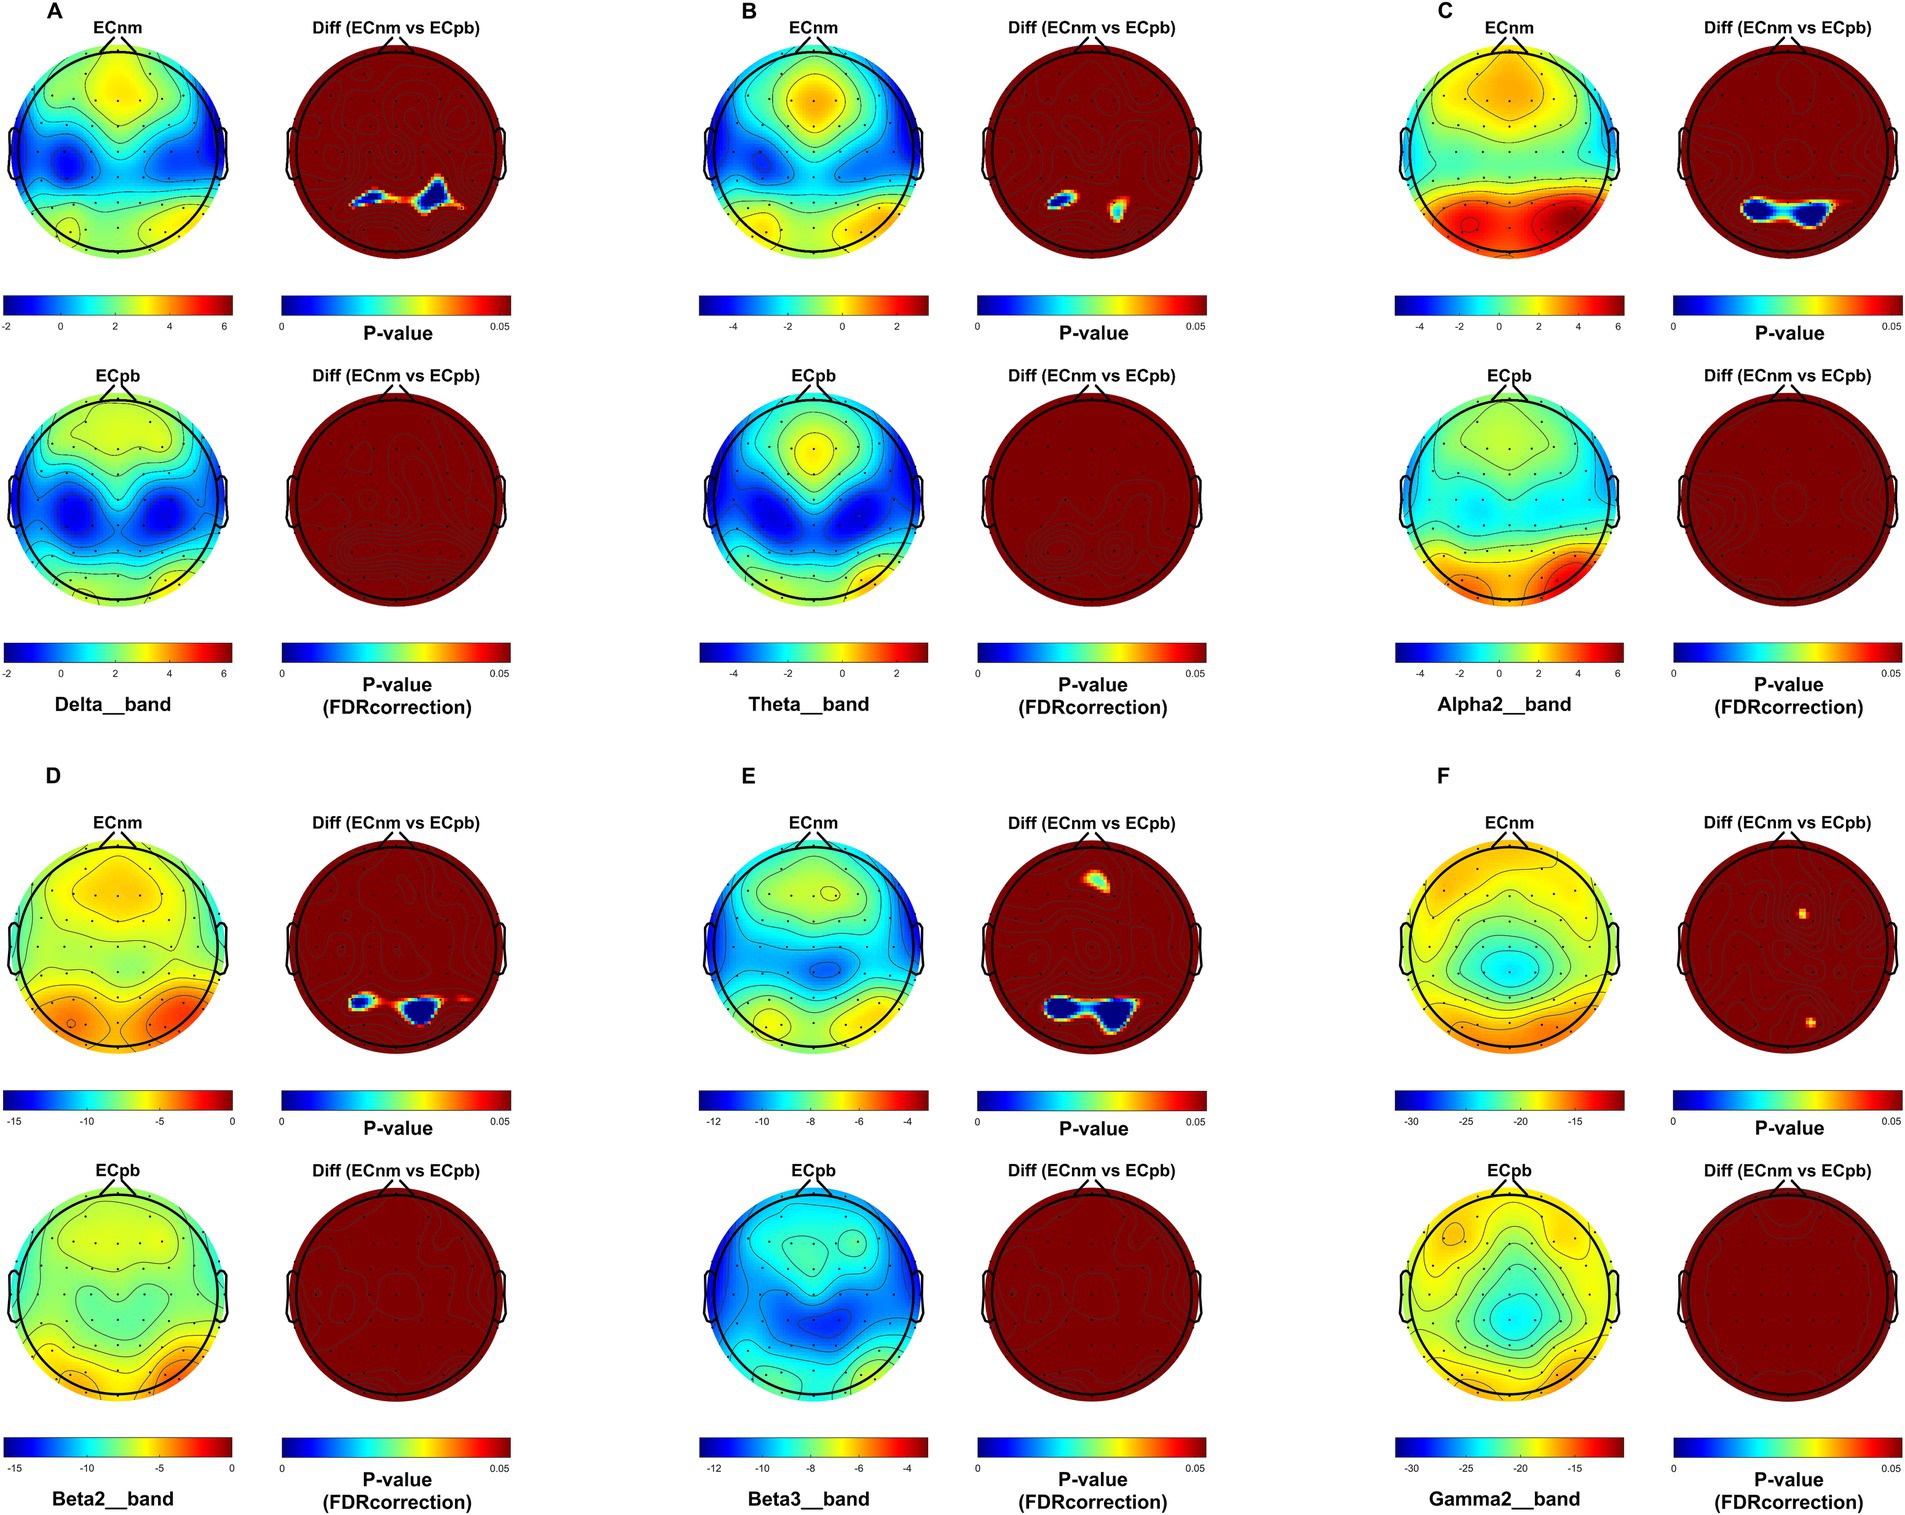
Figure 13. Scalp topographies of spectral analysis in ECnm vs. ECpb subgroups. (A–F) Comparison of ECnm, ECpb of delta (A), theta (B), alpha2 (C), beta2 (D), beta3 (E), and gamma2 (F) bands. The first column showed the PSD across the whole brain within each subgroup, the first and second rows of the second column showed the uncorrected p values and corrected p values for multiple comparisons of a false discovery rate (FDR) across the whole brain within each two subgroups, respectively. ECnm, EEG recordings with eyes closed stimuli-pre by TMNMT music; ECpb, EEG recordings with eyes closed stimuli-pre by Placebo music.
The results of this study showed that compared to stimuli-pre (ECnm), the PSD of delta band was significantly increased after TMNMT stimuli for 5 min (RInm), with a widespread distribution across the scalp, and no significant changes in Placebo group. Slow waves are a characteristic feature observed in cortical regions that lack connectivity with thalamocortical afferents (Steriade, 2006). slow waves at the cortical level can be enhanced by low-threshold spike bursts, generated in thalamic nuclei when hyperpolarized during deafferentation or overinhibition (Weisz et al., 2007). Delta activity is a characteristic oscillatory activity generated by deafferented/deprived neuronal networks (Llinás et al., 2005). RI may indicate the transient reestablishment of balance between excitatory and inhibitory neuronal assemblies through reafferentation (Eggermont and Tass, 2015). Increase of the oscillatory power in the delta, theta, as well as decrease in alpha power were associated with the presence of tinnitus and its intensity (Llinás et al., 1999, 2005; Weisz et al., 2005, 2007; Van der Loo et al., 2009; De Ridder et al., 2011; Adjamian et al., 2012; Tass et al., 2012; Adamchic et al., 2014; De Ridder et al., 2014, 2015b; Elgoyhen et al., 2015). An increase of oscillatory EEG power is typically interpreted as an increase in neuronal synchronization in terms of coincident firing within neuronal populations (Nunez, 1981 Bickford et al., 1979; Hämäläinen et al., 1993; Niedermeyer and da Silva, 2005). It was further found that an increase in delta activity was often accompanied by a decrease in other frequency spectrum, among the alpha band (Uchida et al., 1991; Benoit et al., 2000) as also detected in our study. Therefore, it is reasonable to speculate that the change of delta activity in tinnitus may be a multilateral balance state related to various spectral powers such as alpha wave, rather than a single event (Weisz et al., 2005). Thus, the enhancement of delta activity in tinnitus in our study compared to Placebo control group may represent a potential model that TMNMT was involved in the processing of tinnitus associated with auditory deafferentation, which would activate systems associated with tinnitus generation/cognition operating within the frequency range of delta activity (Weisz et al., 2005).
In the current study, we also found the PSD of theta band was significantly increased after TMNMT stimuli for 5 min (RInm), with a widespread distribution across the scalp, and no significant changes in Placebo group. Importantly, it has been proposed that low-frequencies modulate activity over large spatial regions in long temporal windows, whereas high frequencies modulate activity over small spatial regions and short temporal windows (Von Stein and Sarnthein, 2000). In other words, low frequencies (delta, theta, alpha) can be considered as carrier waves (Freeman and Rogers, 2002), and higher frequencies (beta, gamma) as information waves, and the higher frequencies are nested or carried by the lower frequencies. The theta wave acts as a long-range carrier wave (Freeman, 2005), hypothetically connecting to a theta oscillation-based memory network. The theta wave then acts as a compensatory mechanism to retrieve missing information from memory when it cannot be obtained from the external environment, as is the case for tinnitus patients with hearing loss (De Ridder et al., 2015b). Tinnitus, pain, movement, and mood-related information, via high-frequency oscillating activities such as beta and gamma, can be nested on this theta wave by means of cross-frequency coupling (De Ridder et al., 2014). Our findings supported the hypothesis that TMNMT-induced changes in theta band activity may play a compensatory role in tinnitus, facilitating the retrieval and integration of missing auditory information from memory networks. This cross-frequency coupling mechanism may provide a framework for understanding the complex interactions between different frequency bands in tinnitus pathophysiology.
The results of our study revealed a significant decrease in alpha2 band power in both TMNMT group and Placebo group, with a more pronounced effect observed in TMNMT group. In distressed tinnitus patients in contrast to controls low frequency activity (delta and theta) in the dorsal anterior cingulate cortex (dACC) is decreased, i.e., normal theta activity is decreased, and alpha1, alpha2 and beta3 activity is increased (Vanneste et al., 2010). In highly distressed vs. lowly distressed patients tend to show even higher levels of alpha1 and alpha2 activity, suggesting that the amount of alpha activity correlates with the level of distress (Vanneste et al., 2010). During our study, participants were instructed to focus their attention on the tinnitus sensation in order to provide intensity ratings. It is plausible that this attentional focus was enhanced after the sound stimuli, as participants had to be particularly attentive to detect any changes in intensity. This enhanced attentional state could have induced oscillatory brain activity that counteracted the effects induced by the stimulus alone. Indeed, reductions of alpha power have been frequently reported during tasks of focused attention (Jokisch and Jensen, 2007; Rihs et al., 2007). This fits well with the observation in our present study that alpha activity was reduced following the stimulus. Overall, our results suggest that TMNMT may modulate alpha2 band power, potentially influencing the attentional state and distress levels associated with tinnitus. These findings provide valuable insights into the complex relationship between oscillatory brain activity, attentional processes, and tinnitus perception.
In the current study, the results revealed a decrease of the PSD in beta2 and beta 3 bands in both TMNMT and Placebo groups, although the differences were not statistically significant in terms of topographical distribution. Studies suggest that reduced beta activity may serve functional inhibition (Jensen and Mazaheri, 2010; Müller et al., 2013). Several studies have reported that beta activity is associated with inhibitory states in the sensorimotor cortex, Hari and Salmelin (1997), Jensen et al. (2005), Miller et al. (2010), Schulz et al. (2014). Additionally, reduced power in the alpha up to the beta range has been linked to a stronger continuation of hearing music during noisy periods (Müller et al., 2013). Severe distress is associated with increased beta activity (Begić et al., 2001; Jokić-begić and Begić, 2003), which is consistent with a study that shows a connection between tinnitus distress and high beta (25 Hz) activity in frontal areas (Vanneste et al., 2010; Meyer et al., 2014).
The results revealed a decrease of the PSD in gamma2 band in TMNMT group, although the differences were not statistically significant in terms of topographical distribution. Tinnitus was suggested to be arise from abnormal, spontaneous, and constant gamma band activity generated as a consequence of the thalamic nuclei hyperpolarization (Llinás et al., 1999). The differential patterns of gamma-band oscillations in the auditory cortex associated with residual inhibition or excitation, suggesting a mutual inhibitory role of gamma oscillations on tinnitus symptoms (Sedley et al., 2012). These disparate findings may be attributed to the highly variable gamma band frequencies across studies (Weisz et al., 2007; Van Der Loo et al., 2009; Song et al., 2015) and confounders such as laterality and hearing loss (Ortmann et al., 2011). qEEG (Van Der Loo et al., 2009; Vanneste and De Ridder, 2012b; Meyer et al., 2014) and MEG studies (Weisz et al., 2005, 2007) showed a decrease in tinnitus loudness is associated with a decrease in gamma band activity in the auditory cortex (Vanneste and De Ridder, 2011; Adamchic et al., 2012, 2014) and a worsening in tinnitus loudness with an increase in auditory cortex gamma band activity (Vanneste et al., 2013). Gamma band activity increases and decreases were observed associated with an increase or decrease in tinnitus loudness following residual inhibition or excitation, respectively (Sedley et al., 2012), suggesting that gamma may represent a homeostatic change in loudness per se, with the tinnitus state as the reference, or it could potentially be attributed to other factors, such as associated hearing loss.
Through spectral analysis, it is evident that the delta, theta, and alpha bands hold potential as biomarkers in the TMNMT of tinnitus.
Microstate analysis explores multichannel EEG recordings across the scalp and defines a set of stable microstates (Khanna et al., 2015). Therefore, it not only compensates for the low spatial resolution of EEG signals to a certain extent, but also analyzes the abnormal dynamics of the whole brain networks. Resting state microstates reflects the temporarily independent functional network of the brain and the sum of spontaneous activity of neurons across various brain regions (Vanneste et al., 2019). Microstates are associated with spontaneous brain activity that are highly similar to fMRI resting state networks (Vanneste et al., 2019). The microstate analysis provides a unique perspective for studying the internal time dynamics of neuronal workspace models, but it has not been studied in thoroughly (Van de Ville et al., 2010). Current microstate analysis is mainly applied to schizophrenia, panic attacks, narcolepsy and depression (Kikuchi et al., 2011; Diaz Hernandez et al., 2016; Drissi et al., 2016; Zhang et al., 2018). Microstates had changed in chronic tinnitus patients and provided an indicator or perspective to explore the mechanisms of tinnitus. The maintenance of chronic subjective tinnitus may be related to changes in cerebral cortex activity (Cao et al., 2020). Studies suggests that the alterations of central neural networks occur in acute stage of hearing loss and tinnitus. And EEG microstate may be considered as a useful tool to study the whole brain network in ISSNHL patients (Cai et al., 2019), and EEG microstates may provide a possible valuable method to study large-scale brain networks, which may in turn be beneficial to investigation of the neurophysiological mechanisms behind tinnitus (Cai et al., 2018). Furthermore, Clinical studies have shown that alterations in brain activity may play an important role in the maintenance of tinnitus (Trakolis et al., 2018), a notion confirmed by findings from functional magnetic resonance imaging (fMRI) and EEG studies (Tian et al., 2011).
In the current study, the occurrence and coverage of microstate A significantly increased in TMNMT group. Microstate A is mainly associated with the changes of BOLD activation in the bilateral temporo-parietal cortex and meso-temporo-parietal cortex (Gschwind et al., 2016; Michel and Koenig, 2018). In addition, recent studies have estimated the sources of EEG microstates. The sources of microstate A are located on the left side of the occipital gyrus, insula, temporal lobe, and medial prefrontal cortex (mPFC) (Custo et al., 2017). Microstate A is closely related to auditory network and speech processing (Britz et al., 2010; Gschwind et al., 2016; Michel and Koenig, 2018). Therefore, the observed changes that a higher occurrence and coverage of microstate A in TMNMT (RInm vs. ECnm and RInm vs. NMnm) suggests that RI effect of TMNMT may enhance the auditory network and improve speech processing abilities in tinnitus patients.
Microstate B are significantly associated with BOLD changes in the striate and extrastriate cortex and the negative BOLD activation in the bilateral occipital cortex, which is closely related to the visual system (Britz et al., 2010; Yuan et al., 2012; Michel and Koenig, 2018). Moreover, microstate B is correlated with mental visualization of situations (Bréchet et al., 2019). A recent study showed that the presence of microstate B is associated with increased levels of anxiety (Damborská et al., 2019). In our study, a higher occurrence of microstate B in Placebo (RIpb vs. ECpb and RIpb vs. PBpb), along with a shorter duration of microstate B in TMNMT group (RInm vs. ECnm), suggest that RI effect of TMNMT may lead to a decrease in tinnitus intensity and alleviate the anxiety of tinnitus-related. These findings suggest that the impact of TMNMT extends beyond auditory processing, potentially involving the visual system and mental processes. The observed changes in microstate B duration provide valuable insights into the underlying mechanisms through which TMNMT exerts its effects on tinnitus-related anxiety and perceptual experiences.
Microstate C is associated with positive activation of BOLD in the bilateral inferior frontal cortex, dorsal anterior cingulate cortex, and right island area. Microstate C is thought to be generated at the bilateral medial temporal gyrus and the lateral parietal lobe (Wang et al., 2021). Microstate C is closely correlated with the default mode network (Britz et al., 2010; Gschwind et al., 2016; Michel and Koenig, 2018; Yu et al., 2021), which consists of the medial prefrontal, parietal and temporal cortex (Spreng et al., 2010). Default mode network is the neural basis of the ego (Andrews-Hanna et al., 2012); it has been found to be activated during internally-directed mental processes and to play an important role in self-referential thoughts and episodic memory retrieval (Xu et al., 2016; Michel and Koenig, 2018). Studies have shown that microstate C reflected the cognitive level of individuals with the disorders of consciousness (DOC). When the microstate C parameter of DOC patients is close to the normal level, it indicates an increased level of consciousness (Guo et al., 2022). In our study, a shorter duration with lower coverage of microstate C in PBpb subgroup (PBpb vs. ECpb), along with a higher occurrence and coverage of microstate C in RIpb subgroup (RIpb vs. PBpb), suggested that Placebo may impact levels of consciousness and cognition during stimuli, returning to baseline after stimuli. Similarly, a higher occurrence of microstate C in NMnm subgroup (NMnm vs. ECnm), along with a shorter duration and lower coverage of microstate C in RInm subgroup (RInm vs. NMnm), suggested that TMNMT may improve the level of consciousness and cognition during stimuli, returning to baseline after stimuli. The above statement implies that TMNMT has the potential to enhance cognitive processes and self-awareness of tinnitus patients; however, further research is required to validate this assertion.
Microstate D is associated with negative BOLD activation in the right ventral and dorsal regions of the frontal cortex and parietal cortex, which is closely related to attention network (Koenig et al., 1999; Gschwind et al., 2016; Michel and Koenig, 2018). Microstate D is widely connected to default mode and dorsal attention network (Spreng et al., 2013). Attention deficit has long been considered one of the symptoms of tinnitus. The psychological complications, such as annoyance, attention deficits, depression, anxiety, irritability, sleep disturbances, and intense worrying can be a result of constant awareness of tinnitus (Vanneste et al., 2010). In our study, a shorter duration and lower coverage of microstate D in Placebo group (RIpb vs. PBpb), along with a higher occurrence of microstate D in TMNMT group (RInm vs. NMnm) suggested that RI effect of TMNMT may enhance frontal parietal cortex and dorsal attention networks in tinnitus patients. By modulating the activity of the attention network, TMNMT has the potential to improve attentional processes and alleviate attention deficits in individuals with tinnitus. The increased occurrence of microstate D provides further evidence of the positive effects of TMNMT on attention networks, which may contribute to the overall improvement in attentional functioning and symptom management observed in our study.
A speculative point of view that we observed the microstate C in all three Placebo subgroups, which is similar to previous studies and referred to as microstate class E (Bréchet et al., 2019; Qin et al., 2022). Microstate class E is thought to be associated with the default mode network in the dorsal anterior cingulate cortex, which extends to the superior frontal gyrus, middle frontal gyrus, and insula (Custo et al., 2017). The activities of these networks are associated with the midcingulo-insular network regions (Uddin et al., 2019). The midcingulo-insular network is also thought to regulate the default mode network and participate in dynamic switching between large-scale related networks to facilitate attention and response to the external environment (Zanesco et al., 2021). Therefore, our findings suggest that the reduction in microstate C observed in Placebo subgroups may be attributed to impaired default mode network in individuals experiencing RI effect of the placebo treatment. The disrupted default mode network in Placebo group may contribute to alterations in attentional processes and the ability to shift between different brain networks. These findings provide insights into the potential mechanisms underlying the placebo effect and the involvement of default mode network dysfunction in tinnitus.
The study also identified several variations of transition probabilities among microstate classes between TMNMT and Placebo groups. Transition probabilities may indicate a switch between intrinsic brain function networks, as microstate classes are related to their corresponding intrinsic brain function networks (Britz et al., 2010; Milz et al., 2016; Custo et al., 2017; Michel and Koenig, 2018). We found that the transition of microstate class mainly involves microstate A in both TMNMT and Placebo groups, that indicate a heightened activity within the auditory networks. Increased transitions from microstates A to microstates B and microstates B to microstates A may implicate RI effect of Placebo enhances the mutual functional connectivity between the auditory network and the visual network. Increased transitions from microstates A to microstates B may implicate that RI effect of TMNMT enhanced functional connectivity from the auditory networks to visual networks. These findings suggest that RI of TMNMT and Placebo facilitated communication between these networks, potentially influencing the processing of auditory and visual information. An increase in the inter-transitions between microstates A and D and a reduction transition from microstates D to microstates B implicate that RI effect of TMNMT increased the functional connectivity of auditory and attention networks, while decreased the functional connectivity from the attention networks to visual networks. These changes in connectivity patterns suggest that RI of TMNMT may have a positive impact on the interaction between auditory and attention networks, potentially influencing cognitive processes related to attention and sensory information processing.
In addition, we observed the duration of microstate B were positive correlations of tinnitus participants’ TFI scores among six subgroups of TMNMT and Placebo groups. These results suggest that microstate B is associated with the intensity of tinnitus symptoms, which is consistent with the similar studies of Atluri et al. (2018) and Yan et al. (2021). Atluri et al. (2018) reported that a reduced occurrence of microstate B in patients with major depressive disorder following the treatment was associated with significant obvious clinical outcomes. Yan et al. (2021) found that the duration and occurrence of microstate B were significantly reduced in patients with major depression after treatment. Liang et al. (2021) also reported an increased occurrence of microstate B in the depression group compared to the healthy control group.
Inevitably, limitations of this study need to be mentioned. First, due to the widespread, intricate and heterogeneity of tinnitus, it may not be possible to process it in a homogeneous manner even with rigorous inclusion and exclusion criteria and carrying out the high experimental standards. The variability among tinnitus patients may have influenced the results and should be considered in future research. Second, understanding the cortical correlations of EEG microstates relies on source modeling techniques that provide limited spatial resolution at best. These methods rely on multiple biophysical assumptions and simplifications that are still undergoing refinement (Nunez and Srinivasan, 2006). We encourage future studies to amplify the transitions between resting EEG microstates in order to better understand the functions underlying the communication between neural resting networks on the millisecond scale. Third, As described earlier, to obtain the intensity and duration of residual inhibition, participants were always required to focus their attention on the tinnitus sensation. It is possible that attentional factors contributed to the observed oscillatory brain activity, which may have counteracted the effects induced solely by the stimuli. In future studies, a RI condition should be examined in order to minimize attention effects and thus, unspecific changes in alpha activity. It is recommended to test and validate the intensity and duration of RI prior to the experiment, and provide an estimation of tinnitus loudness during the course of the study. In summary, due to the heterogeneity of tinnitus and relatively small sample size, the results of our study require careful read and cautious interpretation. Hence, further studies with larger sample sizes are required to enhance sample homogeneity and reduce the heterogeneity present in tinnitus samples and a more comprehensive analysis is necessary to investigate the underlying mechanisms.
In this study, behavioral test, spectral analysis and EEG microstates were used to demonstrate that TMNMT, a novel therapy for tinnitus, had a stronger ability of residual inhibition, which provided valuable experimental evidence and practical implications for the potential applications of TMNMT in tinnitus treatment. Additionally, EEG microstate temporal dynamics may serve as novel functional state and trait markers of synchronous brain activity that contribute to a deep understanding of the neural mechanism underlying TMNMT treatment for tinnitus.
The raw data supporting the conclusions of this article will be made available by the authors, without undue reservation.
The studies involving humans were approved by the Medical Ethics Committee of Tsinghua University. The studies were conducted in accordance with the local legislation and institutional requirements. The participants provided their written informed consent to participate in this study.
MZ: Writing – review & editing, Conceptualization, Data curation, Formal analysis, Investigation, Methodology, Writing – original draft. QG: Conceptualization, Writing – review & editing, Funding acquisition, Project administration, Resources, Software, Supervision, Validation, Visualization.
The author(s) declare financial support was received for the research, authorship, and/or publication of this article. This work was supported by the grant from National Key R&D Program of China (Grant No. 2023YFC2416200).
We would like to thank Haijin Yi and Xin Li from Beijing Tsinghua Changgung Hospital for the participants’ recommendation and thank all the participants who participated in the study.
The authors declare that the research was conducted in the absence of any commercial or financial relationships that could be construed as a potential conflict of interest.
All claims expressed in this article are solely those of the authors and do not necessarily represent those of their affiliated organizations, or those of the publisher, the editors and the reviewers. Any product that may be evaluated in this article, or claim that may be made by its manufacturer, is not guaranteed or endorsed by the publisher.
1. ^http://compumedicsneuroscan.com/
2. ^http://www.thomaskoenig.ch/index.php/software/microstates-in-eeglab
Adamchic, I., Hauptmann, C., and Tass, P. A. (2012). Changes of oscillatory activity in pitch processing network and related tinnitus relief induced by acoustic CR neuromodulation. Front. Syst. Neurosci. 6:18. doi: 10.3389/fnsys.2012.00018
Adamchic, I., Toth, T., Hauptmann, C., and Tass, P. A. (2014). Reversing pathologically increased EEG power by acoustic coordinated reset neuromodulation. Hum. Brain Mapp. 35, 2099–2118. doi: 10.1002/hbm.22314
Adjamian, P., Sereda, M., Zobay, O., Hall, D. A., and Palmer, A. R. (2012). Neuromagnetic indicators of tinnitus and tinnitus masking in patients with and without hearing loss. J. Assoc. Res. Otolaryngol. 13, 715–731. doi: 10.1007/s10162-012-0340-5
Andreou, C., Faber, P. L., Leicht, G., Schoettle, D., Polomac, N., Hanganu-Opatz, I. L., et al. (2014). Resting-state connectivity in the prodromal phase of schizophrenia: insights from EEG microstates. Schizophr. Res. 152, 513–520. doi: 10.1016/j.schres.2013.12.008
Andrews-Hanna, J. R. (2012). The brain’s default network and its adaptive role in internal mentation. The Neuroscientist 18, 251–270.
Atluri, S., Wong, W., Moreno, S., Blumberger, D. M., Daskalakis, Z. J., and Farzan, F. (2018). Selective modulation of brain network dynamics by seizure therapy in treatment-resistant depression. NeuroImage: Clinical 20, 1176–1190. doi: 10.1016/j.nicl.2018.10.015
Axelsson, A., and Ringdahl, A. (1989). Tinnitus—a study of its prevalence and characteristics. Br. J. Audiol. 23, 53–62. doi: 10.3109/03005368909077819
Baguley, D., McFerran, D., and Hall, D. (2013). Tinnitus. Lancet 382, 1600–1607. doi: 10.1016/S0140-6736(13)60142-7
Barry, R. J., Clarke, A. R., and Johnstone, S. J. (2011). Caffeine and opening the eyes have additive effects on resting arousal measures. Clin. Neurophysiol. 122, 2010–2015. doi: 10.1016/j.clinph.2011.02.036
Begić, D., Hotujac, L., and Jokić-Begić, N. (2001). Electroencephalographic comparison of veterans with combat-related post-traumatic stress disorder and healthy subjects. Int. J. Psychophysiol. 40, 167–172. doi: 10.1016/S0167-8760(00)00153-7
Benoit, O., Daurat, A., and Prado, J. (2000). Slow (0.7–2 Hz) and fast (2–4 Hz) delta components are differently correlated to theta, alpha and beta frequency bands during NREM sleep. Clin. Neurophysiol. 111, 2103–2106. doi: 10.1016/S1388-2457(00)00470-3
Bickford, R. G., Klass, D. W., and Daly, D. D. (1979). Newer methods of recording and analyzing EEGs Current Practice of Clinical Electroencephalography. New York: Raven Press.
Bing, D., Ying, J., Miao, J., Lan, L., Wang, D., Zhao, L., et al. (2018). Predicting the hearing outcome in sudden sensorineural hearing loss via machine learning models. Clin. Otolaryngol. 43, 868–874. doi: 10.1111/coa.13068
Bréchet, L., Brunet, D., Birot, G., Gruetter, R., Michel, C. M., and Jorge, J. (2019). Capturing the spatiotemporal dynamics of self-generated, task-initiated thoughts with EEG and fMRI. NeuroImage 194, 82–92. doi: 10.1016/j.neuroimage.2019.03.029
Bréchet, L., and Michel, C. M. (2022). EEG microstates in altered states of consciousness. Front. Psychol. 13:856697. doi: 10.3389/fpsyg.2022.856697
Britz, J., Landis, T., and Michel, C. M. (2009). Right parietal brain activity precedes perceptual alternation of bistable stimuli. Cereb. Cortex 19, 55–65. doi: 10.1093/cercor/bhn056
Britz, J., Van De Ville, D., and Michel, C. M. (2010). BOLD correlates of EEG topography reveal rapid resting-state network dynamics. NeuroImage 52, 1162–1170. doi: 10.1016/j.neuroimage.2010.02.052
Brodbeck, V., Kuhn, A., von Wegner, F., Morzelewski, A., Tagliazucchi, E., Borisov, S., et al. (2012). EEG microstates of wakefulness and NREM sleep. NeuroImage 62, 2129–2139. doi: 10.1016/j.neuroimage.2012.05.060
Cai, Y., Chen, S., Chen, Y., Li, J., Wang, C. D., Zhao, F., et al. (2019). Altered resting-state EEG microstate in idiopathic sudden sensorineural hearing loss patients with tinnitus. Front. Neurosci. 13:443. doi: 10.3389/fnins.2019.00443
Cai, Y., Huang, D., Chen, Y., Yang, H., Wang, C. D., Zhao, F., et al. (2018). Deviant dynamics of resting state electroencephalogram microstate in patients with subjective tinnitus. Front. Behav. Neurosci. 12:122. doi: 10.3389/fnbeh.2018.00122
Cao, W., Wang, F., Zhang, C., Lei, G., Jiang, Q., Shen, W., et al. (2020). Microstate in resting state: an EEG indicator of tinnitus? Acta Otolaryngol. 140, 564–569. doi: 10.1080/00016489.2020.1743878
Cederroth, C. R., Gallus, S., Hall, D. A., Kleinjung, T., Langguth, B., Maruotti, A., et al. (2019). Towards an understanding of tinnitus heterogeneity. Front. Aging Neurosci. 11:53. doi: 10.3389/fnagi.2019.00053
Chen, Y. C., Feng, Y., Xu, J. J., Mao, C. N., Xia, W., Ren, J., et al. (2016). Disrupted brain functional network architecture in chronic tinnitus patients. Front. Aging Neurosci. 8:174. doi: 10.3389/fnagi.2016.00174
Claes, L., Stamberger, H., Van de Heyning, P., De Ridder, D., and Vanneste, S. (2014). Auditory cortex tACS and tRNS for tinnitus: single versus multiple sessions. Neural Plast. 2014, 1–7. doi: 10.1155/2014/436713
Custo, A., Van De Ville, D., Wells, W. M., Tomescu, M. I., Brunet, D., and Michel, C. M. (2017). Electroencephalographic resting-state networks: source localization of microstates. Brain Connect. 7, 671–682. doi: 10.1089/brain.2016.0476
Czornik, M., Malekshahi, A., Mahmoud, W., Wolpert, S., and Birbaumer, N. (2022). Psychophysiological treatment of chronic tinnitus: a review. Clin. Psychol. Psychother. 29, 1236–1253. doi: 10.1002/cpp.2708
Damborská, A., Piguet, C., Aubry, J. M., Dayer, A. G., Michel, C. M., and Berchio, C. (2019). Altered electroencephalographic resting-state large-scale brain network dynamics in euthymic bipolar disorder patients. Front. Psych. 10:826. doi: 10.3389/fpsyt.2019.00826
De Ridder, D., Congedo, M., and Vanneste, S. (2015a). The neural correlates of subjectively perceived and passively matched loudness perception in auditory phantom perception. Brain Behav. 5:e00331. doi: 10.1002/brb3.331
De Ridder, D., van der Loo, E., Vanneste, S., Gais, S., Plazier, M., Kovacs, S., et al. (2011). Theta-gamma dysrhythmia and auditory phantom perception: case report. J. Neurosurg., 114, 912–921, doi: 10.3171/2010.11.JNS10335
De Ridder, D., and Vanneste, S. (2014). Targeting the parahippocampal area by auditory cortex stimulation in tinnitus. Brain Stimul. 7, 709–717. doi: 10.1016/j.brs.2014.04.004
De Ridder, D., Vanneste, S., Langguth, B., and Llinas, R. (2015b). Thalamocortical dysrhythmia: a theoretical update in tinnitus. Front. Neurol. 6:124. doi: 10.3389/fneur.2015.00124
De Ridder, D., Vanneste, S., Weisz, N., Londero, A., Schlee, W., Elgoyhen, A. B., et al. (2014). An integrative model of auditory phantom perception: tinnitus as a unified percept of interacting separable subnetworks. Neurosci. Biobehav. Rev. 44, 16–32. doi: 10.1016/j.neubiorev.2013.03.021
Diaz Hernandez, L., Rieger, K., Baenninger, A., Brandeis, D., and Koenig, T. (2016). Towards using microstate-neurofeedback for the treatment of psychotic symptoms in schizophrenia. A feasibility study in healthy participants. Brain Topogr. 29, 308–321. doi: 10.1007/s10548-015-0460-4
Dierks, T., Jelic, V., Julin, P., Maurer, K., Wahlund, L. O., Almkvist, O., et al. (1997). EEG-microstates in mild memory impairment and Alzheimer's disease: possible association with disturbed information processing. J. Neural Transm. 104, 483–495. doi: 10.1007/BF01277666
Dispenza, F., Amodio, E., De Stefano, A., Gallina, S., Marchese, D., Mathur, N., et al. (2011). Treatment of sudden sensorineural hearing loss with transtympanic injection of steroids as single therapy: a randomized clinical study. Eur. Arch. Otorhinolaryngol. 268, 1273–1278. doi: 10.1007/s00405-011-1523-0
Dong, C., Chen, C., Wang, T., Gao, C., Wang, Y., Guan, X., et al. (2020). Low-frequency repetitive transcranial magnetic stimulation for the treatment of chronic tinnitus: a systematic review and meta-analysis of randomized controlled trials. BioMed Res. Int. doi: 10.1155/2020/5395071
Drissi, N. M., Szakács, A., Witt, S. T., Wretman, A., Ulander, M., Ståhlbrandt, H., et al. (2016). Altered brain microstate dynamics in adolescents with narcolepsy. Front. Hum. Neurosci. 10:369. doi: 10.3389/fnhum.2016.00369
Eggermont, J. J., and Roberts, L. E. (2012). The neuroscience of tinnitus: understanding abnormal and normal auditory perception. Front. Syst. Neurosci. 6:53. doi: 10.3389/fnsys.2012.00053
Eggermont, J. J., and Tass, P. A. (2015). Maladaptive neural synchrony in tinnitus: origin and restoration. Front. Neurol. 6:29. doi: 10.3389/fneur.2015.00029
Elgoyhen, A. B., Langguth, B., De Ridder, D., and Vanneste, S. (2015). Tinnitus: perspectives from human neuroimaging. Nat. Rev. Neurosci. 16, 632–642. doi: 10.1038/nrn4003
Faber, P. L., Milz, P., Reininghaus, E. Z., Mörkl, S., Holl, A. K., Kapfhammer, H. P., et al. (2021). Fundamentally altered global-and microstate EEG characteristics in Huntington’s disease. Clin. Neurophysiol. 132, 13–22. doi: 10.1016/j.clinph.2020.10.006
Feldmann, H. (1971). Homolateral and contralateral masking of tinnitus by noise-bands and by pure tones. Audiology 10, 138–144. doi: 10.3109/00206097109072551
Feldmann, H. (1983). Time patterns and related parameters in masking of tinnitus. Acta Otolaryngol. 95, 594–598. doi: 10.3109/00016488309139449
Fournier, P., Cuvillier, A. F., Gallego, S., Paolino, F., Paolino, M., Quemar, A., et al. (2018). A new method for assessing masking and residual inhibition of tinnitus. Trends Hear. 22:1876999. doi: 10.1177/2331216518769996
Foxe, J. J., Morie, K. P., Laud, P. J., Rowson, M. J., De Bruin, E. A., and Kelly, S. P. (2012). Assessing the effects of caffeine and theanine on the maintenance of vigilance during a sustained attention task. Neuropharmacology 62, 2320–2327. doi: 10.1016/j.neuropharm.2012.01.020
Freeman, W. J. (2005). A field-theoretic approach to understanding scale-free neocortical dynamics. Biol. Cybern. 92, 350–359. doi: 10.1007/s00422-005-0563-1
Freeman, W. J., and Rogers, L. J. (2002). Fine temporal resolution of analytic phase reveals episodic synchronization by state transitions in gamma EEGs. J. Neurophysiol. 87, 937–945. doi: 10.1152/jn.00254.2001
Gong, Q., Wang, H., Zhu, M., Wang, H., Ma, T., and Ding, D. (2022). Development of a personalized tinnitus detection and treatment instrument. J. Tsinghua University(Science and Technology). doi: 10.16511/j.cnki.qhdxxb.2022.25.026
Gschwind, M., Hardmeier, M., Van De Ville, D., Tomescu, M. I., Penner, I. K., Naegelin, Y., et al. (2016). Fluctuations of spontaneous EEG topographies predict disease state in relapsing-remitting multiple sclerosis. NeuroImage: Clinical 12, 466–477. doi: 10.1016/j.nicl.2016.08.008
Güntensperger, D., Thüring, C., Meyer, M., Neff, P., and Kleinjung, T. (2017). Neurofeedback for tinnitus treatment–review and current concepts. Front. Aging Neurosci. 9:386. doi: 10.3389/fnagi.2017.00386
Guo, Y., Li, R., Zhang, R., Liu, C., Zhang, L., Zhao, D., et al. (2022). Dynamic changes of brain activity in patients with disorders of consciousness during recovery of consciousness. Front. Neurosci. 16:203. doi: 10.3389/fnins.2022.878203
Hämäläinen, M., Hari, R., Ilmoniemi, R. J., Knuutila, J., and Lounasmaa, O. V. (1993). Magnetoencephalography—theory, instrumentation, and applications to noninvasive studies of the working human brain. Rev. Mod. Phys. 65, 413–497. doi: 10.1103/RevModPhys.65.413
Hanoglu, L., Toplutas, E., Saricaoglu, M., Velioglu, H. A., Yildiz, S., and Yulug, B. (2022). Therapeutic role of repetitive transcranial magnetic stimulation in Alzheimer’s and Parkinson’s disease: electroencephalography microstate correlates. Front. Neurosci. 16:798558. doi: 10.3389/fnins.2022.798558
Hari, R., and Salmelin, R. (1997). Human cortical oscillations: a neuromagnetic view through the skull. Trends Neurosci. 20, 44–49. doi: 10.1016/S0166-2236(96)10065-5
Henry, J. A., and Meikle, M. B. (2000). Psychoacoustic measures of tinnitus. J. Am. Acad. Audiol. 11, 138–155. doi: 10.1055/s-0042-1748040
Henry, J. A., Rheinsburg, B., and Zaugg, T. (2004). Comparison of custom sounds for achieving tinnitus relief. J. Am. Acad. Audiol. 15, 585–598. doi: 10.3766/jaaa.15.8.6
Herrera-Murillo, M. A., Treviño, M., and Manjarrez, E. (2022). Random noise stimulation in the treatment of patients with neurological disorders. Neural Regen. Res. 17, 2557–2562. doi: 10.4103/1673-5374.339474
Hu, S., Anschuetz, L., Huth, M. E., Sznitman, R., Blaser, D., Kompis, M., et al. (2019). Association between residual inhibition and neural activity in patients with tinnitus: protocol for a controlled within-and between-subject comparison study. JMIR Res. Prot. 8:e12270. doi: 10.2196/12270
Hullfish, J., Abenes, I., Kovacs, S., Sunaert, S., De Ridder, D., and Vanneste, S. (2018a). Functional brain changes in auditory phantom perception evoked by different stimulus frequencies. Neurosci. Lett. 683, 160–167. doi: 10.1016/j.neulet.2018.07.043
Hullfish, J., Abenes, I., Kovacs, S., Sunaert, S., De Ridder, D., and Vanneste, S. (2018b). Functional connectivity analysis of fMRI data collected from human subjects with chronic tinnitus and varying levels of tinnitus-related distress. Data Brief 21, 779–789. doi: 10.1016/j.dib.2018.10.044
Hullfish, J., Abenes, I., Yoo, H. B., De Ridder, D., and Vanneste, S. (2019). Frontostriatal network dysfunction as a domain-general mechanism underlying phantom perception. Hum. Brain Mapp. 40, 2241–2251. doi: 10.1002/hbm.24521
Jensen, O., Goel, P., Kopell, N., Pohja, M., Hari, R., and Ermentrout, B. (2005). On the human sensorimotor-cortex beta rhythm: sources and modeling. NeuroImage 26, 347–355. doi: 10.1016/j.neuroimage.2005.02.008
Jensen, O., and Mazaheri, A. (2010). Shaping functional architecture by oscillatory alpha activity: gating by inhibition. Front. Hum. Neurosci. 4:186. doi: 10.3389/fnhum.2010.00186
Jokić-begić, N., and Begić, D. (2003). Quantitative electroencephalogram (qEEG) in combat veterans with post-traumatic stress disorder (PTSD). Nord. J. Psychiatry 57, 351–355. doi: 10.1080/08039480310002688
Jokisch, D., and Jensen, O. (2007). Modulation of gamma and alpha activity during a working memory task engaging the dorsal or ventral stream. J. Neurosci. 27, 3244–3251. doi: 10.1523/JNEUROSCI.5399-06.2007
Jung, T. P., Makeig, S., Bell, A. J., and Sejnowski, T. J. (1998). Independent component analysis of electroencephalographic and event-related potential data. Cent. Audit. Process. Neural Model., (Boston, MA: Springer US), 189–197.
Kahlbrock, N., and Weisz, N. (2008). Transient reduction of tinnitus intensity is marked by concomitant reductions of delta band power. BMC Biol. 6, 1–9. doi: 10.1186/1741-7007-6-4
Kaltenbach, J. A. (2006). The dorsal cochlear nucleus as a participant in the auditory, attentional and emotional components of tinnitus. Hear. Res. 216-217, 224–234. doi: 10.1016/j.heares.2006.01.002
Khanna, A., Pascual-Leone, A., Michel, C. M., and Farzan, F. (2015). Microstates in resting-state EEG: current status and future directions. Neurosci. Biobehav. Rev. 49, 105–113. doi: 10.1016/j.neubiorev.2014.12.010
Kikuchi, M., Koenig, T., Munesue, T., Hanaoka, A., Strik, W., Dierks, T., et al. (2011). EEG microstate analysis in drug-naive patients with panic disorder. PLoS One 6:e22912. doi: 10.1371/journal.pone.0022912
Kim, K., Duc, N. T., Choi, M., and Lee, B. (2021). EEG microstate features for schizophrenia classification. PLoS One 16:e0251842. doi: 10.1371/journal.pone.0251842
Kim, S. H., Jang, J. H., Lee, S. Y., Han, J. J., Koo, J. W., Vanneste, S., et al. (2016). Neural substrates predicting short-term improvement of tinnitus loudness and distress after modified tinnitus retraining therapy. Sci. Rep. 6, 1–10. doi: 10.1038/srep29140
Kim, H. J., Lee, H. J., An, S. Y., Sim, S., Park, B., Kim, S. W., et al. (2015). Analysis of the prevalence and associated risk factors of tinnitus in adults. PLoS One 10:e0127578. doi: 10.1371/journal.pone.0127578
Kindler, J., Hubl, D., Strik, W. K., Dierks, T., and König, T. (2011). Resting-state EEG in schizophrenia: auditory verbal hallucinations are related to shortening of specific microstates. Clin. Neurophysiol. 122, 1179–1182. doi: 10.1016/j.clinph.2010.10.042
Kleinjung, T., Thüring, C., Güntensperger, D., Neff, P., and Meyer, M. (2018). Neurofeedback for the treatment of chronic tinnitus: review and future perspectives. HNO 66, 198–204. doi: 10.1007/s00106-017-0432-y
Koenig, T., Lehmann, D., Merlo, M. C., Kochi, K., Hell, D., and Koukkou, M. (1999). A deviant EEG brain microstate in acute, neuroleptic-naive schizophrenics at rest. Eur. Arch. Psychiatry Clin. Neurosci. 249, 205–211. doi: 10.1007/s004060050088
Koenig, T., Prichep, L., Lehmann, D., Sosa, P. V., Braeker, E., Kleinlogel, H., et al. (2002). Millisecond by millisecond, year by year: normative EEG microstates and developmental stages. NeuroImage 16, 41–48. doi: 10.1006/nimg.2002.1070
Kuhn, A., Brodbeck, V., Tagliazucchi, E., Morzelewski, A., von Wegner, F., and Laufs, H. (2015). Narcoleptic patients show fragmented EEG-microstructure during early NREM sleep. Brain Topogr. 28, 619–635. doi: 10.1007/s10548-014-0387-1
Labree, B., Hoare, D. J., Gascoyne, L. E., and Sereda, M. (2021). Determining the effects of transcranial direct current stimulation on tinnitus and tinnitus-related outcomes: protocol for a systematic review. BMJ Open 11:e047191. doi: 10.1136/bmjopen-2020-047191
Langguth, B. (2020). Non-invasive neuromodulation for tinnitus. J. Audiol. Otol. 24, 113–118. doi: 10.7874/jao.2020.00052
Lanting, C. P., De Kleine, E., and Van Dijk, P. (2009). Neural activity underlying tinnitus generation: results from PET and fMRI. Hear. Res. 255, 1–13. doi: 10.1016/j.heares.2009.06.009
Lehmann, D., Faber, P. L., Galderisi, S., Herrmann, W. M., Kinoshita, T., Koukkou, M., et al. (2005). EEG microstate duration and syntax in acute, medication-naive, first-episode schizophrenia: a multi-center study. Psychiatry Res. Neuroimaging 138, 141–156. doi: 10.1016/j.pscychresns.2004.05.007
Lehmann, D., Ozaki, H., and Pal, I. (1987). EEG alpha map series: brain micro-states by space-oriented adaptive segmentation. Electroencephalogr. Clin. Neurophysiol. 67, 271–288. doi: 10.1016/0013-4694(87)90025-3
Lehmann, D., Pascual-Marqui, R. D., Strik, W. K., and Koenig, T. (2010). Core networks for visual-concrete and abstract thought content: a brain electric microstate analysis. NeuroImage 49, 1073–1079. doi: 10.1016/j.neuroimage.2009.07.054
Lehmann, D., and Skrandies, W. (1980). Reference-free identification of components of checkerboard-evoked multichannel potential fields. Electroencephalogr. Clin. Neurophysiol. 48, 609–621. doi: 10.1016/0013-4694(80)90419-8
Lehmann, D., Strik, W. K., Henggeler, B., König, T., and Koukkou, M. (1998). Brain electric microstates and momentary conscious mind states as building blocks of spontaneous thinking: I. Visual imagery and abstract thoughts. Int. J. Psychophysiol. 29, 1–11. doi: 10.1016/S0167-8760(97)00098-6
Liang, A., Zhao, S., Song, J., Zhang, Y., Zhang, Y., Niu, X., et al. (2021). Treatment effect of exercise intervention for female college students with depression: analysis of electroencephalogram microstates and power spectrum. Sustainability 13:6822. doi: 10.3390/su13126822
Lin, N., Gao, J., Mao, C., Sun, H., Lu, Q., and Cui, L. (2021). Differences in multimodal electroencephalogram and clinical correlations between early-onset Alzheimer’s disease and frontotemporal dementia. Front. Neurosci. 15:687053. doi: 10.3389/fnins.2021.687053
Llinás, R. R., Ribary, U., Jeanmonod, D., Kronberg, E., and Mitra, P. P. (1999). Thalamocortical dysrhythmia: a neurological and neuropsychiatric syndrome characterized by magnetoencephalography. Proc. Natl. Acad. Sci. 96, 15222–15227. doi: 10.1073/pnas.96.26.15222
Llinás, R., Urbano, F. J., Leznik, E., Ramírez, R. R., and Van Marle, H. J. (2005). Rhythmic and dysrhythmic thalamocortical dynamics: GABA systems and the edge effect. Trends Neurosci. 28, 325–333. doi: 10.1016/j.tins.2005.04.006
Londero, A., Bonfils, P., and Lefaucheur, J. P. (2018). Transcranial magnetic stimulation and subjective tinnitus. A review of the literature, 2014–2016. Eur. Ann. Otorhinolaryngol. Head Neck Dis. 135, 51–58. doi: 10.1016/j.anorl.2017.12.001
May, E. S., Ávila, C. G., Dinh, S. T., Heitmann, H., Hohn, V. D., Nickel, M. M., et al. (2021). Dynamics of brain function in patients with chronic pain assessed by microstate analysis of resting-state electroencephalography. Pain 162, 2894–2908. doi: 10.1097/j.pain.0000000000002281
McCormack, A., Edmondson-Jones, M., Somerset, S., and Hall, D. (2016). A systematic review of the reporting of tinnitus prevalence and severity. Hear. Res. 337, 70–79. doi: 10.1016/j.heares.2016.05.009
Meyer, M., Luethi, M. S., Neff, P., Langer, N., and Büchi, S. (2014). Disentangling tinnitus distress and tinnitus presence by means of EEG power analysis. Neural Plast. 2014, 1–13. doi: 10.1155/2014/468546
Michel, C. M., and Koenig, T. (2018). EEG microstates as a tool for studying the temporal dynamics of whole-brain neuronal networks: a review. NeuroImage 180, 577–593. doi: 10.1016/j.neuroimage.2017.11.062
Miller, K. J., Schalk, G., Fetz, E. E., den Nijs, M., Ojemann, J. G., and Rao, R. P. (2010). Cortical activity during motor execution, motor imagery, and imagery-based online feedback. Proc. Natl. Acad. Sci. U. S. A. 107, 4430–4435. doi: 10.1073/pnas.0913697107
Milz, P., Faber, P. L., Lehmann, D., Koenig, T., Kochi, K., and Pascual-Marqui, R. D. (2016). The functional significance of EEG microstates—associations with modalities of thinking. NeuroImage 125, 643–656. doi: 10.1016/j.neuroimage.2015.08.023
Mohan, A., De Ridder, D., and Vanneste, S. (2016). Graph theoretical analysis of brain connectivity in phantom sound perception. Sci. Rep. 6:19683. doi: 10.1038/srep19683
Mohan, A., De Ridder, D., and Vanneste, S. (2017). Robustness and dynamicity of functional networks in phantom sound. NeuroImage 146, 171–187. doi: 10.1016/j.neuroimage.2016.04.033
Müller, N., Keil, J., Obleser, J., Schulz, H., Grunwald, T., Bernays, R. L., et al. (2013). You can't stop the music: reduced auditory alpha power and coupling between auditory and memory regions facilitate the illusory perception of music during noise. NeuroImage 79, 383–393. doi: 10.1016/j.neuroimage.2013.05.001
Murray, M. M., Brunet, D., and Michel, C. M. (2008). Topographic ERP analyses: a step-by-step tutorial review. Brain Topogr. 20, 249–264. doi: 10.1007/s10548-008-0054-5
Musaeus, C. S., Nielsen, M. S., and Høgh, P. (2019). Microstates as disease and progression markers in patients with mild cognitive impairment. Front. Neurosci. 13:563. doi: 10.3389/fnins.2019.00563
Musso, F., Brinkmeyer, J., Mobascher, A., Warbrick, T., and Winterer, G. (2010). Spontaneous brain activity and EEG microstates. A novel EEG/fMRI analysis approach to explore resting-state networks. NeuroImage 52, 1149–1161. doi: 10.1016/j.neuroimage.2010.01.093
Neff, P., Michels, J., Meyer, M., Schecklmann, M., Langguth, B., and Schlee, W. (2017). 10 Hz amplitude modulated sounds induce short-term tinnitus suppression. Front. Aging Neurosci. 9:130. doi: 10.3389/fnagi.2017.00130
Neff, P., Zielonka, L., Meyer, M., Langguth, B., Schecklmann, M., and Schlee, W. (2019). Comparison of amplitude modulated sounds and pure tones at the tinnitus frequency: residual tinnitus suppression and stimulus evaluation. Trends Hear 23:1983384. doi: 10.1177/2331216519833841
Niedermeyer, E., and da Silva, F. L. (2005). Electroencephalography: Basic principles, clinical applications, and related fields Lippincott Williams & Wilkins.
Nishida, K., Morishima, Y., Yoshimura, M., Isotani, T., Irisawa, S., Jann, K., et al. (2013). EEG microstates associated with salience and frontoparietal networks in frontotemporal dementia, schizophrenia and Alzheimer’s disease. Clin. Neurophysiol. 124, 1106–1114. doi: 10.1016/j.clinph.2013.01.005
Nunez, P. L. (1981). Electric fields of the brain: the neurophysics of EEG. USA: Oxford University Press.
Nunez, P. L., and Srinivasan, R. (2006). Electric fields of the brain: The neurophysics of EEG. Oxford: Oxford University Press.
Oiticica, J., and Bittar, R. S. M. (2015). Tinnitus prevalence in the city of São Paulo. Braz. J. Otorhinolaryngol. 81, 167–176. doi: 10.1016/j.bjorl.2014.12.004
Okamoto, H., Stracke, H., Stoll, W., and Pantev, C. (2010). Listening to tailor-made notched music reduces tinnitus loudness and tinnitus-related auditory cortex activity. Proc. Natl. Acad. Sci. U. S. A. 107, 1207–1210. doi: 10.1073/pnas.0911268107
Ortmann, M., Müller, N., Schlee, W., and Weisz, N. (2011). Rapid increases of gamma power in the auditory cortex following noise trauma in humans. Eur. J. Neurosci. 33, 568–575. doi: 10.1111/j.1460-9568.2010.07542.x
Pal, A., Behari, M., Goyal, V., and Sharma, R. (2021). Study of EEG microstates in Parkinson’s disease: a potential biomarker? Cogn. Neurodyn. 15, 463–471. doi: 10.1007/s11571-020-09643-0
Pantev, C., Okamoto, H., and Teismann, H. (2012). Music-induced cortical plasticity and lateral inhibition in the human auditory cortex as foundations for tonal tinnitus treatment. Front. Syst. Neurosci. 6:50. doi: 10.3389/fnsys.2012.00050
Pantev, C., Rudack, C., Stein, A., Wunderlich, R., Engell, A., Lau, P., et al. (2014). Study protocol: münster tinnitus randomized controlled clinical trial-2013 based on tailor-made notched music training (TMNMT). BMC Neurol. 14, 1–8. doi: 10.1186/1471-2377-14-40
Papanicolaou, A. C. (2009). Clinical magnetoencephalography and magnetic source imaging. Cambridge: Cambridge University Press.
Pape, J., Paraskevopoulos, E., Bruchmann, M., Wollbrink, A., Rudack, C., and Pantev, C. (2014). Playing and listening to tailor-made notched music: cortical plasticity induced by unimodal and multimodal training in tinnitus patients. Neural Plast. 2014, 1–10. doi: 10.1155/2014/516163
Pascual-Marqui, R. D., Michel, C. M., and Lehmann, D. (1995). Segmentation of brain electrical activity into microstates: model estimation and validation. IEEE Trans. Biomed. Eng. 42, 658–665. doi: 10.1109/10.391164
Peng, A., Wang, R., Huang, J., Wu, H., and Chen, L. (2021). Abnormalities of resting-state electroencephalographic microstate in rapid eye movement sleep behavior disorder. Front. Hum. Neurosci. 15:728405. doi: 10.3389/fnhum.2021.728405
Pink, A. E., Williams, C., Alderman, N., and Stoffels, M. (2021). The use of repetitive transcranial magnetic stimulation (rTMS) following traumatic brain injury (TBI): a scoping review. Neuropsychol. Rehabil. 31, 479–505. doi: 10.1080/09602011.2019.1706585
Pipinis, E., Melynyte, S., Koenig, T., Jarutyte, L., Linkenkaer-Hansen, K., Ruksenas, O., et al. (2017). Association between resting-state microstates and ratings on the Amsterdam resting-state questionnaire. Brain Topogr. 30, 245–248. doi: 10.1007/s10548-016-0522-2
Prete, G., Croce, P., Zappasodi, F., Tommasi, L., and Capotosto, P. (2022). Exploring brain activity for positive and negative emotions by means of EEG microstates. Sci. Rep. 12:3404. doi: 10.1038/s41598-022-07403-0
Qin, X., Xiong, J., Cui, R., Zou, G., Long, C., and Lei, X. (2022). EEG microstate temporal dynamics predict depressive symptoms in college students. Brain Topogr. 35, 481–494. doi: 10.1007/s10548-022-00905-0
Reavis, K. M., Rothholtz, V. S., Tang, Q., Carroll, J. A., Djalilian, H., and Zeng, F. G. (2012). Temporary suppression of tinnitus by modulated sounds. J. Assoc. Res. Otolaryngol. 13, 561–571. doi: 10.1007/s10162-012-0331-6
Rihs, T. A., Michel, C. M., and Thut, G. (2007). Mechanisms of selective inhibition in visual spatial attention are indexed by α-band EEG synchronization. Eur. J. Neurosci. 25, 603–610. doi: 10.1111/j.1460-9568.2007.05278.x
Roberts, L. E. (2007). Residual inhibition. Prog. Brain Res. 166, 487–495. doi: 10.1016/S0079-6123(07)66047-6
Roberts, L. E., Moffat, G., Baumann, M., Ward, L. M., and Bosnyak, D. J. (2008). Residual inhibition functions overlap tinnitus spectra and the region of auditory threshold shift. J. Assoc. Res. Otolaryngol. 9, 417–435. doi: 10.1007/s10162-008-0136-9
Roberts, L. E., Moffat, G., and Bosnyak, D. J. (2006). Residual inhibition functions in relation to tinnitus spectra and auditory threshold shift. Acta Otolaryngol. 126, 27–33. doi: 10.1080/03655230600895358
Santos, A. D. H. M., Santos, A. P. S., Santos, H. S., and Silva, A. C. D. (2018). The use of tDCS as a therapeutic option for tinnitus: a systematic review. Braz. J. Otorhinolaryngol. 84, 653–659. doi: 10.1016/j.bjorl.2018.02.003
Schlegel, F., Lehmann, D., Faber, P. L., Milz, P., and Gianotti, L. R. (2012). EEG microstates during resting represent personality differences. Brain Topogr. 25, 20–26. doi: 10.1007/s10548-011-0189-7
Schoisswohl, S., Arnds, J., Schecklmann, M., Langguth, B., Schlee, W., and Neff, P. (2020). Amplitude modulated noise for tinnitus suppression in tonal and noise-like tinnitus. Audiol. Neurotol. 24, 309–321. doi: 10.1159/000504593
Schulz, H., Übelacker, T., Keil, J., Müller, N., and Weisz, N. (2014). Now I am ready—now I am not: the influence of pre-TMS oscillations and corticomuscular coherence on motor-evoked potentials. Cereb. Cortex 24, 1708–1719. doi: 10.1093/cercor/bht024
Sedley, W., Gander, P. E., Kumar, S., Oya, H., Kovach, C. K., Nourski, K. V., et al. (2015). Intracranial mapping of a cortical tinnitus system using residual inhibition. Curr. Biol. 25, 1208–1214. doi: 10.1016/j.cub.2015.02.075
Sedley, W., Teki, S., Kumar, S., Barnes, G. R., Bamiou, D. E., and Griffiths, T. D. (2012). Single-subject oscillatory gamma responses in tinnitus. Brain 135, 3089–3100. doi: 10.1093/brain/aws220
Seitzman, B. A., Abell, M., Bartley, S. C., Erickson, M. A., Bolbecker, A. R., and Hetrick, W. P. (2017). Cognitive manipulation of brain electric microstates. NeuroImage 146, 533–543. doi: 10.1016/j.neuroimage.2016.10.002
Skrandies, W. (1990). Global field power and topographic similarity. Brain Topogr. 3, 137–141. doi: 10.1007/BF01128870
Song, J. J., Vanneste, S., Schlee, W., Van de Heyning, P., and De Ridder, D. (2015). Onset-related differences in neural substrates of tinnitus-related distress: the anterior cingulate cortex in late-onset tinnitus, and the frontal cortex in early-onset tinnitus. Brain Struct. Funct. 220, 571–584. doi: 10.1007/s00429-013-0648-x
Spreng, R. N., Sepulcre, J., Turner, G. R., Stevens, W. D., and Schacter, D. L. (2013). Intrinsic architecture underlying the relations among the default, dorsal attention, and frontoparietal control networks of the human brain. J. Cogn. Neurosci. 25, 74–86. doi: 10.1162/jocn_a_00281
Spreng, R. N., Stevens, W. D., Chamberlain, J. P., Gilmore, A. W., and Schacter, D. L. (2010). Default network activity, coupled with the frontoparietal control network, supports goal-directed cognition. NeuroImage 53, 303–317. doi: 10.1016/j.neuroimage.2010.06.016
Stein, A., Engell, A., Junghoefer, M., Wunderlich, R., Lau, P., Wollbrink, A., et al. (2015a). Inhibition-induced plasticity in tinnitus patients after repetitive exposure to tailor-made notched music. Clin. Neurophysiol. 126, 1007–1015. doi: 10.1016/j.clinph.2014.08.017
Stein, A., Engell, A., Lau, P., Wunderlich, R., Junghoefer, M., Wollbrink, A., et al. (2015b). Enhancing inhibition-induced plasticity in tinnitus–spectral energy contrasts in tailor-made notched music matter. PLoS One 10:e0126494. doi: 10.1371/journal.pone.0126494
Stein, A., Wunderlich, R., Lau, P., Engell, A., Wollbrink, A., Shaykevich, A., et al. (2016). Clinical trial on tonal tinnitus with tailor-made notched music training. BMC Neurol. 16, 1–17. doi: 10.1186/s12883-016-0558-7
Steriade, M. (2006). Grouping of brain rhythms in corticothalamic systems. Neuroscience 137, 1087–1106. doi: 10.1016/j.neuroscience.2005.10.029
Stevens, A., and Kircher, T. (1998). Cognitive decline unlike normal aging is associated with alterations of EEG temporo-spatial characteristics. Eur. Arch. Psychiatry Clin. Neurosci. 248, 259–266. doi: 10.1007/s004060050047
Strauss, D. J., Corona-Strauss, F. I., Seidler, H., Haab, L., and Hannemann, R. (2017). Notched environmental sounds: a new hearing aid-supported tinnitus treatment evaluated in 20 patients. Clin. Otolaryngol. 42, 172–175. doi: 10.1111/coa.12575
Tait, L., Tamagnini, F., Stothart, G., Barvas, E., Monaldini, C., Frusciante, R., et al. (2020). EEG microstate complexity for aiding early diagnosis of Alzheimer’s disease. Sci. Rep. 10, 1–10. doi: 10.1038/s41598-020-74790-7
Tass, P. A., Adamchic, I., Freund, H. J., Von Stackelberg, T., and Hauptmann, C. (2012). Counteracting tinnitus by acoustic coordinated reset neuromodulation. Restor. Neurol. Neurosci. 30, 137–159. doi: 10.3233/RNN-2012-110218
Teismann, H., Okamoto, H., and Pantev, C. (2011). Short and intense tailor-made notched music training against tinnitus: the tinnitus frequency matters. PLoS One 6:e24685. doi: 10.1371/journal.pone.0024685
Teismann, H., Wollbrink, A., Okamoto, H., Schlaug, G., Rudack, C., and Pantev, C. (2014). Combining transcranial direct current stimulation and tailor-made notched music training to decrease tinnitus-related distress–a pilot study. PLoS One 9:e89904. doi: 10.1371/journal.pone.0089904
Tian, L., Wang, J., Yan, C., and He, Y. (2011). Hemisphere-and gender-related differences in small-world brain networks: a resting-state functional MRI study. NeuroImage 54, 191–202. doi: 10.1016/j.neuroimage.2010.07.066
Tibshirani, R., and Walther, G. (2005). Cluster validation by prediction strength. J. Comput. Graph. Stat. 14, 511–528. doi: 10.1198/106186005X59243
Trakolis, L., Ebner, F. H., Machetanz, K., Sandritter, J., Tatagiba, M., and Naros, G. (2018). Postoperative tinnitus after vestibular schwannoma surgery depends on preoperative tinnitus and both pre-and postoperative hearing function. Front. Neurol. 9:136. doi: 10.3389/fneur.2018.00136
Tunkel, D. E., Bauer, C. A., Sun, G. H., Rosenfeld, R. M., Chandrasekhar, S. S., Cunningham, E. R. Jr., et al. (2014). Clinical practice guideline: tinnitus. Otolaryngol. Head Neck Surg. 151, S1–S40.
Tyler, R. S., Conrad-Armes, D., and Smith, P. A. (1984). Postmasking effects of sensorineural tinnitus: a preliminary investigation. J. Speech Lang. Hear. Res. 27, 466–474. doi: 10.1044/jshr.2703.466
Tyler, R., Stocking, C., Secor, C., and Slattery, W. H. III (2014). Amplitude modulated S-tones can be superior to noise for tinnitus reduction. Am. J. Audiol. 23, 303–308. doi: 10.1044/2014_AJA-14-0009
Uchida, S., Maloney, T., March, J. D., Azari, R., and Feinberg, I. (1991). Sigma (12–15 Hz) and delta (0.3–3 Hz) EEG oscillate reciprocally within NREM sleep. Brain Res. Bull. 27, 93–96. doi: 10.1016/0361-9230(91)90286-S
Uddin, L. Q., Yeo, B. T., and Spreng, R. N. (2019). Towards a universal taxonomy of macro-scale functional human brain networks. Brain Topogr. 32, 926–942. doi: 10.1007/s10548-019-00744-6
Van de Ville, D., Britz, J., and Michel, C. M. (2010). EEG microstate sequences in healthy humans at rest reveal scale-free dynamics. Proc. Natl. Acad. Sci. U. S. A 107, 18179–18184. doi: 10.1073/pnas.1007841107
van Der Loo, E., Gais, S., Congedo, M., Vanneste, S., Plazier, M., Menovsky, T., et al. (2009). Tinnitus intensity dependent gamma oscillations of the contralateral auditory cortex. PLoS One 4:e7396. doi: 10.1371/journal.pone.0007396
Vanneste, S., and De Ridder, D. (2011). Bifrontal transcranial direct current stimulation modulates tinnitus intensity and tinnitus-distress-related brain activity. Eur. J. Neurosci. 34, 605–614. doi: 10.1111/j.1460-9568.2011.07778.x
Vanneste, S., and De Ridder, D. (2012a). The use of alcohol as a moderator for tinnitus-related distress. Brain Topogr. 25, 97–105. doi: 10.1007/s10548-011-0191-0
Vanneste, S., and De Ridder, D. (2012b). The auditory and non-auditory brain areas involved in tinnitus. An emergent property of multiple parallel overlapping subnetworks. Front. Syst. Neurosci. 6:31. doi: 10.3389/fnsys.2012.00031
Vanneste, S., Plazier, M., Van Der Loo, E., Van de Heyning, P., Congedo, M., and De Ridder, D. (2010). The neural correlates of tinnitus-related distress. NeuroImage 52, 470–480. doi: 10.1016/j.neuroimage.2010.04.029
Vanneste, S., To, W. T., and de Ridder, D. (2019). Tinnitus and neuropathic pain share a common neural substrate in the form of specific brain connectivity and microstate profiles. Prog. Neuro-Psychopharmacol. Biol. Psychiatry 88, 388–400. doi: 10.1016/j.pnpbp.2018.08.015
Vanneste, S., van Dongen, M., De Vree, B., Hiseni, S., van der Velden, E., Strydis, C., et al. (2013). Does enriched acoustic environment in humans abolish chronic tinnitus clinically and electrophysiologically? A double blind placebo controlled study. Hear. Res. 296, 141–148. doi: 10.1016/j.heares.2012.10.003
Von Stein, A., and Sarnthein, J. (2000). Different frequencies for different scales of cortical integration: from local gamma to long range alpha/theta synchronization. Int. J. Psychophysiol. 38, 301–313. doi: 10.1016/S0167-8760(00)00172-0
Wackermann, J., Lehmann, D., Michel, C. M., and Strik, W. K. (1993). Adaptive segmentation of spontaneous EEG map series into spatially defined microstates. Int. J. Psychophysiol. 14, 269–283. doi: 10.1016/0167-8760(93)90041-M
Wang, F., Hujjaree, K., and Wang, X. (2021). Electroencephalographic microstates in schizophrenia and bipolar disorder. Front. Psych. 12:638722. doi: 10.3389/fpsyt.2021.638722
Wang, T. C., Tyler, R. S., Chang, T. Y., Chen, J. C., Lin, C. D., Chung, H. K., et al. (2018). Effect of transcranial direct current stimulation in patients with tinnitus: a meta-analysis and systematic review. Ann. Otol. Rhinol. Laryngol. 127, 79–88. doi: 10.1177/0003489417744317
Weisz, N., Moratti, S., Meinzer, M., Dohrmann, K., and Elbert, T. (2005). Tinnitus perception and distress is related to abnormal spontaneous brain activity as measured by magnetoencephalography. PLoS Med. 2:e153. doi: 10.1371/journal.pmed.0020153
Weisz, N., Müller, S., Schlee, W., Dohrmann, K., Hartmann, T., and Elbert, T. (2007). The neural code of auditory phantom perception. J. Neurosci. 27, 1479–1484. doi: 10.1523/JNEUROSCI.3711-06.2007
Xu, X., Yuan, H., and Lei, X. (2016). Activation and connectivity within the default mode network contribute independently to future-oriented thought. Sci. Rep. 6:21001. doi: 10.1038/srep21001
Yakunina, N., and Nam, E. C. (2021). Direct and transcutaneous vagus nerve stimulation for treatment of tinnitus: a scoping review. Front. Neurosci. 15:680590. doi: 10.3389/fnins.2021.680590
Yan, D., Liu, J., Liao, M., Liu, B., Wu, S., Li, X., et al. (2021). Prediction of clinical outcomes with EEG microstate in patients with major depressive disorder. Front. Psych. 12:695272. doi: 10.3389/fpsyt.2021.695272
Yu, J., Meng, F., He, F., Chen, F., Bao, W., Yu, Y., et al. (2021). Metabolic abnormalities in patients with chronic disorders of consciousness. Aging Dis. 12, 386–403. doi: 10.14336/AD.2020.0812
Yuan, H., Zotev, V., Phillips, R., Drevets, W. C., and Bodurka, J. (2012). Spatiotemporal dynamics of the brain at rest—exploring EEG microstates as electrophysiological signatures of BOLD resting state networks. NeuroImage 60, 2062–2072. doi: 10.1016/j.neuroimage.2012.02.031
Zanesco, A. P., Denkova, E., and Jha, A. P. (2021). Self-reported mind wandering and response time variability differentiate prestimulus electroencephalogram microstate dynamics during a sustained attention task. J. Cogn. Neurosci. 33, 28–45. doi: 10.1162/jocn_a_01636
Zhang, S., Tian, S., Chattun, M. R., Tang, H., Yan, R., Bi, K., et al. (2018). A supplementary functional connectivity microstate attached to the default mode network in depression revealed by resting-state magnetoencephalography. Prog. Neuro-Psychopharmacol. Biol. Psychiatry 83, 76–85. doi: 10.1016/j.pnpbp.2018.01.006
Keywords: tinnitus, tailor-made notched music training, residual inhibition, EEG, spectral analysis, microstate
Citation: Zhu M and Gong Q (2023) EEG spectral and microstate analysis originating residual inhibition of tinnitus induced by tailor-made notched music training. Front. Neurosci. 17:1254423. doi: 10.3389/fnins.2023.1254423
Edited by:
Roozbeh Behroozmand, The University of Texas at Dallas, United StatesReviewed by:
Dominik Güntensperger, University of Bern, SwitzerlandCopyright © 2023 Zhu and Gong. This is an open-access article distributed under the terms of the Creative Commons Attribution License (CC BY). The use, distribution or reproduction in other forums is permitted, provided the original author(s) and the copyright owner(s) are credited and that the original publication in this journal is cited, in accordance with accepted academic practice. No use, distribution or reproduction is permitted which does not comply with these terms.
*Correspondence: Qin Gong, Z29uZ3FpbkBtYWlsLnRzaW5naHVhLmVkdS5jbg==
Disclaimer: All claims expressed in this article are solely those of the authors and do not necessarily represent those of their affiliated organizations, or those of the publisher, the editors and the reviewers. Any product that may be evaluated in this article or claim that may be made by its manufacturer is not guaranteed or endorsed by the publisher.
Research integrity at Frontiers
Learn more about the work of our research integrity team to safeguard the quality of each article we publish.