 Jing Teng
 Chunlin Mi
 Jian Shi
 Na Li
Na Li- 1School of Control and Computer Engineering, North China Electric Power University, Beijing, China
- 2Department of Hematology and Critical Care Medicine, The Third Xiangya Hospital of Central South University, Changsha, China
- 3Department of Radiology, The Third Xiangya Hospital of Central South University, Changsha, China
Brain diseases, including neurodegenerative diseases and neuropsychiatric diseases, have long plagued the lives of the affected populations and caused a huge burden on public health. Functional magnetic resonance imaging (fMRI) is an excellent neuroimaging technology for measuring brain activity, which provides new insight for clinicians to help diagnose brain diseases. In recent years, machine learning methods have displayed superior performance in diagnosing brain diseases compared to conventional methods, attracting great attention from researchers. This paper reviews the representative research of machine learning methods in brain disease diagnosis based on fMRI data in the recent three years, focusing on the most frequent four active brain disease studies, including Alzheimer's disease/mild cognitive impairment, autism spectrum disorders, schizophrenia, and Parkinson's disease. We summarize these 55 articles from multiple perspectives, including the effect of the size of subjects, extracted features, feature selection methods, classification models, validation methods, and corresponding accuracies. Finally, we analyze these articles and introduce future research directions to provide neuroimaging scientists and researchers in the interdisciplinary fields of computing and medicine with new ideas for AI-aided brain disease diagnosis.
1. Introduction
The brain is the most complicated and delicate biological organ in human cognition, which contains nearly 100 billion neurons with over 1,000 trillion synaptic connections between neurons (Koch and Laurent, 1999; Azevedo et al., 2009; Zhang, 2019). It processes various information humans obtain daily, regulates various bodily functions, and manages advanced activities such as emotion, movement, learning, and memory (Raji et al., 2009; Shoeibi et al., 2023). Due to the extremely fine biological structure of the brain, minor damage to its internal functions is highly likely to lead to diseases such as Alzheimer's disease (AD) (Tanveer et al., 2020), mild cognitive impairment (MCI) (Fathi et al., 2022), schizophrenia (SCZ) (Fathi et al., 2022), Parkinson's disease (PD) (Li and Li, 2022), autism spectrum disorders (ASD) (Moridian et al., 2022), and traumatic brain injury (Abdelrahman et al., 2022). Brain diseases, including neurodegenerative diseases and neuropsychiatric diseases, have long plagued the affected populations' lives and caused a huge burden on public health (Vardi and Merrick, 2008; Chen et al., 2022). However, there is currently no gold standard for diagnosing brain diseases worldwide due to the unclear pathogenesis of these diseases (de Lau and Breteler, 2006; Scheltens et al., 2016; Lord et al., 2018). Brain disease diagnosis mainly depends on the clinical symptom scores and doctors' experience in clinical practice, which is relatively subjective and inefficient, leading to some extent of misdiagnosis and omissions (Insel and Cuthbert, 2015; Wang et al., 2022a; Allely et al., 2023). How to accurately diagnose brain diseases has become a hot topic in many fields, such as psychology, medicine, and artificial intelligence.
Neuroimaging technologies, including functional magnetic resonance imaging (fMRI) (Logothetis, 2008), structural MRI (Wattjes, 2011), positron emission tomography (Nasrallah and Dubroff, 2013), diffusion tensor imaging (DTI) (Bihan et al., 2001), and electroencephalography (Mulkey et al., 2015), are important tools for studying and diagnosing brain diseases (Perrin et al., 2009; Abi-Dargham and Horga, 2016). Among many imaging modes, fMRI provides a new window for researchers to study dynamic brain activity observation and internal activation states (van den Heuvel and Pol, 2010). It detects the metabolic activity of the brain by measuring variations in blood flow and blood oxygen concentration, indirectly revealing distinctions in brain activity between patients and normal people, thereby providing new perspectives into the disease pathogenesis (Heeger and Ress, 2002; Slobounov et al., 2011; Birur et al., 2017). Researchers have proposed various imaging features based on fMRI in recent years to explore variations in brain function, such as the amplitude of low-frequency fluctuation (ALFF) (Zang et al., 2007), and regional homogeneity (ReHo) (Zang et al., 2004). These imaging metrics have different characteristics and advantages, and their emergence and development can help understand diseases' neurophysiological mechanisms from multiple perspectives.
Researching AI-assisted diagnosis algorithms for brain diseases can alleviate the supply and demand contradiction between the limited number of doctors with professional diagnostic qualifications and the increasing number of disease patients, which could also improve the accuracy of diagnosis and treatment. Based on fMRI data, researchers study potential differences between patients and healthy subjects by machine learning methods, which have been extensively adopted in researching brain diseases such as AD, SCZ, MCI, and ASD. Although machine learning-based studies for brain disease classification surged recently, a comprehensive and detailed review of these studies is lacking. We searched for articles published in the recent three years, from January 1, 2020, to March 1, 2023, through the keywords “machine learning," “fMRI," “brain disease," and “diagnosis" on the Web of Science. According to the title, abstract, and full-text content, 88 articles above the Journal Citation Reports Quartile 2 in the category were selected. According to the number of papers on brain diseases studied, the most frequent four active brain disease studies, including AD/MCI, ASD, PD, and SCZ, were selected, with a total of 55 papers. The general process for diagnosing brain diseases based on fMRI and machine learning is shown in Figure 1. We summarize the detailed information of these studies, such as data sources, dataset sizes, and extracted features in Table 1. Furthermore, the representative feature selection, machine learning, and evaluation methods are described in detail to help readers understand the benefits and usage of distinct methodologies. Finally, we summarize the current challenges and possible future research directions in this area, hoping to provide new perspectives for studying AI-aided diagnosis of brain diseases.
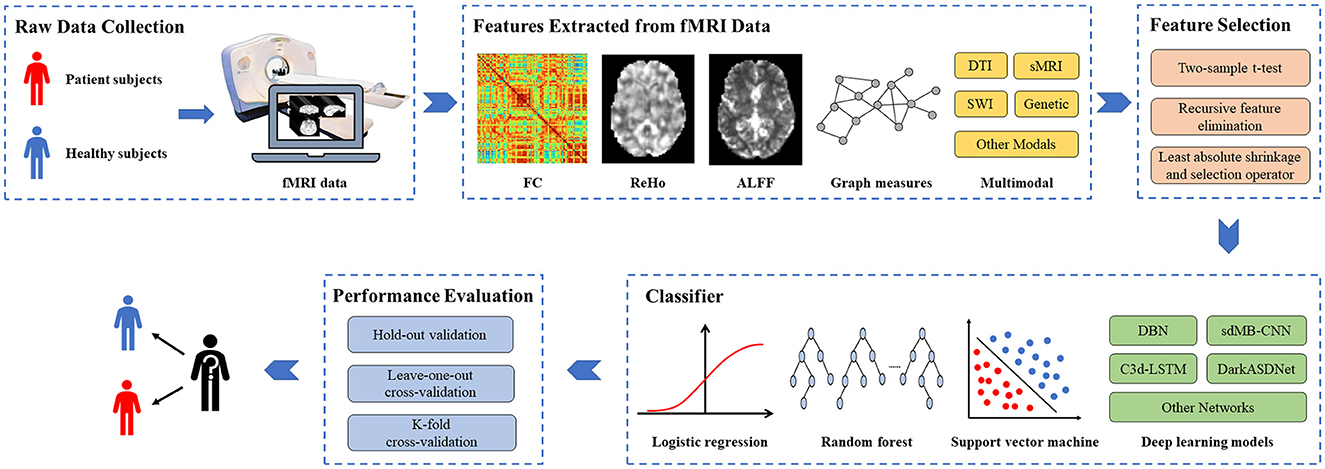
Figure 1. The general process for diagnosing brain diseases based on fMRI and machine learning. fMRI, functional magnetic resonance imaging; FC, functional connectivity; ReHo, Regional homogeneity; ALFF, Amplitude of low-frequency fluctuation; DTI, diffusion tensor imaging; sMRI, structural MRI; SWI, susceptibility-weighted imaging.
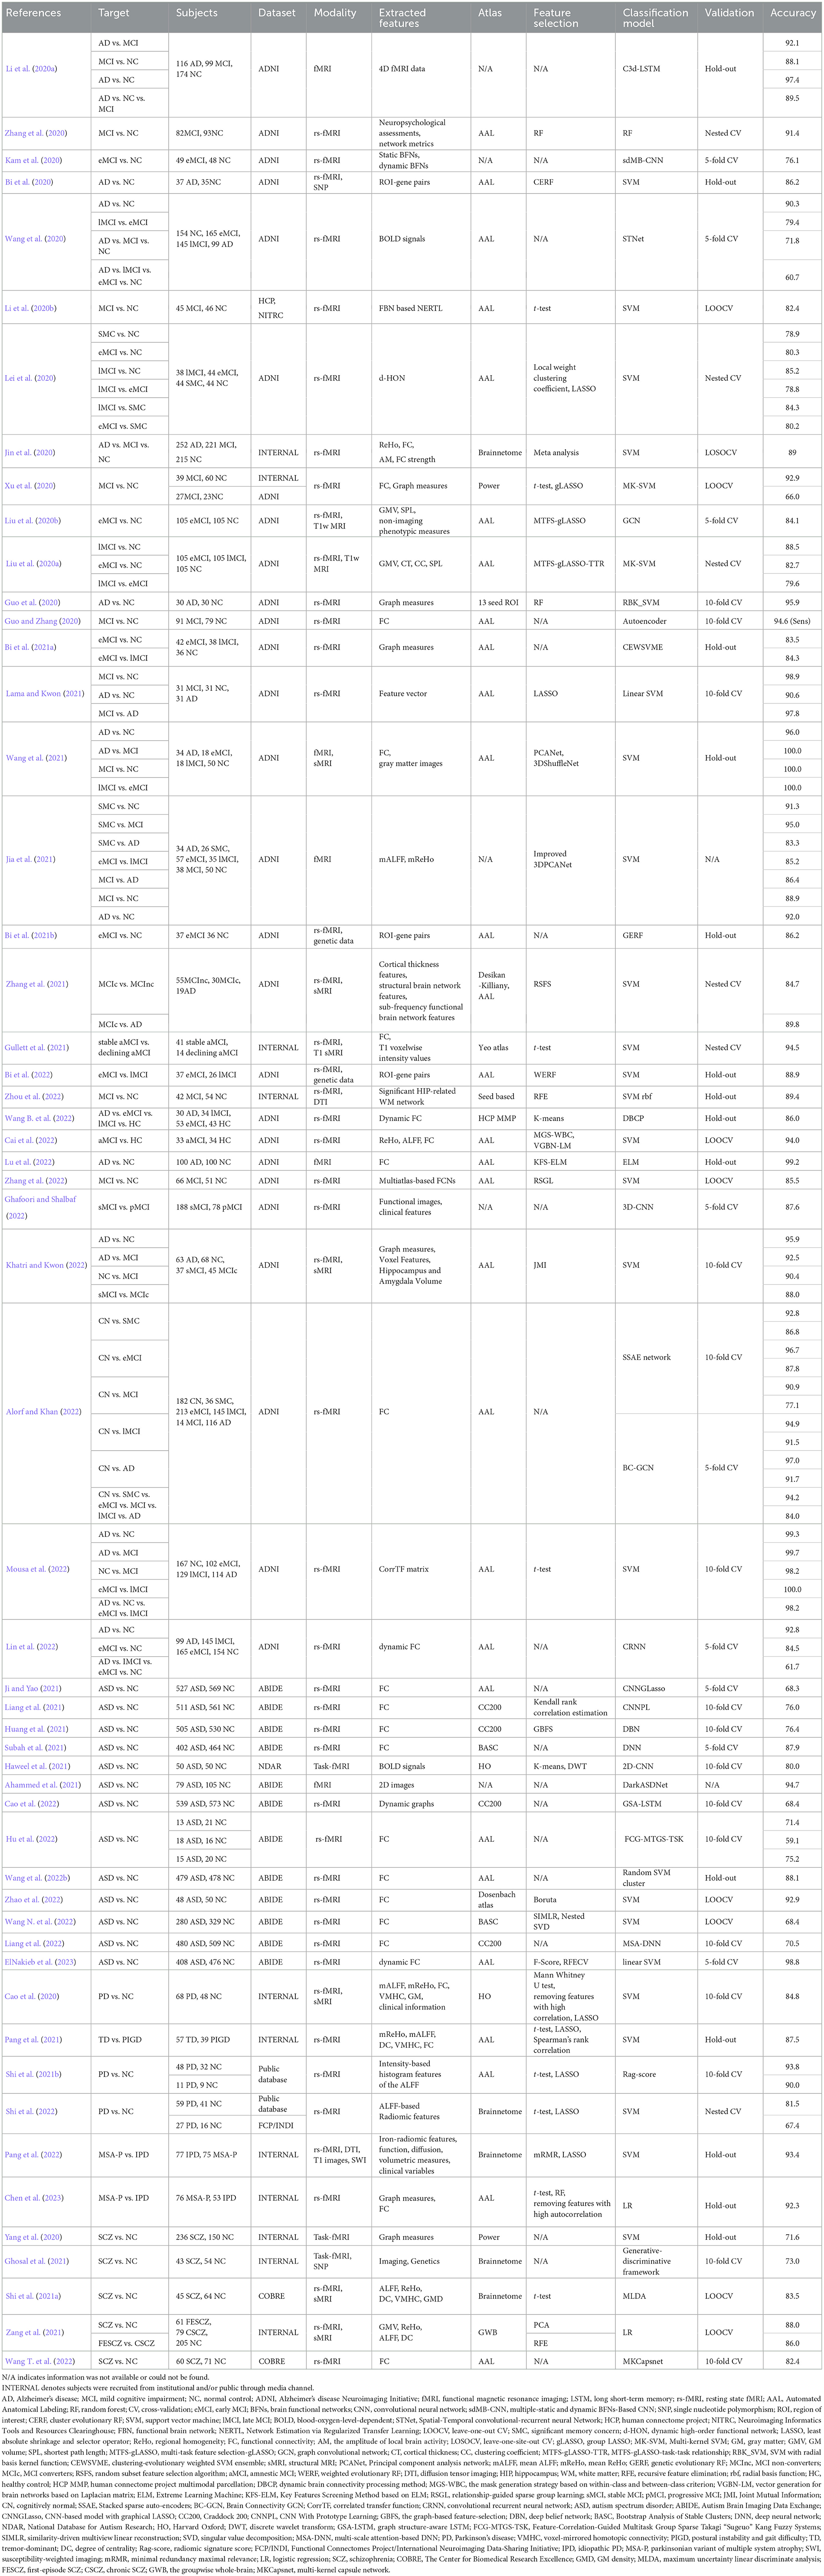
Table 1. Summary of research on the classification of brain diseases based on machine learning and functional magnetic resonance imaging data.
2. Features extracted from fMRI data
As can be seen from Figure 1, extracting features from fMRI data is a crucial step for diagnosing brain diseases based on machine learning. The extracted features include functional connectivity (FC), ReHo, ALFF, and graph measures. Besides, multimodal features, such as iron-radiomic features from susceptibility-weighted imaging (SWI) and diffusion from DTI, are also adopted for brain disease diagnosis. These features are important for improving model performance and exploring the biological mechanisms of brain function.
2.1. Functional connectivity
FC describes the degree of correlation between blood-oxygen-level-dependent (BOLD) time series in two different brain regions, which has been demonstrated to be a vital tool for revealing various disease mechanisms (Price et al., 2014). The brain atlas divides the entire brain into multiple regions of interest (ROI) based on functional or structural definitions. The average BOLD time series for all voxels within the ROI coordinate ranges represent the BOLD time series for each ROI. FC is mainly obtained by computing the Pearson correlation coefficient of the BOLD time series between paired ROIs. The calculation formula is as follows:
where Xi represents ith ROI time series, S is the standard deviation, cov is the covariance function, and M denotes the number of ROIs in the atlas. Based on the calculated FC value, a symmetric functional connectivity network is established, represented by FCN = [FC1, 1, FC1, 2, ⋯ , FC. The widely utilized atlas is the automatic anatomical labeling (AAL) atlas (Tzourio-Mazoyer et al., 2002; Guo and Zhang, 2020; Ji and Yao, 2021; Pang et al., 2021; Wang et al., 2021, 2022b; Alorf and Khan, 2022; Cai et al., 2022; Hu et al., 2022; Lu et al., 2022; Wang T. et al., 2022; Chen et al., 2023). Besides, FC can be constructed by other atlases, such as the Power atlas (Power et al., 2011; Xu et al., 2020), Craddock 200 atlas (Craddock et al., 2011; Huang et al., 2021; Liang et al., 2021, 2022), Bootstrap Analysis of Stable Clusters (Bellec et al., 2010; Subah et al., 2021; Wang N. et al., 2022), Brainnetome atlas (Fan et al., 2016; Jin et al., 2020), Yeo atlas (Yeo et al., 2011; Gullett et al., 2021), Harvard-Oxford atlas (Desikan et al., 2006; Cao et al., 2020), and Dosenbach atlas (Dosenbach et al., 2010; Zhao et al., 2022). In particular, Zhang et al. (2022) constructed multiple FCNs based on the selected set of the atlas from generated multiple personalized atlases from the AAL atlas to improve the diagnosis effect of MCI.
The above FC refers to the traditional static FC, which reveals the inherent similarity between a pair of ROIs or particular networks (Liu et al., 2021). Dynamic FC is mainly extracted from fMRI data based on the sliding window strategy, which is more helpful than static FC in understanding the basic dynamic characteristics of the human brain (Hutchison et al., 2013). For each subject with M ROIs, an appropriate size and a sliding step of the time window are set, then the time window is slid according to the step over the entire time series. Statistical correlation coefficients such as Pearson are used to calculate the FCN for each window. Continuous sliding and calculation can obtain a set of T FCNs. Dynamic FCN can be denoted as dFCN = [FCN1, FCN2,⋯ , FCNT] ∈ ℝT×M×M, where T is the number of overlapping windows. Lin et al. (2022) constructed dFCNs based on the sliding window strategy from resting state fMRI (rs-fMRI) data and extracted advanced features of dFCNs to classify brain disease by the proposed convolutional recurrent neural network. Wang B. et al. (2022) constructed dFCNs based on human connectivity project multimodal partitioning. Different from static FCN, dFCN can reveal more useful information for distinguishing between patients with brain diseases and healthy subjects. ElNakieb et al. (2023) proposed an enhanced version of dFCN, where correlation calculations consider temporal dynamics. The accuracy of the presented dFCN achieved 5% higher than traditional FCN. Kam et al. (2020) extracted static brain functional networks (BFNs) from rs-fMRI data by the Group Information Guided Independent Component Analysis method and generated dynamic BFNs based on seed association and sliding window strategy. The experimental results indicated that the simultaneous use of static BFNs and dynamic BFNs prioritizes using static BFNs alone, as dynamic BFNs provide additional time information for BFNs. Li et al. (2020a) obtained better functional brain network estimates based on regulated transfer learning to identify MCI patients from normal controls.
2.2. Regional homogeneity
ReHo is a major tool for detecting local neural synchronization (Xing et al., 2021). It reflects the consistency of regional brain activity by computing Kendall's coefficient of concordance between a specific voxel and its neighboring voxels (Zang et al., 2004; Pang et al., 2021). The calculation formula is defined as follows:
where t is the length of the BOLD time series, k is the number of local voxels studied, and ri, j represents the ranking level of a specific voxel j in the entire time series under the ith moment. Ri denotes the rank sum of k voxels at the ith moment. is the average value at all times. Mean ReHo (mReHo) is obtained by dividing the average ReHo value of the entire brain (Cao et al., 2020; Jia et al., 2021; Pang et al., 2021).
2.3. Amplitude of low-frequency fluctuation
ALFF is an effective fMRI data analysis tool widely used in various diseases to assess resting state activity in brain regions (Zhang et al., 2015; Pang et al., 2021; Zang et al., 2021; Cai et al., 2022). Firstly, the Fourier transform is performed on the time series of each voxel to obtain the frequency domain power spectrum. ALFF is obtained by calculating the square root of the power spectrum and taking the average value over a predefined frequency range (Zang et al., 2007). Mean ALFF (mALFF) is calculated by dividing the mean ALFF value of the entire brain (Cao et al., 2020; Jia et al., 2021; Pang et al., 2021). In addition, several researchers have broadened the range of brain disease classification characteristics from different perspectives. For example, Shi et al. (2021b) extracted intensity-based ALFF histogram features in 2021 to effectively discover regions of the brain with aberrant activity in PD patients. In 2022, Shi et al. (2022) extracted radiological features based on ALFF for the classification study of PD, providing further support for interpreting the PD's pathological mechanism.
2.4. Graph measures
As a branch of discrete mathematics, graph theory is frequently employed in network analysis of diverse brain diseases (Farahani et al., 2019; Hallquist and Hillary, 2019; Guo et al., 2020; Yang et al., 2020). The vertices V and edges E are the two most important concepts in constructing the graph G(V, E). Based on graph theory, the ROIs are regarded as vertices V and the connections between ROIs as edges E, thereby constructing a brain network graph for complex brain network analysis.
The metrics in complex brain network analysis mainly include nodal and global measures. Nodal measures characterize the nodal behavior of a network, such as the nodal shortest path length L(i), betweenness centrality BC(i), nodal local efficiency Eloc(i), nodal efficiency Enodal(i), and nodal clustering coefficient C(i) (Freeman, 1977; Watts and Strogatz, 1998; Latora and Marchiori, 2001; Xu et al., 2020). Global measures indicators reflect the overall network organization, such as clustering coefficient CP, characteristic path length LP, small-worldness σ, local efficiency Eloc, and global efficiency Eglob (Watts and Strogatz, 1998; Latora and Marchiori, 2001; Rubinov and Sporns, 2010). Table 2 summarizes the definitions of these nodal and global measures.
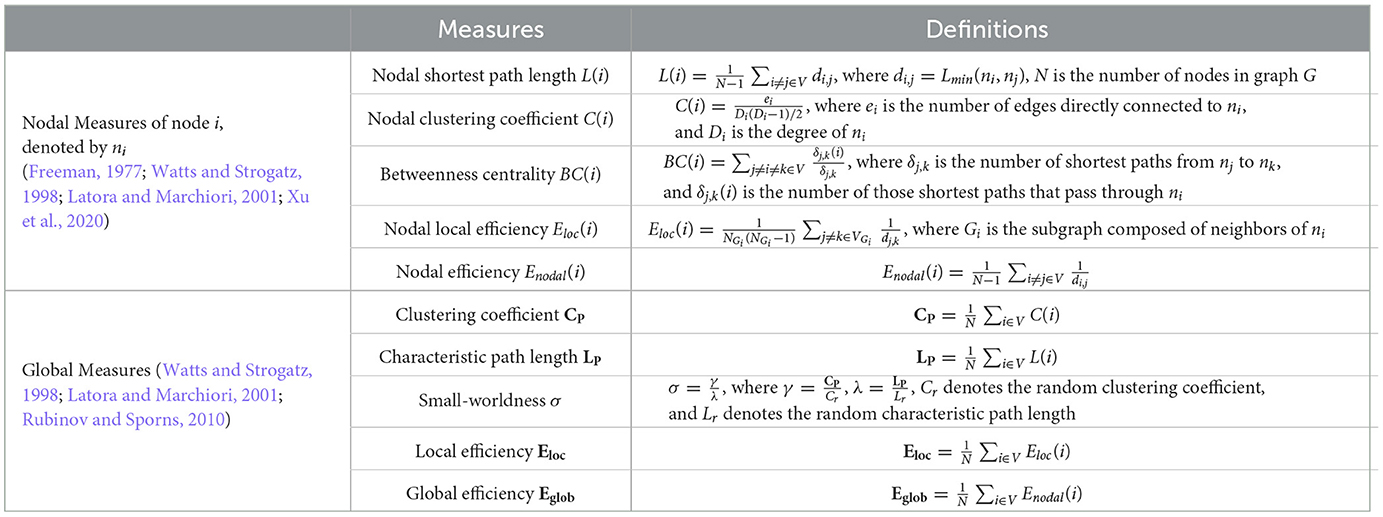
Table 2. The definitions of common nodal and global measures.
2.5. Multimodal
Some researchers diagnose disease by comprehensive classification features, integrating more information from various features. For example, Pang et al. (2021) extracted indicators such as ReHo, ALFF, and FC as classification features to provide more comprehensive information on brain function change. Chen et al. (2023) constructed graph measures and FC from rs-fMRI data based on the AAL atlas to distinguish the Idiopathic PD (IPD) and the parkinsonian variant of multiple system atrophy (MSA-P). Jia et al. (2021) extracted mReHo and mALFF from the Brainnetome atlas to distinguish MCI and AD, achieving an accuracy of 86.4%. Ghafoori and Shalbaf (2022) utilized clinical features and functional images extracted from rs-fMRI data to distinguish stable MCI and progressive MCI, with an accuracy improvement of 1.9% compared to using only functional images.
In recent years, multimodal analysis has also been widely adopted in the research of brain diseases by fusing the features of imaging data such as fMRI, structural MRI (sMRI), and DTI to identify more consistent biomarkers and explore the relationship between different modes (Liu et al., 2020b; Zhang et al., 2021; Khatri and Kwon, 2022). Gullett et al. (2021) achieved 94.5% accuracy in classifying stable amnestic MCI (aMCI) and declining aMCI by combining rs-fMRI and T1 sMRI modalities, which is better than only one modality. Shi et al. distinguished SCZ and healthy control (HC) by integrating multimodal information, including fMRI and sMRI. The results revealed that the most discriminate regions between SCZs and HCs mainly locate in the 15 regions, such as the left superior parietal lobule (Shi et al., 2021a). Pang et al. (2022) distinguished IPD and MSA-P by extracting iron-radiomic features, function, diffusion, and volumetric measures from SWI, rs-fMRI, DTI, and T1-weighted imaging, which achieves an accuracy of 91.1%. The classification accuracy was improved to 93.4% by combing clinical variables into the multimodal model. Cao et al. (2020) established a PD diagnosis framework by incorporating relevant clinical features, whole-brain functional connectivity and activity, and gray matter structure, which achieved 84.8% accuracy. The results found that unique whole-brain functional activity and connectivity in PD are mainly located in five networks, such as the affective network. These studies indicated the potential of multimodal data fusion in the auxiliary diagnosis of PD patients.
The fusion of fMRI and genetic data is another research method for multimodal analysis. Using imaging and genetic data to identify biomarkers and classify diseases can help reveal the pathogenesis of diseases, which is of great significance for the development of computational medicine (Bi et al., 2020, 2022; Ghosal et al., 2021). Ghosal et al. (2021) extracted Imaging and Genetics features from task-fMRI and single nucleotide polymorphism to identify SCZ patients from 97 subjects. Bi et al. (2020) constructed ROI-gene pairs based on rs-fMRI and genes to classify early MCI (eMCI) and late MCI (lMCI) patients. The discovery of the most discriminating ROIs and risk genes can provide essential bases for pathological research in the development of MCI.
In addition to the commonly used classification features mentioned above, rs-fMRI time series, 4D fMRI data, and 2D images loaded from fMRI data can be directly used as classification features (Li et al., 2020a; Wang et al., 2020; Ahammed et al., 2021). In particular, Lama and Kwon (2021) adopted the Node2vec graph embedding method to convert brain networks into feature vectors as input to the model. Mousa et al. (2022) calculated the intensity time series of each region and extracted the correlation transfer function (CorrTF) matrix by the CorrTF. It is a promising biomarker for early AD recognition, helping clinicians discover and investigate the affected brain regions and their potential associations during AD development.
3. Feature selection
The dimension of the above-extracted features usually exceeds the total number of samples, leading to the dimensionality curse (Liu et al., 2021; Khatri and Kwon, 2022). In addition, processing numerous features may resulting model overfitting. The feature selection step aims to preserve the features with strong correlation, improve model performance and minimize the computing cost. It plays a crucial role in correlation analysis, which could explain the affection of brain regions on classification performance. The following briefly describes the three most frequently used feature selection algorithms in Table 1.
3.1. Two-sample t-test
The two-sample t-test is a filtered feature selection method to compare whether each feature mean of two independent sample sets has significant differences (Liu et al., 2018). Two-sample t-test requires two groups of samples to be independent of each other and subject to normal distribution. The calculation formula that satisfies homoscedasticity is as follows:
where and S1 represent the mean and standard deviation of each feature of the sample set, and n1 is the capacity of the sample set. The smaller the t value, the higher the significance level of the feature. The features are classified according to the calculated t value, and the features with weak discrimination ability are removed to improve the classifier's performance. Mousa et al. applied a t-test to select discriminative features between normal subjects and AD patients. Then they trained a support vector machine (SVM) with these features, achieving an accuracy of 99.3% (Mousa et al., 2022). Shi et al. (2021a) proposed a model obtaining an accuracy of 83.5%, which determined the different characteristics between the SCZ and health subjects by two-sample t-test and used maximum uncertainty linear discriminate analysis-based classifier.
3.2. Recursive feature elimination
Recursive feature elimination (RFE) is a wrapper feature selection approach that recursively reduces the size of the original feature set through multiple training rounds on a base model. SVM-RFE calculates the features' contribution to the model's classification performance by training SVM on the original feature set. Then, remove the features with small contributions and repeat the training process until the remaining features match the required number. Zhou et al. (2022) used the RFE to select and rank the features and revealed the pathological mechanism of MCI through the feature contribution ranking. Zang et al. (2021) reduced the dimensionality of features by RFE before the classification.
3.3. Least absolute shrinkage and selection operator
The least absolute shrinkage and selection operator (LASSO) is an embedded feature selection method, which is a least square method with an L1 penalty item (Hsu et al., 2008; Pang et al., 2021; Khatri and Kwon, 2022). LASSO calculates model coefficients β by minimizing the following functions:
where n is the total number of samples, yi is the category label of the ith subject, xij is the jth characteristic of the ith subject, βj represents the regression coefficient of the jth feature, and m is the feature dimension. α is a non-negative regularization parameter that aims to limit the sparsity of the model. When the bigger α is, the more βj is set to zero to achieve the purpose of feature selection to reduce unimportant features. Shi et al. (2021b) applied a t-test (P < 0.05) and LASSO to determine the characteristics that significantly differed between PD patients and healthy subjects. Cao et al. selected features using the Mann–Whitney U-test, pre-determined thresholds to screen for highly correlated variables, and LASSO. These selected features were then used to distinguish PD from healthy subjects (Cao et al., 2020).
4. Classifier
Based on the selected features, the classifier distinguishes patients and healthy subjects. The classification accuracies are greatly impacted by the classifiers, summarized in Table 1.
4.1. Logistic regression
Logistic regression (LR) is a common method to solve the binary classification problem, which judges the category of samples by comparing the relationship between decision boundaries and samples. Its main idea is to assume that the data obey a certain distribution and make parameter estimation according to the maximum likelihood estimation. Chen et al. (2023) combined a t-test with random forest (RF) to screen out the discriminative features and then distinguish the IPD and MSA-P subjects by LR, obtaining 92.31% accuracy.
4.2. Random forest
RF is an ensemble classification model based on the decision tree, which can process high-dimensional data without feature selection. It randomly deletes some features in decision tree training, then selects features with better classification ability through integrated learning to improve the overall performance. In addition, Bi et al. (2020, 2021b, 2022) optimized the traditional random forest and successively proposed the cluster evolutionary RF, genetic-evolutionary RF, and weighted evolutionary RF algorithms based on genetic data and rs-fMRI data. Improved models can dynamically delete irrelevant or redundant sample features to discover the disease-related risk genes and brain regions.
4.3. Support vector machine
SVM is a powerful supervised machine learning approach aiming to find a decision boundary in the high-dimensional space that can maximize the interval between two categories. SVM has good generalization and robustness, which has advantages in solving small data sets and over-fitting problems in learning. Yang et al. (2020) diagnosed 236 SCZ patients from 386 subjects by SVM, achieving an accuracy of 71.6%. Gullett et al. (2021) applied SVM to separate stable participants from those with the greatest marginal decline at follow-up with an accuracy of 94.5%. Shi et al. (2022) built SVM to distinguish PD patients from normal subjects, obtaining 81.5% accuracy on the initial training set containing 100 subjects. Furthermore, Bi et al. (2021a) proposed the evolutionary weighted SVM ensemble method to investigate the changes from normal subjects to eMCI to lMCI.
The selection of kernel function and kernel parameter is crucial to SVM's performance. Unlike traditional SVM, multiple kernel SVM (MK-SVM) trains SVM by the kernel that fuses multiple kernel functions. It can effectively learn features of multi-mode data and is more flexible than single-kernel SVM. For example, Liu et al. (2020b) combine structural and functional features by MK-SVM to complete the MCI classification task. Xu et al. (2020) adapted MK-SVM to combine multimodal information to effectively distinguish MCI and healthy subjects, and accuracy was achieved at 92.9%.
4.4. Deep learning models
Besides the classifiers mentioned above, deep learning models have also been extensively adopted in brain disease diagnosis. With powerful learning and analysis capabilities, deep learning models can automatically find the representation with strong recognition and directly learn the optimal strategy from the original data using hierarchical structures of varying complexity. For instance, Kam et al. (2020) presented a new convolutional neural network (CNN) framework sdMB-CNN, which extracts deep embedded characteristics from static and dynamic functional connectivity networks through 3D-CNN. Compared with traditional methods such as SVM, it significantly improves the diagnosis performance by nearly 10%. Wang et al. presented the multi-kernel capsule network considering the brain's anatomical structure. Set the kernel to match the brain's anatomical structure partition size to capture the connection between regions on different scales (Wang T. et al., 2022). Research shows that the capsule network is viable and prospective in diagnosing SCZ. To directly process 4D fMRI data, Li et al. (2020a) designed a C3d-LSTM for AD recognition, which integrated 3D-CNNs and a long short-term memory network to capture the spatial and time-varying information in the data. Huang et al. (2021) designed a graph-based classification model based on the deep belief network, which is more accurate and efficient than other advanced methods. Ahammed et al. (2021) proposed the DarkASDNet model, predicting the binary classification between ASD patients and normal subjects by 3D fMRI data, with a classification accuracy of 94.7%.
5. Performance evaluation
As shown in Figure 1, the performance evaluation is the final step in brain disease diagnosis. Larson (1931) proposed in the 1930s that training and evaluating the performance of models on the same data would yield overly optimistic results. Accordingly, cross-validation (CV) is proposed to avoid overfitting by testing the model on new data sets, which can extract as much effective information as possible from limited data.
5.1. Hold-out validation
Hold-out validation randomly divides the original data set into independent training and test set (Arlot and Celisse, 2010). This method is simple to operate and avoids the overfitting problems caused by traditional training and testing based on the same data. However, different partitioning methods lead to different results, requiring multiple grouping to ensure the stability and persuasiveness of the model's result. Zhou et al. (2022) evaluated the model's classification performance by the hold-out method. They divided 80% of the dataset into the training set and the rest into the testing set. The dataset was randomly divided by the same proportion for evaluation 100 times. The model acquired an average classification accuracy of 89.4%. Wang et al. (2022b) evaluated the model performance by dividing the dataset into a training set, a validation set, and a testing set at the percentage of 40%, 10%, and 50%, respectively. The hold-out validation was repeated 50 times in their study.
5.2. Leave-one-out cross-validation
Leave-one-out CV (LOOCV) is the most classical exhaustive CV method, which selects one sample from the original data set as the test data, and the remaining are training data (Arlot and Celisse, 2010; Xu et al., 2020; Cai et al., 2022; Zhao et al., 2022). The experimental data are not affected by random factors because almost all samples in each round are applied to train the model. To avoid the problem of overfitting, Cai et al. (2022) adopted the LOOCV method to estimate the model's classification performance on a dataset containing 67 subjects to overcome the problem of limited data. The obtained results of LOOCV are stable and reliable, ensuring the reproducibility of the experimental process. However, it is more excessive computational overhead than other CV methods, suitable for limited sample sets.
5.3. K-fold cross-validation
K-fold CV was presented by Geisser (1975) as an alternative to the computationally expensive LOOCV, which divides the dataset into k subsets of almost equal size. Each subset of data is tested once, and the rest k-1 subsets are used as training sets to obtain k models. Combine and analyze the classification accuracy of k models to obtain more stable and accurate model performance. The constant k is variable. When k is the total number of samples in the dataset, k-fold CV is equivalent to LOOCV. Under limited samples, k-fold CV is the simplest and most extensively adopted method for evaluating model performance (Kam et al., 2020; Ghosal et al., 2021; Khatri and Kwon, 2022; Lin et al., 2022).
6. Research summary
6.1. Functional magnetic resonance imaging data sources
The articles listed in Table 1 mainly come from two fMRI data sources: internal datasets collected by self or cooperative agencies and public data sets. The former typically come from the same location and have the same collection parameters. The latter often comes from data from different locations, inevitably bringing heterogeneity to the dataset regarding functional magnetic resonance scanners, data collection protocols, and participant population differences, making disease research and analysis more challenging (Ghiassian et al., 2016). However, public datasets typically contain more available data than internal datasets, which can accommodate the demands of more academics for large-scale database analysis. Table 3 summarizes the status of papers and related datasets for the top four brain diseases in the past three years, with 81.8% of the articles using public data. Of these, 90.3% of AD/MCI studies and 100% of ABIDE were conducted on public datasets, demonstrating that well-maintained databases can advance research technology.
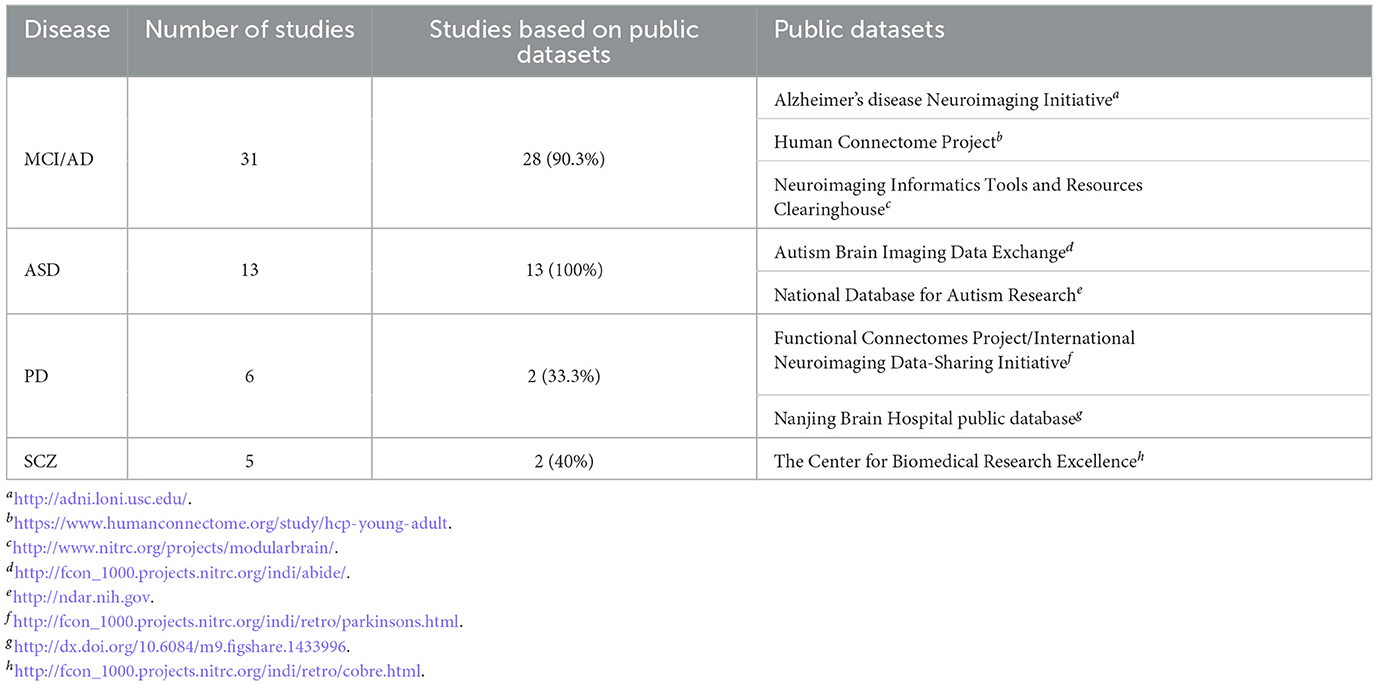
Table 3. Public dataset information and number of disease studies using public datasets.
6.2. Relationship between accuracy and sample size
Figure 2 shows the relationship between sample sizes and corresponding experimental accuracy. Among them, experiments with high accuracy (79.2% of experiments have an accuracy higher than 80%) are concentrated in the case of sample sizes less than 200 (60% of studies). It can be observed from Figure 2 that the overall trend of AD/MCI and SCZ is that accuracy declines with increasing sample size, which raises concerns about the generalization problem of small sample size research.
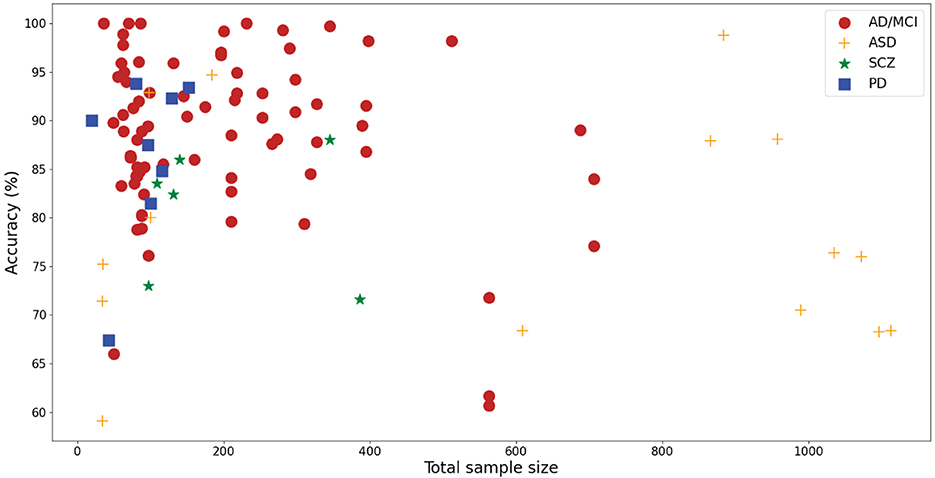
Figure 2. Scatter plot of the total sample size and reported accuracy.
6.3. Distribution of the total sample size
Figure 3 displays the histogram of the sample sizes of investigated papers, which clearly illustrates the relationship between the overall sample size and the number of studies. The red dashed line denotes the average, while the blue dashed line represents the median. As depicted in Figure 3, the conducted research in the survey mainly focuses on small sample datasets due to the difficulty in sample collection in clinical practice.
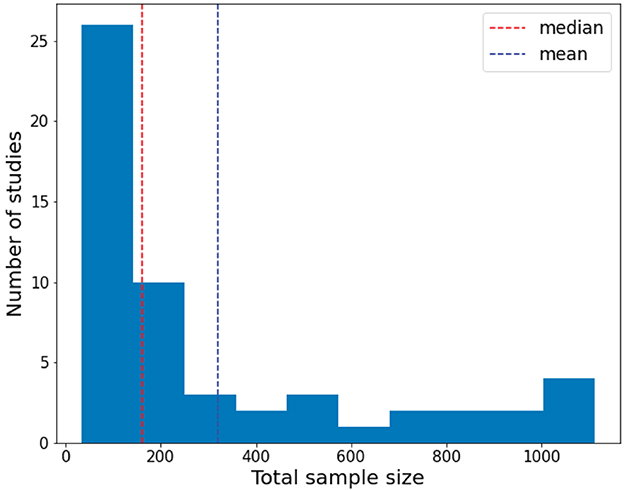
Figure 3. Distribution of the total sample size of the investigated papers.
6.4. Accuracy of each disease
Figure 4 shows a summary of statistical information on the overall accuracy of each disease report. The median accuracies of AD/MCI and PD studies exceed 85%. In contrast, the median accuracy of ASD is less than 80%. The median accuracy of SCZ is between 80 and 85.
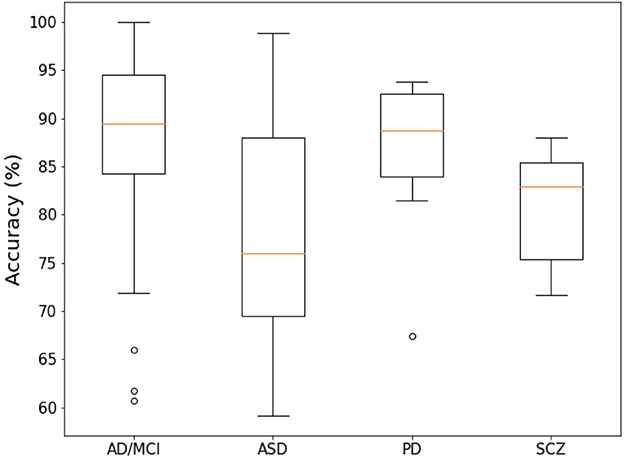
Figure 4. Box-plot of the overall accuracy of the report of the investigated papers.
6.5. Validation methods
Figure 5 shows the validation methods used in the papers. Regarding classifier verification methods, k-fold CV is the most commonly used method (accounting for 58.2%, 32/55 articles). Among them, the commonly used methods are LOOCV and 10-fold CV. Due to a lack of subjects, the hold-out scheme ranked second.
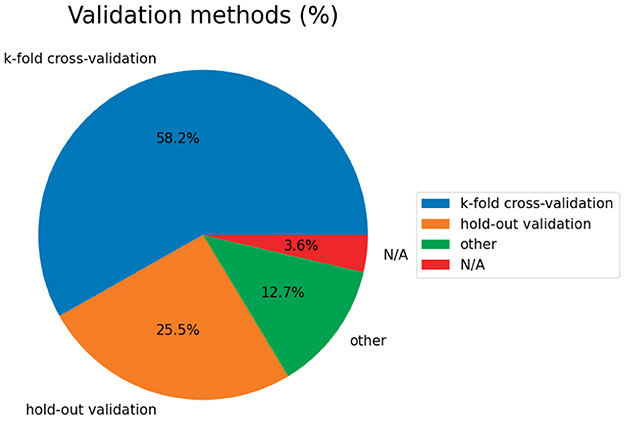
Figure 5. Validation methods of the surveyed studies.
7. Summary and future research directions
This article reviews 55 brain disease classification studies based on fMRI data and machine learning in the recent three years. We summarize in detail these studies' dataset information, extracted features from fMRI, feature selection approaches, classification methods, and overall accuracy. In addition, different feature selection strategies and representative machine learning models are introduced, which can help researchers choose appropriate methods for practical classification problems. A new advancement in the classification of brain diseases based on fMRI data has been realized thanks to the quick development of machine learning technologies. Here, we propose five directions that researchers need to focus on, which are expected to promote the development of the AI-aided diagnosis of brain diseases.
1) Explore specific machine-learning methods for fMRI
Generating new machine learning technologies for the specific characteristics of fMRI by integrating the advantages of distinct methods to improve existing methods. We attempt to design specific machine learning methods to gather more beneficial information, thereby better identifying reliable biomarkers and assisting clinicians in diagnosis.
2) The application of fuzzy technology
The uncertainty of fMRI data, introduced by the instability of data collection equipment, the complexity of brain disease pathophysiology, and the fuzziness in determining medical causes, raises a challenge for brain disease diagnosis. Fuzzy technology, which can deal with the uncertainty of knowledge and expression, has been extensively adopted in the medical field (Parveen and Singh, 2015; Baskar et al., 2018; Chowdhary et al., 2020; Hu et al., 2022). Parveen and Singh (2015) segmented MRI images by fuzzy c-means clustering (FCM) to detect suspicious regions. Baskar et al. (2018) identified NC, MCI, and AD by combining kernel FCM and backpropagation artificial neural networks, which can improve classification performance by removing suspicious training samples. A new classification model based on Takagi-Sugeno-Kang fuzzy inference systems for ASD is proposed by Hu et al. (2022), which has been proven advantageous in interpretability and accuracy. Diagnosing brain diseases based on fuzzy technology could be a promising direction.
3) Multiple-feature fusion
Many studies have shown that various indicators may be complementary in revealing changes in brain function and can provide more beneficial information. For example, Pang et al. (2021) extracted multiple indicators based on fMRI data, including FC, mReHo, mALFF, degree centrality, and voxel-mirrored homotopic connectivity to classify PD motion subtypes by SVM. The results show that the multi-layer index combination of rs-fMRI can further promote performance. Kam et al. (2020) extracted deep embedding characteristics from static and dynamic BFNs through a designed 3D-CNN framework. This extension method considers the subtle and complex (spatiotemporal) changes of each BFN in eMCI and can use deep embedding features well. The mutual complementation of static and dynamic BFNs information further improves the diagnostic accuracy of eMCI. As a result, multiple-feature fusion is a valuable direction for future research, which could enhance existing research results.
4) Multimodal data fusion
Fusing multimodal data has shown notable prospects in analyzing changes in brain function at the individual level. For example, Gullett et al. (2021) combined T1w MRI and rs-fMRI to predict the overall model accuracy of diagnostic changes in aMCI reached 94.5%, significantly better than the method using only single mode diagnosis. In order to explore the potential of sMRI and rs-fMRI in AD recognition, Khatri and Kwon (2022) utilized their combined features in their research to achieve maximum classification accuracy relative to a single feature. In addition, Bi et al. (2020) fused fMRI and gene features to investigate the association between brain regions and genes, offering novel insights for the early detection and clinicopathological analysis of eMCI. Deep learning has potential advantages in processing complex data. Effectively combining multimodal data with deep learning models to improve diagnostic accuracy is a direction worth exploring in the future.
5) Establish an interpretable network
Deep learning models can be more accurate for classifying and identifying diseases than machine learning. However, the lack of interpretability of deep learning models has restricted their application in the clinical field. Improving deep learning models to establish interpretable networks are more conducive to understanding the brain distinctions between patients and healthy subjects, thereby benefiting neuroscientists studying brain diseases in the future.
Author contributions
JT: supervision, conceptualization, and manuscript draft. CM: manuscript draft, conceptualization, and data analysis. JS: investigation. NL: investigation, data analysis, and manuscript draft. All authors listed have contributed substantially and directly to the article and approved it for publication.
Funding
This work was supported by the National Natural Science Foundation of China under Grant Nos. 61503137 and 61871181, the Fundamental Research Funds for the Central Universities under Grant No. 2020MS017, the Postdoctoral Science Foundation of China (2020TQ0364), and the Natural Science Foundation of Hunan (2020JJ5865).
Conflict of interest
The authors declare that the research was conducted in the absence of any commercial or financial relationships that could be construed as a potential conflict of interest.
Publisher's note
All claims expressed in this article are solely those of the authors and do not necessarily represent those of their affiliated organizations, or those of the publisher, the editors and the reviewers. Any product that may be evaluated in this article, or claim that may be made by its manufacturer, is not guaranteed or endorsed by the publisher.
References
Abdelrahman, H. A. F., Ubukata, S., Ueda, K., Fujimoto, G., Oishi, N., Aso, T., et al. (2022). Combining multiple indices of diffusion tensor imaging can better differentiate patients with traumatic brain injury from healthy subjects. Neuropsychiatr. Dis. Treat. 18, 1801–1814. doi: 10.2147/NDT.S354265
Abi-Dargham, A., and Horga, G. (2016). The search for imaging biomarkers in psychiatric disorders. Nat. Med. 22, 1248–1255. doi: 10.1038/nm.4190
Ahammed, M. S., Niu, S., Ahmed, M. R., Dong, J., Gao, X., Chen, Y., et al. (2021). DarkASDNet: classification of ASD on functional MRI using deep neural network. Front. Neuroinform. 15, 635657. doi: 10.3389/fninf.2021.635657
Allely, C. S., Woodhouse, E., and Mukherjee, R. A. (2023). Autism spectrum disorder and personality disorders: how do clinicians carry out a differential diagnosis? Autism 136236132311513. doi: 10.1177/13623613231151356
Alorf, A., and Khan, M. U. G. (2022). Multi-label classification of Alzheimer's disease stages from resting-state fMRI-based correlation connectivity data and deep learning. Comput. Biol. Med. 151, 106240. doi: 10.1016/j.compbiomed.2022.106240
Arlot, S., and Celisse, A. (2010). A survey of cross-validation procedures for model selection. Stat. Surv. 4, 40–79. doi: 10.1214/09-SS054
Azevedo, F. A., Carvalho, L. R., Grinberg, L. T., Farfel, J. M., Ferretti, R. E., Leite, R. E., et al. (2009). Equal numbers of neuronal and nonneuronal cells make the human brain an isometrically scaled-up primate brain. J. Comp. Neurol. 513, 532–541. doi: 10.1002/cne.21974
Baskar, D., Jayanthi, V. S., and Jayanthi, A. N. (2018). An efficient classification approach for detection of Alzheimer's disease from biomedical imaging modalities. Multimed. Tools Appl. 78, 12883–12915. doi: 10.1007/s11042-018-6287-8
Bellec, P., Rosa-Neto, P., Lyttelton, O. C., Benali, H., and Evans, A. C. (2010). Multi-level bootstrap analysis of stable clusters in resting-state fMRI. Neuroimage 51, 1126–1139. doi: 10.1016/j.neuroimage.2010.02.082
Bi, X., Hu, X., Wu, H., and Wang, Y. (2020). Multimodal data analysis of Alzheimer's disease based on clustering evolutionary random forest. IEEE J. Biomed. Health Inf. 24, 2973–2983. doi: 10.1109/JBHI.2020.2973324
Bi, X., Xie, Y., Wu, H., and Xu, L. (2021a). Identification of differential brain regions in MCI progression via clustering-evolutionary weighted SVM ensemble algorithm. Front. Comput. Sci. 15, 156903. doi: 10.1007/s11704-020-9520-3
Bi, X., Xing, Z., Zhou, W.W., Li, L., and Xu, L. (2022). Pathogeny detection for mild cognitive impairment via weighted evolutionary random forest with brain imaging and genetic data. IEEE J. Biomed. Health Inf. 26, 3068–3079. doi: 10.1109/JBHI.2022.3151084
Bi, X., Zhou, W.W., Li, L., and Xing, Z. (2021b). Detecting risk gene and pathogenic brain region in emci using a novel gerf algorithm based on brain imaging and genetic data. IEEE J. Biomed. Health Inf. 25, 3019–3028. doi: 10.1109/JBHI.2021.3067798
Bihan, D. L., Mangin, J.-F., Poupon, C., Clark, C. A., Pappata, S., Molko, N., et al. (2001). Diffusion tensor imaging: concepts and applications. J. Magn. Reson. Imaging 13, 534–546. doi: 10.1002/jmri.1076
Birur, B., Kraguljac, N. V., Shelton, R. C., and Lahti, A. C. (2017). Brain structure, function, and neurochemistry in schizophrenia and bipolar disorder—a systematic review of the magnetic resonance neuroimaging literature. NPJ Schizophr. 3, 15. doi: 10.1038/s41537-017-0013-9
Cai, C., Cao, J., Yang, C., and Chen, E. (2022). Diagnosis of amnesic mild cognitive impairment using MGS-WBC and VGBN-LM algorithms. Front. Aging Neurosci. 14, 893250. doi: 10.3389/fnagi.2022.893250
Cao, P., Wen, G., Liu, X., Yang, J., and Zaiane, O. R. (2022). Modeling the dynamic brain network representation for autism spectrum disorder diagnosis. Med. Biol. Eng. Comput. 60, 1897–1913. doi: 10.1007/s11517-022-02558-4
Cao, X., Wang, X., Xue, C., Zhang, S., Huang, Q., Liu, W., et al. (2020). A radiomics approach to predicting Parkinson's disease by incorporating whole-brain functional activity and gray matter structure. Front. Neurosci. 14, 751. doi: 10.3389/fnins.2020.00751
Chen, B., Cui, W., Wang, S., Sun, A., Yu, H., Liu, Y., et al. (2023). Functional connectome automatically differentiates multiple system atrophy (Parkinsonian type) from idiopathic Parkinson's disease at early stages. Hum. Brain Mapp. 44, 2176–2190. doi: 10.1002/hbm.26201
Chen, C., Ai, Q., Shi, A., Wang, N., Wang, L., Wei, Y., et al. (2022). Oleanolic acid and ursolic acid: therapeutic potential in neurodegenerative diseases, neuropsychiatric diseases and other brain disorders. Nutr. Neurosci. 26, 414–428. doi: 10.1080/1028415X.2022.2051957
Chowdhary, C. L., Mittal, M., Kumaresan, P., Pattanaik, P. A., and Marszalek, Z. (2020). An efficient segmentation and classification system in medical images using intuitionist possibilistic fuzzy c-mean clustering and fuzzy svm algorithm. Sensors 20, 3903. doi: 10.3390/s20143903
Craddock, R. C., James, G., Holtzheimer, P. E., Hu, X. P., and Mayberg, H. S. (2011). A whole brain fMRI atlas generated via spatially constrained spectral clustering. Hum. Brain Mapp. 33, 1914–1928. doi: 10.1002/hbm.21333
de Lau, L. M., and Breteler, M. M. (2006). Epidemiology of Parkinson's disease. Lancet Neurol. 5, 525–535. doi: 10.1016/S1474-4422(06)70471-9
Desikan, R. S., Ségonne, F., Fischl, B., Quinn, B. T., Dickerson, B. C., Blacker, D., et al. (2006). An automated labeling system for subdividing the human cerebral cortex on MRI scans into gyral based regions of interest. Neuroimage 31, 968–980. doi: 10.1016/j.neuroimage.2006.01.021
Dosenbach, N. U. F., Nardos, B., Cohen, A. L., Fair, D. A., Power, J. D., Church, J. A., et al. (2010). Prediction of individual brain maturity using fMRI. Science 329, 1358–1361. doi: 10.1126/science.1194144
ElNakieb, Y., Ali, M. T., Elnakib, A., Shalaby, A., Mahmoud, A., Soliman, A., et al. (2023). Understanding the role of connectivity dynamics of resting-state functional MRI in the diagnosis of autism spectrum disorder: a comprehensive study. Bioengineering 10, 56. doi: 10.3390/bioengineering10010056
Fan, L., Li, H., Zhuo, J., Zhang, Y., Wang, J., Chen, L., et al. (2016). The human brainnetome atlas: a new brain atlas based on connectional architecture. Cereb. Cortex 26, 3508–3526. doi: 10.1093/cercor/bhw157
Farahani, F. V., Karwowski, W., and Lighthall, N. R. (2019). Application of graph theory for identifying connectivity patterns in human brain networks: a systematic review. Front. Neurosci. 13, 585. doi: 10.3389/fnins.2019.00585
Fathi, S., Ahmadi, M., and Dehnad, A. (2022). Early diagnosis of Alzheimer's disease based on deep learning: a systematic review. Comput. Biol. Med. 146, 105634. doi: 10.1016/j.compbiomed.2022.105634
Freeman, L. M. (1977). A set of measures of centrality based upon betweenness. Sociometry 40, 35–41. doi: 10.2307/3033543
Geisser, S. (1975). The predictive sample reuse method with applications. J. Am. Stat. Assoc. 70, 320–328. doi: 10.1080/01621459.1975.10479865
Ghafoori, S., and Shalbaf, A. (2022). Predicting conversion from MCI to AD by integration of rs-fMRI and clinical information using 3d-convolutional neural network. Int. J. Comput. Assist. Radiol. Surg. 17, 1245–1255. doi: 10.1007/s11548-022-02620-4
Ghiassian, S., Greiner, R., Jin, P., and Brown, M. R. G. (2016). Using functional or structural magnetic resonance images and personal characteristic data to identify ADHD and autism. PLoS ONE 11, e0166934. doi: 10.1371/journal.pone.0166934
Ghosal, S., Chen, Q., Pergola, G., Goldman, A. L., Ulrich, W., Berman, K. F., et al. (2021). A generative-discriminative framework that integrates imaging, genetic, and diagnosis into coupled low dimensional space. Neuroimage 238, 118200. doi: 10.1016/j.neuroimage.2021.118200
Gullett, J. M., Albizu, A., Fang, R., Loewenstein, D. A., Duara, R., Rosselli, M., et al. (2021). Baseline neuroimaging predicts decline to dementia from amnestic mild cognitive impairment. Front. Aging Neurosci. 13, 758298. doi: 10.3389/fnagi.2021.758298
Guo, H., Zeng, W., Shi, Y., Deng, J., and Zhao, L. (2020). Kernel granger causality based on back propagation neural network fuzzy inference system on fMRI data. IEEE Trans. Neural Syst. Rehabil. Eng. 28, 1049–1058. doi: 10.1109/TNSRE.2020.2984519
Guo, H., and Zhang, Y. (2020). Resting state fMRI and improved deep learning algorithm for earlier detection of Alzheimer's disease. IEEE Access 8, 115383–115392. doi: 10.1109/ACCESS.2020.3003424
Hallquist, M. N., and Hillary, F. G. (2019). Graph theory approaches to functional network organization in brain disorders: a critique for a brave new small-world. Netw. Neurosci. 3, 1–26. doi: 10.1162/netn_a_00054
Haweel, R., Shalaby, A., Mahmoud, A., Seada, N., Ghoniemy, S., Ghazal, M., et al. (2021). A robust DWT–CNN-based CAD system for early diagnosis of autism using task-based fMRI. Med. Phys. 48, 2315–2326. doi: 10.1002/mp.14692
Heeger, D. J., and Ress, D. (2002). What does fMRI tell us about neuronal activity? Nat. Rev. Neurosci. 3, 142–151. doi: 10.1038/nrn730
Hsu, N.-J., Hung, H.-L., and Chang, Y.-M. (2008). Subset selection for vector autoregressive processes using lasso. Comput. Stat. Data Anal. 52, 3645–3657. doi: 10.1016/j.csda.2007.12.004
Hu, Z., Wang, J., Zhang, C., Luo, Z., Luo, X., Xiao, L., et al. (2022). Uncertainty modeling for multicenter autism spectrum disorder classification using takagi–sugeno–kang fuzzy systems. IEEE Trans. Cogn. Dev. Syst. 14, 730–739. doi: 10.1109/TCDS.2021.3073368
Huang, Z.-A., Zhu, Z., Yau, C. H., and Tan, K. C. (2021). Identifying autism spectrum disorder from resting-state fMRI using deep belief network. IEEE Trans. Neural Netw. Learn. Syst. 32, 2847–2861. doi: 10.1109/TNNLS.2020.3007943
Hutchison, R. M., Womelsdorf, T., Allen, E. A., Bandettini, P. A., Calhoun, V. D., Corbetta, M., et al. (2013). Dynamic functional connectivity: promise, issues, and interpretations. Neuroimage 80, 360–378. doi: 10.1016/j.neuroimage.2013.05.079
Insel, T. R., and Cuthbert, B. N. (2015). Brain disorders? precisely. Science 348, 499–500. doi: 10.1126/science.aab2358
Ji, J., and Yao, Y. (2021). Convolutional neural network with graphical lasso to extract sparse topological features for brain disease classification. IEEE/ACM Trans. Comput. Biol. Bioinform. 18, 2327–2338. doi: 10.1109/TCBB.2020.2989315
Jia, H., Wang, Y., Duan, Y., and Xiao, H. (2021). Alzheimer's disease classification based on image transformation and features fusion. Comput. Math. Methods Med. 2021, 1–11. doi: 10.1155/2021/9624269
Jin, D., Wang, P., Zalesky, A., Liu, B., Song, C., Wang, D., et al. (2020). grab−AD: generalizability and reproducibility of altered brain activity and diagnostic classification in Alzheimer's disease. Hum. Brain Mapp. 41, 3379–3391. doi: 10.1002/hbm.25023
Kam, T.-E., Zhang, H., Jiao, Z., and Shen, D. (2020). Deep learning of static and dynamic brain functional networks for early MCI detection. IEEE Trans. Med. Imaging 39, 478–487. doi: 10.1109/TMI.2019.2928790
Khatri, U., and Kwon, G.-R. (2022). Alzheimer's disease diagnosis and biomarker analysis using resting-state functional MRI functional brain network with multi-measures features and hippocampal subfield and amygdala volume of structural MRI. Front. Aging Neurosci. 14, 818871. doi: 10.3389/fnagi.2022.818871
Koch, C., and Laurent, G. (1999). Complexity and the nervous system. Science 284, 96–98. doi: 10.1126/science.284.5411.96
Lama, R. K., and Kwon, G.-R. (2021). Diagnosis of Alzheimer's disease using brain network. Front. Neurosci. 15, 605115. doi: 10.3389/fnins.2021.605115
Larson, S. C. (1931). The shrinkage of the coefficient of multiple correlation. J. Educ. Psychol. 22, 45–55. doi: 10.1037/h0072400
Latora, V., and Marchiori, M. (2001). Efficient behavior of small-world networks. Phys. Rev. Lett. 87, 198701. doi: 10.1103/PhysRevLett.87.198701
Lei, B., Yu, S., Zhao, X., Frangi, A. F., Tan, E.-L., Elazab, A., et al. (2020). Diagnosis of early Alzheimer's disease based on dynamic high order networks. Brain Imaging Behav. 15, 276–287. doi: 10.1007/s11682-019-00255-9
Li, A., and Li, C. (2022). Detecting Parkinson's disease through gait measures using machine learning. Diagnostics 12, 2404. doi: 10.3390/diagnostics12102404
Li, W., Lin, X., and Chen, X. (2020a). Detecting Alzheimer's disease based on 4d fMRI: an exploration under deep learning framework. Neurocomputing 388, 280–287. doi: 10.1016/j.neucom.2020.01.053
Li, W., Zhang, L., Qiao, L., and Shen, D. (2020b). Toward a better estimation of functional brain network for mild cognitive impairment identification: a transfer learning view. IEEE J. Biomed. Health Inf. 24, 1160–1168. doi: 10.1109/JBHI.2019.2934230
Liang, Y., Liu, B., and Zhang, H. (2021). A convolutional neural network combined with prototype learning framework for brain functional network classification of autism spectrum disorder. IEEE Trans. Neural Syst. Rehabil. Eng. 29, 2193–2202. doi: 10.1109/TNSRE.2021.3120024
Liang, Y., Xu, G., and ur Rehman, S. (2022). Multi-scale attention-based deep neural network for brain disease diagnosis. Comput. Mater. Contin. 72, 4645–4661. doi: 10.32604/cmc.2022.026999
Lin, K., Jie, B., Dong, P., Ding, X., Bian, W., Liu, M., et al. (2022). Convolutional recurrent neural network for dynamic functional MRI analysis and brain disease identification. Front. Neurosci. 16, 933660. doi: 10.3389/fnins.2022.933660
Liu, J., Pan, Y., Wu, F.-X., and Wang, J. (2020a). Enhancing the feature representation of multi-modal MRI data by combining multi-view information for MCI classification. Neurocomputing 400, 322–332. doi: 10.1016/j.neucom.2020.03.006
Liu, J., Tan, G., Lan, W., and Wang, J. (2020b). Identification of early mild cognitive impairment using multi-modal data and graph convolutional networks. BMC Bioinformatics 21(S6), 123. doi: 10.1186/s12859-020-3437-6
Liu, M., Li, B., and Hu, D. (2021). Autism spectrum disorder studies using fMRI data and machine learning: a review. Front. Neurosci. 15, 697870. doi: 10.3389/fnins.2021.697870
Liu, Z., Xu, T., Ma, C., Gao, C., and Yang, H. (2018). T-test based Alzheimer's disease diagnosis with multi-feature in MRIs. Multimed. Tools Appl. 77, 29687–29703. doi: 10.1007/s11042-018-5768-0
Logothetis, N. K. (2008). What we can do and what we cannot do with fMRI. Nature 453, 869–878. doi: 10.1038/nature06976
Lord, C., Elsabbagh, M., Baird, G., and Veenstra-Vanderweele, J. (2018). Autism spectrum disorder. Lancet 392, 508–520. doi: 10.1016/S0140-6736(18)31129-2
Lu, J., Zeng, W., Zhang, L., and Shi, Y. (2022). A novel key features screening method based on extreme learning machine for Alzheimer's disease study. Front. Aging Neurosci. 14, 888575. doi: 10.3389/fnagi.2022.888575
Moridian, P., Ghassemi, N., Jafari, M., Salloum-Asfar, S., Sadeghi, D., Khodatars, M., et al. (2022). Automatic autism spectrum disorder detection using artificial intelligence methods with MRI neuroimaging: a review. Front. Mol. Neurosci. 15, 999605. doi: 10.3389/fnmol.2022.999605
Mousa, D., Zayed, N., and Yassine, I. A. (2022). Alzheimer disease stages identification based on correlation transfer function system using resting-state functional magnetic resonance imaging. PLoS ONE 17, e0264710. doi: 10.1371/journal.pone.0264710
Mulkey, S. B., Yap, V. L., Bai, S., Ramakrishnaiah, R. H., Glasier, C. M., Bornemeier, R. A., et al. (2015). Amplitude-integrated EEG in newborns with critical congenital heart disease predicts preoperative brain magnetic resonance imaging findings. Pediatr. Neurol. 52, 599–605. doi: 10.1016/j.pediatrneurol.2015.02.026
Nasrallah, I., and Dubroff, J. (2013). An overview of PET neuroimaging. Semin. Nucl. Med. 43, 449–461. doi: 10.1053/j.semnuclmed.2013.06.003
Pang, H., Yu, Z., Yu, H., Cao, J., Li, Y., Guo, M., et al. (2021). Use of machine learning method on automatic classification of motor subtype of Parkinson's disease based on multilevel indices of rs-fMRI. Parkinsonism Relat. Disord. 90, 65–72. doi: 10.1016/j.parkreldis.2021.08.003
Pang, H., Yu, Z., Yu, H., Chang, M., Cao, J., Li, Y., et al. (2022). Multimodal striatal neuromarkers in distinguishing Parkinsonian variant of multiple system atrophy from idiopathic Parkinson's disease. CNS Neurosci. Ther. 28, 2172–2182. doi: 10.1111/cns.13959
Parveen and Singh A. (2015). “Detection of brain tumor in MRI images, using combination of fuzzy c-means and SVM,” in 2015 2nd International Conference on Signal Processing and Integrated Networks (SPIN) (Noida: IEEE), 98–102. doi: 10.1109/SPIN.2015.7095308
Perrin, R. J., Fagan, A. M., and Holtzman, D. M. (2009). Multimodal techniques for diagnosis and prognosis of Alzheimer's disease. Nature 461, 916–922. doi: 10.1038/nature08538
Power, J. D., Cohen, A. L., Nelson, S. M., Wig, G. S., Barnes, K. A., Church, J. A., et al. (2011). Functional network organization of the human brain. Neuron 72, 665–678. doi: 10.1016/j.neuron.2011.09.006
Price, T., Wee, C.-Y., Gao, W., and Shen, D. (2014). “Multiple-network classification of childhood autism using functional connectivity dynamics,” in Medical Image Computing and Computer-Assisted Intervention MICCAI 2014. MICCAI 2014. Lecture Notes in Computer Science, Vol 8675, eds P. Golland, N. Hata, C. Barillot, J. Hornegger, and R. Howe (Cham: Springer), 177–184. doi: 10.1007/978-3-319-10443-0_23
Raji, C. A., Ho, A. J., Parikshak, N. N., Becker, J. T., Lopez, O. L., Kuller, L. H., et al. (2009). Brain structure and obesity. Hum. Brain Mapp. 31, 353–364. doi: 10.1002/hbm.20870
Rubinov, M., and Sporns, O. (2010). Complex network measures of brain connectivity: uses and interpretations. Neuroimage 52, 1059–1069. doi: 10.1016/j.neuroimage.2009.10.003
Scheltens, P., Blennow, K., Breteler, M. M. B., de Strooper, B., Frisoni, G. B., Salloway, S., et al. (2016). Alzheimer's disease. Lancet 388, 505–517. doi: 10.1016/S0140-6736(15)01124-1
Shi, D., Li, Y., Zhang, H., Yao, X., Wang, S., Wang, G., et al. (2021a). Machine learning of schizophrenia detection with structural and functional neuroimaging. Dis. Markers 2021, 1–12. doi: 10.1155/2021/9963824
Shi, D., Zhang, H., Wang, G., Wang, S., Yao, X., Li, Y., et al. (2022). Machine learning for detecting Parkinson's disease by resting-state functional magnetic resonance imaging: a multicenter radiomics analysis. Front. Aging Neurosci. 14, 806828. doi: 10.3389/fnagi.2022.806828
Shi, D., Zhang, H., Wang, S., Wang, G., and Ren, K. (2021b). Application of functional magnetic resonance imaging in the diagnosis of Parkinson's disease: a histogram analysis. Front. Aging Neurosci. 13, 624731. doi: 10.3389/fnagi.2021.624731
Shoeibi, A., Khodatars, M., Jafari, M., Ghassemi, N., Moridian, P., Alizadehsani, R., et al. (2023). Diagnosis of brain diseases in fusion of neuroimaging modalities using deep learning: a review. Inf. Fusion 93, 85–117. doi: 10.1016/j.inffus.2022.12.010
Slobounov, S., Gay, M., Zhang, K., Johnson, B., Pennell, D., Sebastianelli, W., et al. (2011). Alteration of brain functional network at rest and in response to YMCA physical stress test in concussed athletes: RsFMRI study. Neuroimage 55, 1716–1727. doi: 10.1016/j.neuroimage.2011.01.024
Subah, F. Z., Deb, K., Dhar, P. K., and Koshiba, T. (2021). A deep learning approach to predict autism spectrum disorder using multisite resting-state fMRI. Appl. Sci. 11, 3636. doi: 10.3390/app11083636
Tanveer, M., Richhariya, B., Khan, R. U., Rashid, A. H., Khanna, P., Prasad, M., et al. (2020). Machine learning techniques for the diagnosis of Alzheimer's disease. ACM Trans. Multimedia Comput. Commun. Appl. 16(1s), 1–35. doi: 10.1145/3344998
Tzourio-Mazoyer, N., Landeau, B., Papathanassiou, D., Crivello, F., Etard, O., Delcroix, N., et al. (2002). Automated anatomical labeling of activations in SPM using a macroscopic anatomical parcellation of the MNI MRI single-subject brain. Neuroimage 15, 273–289. doi: 10.1006/nimg.2001.0978
van den Heuvel, M. P., and Pol, H. E. H. (2010). Exploring the brain network: a review on resting-state fMRI functional connectivity. Eur. Neuropsychopharmacol. 20, 519–534. doi: 10.1016/j.euroneuro.2010.03.008
Vardi, G., and Merrick, J. (2008). Neurological disorders: public health challenges. J. Policy Pract. Intellect. Disabil. 5, 75–75. doi: 10.1111/j.1741-1130.2007.00143.x
Wang, B., Li, L., Peng, L., Jiang, Z., Dai, K., Xie, Q., et al. (2022). Multigroup recognition of dementia patients with dynamic brain connectivity under multimodal cortex parcellation. Biomed. Signal Process. Control 76, 103725. doi: 10.1016/j.bspc.2022.103725
Wang, M., Lian, C., Yao, D., Zhang, D., Liu, M., Shen, D., et al. (2020). Spatial-temporal dependency modeling and network hub detection for functional MRI analysis via convolutional-recurrent network. IEEE Trans. Biomed. Eng. 67, 2241–2252. doi: 10.1109/TBME.2019.2957921
Wang, N., Yao, D., Ma, L., and Liu, M. (2022). Multi-site clustering and nested feature extraction for identifying autism spectrum disorder with resting-state fMRI. Med. Image Anal. 75, 102279. doi: 10.1016/j.media.2021.102279
Wang, T., Bezerianos, A., Cichocki, A., and Li, J. (2022). Multikernel capsule network for schizophrenia identification. IEEE Trans. Cybern. 52, 4741–4750. doi: 10.1109/TCYB.2020.3035282
Wang, Y., Amdanee, N., and Zhang, X. (2022a). Exosomes in schizophrenia: pathophysiological mechanisms, biomarkers, and therapeutic targets. Eur. Psychiatry 65, e61. doi: 10.1192/j.eurpsy.2022.2319
Wang, Y., Fu, Y., and Luo, X. (2022b). Identification of pathogenetic brain regions via neuroimaging data for diagnosis of autism spectrum disorders. Front. Neurosci. 16, 900330. doi: 10.3389/fnins.2022.900330
Wang, Y., Liu, X., and Yu, C. (2021). Assisted diagnosis of Alzheimer's disease based on deep learning and multimodal feature fusion. Complexity 2021, 1–10. doi: 10.1155/2021/6626728
Wattjes, M. P. (2011). Structural MRI. Int. Psychogeriatr. 23, S13–S24. doi: 10.1017/S1041610211000913
Watts, D. J., and Strogatz, S. H. (1998). Collective dynamics of ‘small-world' networks. Nature 393, 440–442. doi: 10.1038/30918
Xing, Y., Fu, S., Li, M., Ma, X., Liu, M., Liu, X., et al. (2021). Regional neural activity changes in Parkinson's disease-associated mild cognitive impairment and cognitively normal patients. Neuropsychiatr. Dis. Treat. 17, 2697–2706. doi: 10.2147/NDT.S323127
Xu, X., Li, W., Mei, J., Tao, M., Wang, X., Zhao, Q., et al. (2020). Feature selection and combination of information in the functional brain connectome for discrimination of mild cognitive impairment and analyses of altered brain patterns. Front. Aging Neurosci. 12, 28. doi: 10.3389/fnagi.2020.00028
Yang, J., Pu, W., Wu, G., Chen, E., Lee, E., Liu, Z., et al. (2020). Connectomic underpinnings of working memory deficits in schizophrenia: evidence from a replication fMRI study. Schizophr. Bull. 46, 916–926. doi: 10.1093/schbul/sbz137
Yeo, B. T. T., Krienen, F. M., Sepulcre, J., Sabuncu, M. R., Lashkari, D., Hollinshead, M., et al. (2011). The organization of the human cerebral cortex estimated by intrinsic functional connectivity. J. Neurophysiol. 106, 1125–1165. doi: 10.1152/jn.00338.2011
Zang, J., Huang, Y., Kong, L., Lei, B., Ke, P., Li, H., et al. (2021). Effects of brain atlases and machine learning methods on the discrimination of schizophrenia patients: a multimodal MRI study. Front. Neurosci. 15, 697168. doi: 10.3389/fnins.2021.697168
Zang, Y., He, Y., Zhu, C., Cao, Q., Sui, M.-Q., Liang, M., et al. (2007). Altered baseline brain activity in children with ADHD revealed by resting-state functional MRI. Brain Dev. 29, 83–91. doi: 10.1016/j.braindev.2006.07.002
Zang, Y., Jiang, T., Lu, Y., He, Y., and Tian, L. (2004). Regional homogeneity approach to fMRI data analysis. Neuroimage 22, 394–400. doi: 10.1016/j.neuroimage.2003.12.030
Zhang, J. (2019). Basic neural units of the brain: neurons, synapses and action potential. arXiv. [preprint]. doi: 10.48550/arXiv.1906.01703
Zhang, L., Ni, H., Yu, Z., Wang, J., Qin, J., Hou, F., et al. (2020). Investigation on the alteration of brain functional network and its role in the identification of mild cognitive impairment. Front. Neurosci. 14, 558434. doi: 10.3389/fnins.2020.558434
Zhang, T., Liao, Q., Zhang, D., Zhang, C., Yan, J., Ngetich, R., et al. (2021). Predicting MCI to AD conversation using integrated sMRI and rs-fMRI: machine learning and graph theory approach. Front. Aging Neurosci. 13, 688926. doi: 10.3389/fnagi.2021.688926
Zhang, Y., Zhang, H., Adeli, E., Chen, X., Liu, M., Shen, D., et al. (2022). Multiview feature learning with multiatlas-based functional connectivity networks for MCI diagnosis. IEEE Trans. Cybern. 52, 6822–6833. doi: 10.1109/TCYB.2020.3016953
Zhang, Y., Zhu, C., Chen, H., Duan, X., Lu, F., Li, M., et al. (2015). Frequency-dependent alterations in the amplitude of low-frequency fluctuations in social anxiety disorder. J. Affect. Disord. 174, 329–335. doi: 10.1016/j.jad.2014.12.001
Zhao, L., Sun, Y.-K., Xue, S.-W., Luo, H., Lu, X.-D., Zhang, L.-H., et al. (2022). Identifying boys with autism spectrum disorder based on whole-brain resting-state interregional functional connections using a boruta-based support vector machine approach. Front. Neuroinform. 16, 761942. doi: 10.3389/fninf.2022.761942
Keywords: brain diseases, functional magnetic resonance imaging, machine learning, diagnosis, feature selection
Citation: Teng J, Mi C, Shi J and Li N (2023) Brain disease research based on functional magnetic resonance imaging data and machine learning: a review. Front. Neurosci. 17:1227491. doi: 10.3389/fnins.2023.1227491
Received: 23 May 2023; Accepted: 13 July 2023;
Published: 17 August 2023.
Edited by:
Lu Zhao, University of Southern California, United StatesReviewed by:
Mario Versaci, Mediterranea University of Reggio Calabria, ItalyEsmaeil Mohammadi, University of Oklahoma Health Sciences Center, United States
Copyright © 2023 Teng, Mi, Shi and Li. This is an open-access article distributed under the terms of the Creative Commons Attribution License (CC BY). The use, distribution or reproduction in other forums is permitted, provided the original author(s) and the copyright owner(s) are credited and that the original publication in this journal is cited, in accordance with accepted academic practice. No use, distribution or reproduction is permitted which does not comply with these terms.
*Correspondence: Na Li, bGluYTI4NjRAY3N1LmVkdS5jbg==