
95% of researchers rate our articles as excellent or good
Learn more about the work of our research integrity team to safeguard the quality of each article we publish.
Find out more
ORIGINAL RESEARCH article
Front. Neurosci. , 30 January 2023
Sec. Neuroendocrine Science
Volume 17 - 2023 | https://doi.org/10.3389/fnins.2023.1061156
This article is part of the Research Topic Diabetic Neuropathy and Its Complications View all 5 articles
 Rui Hu†
 Bingbing Gao†
 Shiyun Tian
 Yangyingqiu Liu
 Yuhan Jiang
 Wanyao Li
 Yuan Li
 Qingwei Song
 Weiwei Wang*†
 Yanwei Miao*†
Objective: To quantitatively evaluate the iron deposition and volume changes in deep gray nuclei according to threshold-method of quantitative susceptibility mapping (QSM) acquired by strategically acquired gradient echo (STAGE) sequence, and to analyze the correlation between the magnetic susceptibility values (MSV) and cognitive scores in type 2 diabetes mellitus (T2DM) patients.
Methods: Twenty-nine patients with T2DM and 24 healthy controls (HC) matched by age and gender were recruited in this prospective study. QSM images were used to evaluate whole-structural volumes (Vwh), regional magnetic susceptibility values (MSVRII), and volumes (VRII) in high-iron regions in nine gray nuclei. All QSM data were compared between groups. Receiver operating characteristic (ROC) analysis was used to assess the discriminating ability between groups. The predictive model from single and combined QSM parameters was also established using logistic regression analysis. The correlation between MSVRII and cognitive scores was further analyzed. Multiple comparisons of all statistical values were corrected by false discovery rate (FDR). A statistically significant P-value was set at 0.05.
Results: Compared with HC group, the MSVRII of all gray matter nuclei in T2DM were increased by 5.1–14.8%, with significant differences found in bilateral head of caudate nucleus (HCN), right putamen (PUT), right globus pallidus (GP), and left dentate nucleus (DN) (P < 0.05). The Vwh of most gray nucleus in T2DM group were decreased by 1.5–16.9% except bilateral subthalamic nucleus (STN). Significant differences were found in bilateral HCN, bilateral red nucleus (RN), and bilateral substantia nigra (SN) (P < 0.05). VRII was increased in bilateral GP, bilateral PUT (P < 0.05). VRII/Vwh was also increased in bilateral GP, bilateral PUT, bilateral SN, left HCN and right STN (P < 0.05). Compared with the single QSM parameter, the combined parameter showed the largest area under curve (AUC) of 0.86, with a sensitivity of 87.5% and specificity of 75.9%. The MSVRII in the right GP was strongly associated with List A Long-delay free recall (List A LDFR) scores (r = −0.590, P = 0.009).
Conclusion: In T2DM patients, excessive and heterogeneous iron deposition as well as volume loss occurs in deep gray nuclei. The MSV in high iron regions can better evaluate the distribution of iron, which is related to the decline of cognitive function.
The prevalence of type 2 diabetes mellitus (T2DM) has increased rapidly and T2DM has become one of the most significant metabolic diseases and major worldwide health problems. Studies have shown that T2DM patients are often accompanied by central nervous system damage, including cognitive impairment (Pasquier et al., 2006; McCrimmon et al., 2012; Degen et al., 2016).
Brain iron deposition has been identified to be associated with cognitive decline in various neurodegenerative diseases, such as Alzheimer’s disease (AD) and Parkinson’s disease (PD) (Du et al., 2018; Ayton et al., 2020; Thomas et al., 2020). A few T2DM studies (Yang et al., 2018; Li et al., 2020a,b) have found increased brain iron deposits in gray nuclei, which is related to cognitive decline.
In recent years, Quantitative susceptibility mapping (QSM) has been regarded as the preferred method for quantitative analysis of brain iron because it can quantify the magnetic susceptibility of tissue accurately (Langkammer et al., 2012; Yan et al., 2018). There are many approaches to obtain QSM now, and among them, strategically acquired gradient echo (STAGE) is a rapid multi-contrast and multi-parametric imaging sequence that provides multiple qualitative and quantitative images including QSM. Meanwhile, the QSM reconstruction from STAGE data helps to improve the signal-to-noise ratio and yields fewer artifacts (Gharabaghi et al., 2020). Previous studies have found that STAGE provides a reproducible standardization for iron content measurement (Chen et al., 2018; He et al., 2022).
Post-mortem studies showed that there was a significant correlation between magnetic susceptibility values (MSV) in QSM and histochemical iron contents in brain tissues (Langkammer et al., 2012; Sun et al., 2015; Hametner et al., 2018; Lee et al., 2018; Lewis et al., 2018; Wang et al., 2020). The magnetic susceptibility of biological tissue reflects its magnetization under external magnetic fields, its value can describe the compositional changes in tissues (Guo et al., 2018). However, the MSV measurement methods used in different studies are inconsistent. In a T2DM study, Li et al. (2020b) detected more iron overloading nuclei using voxel-based analysis than region of interest (ROI)-based analysis (Li et al., 2020a), indicating that voxel-based analysis is more sensitive in brain iron detection. However, their measurements are based on the whole structure, which cannot reflect the uneven distribution of iron in the substructures well. More studies have found heterogeneity in brain iron deposition, even in the same nucleus (Sakurai et al., 2010; Wang et al., 2012; Han et al., 2013; Ghassaban et al., 2019; Lee and Lee, 2019). The method of whole-structure-iron measurement is difficult to display regional iron changes in nucleus. ROI-based regional high iron analysis may have a higher diagnostic value than whole structural iron analysis, and reduces the possible error of manually ROI drawing (Wang et al., 2012, 2016) greatly. Previous studies (Ghassaban et al., 2019) have reported abnormal iron deposition in the substantia nigra (SN), especially in regional high iron areas, which can be used as a biomarker to distinguish patients with PD from healthy controls (HC) and to assess the severity of the disease.
However, the previous T2DM studies about brain iron loads (Yang et al., 2018; Li et al., 2020a,b) were analyzed based on the whole nuclei rather than the regional ones. To our knowledge, there is no study on the correlation between the heterogeneity distribution of brain iron and cognitive state in T2DM patients up to now.
Based on the above, we intend to quantitatively analyze the whole-structural volumes, regional MSV and volumes in various nuclei, and to explore the relationship between these parameters and cognitive state in T2DM patients.
This prospective study was approved by the local ethics committee of the First Affiliated Hospital of Dalian Medical University. All participants were recruited from the local community with recruitment advertisements. Informed consents were obtained from all participants before the study.
The clinical diagnostic criteria for T2DM were in line with the recommendations of the American Diabetes Association (ADA) in 2014 (Chung et al., 2014). All patients were right-handed and had no contraindications for MRI scanning. Exclusion criteria included: (a) seriously internal medicine emergency; (b) history of drug abuse or dependence, alcoholism, etc.; (c) history of current or previous neuropsychiatric illness, family history of psychiatric illness; (d) combined with severe brain diseases, such as massive cerebral infarction, cerebral hemorrhage, tumors, trauma, etc.; (e) current or previous history of severe physical diseases; (f) history of craniocerebral surgery.
Thirty-four patients with T2DM were prospectively recruited from July 2019 to November 2019 in this study. Three patients with poor MRI image quality and two patients with motion artifacts were excluded. At last, 29 T2DM patients (15 males; 59.83 ± 9.38 years) were enrolled in the analysis. In addition, we recruited 24 healthy volunteers for controls (HC, 9 males; 56.83 ± 7.29 years) during the corresponding period. They were all right-handed and matched with T2DM groups in terms of age, gender, and education degrees. The exclusion criteria for HC were: (a) history of diabetes and hypertension; (b) traumatic brain injury or structural abnormality; (c) other exclusion criteria are the same as those of T2DM.
Clinical data including age, gender, body mass index (BMI), and education years were collected from all subjects. Blood biochemical tests which include fasting plasma glucose (FG), glycated hemoglobin (HbA1c) and hemoglobin (Hb) were recorded in all participants before MR data acquisition within 1 week.
Neurocognitive assessments were performed before the MR scan within 1 week, including mini-mental state examination (MMSE), Montreal cognitive assessment (MoCA), and California verbal learning test (CVLT). CVLT can be used to check the verbal learning and memory processing function of patients. The primary measures include recall after the first trial (CVLT trial 1 Sum), the fifth trial (CVLT trial 5 Sum), the sum across the five trials (CVLT trials 1–5 Sum), List A Short-delay free recall (List A SDFR), List A Short-delay cued recall (List A SDCR), List A Long-delay free recall (List A LDFR), and List A Long-delay cued recall (List A LDCR).
All of the participants underwent routine sequences and STAGE on a 3.0T MR scanner (Ingenia CX, Philips Healthcare, Best, Netherlands) equipped with a 32-channel phased-array head coil. The STAGE parameters were: flip angle (FA) = 6°/24°, echo time (TE1) = 7.5 ms/8.75 ms, TE2 = 17.5 ms/18.75 ms, repetition time (TR) = 30 ms, field of view (FOV) = 256 mm × 256 mm × 128 mm, matrix = 384 × 191 × 64, voxel = 0.87 mm × 1.34 mm × 2 mm. T1WI: FA = 75°, TE = 6.9 ms, TR = 297 ms, FOV = 230 mm × 183 mm, matrix = 232 × 178, NEX = 1, slice thickness = 3.0 mm, slice gap = 0 mm. T2WI: TE = 13.81 ms, and TR = 1,186 ms, FOV = 230 mm × 183 mm, matrix = 256 × 164, NEX = 1, slice thickness = 3.0 mm, slice gap = 0 mm.
Raw STAGE data was transmitted in Digital Imaging and Communications in Medicine (DICOM) format to a personal computer, and processed according to an established STAGE pipeline in SPIN software (SpinTech, Inc., Bingham Farms, MI, USA). Multiple qualitative and quantitative images were further obtained in STAGE software, such as T1WE, T1 MAP, PD MAP, SWI, tSWI, R2*, and QSM image, and then QSM images were selected to measure MSV.
Two neuroradiologists with more than 7 years of work experience manually drew 3D whole-structural ROIs along the border of bilateral gray nuclei, including head of caudate nucleus (HCN), globus pallidus (GP), putamen (PUT), pulvinar thalamus (PT), subthalamic nucleus (STN), red nucleus (RN), substantia nigra (SN), dentate nucleus (DN), and gyri fasciolaris (GF), as shown in Figure 1. The boundary of gray nuclei was defined referring to T1WE and tSWI images. The ventricle and vessel were avoided when drawing the ROIs.

Figure 1. Region of interests (ROIs) traced on quantitative susceptibility mapping (QSM) of a 47-year-old male. Structures include head of caudate nucleus (HCN, brown), globus pallidus (GP, green), putamen (PUT, gray), pulvinar thalamus (PT, orange), subthalamic nucleus (STN, blue), red nucleus (RN, red), substantia nigra (substantia nigra (SN), yellow), dentate nucleus (DN, pale blue), gyri fasciolaris (GF, pink).
An MSV threshold from the HC group was calculated to define the boundary of high iron content (RII, Figure 2) which could evaluate the iron content in the nucleus more accurately. Mean plus two standard deviations were used to calculate the MSV threshold of each nucleus (Table 1) according to the study of Ghassaban et al. (2019). RII region is the area of the structure where the iron concentration is larger than the threshold. The MSV of RII region (MSVRII), volumes of RII region (VRII), and whole nucleus (Vwh) were measured, and further VRII/Vwh were calculated.
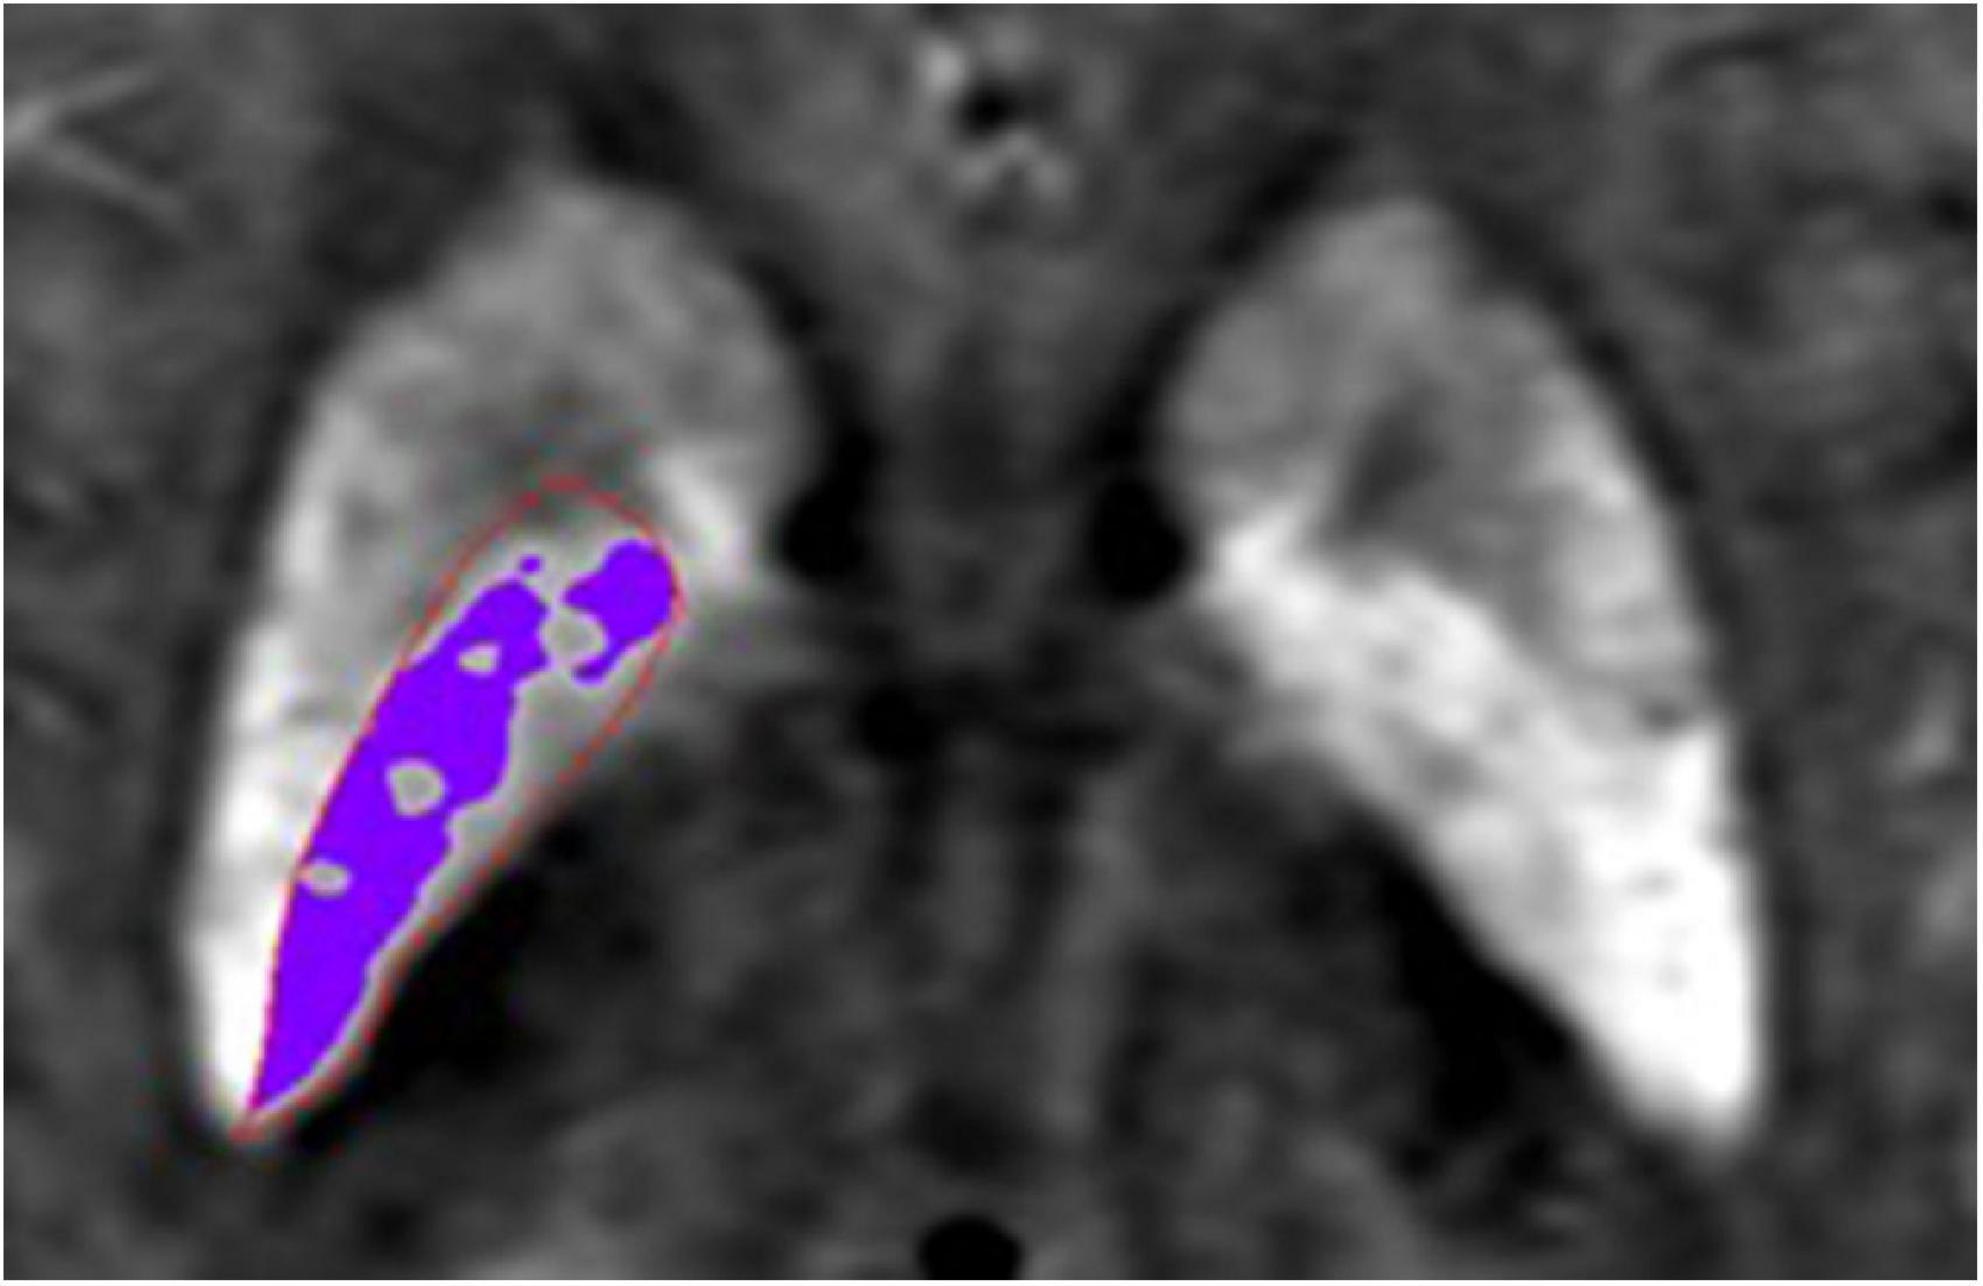
Figure 2. Schematic diagram of RII area. The area in the red region of interest (ROI) is globus pallidus (GP), the purple area represents the iron concentration is larger than the threshold in the GP.
The statistical package for social science (SPSS) version 25.0 and R version 4.1.2 were used to analyze the data. In order to determine the reliability of inter-observer relationships, the intraclass correlation coefficient (ICC) test was conducted. Independent samples t-test (for normally distributed data) or Mann–Whitney U test (for non-normally distributed data) or Chi-square test (enumeration data) was used to compare the MSVRII, VRII, Vwh, VRII/Vwh of gray matter nucleus, clinical data, laboratory examination indexes and cognitive scores between T2DM and HC group. Pearson correlation analysis (for normally distributed data) or Spearman correlation analysis (for non-normally distributed data) was used to analyze the correlation between MSVRII with significant differences and cognitive scores. Receiver operating characteristic (ROC) test was used to assess the ability of MSVRII, VRII, and Vwh to discriminate differences between groups, the predictive model was established by logistic regression analysis, and the difference in efficacy between single parameter and the combined diagnosis was compared with Delong test. Multiple comparisons were corrected by false discovery rate (FDR) correction (Benjamini–Hochberg method). A statistically significant P-value was set at 0.05.
A summary of all demographic, clinical, and cognitive characteristics can be found in Table 2. There were no significant differences in gender, age, education years, BMI, Hb, CVLT, or MMSE between groups (P > 0.05). The poorer MoCA performance was found in T2DM patients (P < 0.001).
An ICC analysis revealed excellent inter-rater consistency across all measured data (0.802–0.965). Compared with the HC group, the MSVRII of all gray nuclei in the T2DM group were increased by 5.1–14.8%, and there were significant differences in bilateral HCN, right PUT, right GP, and left DN (P < 0.05, Table 3 and Figure 3).
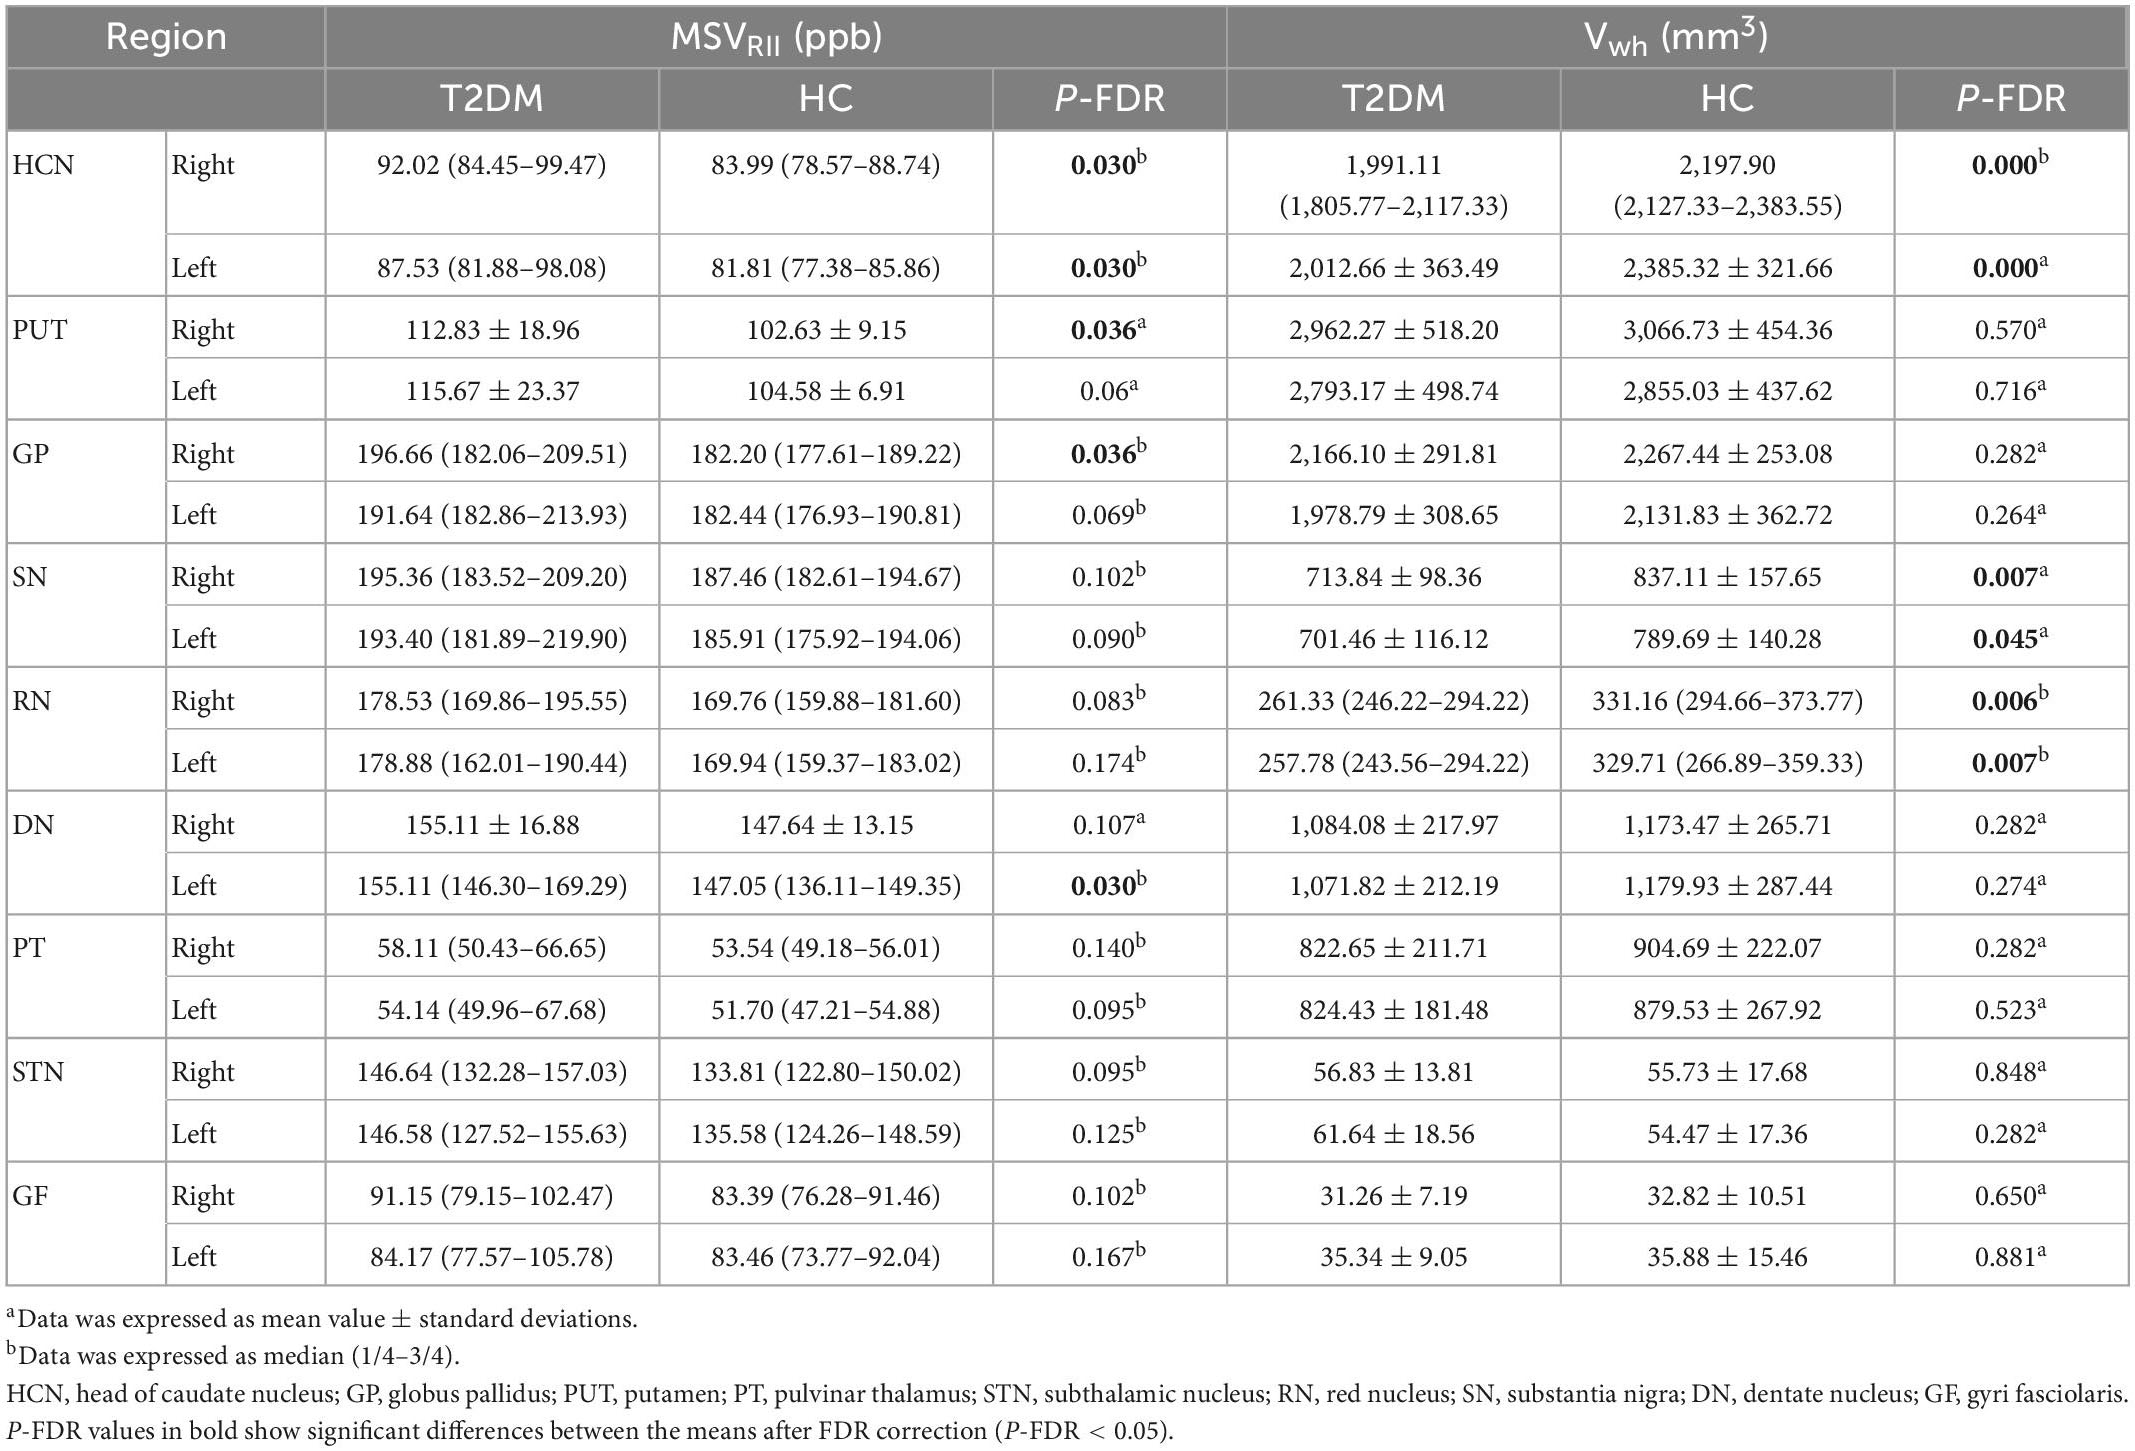
Table 3. Comparison of magnetic susceptibility values (MSVRII) and Vwh between type 2 diabetes mellitus (T2DM) and healthy controls (HC).

Figure 3. Comparisons of gray nucleus magnetic susceptibility values (MSVRII) with significant differences between type 2 diabetes mellitus (T2DM) group and healthy controls (HC) group, there were significant differences in bilateral head of caudate nucleus (HCN), right PUT, right globus pallidus (GP) and left dentate nucleus (DN) (P-FDR < 0.05).
The VRII in bilateral GP and PUT were increased in the T2DM groups compared to HCs (P < 0.05, Table 4). Except for bilateral STN, the Vwh of all gray matter nuclei in the T2DM group were decreased by 1.5–16.9%. Significant Vwh differences were found in bilateral HCN, bilateral RN and bilateral SN, (P < 0.05, Table 3).
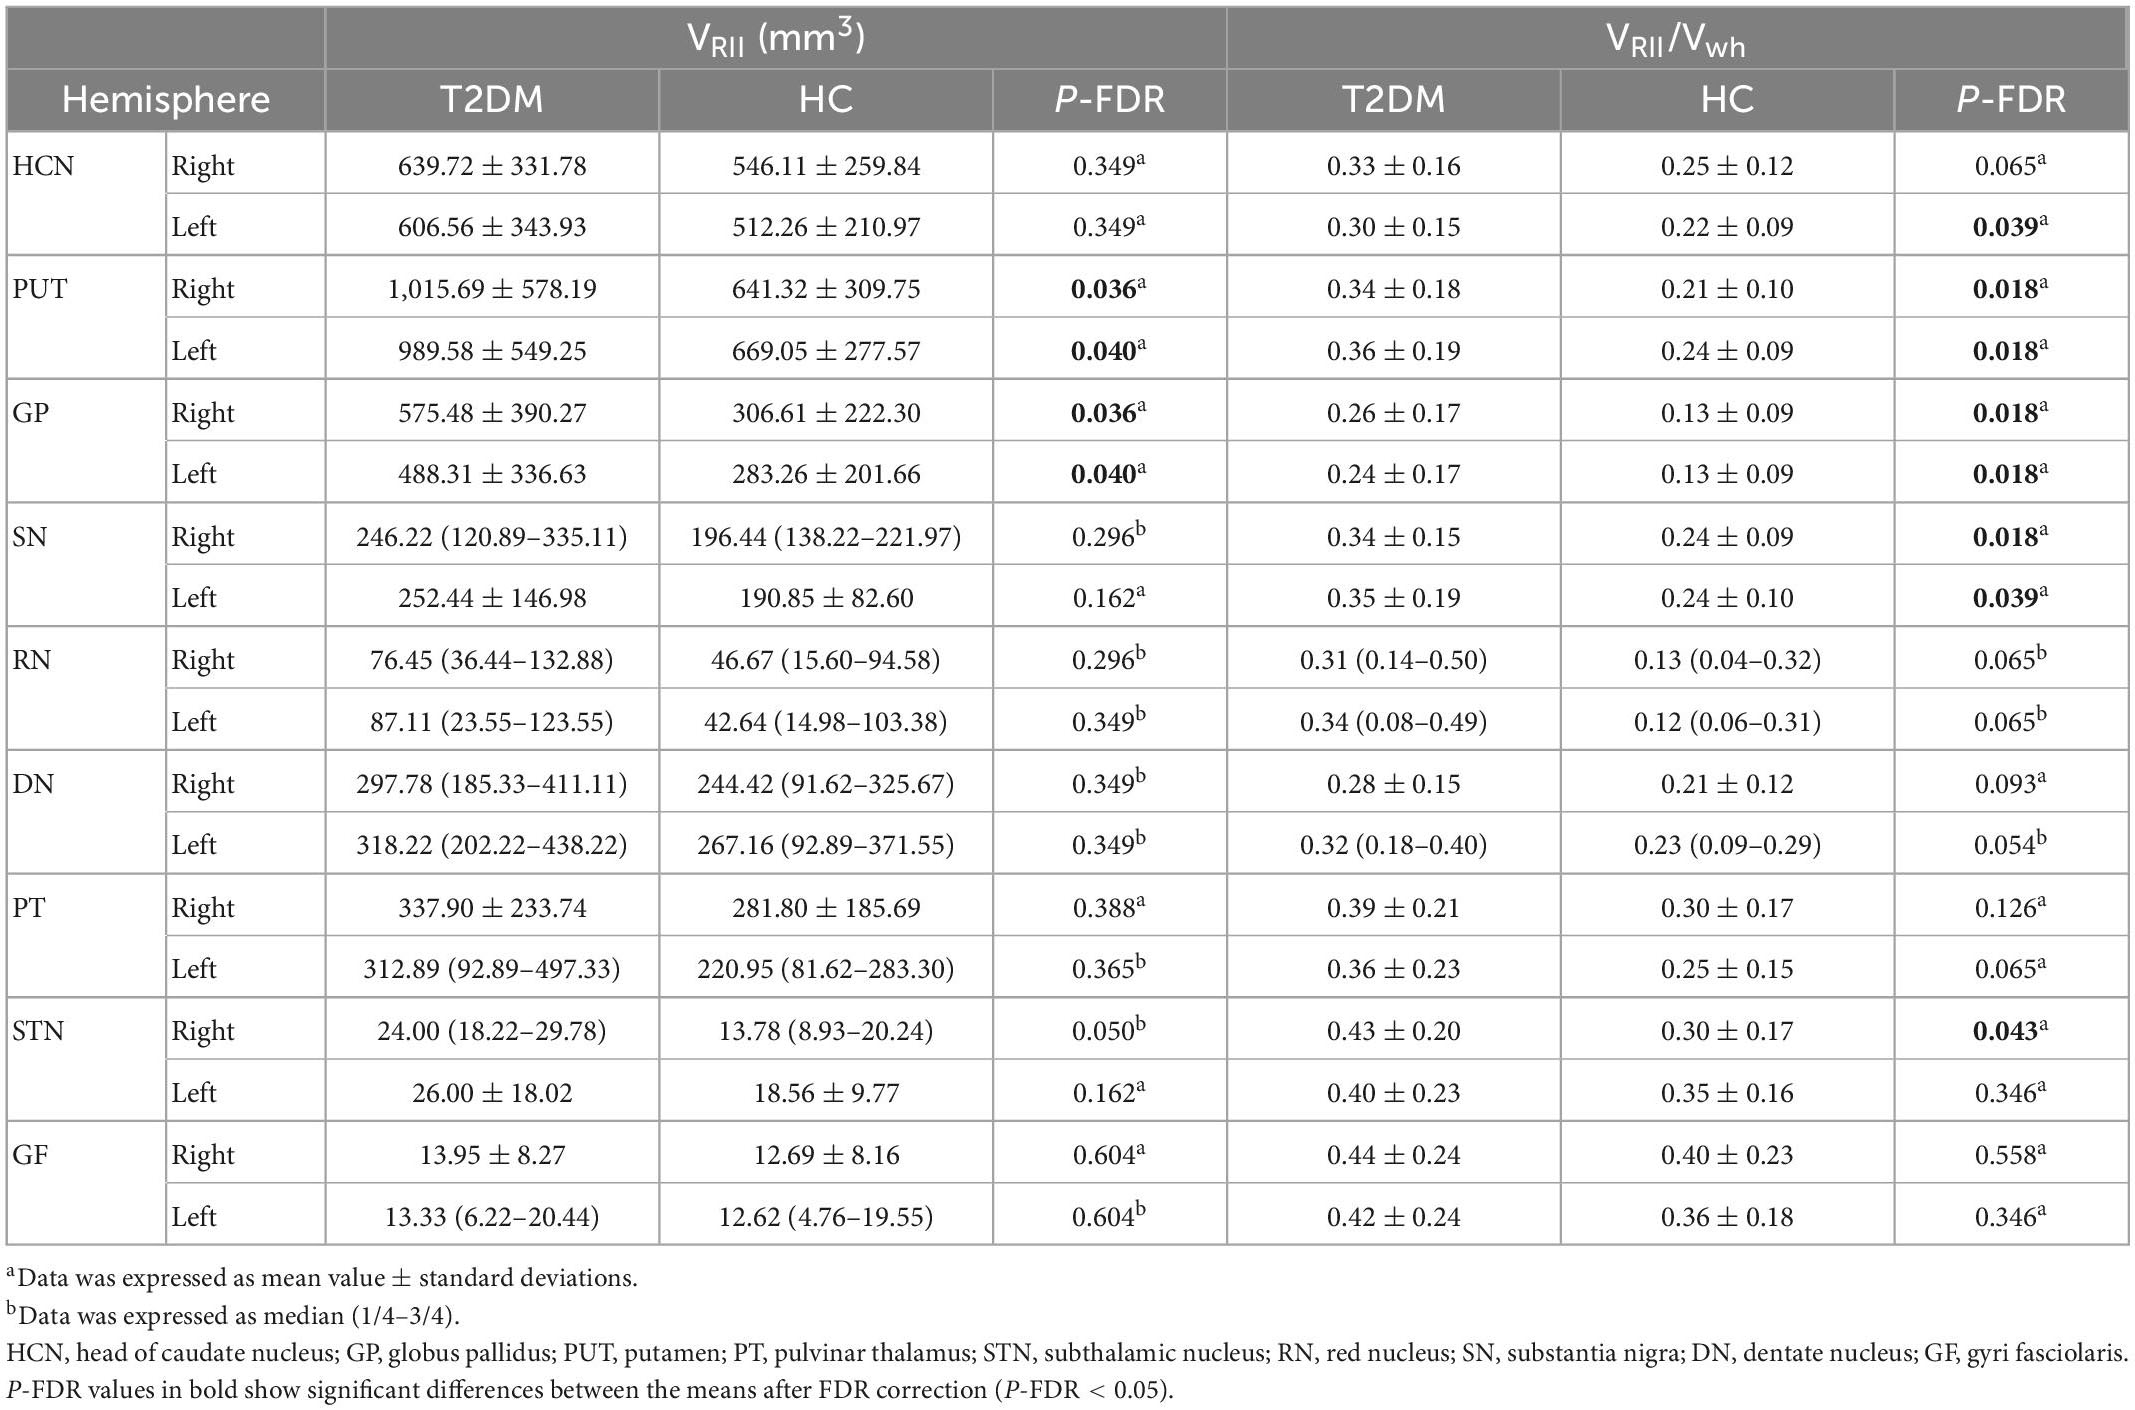
Table 4. Comparison of VRII and VRII/Vwh between type 2 diabetes mellitus (T2DM) and healthy controls (HC).
The VRII/Vwh of all gray matter nuclei in the T2DM group were larger than HC, and significant differences were found in bilateral GP, bilateral PUT, bilateral SN and left HCN, right STN (P < 0.05, Table 4).
Receiver operating characteristic analysis of MSVRII, VRII, and Vwh were summarized in Table 5. The largest area under curve (AUC) of 0.86, the sensitivity of 87.5% and the specificity was 75.9% were obtained when five parameters of bilateral HCN-Vwh, bilateral HCN-MSVRII and right GP-VRII were combined (Figure 4). Delong test showed that the performance of conjoint diagnosis was significantly improved compared with a single parameter (P < 0.05).
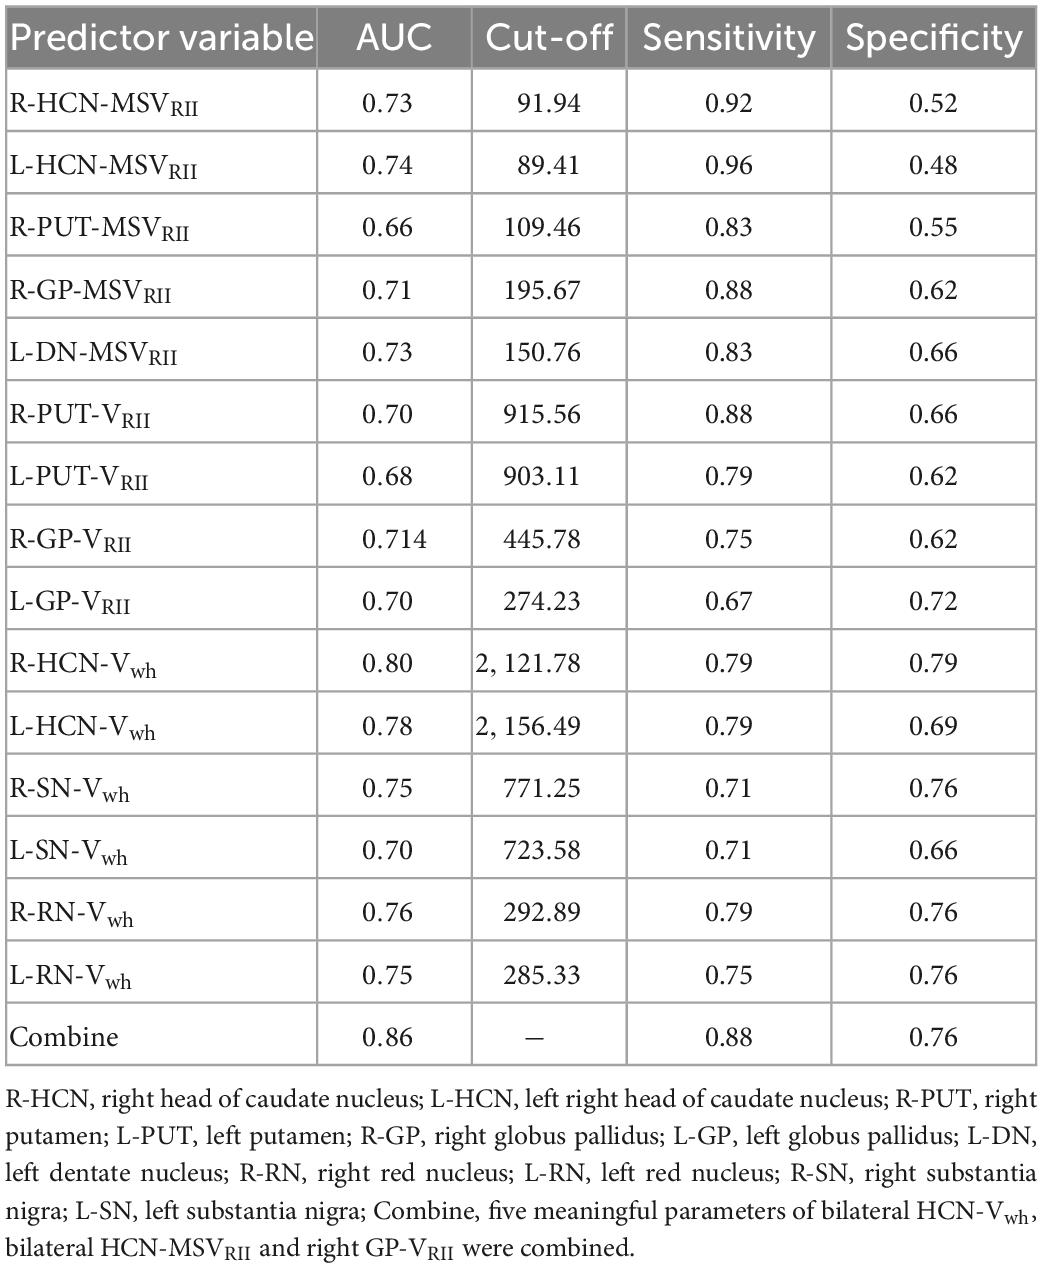
Table 5. Receiver operating characteristic (ROC) analysis of magnetic susceptibility values (MSVRII), VRII, and Vwh between type 2 diabetes mellitus (T2DM) and healthy controls (HC).
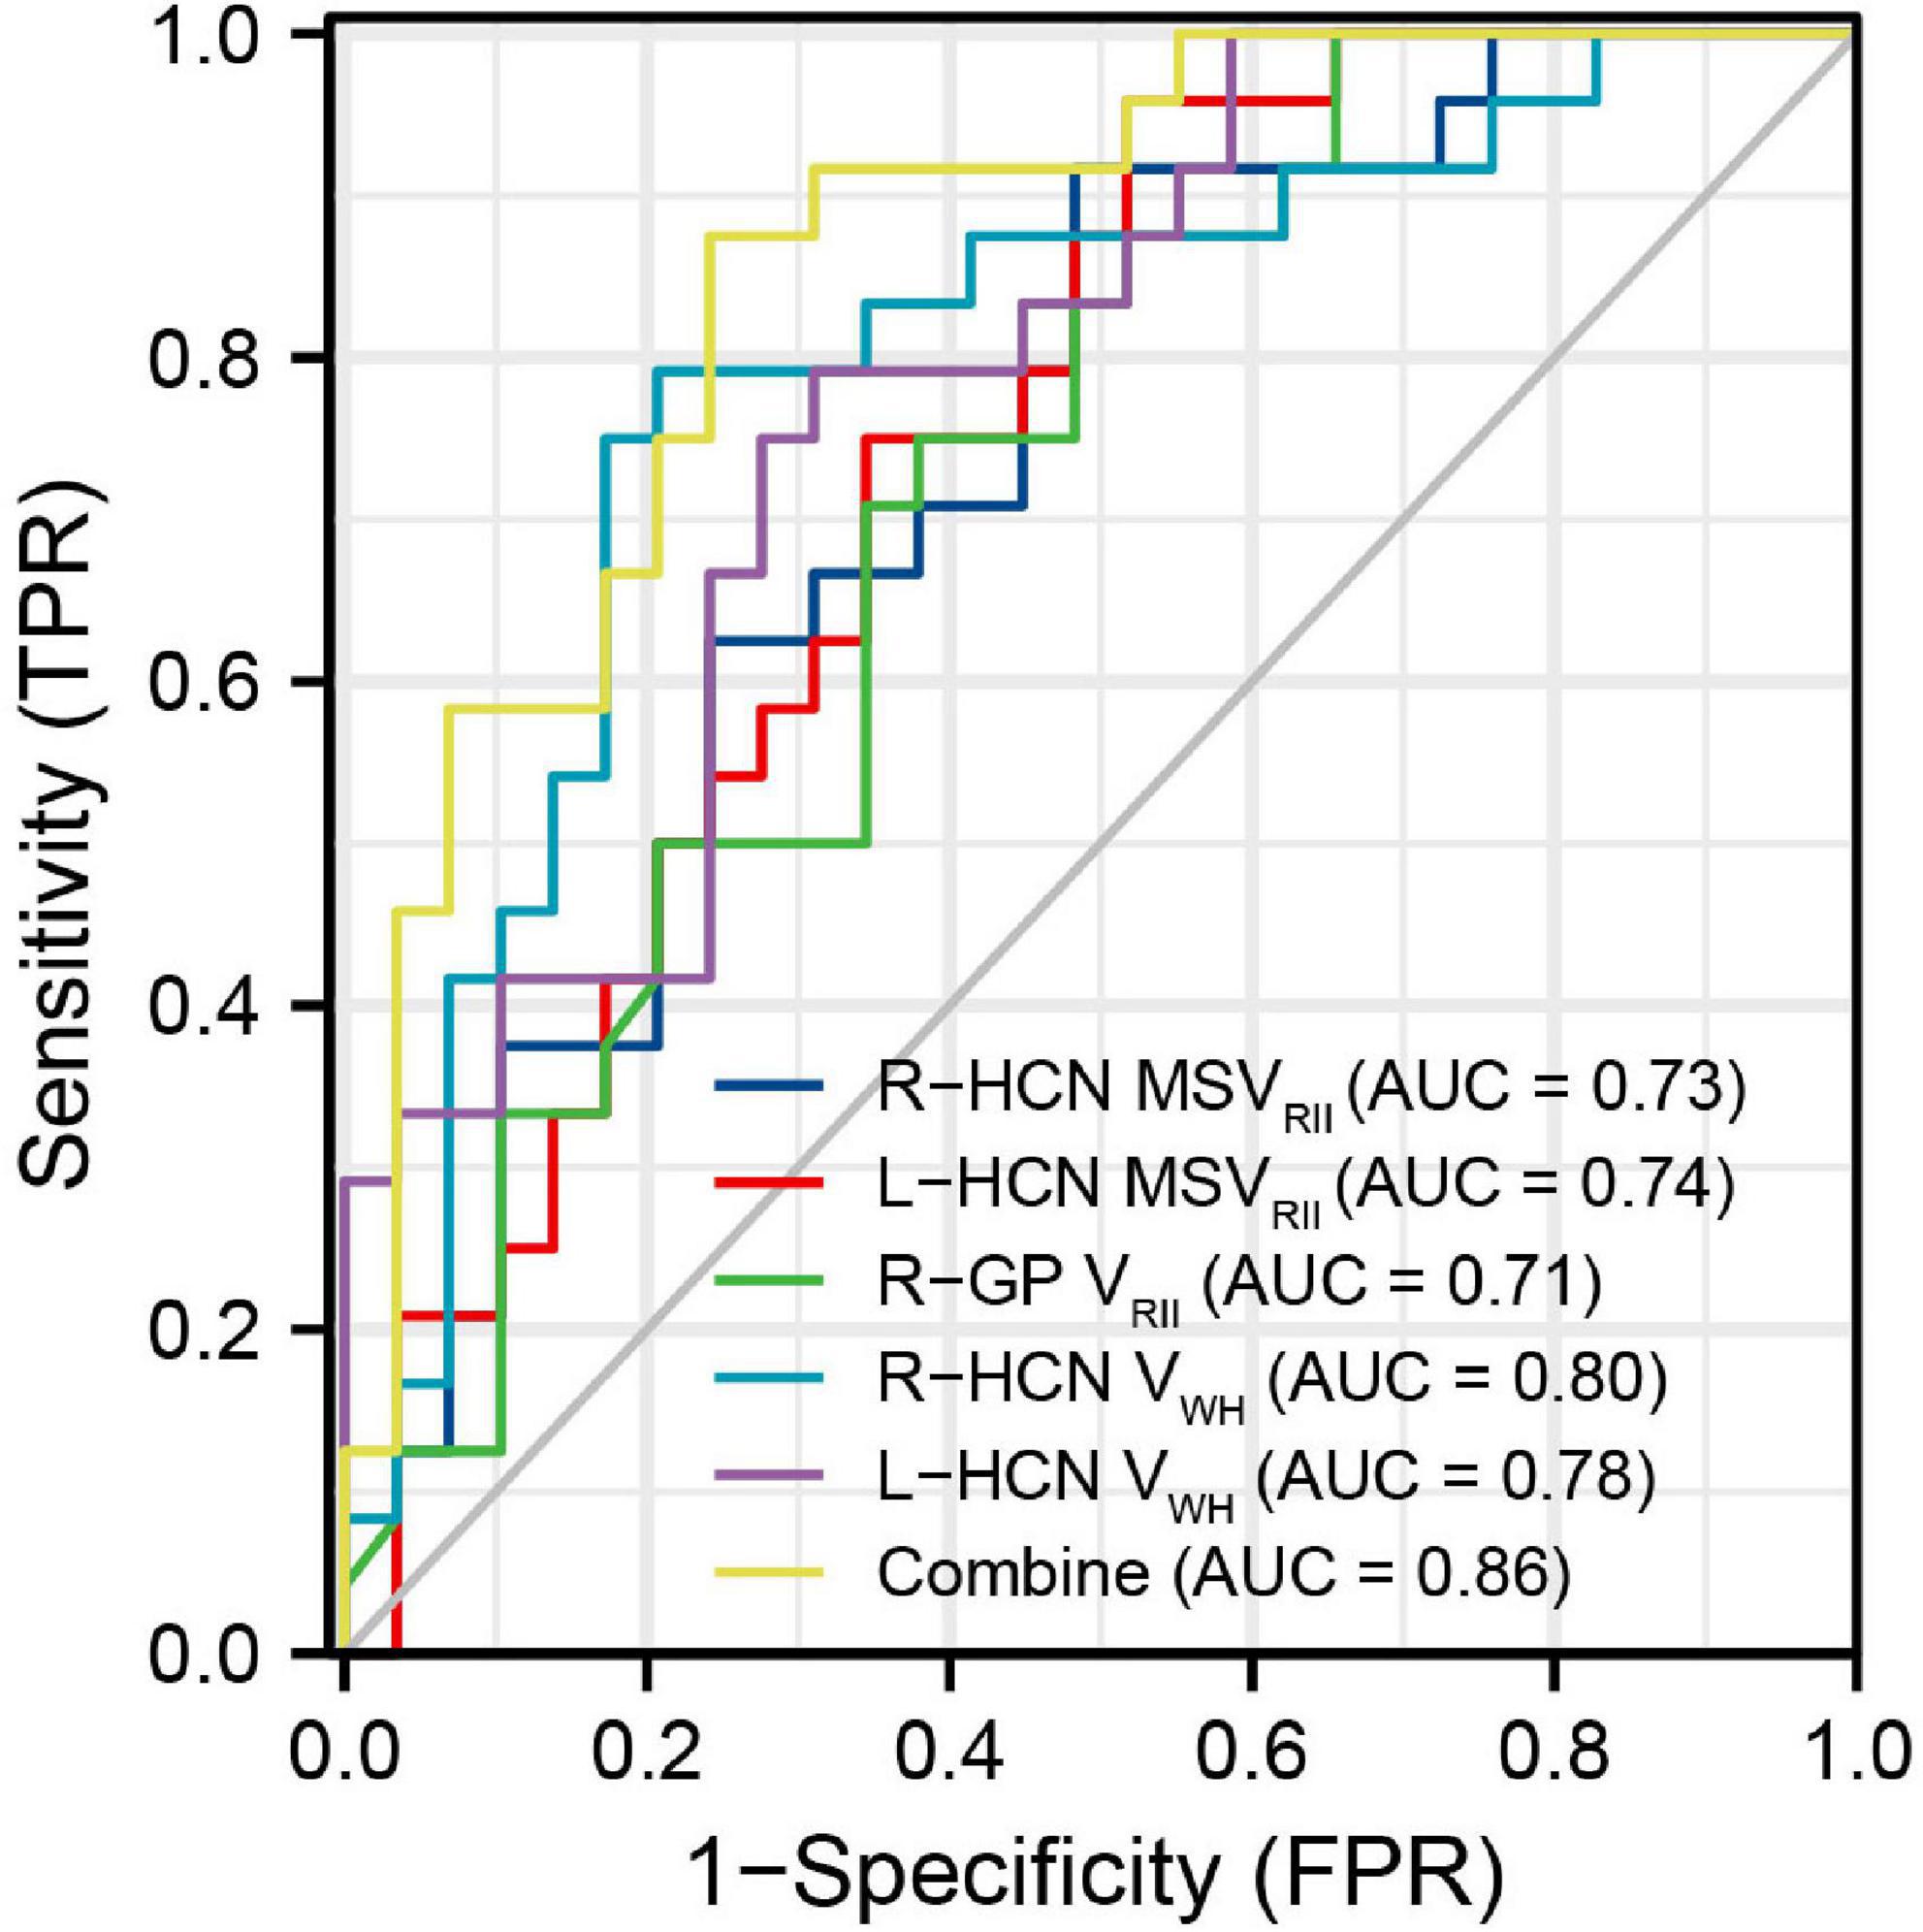
Figure 4. The receiver operating characteristic (ROC) map of conjoint variable analysis composed with five meaningful parameters (combine) had the largest area under curve (AUC) of 0.86.
The correlation between the MSVRII of gray matter nuclei with significant differences and cognitive scores in T2DM group were shown in Figure 5. The MSVRII in the right GP (r = −0.590, P = 0.009), right HCN (r = −0.471, P = 0.047), and right PUT (r = −0.411, P = 0.045) were negatively correlated with List A LDFR. The MSVRII in the right PUT (r = −0.525, P = 0.027), right GP (r = −0.498, P = 0.027), and right HCN (r = −0.427, P = 0.047) were negatively correlated with MMSE. The MSVRII in the right PUT (r = −0.468, P = 0.045) was negatively correlated with MoCA. The MSVRII in the right GP (r = −0.449, P = 0.045) and right PUT (r = −0.393, P = 0.045) were negatively correlated with List A SDCR. The MSVRII in the right HCN (r = −0.441, P = 0.047) was negatively correlated with CVLT trials 1–5 Sum. The MSVRII in the right PUT (r = −0.434, P = 0.045), right HCN (r = −0.429, P = 0.047) were negatively correlated with List A SDFR. The MSVRII in the right GP (r = −0.430, P = 0.045), right PUT (r = −0.421, P = 0.045) were negatively correlated with List A LDCR. The MSVRII in the right PUT (r = −0.420, P = 0.045) was negatively correlated with CVLT trials 1 Sum. Among these, the correlation coefficient lager than −0.45 were represented by scatter plots (Figure 6).
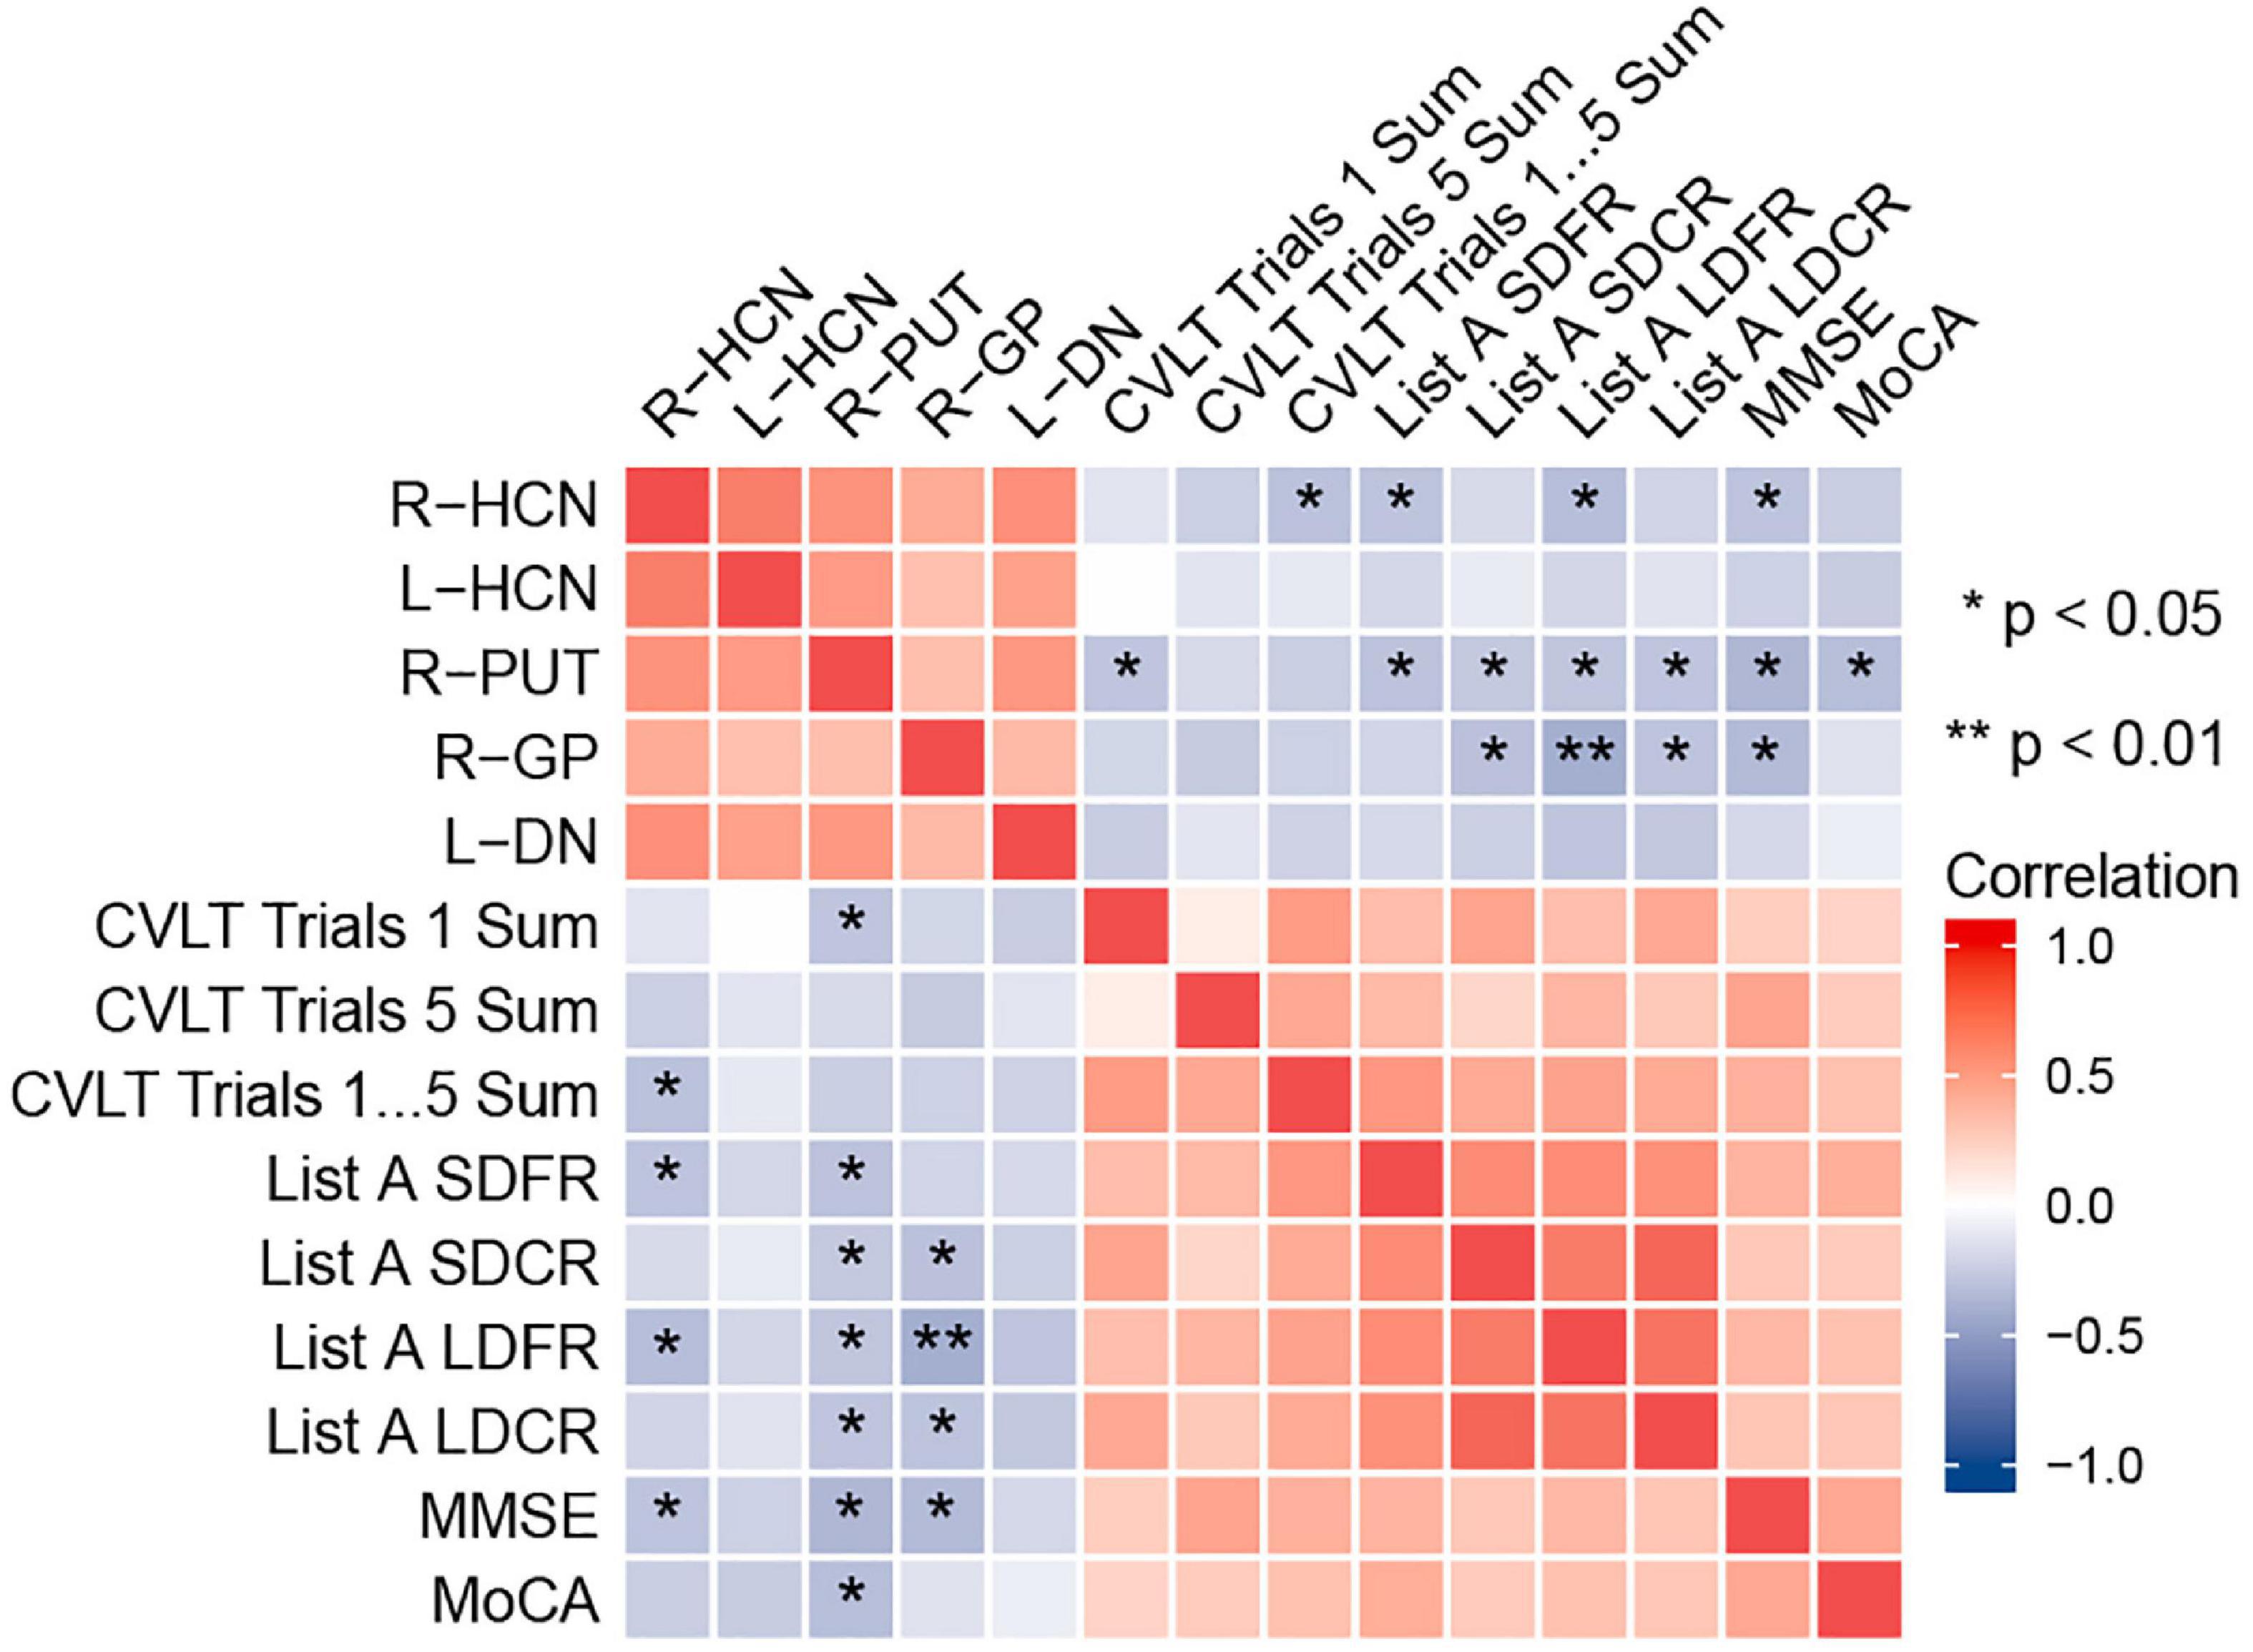
Figure 5. Heat map showing the correlation analysis between gray nucleus magnetic susceptibility values (MSVRII) with significant differences and cognitive scores in type 2 diabetes mellitus (T2DM) group. Color bar on the right side displays the value of the correlation coefficient (higher from –1 to 1, and from blue to red). *P < 0.05, **P < 0.01. List A SDFR, List A Short-delay free recall; List A SDCR, List A Short-delay cued recall; List A LDFR, List A Long-delay free recall; List A LDCR, List A Long-delay cued recall.
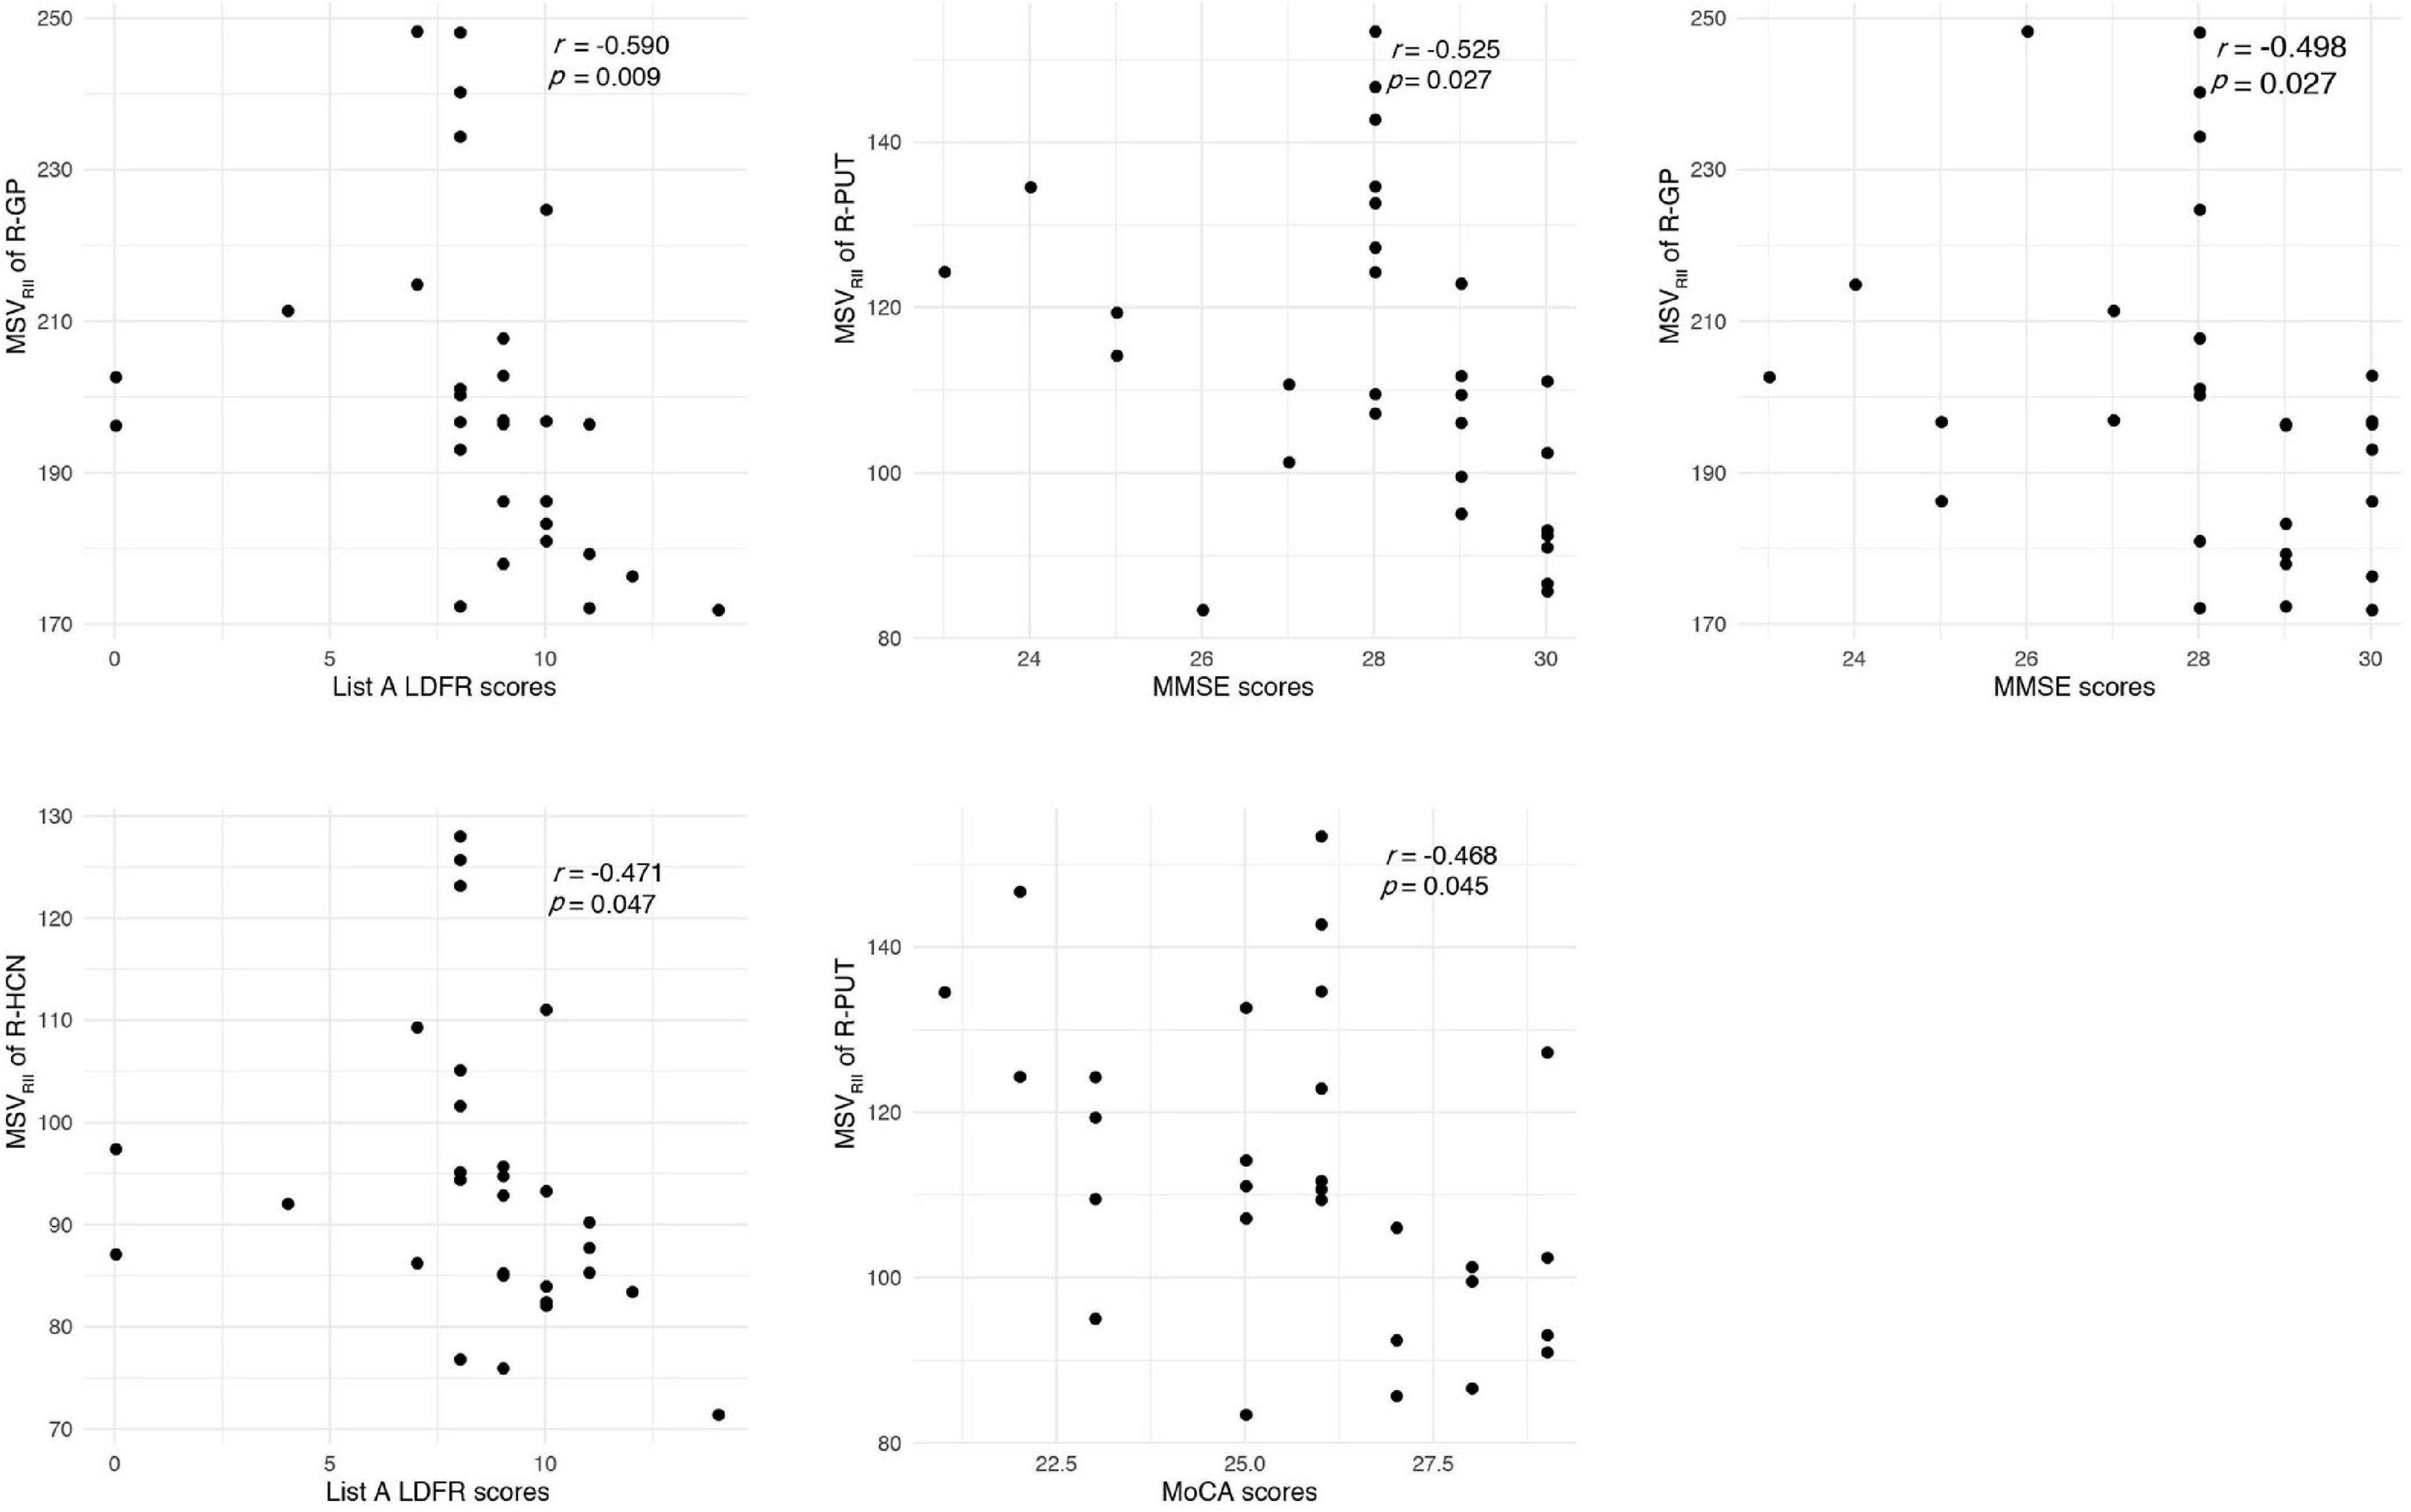
Figure 6. Correlations between magnetic susceptibility values (MSVRII) and cognitive score. The correlation coefficient lager than –0.45 were represented by scatter plots.
However, no correlation was found between MSVRII of gray matter nuclei with significant differences and Vwh in the T2DM group (P > 0.05).
Iron deposition has been found associated with oxidative phosphorylation, while increasing levels of oxidative stress may add the risk of T2DM (Rajpathak et al., 2009). Iron overload could generate reactive oxygen species, thereby destroying DNA, eventually leading to end in neuronal cell death and memory decline (Rouault, 2001; Poon et al., 2004; Melis et al., 2013; Cozzi et al., 2019). Previous studies have shown that a history of T2DM could increase iron deposition in some structures of deep gray matter in elderly individuals (Li et al., 2021). The elevated glucose level may aggravate the iron deposition, and iron accumulation produce damage to brain cells resulting in insulin resistance. The relationship between them seems to be bidirectional (Biessels et al., 1998; Fernández-Real et al., 2002).
With QSM, increased water has a limited effect on relaxation values, so the confounding effect can be avoided, this technique is highly sensitive and represents the most accurate way to measure brain iron levels (Yan et al., 2018). Non-invasive quantitative analysis of brain iron deposition can be achieved by MSV measurement based QSM. Because of the lower confounding effect of myelin and negligible contribution from other paramagnetic materials, QSM has proven to be an accurate method of measuring iron content in deep gray matter structures (Langkammer et al., 2012). In post-mortem studies, QSM contrast is significantly correlated with histochemical measurements of iron in these regions, demonstrating its accuracy at identifying iron deposition (Langkammer et al., 2012; Sun et al., 2015; Hametner et al., 2018; Lee et al., 2018; Lewis et al., 2018; Wang et al., 2020).
The precise mechanisms underlying the higher iron concentration in T2DM are not understood yet. This study combined RII iron content and volume changes of gray matter nuclei in T2DM patients. The differences patterns were explored not only from the perspective of regional high iron and volume, but also from the perspective of whole region volume, and the relationship between abnormal RII iron accumulation and cognitive decline were also evaluated. In this study, it was found that the MSVRII, VRII, and VRII/Vwh of all gray matter nuclei in T2DM group were increased, but the Vwh of most gray matter nuclei in T2DM group was decreased. Correlation analysis showed that the MSVRII of gray matter nuclei was correlated with cognitive function.
Our results showed that there has abnormal RII iron deposition of gray matter nuclei in T2DM patients, after multiple comparison correction. There were significant differences in bilateral HCN, right PUT, right GP and left DN, while another ROI-based study found only PUT had significant difference (Li et al., 2020a). It suggests that regional iron analysis have higher diagnostic sensitivity than whole structural iron analysis. In addition, our results were partially consistent with another voxel-based study (Li et al., 2020b). Significant differences in HCN, PUT and GP on the right were found in both studies. Besides that, significant differences in left HCN and DN were also found. We thought that because of the uneven and relatively concentrated distribution of brain iron, the measurement of RII iron is more sensitive, to find more areas of iron distribution difference.
A previous study on PD showed that the deposition of iron in the lateral SN pars compacta may be related to neuronal loss (Martin et al., 2008). Another study found that excessive iron accumulation was associated with region-specific advanced atrophy (Lee et al., 2013, 2015). Brain iron abnormally accumulates in a number of neurological disorders such as AD, PD leads to the neurotoxicity of oxidative stress which can promote neuron loss and degeneration, and may manifest as brain atrophy (Dixon et al., 2012; Ward et al., 2014; Rao et al., 2022; Yang et al., 2022). Lots of people believe that insulin resistance and diminished insulin signaling in the brain play a role in glucose hypometabolism (Freiherr et al., 2013; Ferreira et al., 2018). Since glucose is the primary source of energy for neurons, greatly reduced glucose metabolism is likely to affect both normal brain function and the processes of repairing and replacing critical cellular components for brain function when they are lost or damaged as a result of disease (Rao et al., 2022), and may also manifest as brain atrophy.
In this study, we found that iron deposition does exist in T2DM, and the iron deposition is accompanied by the reduction of the Vwh, but the VRII of T2DM was higher than that of HC group, thereby more VRII/Vwh regions with statistically significant differences than VRII and Vwh regions were detected. This fully shows that the uneven iron distribution in the gray matter nuclei of T2DM patients, and the effect of secondary atrophy is offset by the fact that the area with high iron deposition is larger than HC, which is manifested by the increase of VRII. There was no significant correlation between MSVRII and Vwh in T2DM group, maybe the changes of MSVRII and Vwh are not synchronized, the shrinkage of the Vwh is caused by a combination of various factors, which needs further research.
Complicated changes of cerebral parenchymal microstructure were happened in T2DM patients, a single variable cannot be used to indicate the pathological changes. The results of this study also showed that compared with a single QSM parameter, the maximum AUC of combined parameters was 0.86, the sensitivity was 87.5%, the specificity was 75.9%, and a higher diagnostic value of comprehensive multiple parameters was found.
Brain iron level was strongly correlated with magnetic susceptibility in vivo and brain iron overload has recently been found associated with early cognitive impairment in animal and human models (Fujiwara et al., 2017; Wu et al., 2020). So far as we know, this is the first time to study the relationship between RII iron and cognitive function in T2DM. We found that the MSVRII of gray matter nuclei with significant differences were negatively correlated with cognitive impairment in T2DM after being corrected by multiple comparisons.
A prior research of iron deposition in T2DM patients found that the susceptibility values of the left PUT showed a close association with MMSE scores but not related to MoCA (Yang et al., 2018; Li et al., 2020a). However, we found the MSVRII of the PUT in T2DM patients were significantly greater than HCs and not only had a close relationship with MMSE, but also negatively correlated with CVLT and MoCA scores. This result indicated that the MSVRII reflect the cognitive function impairment more obviously than global susceptibility values due to the uneven distribution of iron in gray matter nuclei.
Globus pallidus exceeding all other gray nuclei has the highest iron concentration in the human brain (Langkammer et al., 2010; Modica et al., 2015). It is a target region of several neurodegenerative diseases with primary brain iron accumulation etiologies (Rouault, 2013), that had been confirmed in AD and multiple sclerosis (Wang et al., 2014; Fujiwara et al., 2017). Functionally, GP serves a range of cognitive and emotional functions (Schroder et al., 2013). In an MRI case-control study, multivariate regression analysis was used to identify the independent associations of brain iron overload and cognitive performance (Blasco et al., 2014). This result and our results strengthen the hypothesis that brains with regional high iron have a close relationship with cognitive decline. We found that the MSVRII in the right GP had the highest correlation with List A LDFR. As List A LDFR is a reliable and quick test that is more sensitive to the deficit and gives more detailed information about verbal memory than a rough screening tool such as MMSE (Fox et al., 1998). We estimated that deficits in list learning and recall are hallmarks of T2DM.
Head of caudate nucleus not only regulate the movement of the body, but also has a certain impact on the sensory conduction process which is an important part of brain learning and memory system. We found that the increase of MSVRII in the right HCN was significantly associated with the decrease of CVLT trials 1–5 Sum, List A SDFR, List A LDFR and MMSE scores. The change of MSVRII in HCN can reflect cognitive impairment sensitively in T2DM.
There are some limitations in this study. Firstly, the sample size was relatively small, a larger sample size is required to validate our findings. Secondly, manually outlining ROI will inevitably lead to small errors, we did not measure the iron content in the whole area, and RII analysis greatly reduces the possibility of such errors. Thirdly, we only targeted gray matter nuclei rich in iron content, regions closely related to cognition, such as the hippocampus and amygdala, were not included. Fourth, only QSM quantitative measurement of STAGE was used for analysis, other quantitative images can also be used for further study in the future.
In T2DM patients, excessive and heterogeneous iron deposition as well as volume reduction occurs in deep gray nuclei. The MSV in high iron regions can better evaluate the distribution of iron, which is related to the decline of cognitive function. Further evaluations are needed to explore iron burden and volume atrophy in dementia pathology of T2DM in the future.
The original contributions presented in this study are included in this article/supplementary material, further inquiries can be directed to the corresponding authors.
The studies involving humans have been reviewed and approved by the First Affiliated Hospital of Dalian Medical University (PJ-KS-KY-2018-140). The patients/participants provided their written informed consent to participate in this study.
RH and BG: conceptualization, study design, data curation and measurement, formal analysis, visualization, and writing—original draft. ST, YaL, YJ, WL, and YuL: data curation, software application, formal analysis, and investigation. QS: study design, data collection, supervision, and project administration. WW and YM: conceptualization, study design, funding acquisition, supervision, and writing—review and editing. All authors contributed to the article and approved the submitted version.
This work was funded by the National Natural Science Foundation of China (81801657).
The authors declare that the research was conducted in the absence of any commercial or financial relationships that could be construed as a potential conflict of interest.
All claims expressed in this article are solely those of the authors and do not necessarily represent those of their affiliated organizations, or those of the publisher, the editors and the reviewers. Any product that may be evaluated in this article, or claim that may be made by its manufacturer, is not guaranteed or endorsed by the publisher.
Ayton, S., Wang, Y., Diouf, I., Schneider, J. A., Brockman, J., Morris, M. C., et al. (2020). Brain iron is associated with accelerated cognitive decline in people with Alzheimer pathology. Mol. Psychiatry 25, 2932–2941. doi: 10.1038/s41380-019-0375-7
Biessels, G. J., Kamal, A., Urban, I. J., Spruijt, B. M., Erkelens, D. W., and Gispen, W. H. (1998). Water maze learning and hippocampal synaptic plasticity in streptozotocin-diabetic rats: Effects of i nsulin treatment. Brain Res. 800, 125–135. doi: 10.1016/s0006-8993(98)00510-1
Blasco, G., Puig, J., Daunis-I-Estadella, J., Molina, X., Xifra, G., Fernández-Aranda, F., et al. (2014). Brain iron overload, insulin resistance, and cognitive performance in obese subjects: A preliminary MRI case-control study. Diabetes Care 37, 3076–3083. doi: 10.2337/dc14-0664
Chen, Y., Liu, S., Wang, Y., Kang, Y., and Haacke, E. M. (2018). Strategically acquired gradient echo (STAGE) imaging, part I: Creating enhanced T1 contrast and standardized susceptibility weighted imaging and quantitative susceptibility mapping. Magn. Reson. Imaging 46, 130–139. doi: 10.1016/j.mri.2017.10.005
Chung, S., Azar, K. M., Baek, M., Lauderdale, D. S., and Palaniappan, L. P. (2014). Reconsidering the age thresholds for type II diabetes screening in the U.S. Am. J. Prev. Med. 47, 375–381. doi: 10.1016/j.amepre.2014.05.012
Cozzi, A., Orellana, D. I., Santambrogio, P., Rubio, A., Cancellieri, C., Giannelli, S., et al. (2019). Stem cell modeling of neuroferritinopathy reveals iron as a determinant of senescence and ferroptosis during neuronal aging. Stem Cell Rep. 13, 832–846. doi: 10.1016/j.stemcr.2019.09.002
Degen, C., Toro, P., Schonknecht, P., Sattler, C., and Schroder, J. (2016). Diabetes mellitus type II and cognitive capacity in healthy aging, mild cognitive impairment and Alzheimer’s disease. Psychiatry Res. 240, 42–46. doi: 10.1016/j.psychres.2016.04.009
Dixon, S. J., Lemberg, K. M., Lamprecht, M. R., Skouta, R., Zaitsev, E. M., Gleason, C. E., et al. (2012). Ferroptosis: An iron-dependent form of nonapoptotic cell death. Cell 149, 1060–1072. doi: 10.1016/j.cell.2012.03.042
Du, L., Zhao, Z., Cui, A., Zhu, Y., Zhang, L., Liu, J., et al. (2018). Increased iron deposition on brain quantitative susceptibility mapping correlates with decreased cognitive function in Alzheimer’s disease. ACS Chem. Neurosci. 9, 1849–1857. doi: 10.1021/acschemneuro.8b00194
Fernández-Real, J. M., López-Bermejo, A., and Ricart, W. (2002). Cross-talk between iron metabolism and diabetes. Diabetes 51, 2348–2354.
Ferreira, L. S. S., Fernandes, C. S., Vieira, M. N. N., and De Felice, F. G. (2018). Insulin resistance in Alzheimer’s disease. Front. Neurosci. 12:830. doi: 10.3389/fnins.2018.00830
Fox, L. S., Olin, J. T., Erblich, J., Ippen, C. G., and Schneider, L. S. (1998). Severity of cognitive impairment in Alzheimer’s disease affects list learning using the California verbal learning test (CVLT). Int. J. Geriatr. Psychiatry 13, 544–549. doi: 10.1002/(sici)1099-1166(199808)13:8<544::aid-gps821>3.0.co;2-n
Freiherr, J., Hallschmid, M., Frey, W. H. II, Brunner, Y. F., Chapman, C. D., Holscher, C., et al. (2013). Intranasal insulin as a treatment for Alzheimer’s disease: A review of basic research and clinical evidence. CNS Drugs 27, 505–514. doi: 10.1007/s40263-013-0076-8
Fujiwara, E., Kmech, J. A., Cobzas, D., Sun, H., Seres, P., Blevins, G., et al. (2017). Cognitive implications of deep gray matter iron in multiple sclerosis. AJNR Am. J. Neuroradiol. 38, 942–948. doi: 10.3174/ajnr.A5109
Gharabaghi, S., Liu, S., Wang, Y., Chen, Y., Buch, S., Jokar, M., et al. (2020). Multi-echo quantitative susceptibility mapping for strategically acquired gradient echo (STAGE) imaging. Front. Neurosci. 14:581474. doi: 10.3389/fnins.2020.581474
Ghassaban, K., He, N., Sethi, S. K., Huang, P., Chen, S., Yan, F., et al. (2019). Regional high iron in the substantia nigra differentiates Parkinson’s disease patients from healthy controls. Front. Aging Neurosci. 11:106. doi: 10.3389/fnagi.2019.00106
Guo, L., Mei, Y., Guan, J., Tan, X., Xu, Y., Chen, W., et al. (2018). Morphology-adaptive total variation for the reconstruction of quantitative susceptibility map from the magnetic resonance imaging phase. PLoS One 13:e0196922. doi: 10.1371/journal.pone.0196922
Hametner, S., Endmayr, V., Deistung, A., Palmrich, P., Prihoda, M., Haimburger, E., et al. (2018). The influence of brain iron and myelin on magnetic susceptibility and effective transverse relaxation - a biochemical and histological validation study. Neuroimage 179, 117–133. doi: 10.1016/j.neuroimage.2018.06.007
Han, Y. H., Lee, J. H., Kang, B. M., Mun, C. W., Baik, S. K., Shin, Y. I., et al. (2013). Topographical differences of brain iron deposition between progressive supranuclear palsy and parkinsonian variant multiple system atrophy. J. Neurol. Sci. 325, 29–35. doi: 10.1016/j.jns.2012.11.009
He, N., Wu, B., Liu, Y., Zhang, C., Cheng, J., Gao, B., et al. (2022). Stage as a multicenter, multivendor protocol for imaging Parkinson’s disease: A validation study on healthy controls. Chin. J. Acad. Radiol. 5, 47–60. doi: 10.1007/s42058-022-00089-3
Langkammer, C., Krebs, N., Goessler, W., Scheurer, E., Ebner, F., Yen, K., et al. (2010). Quantitative MR imaging of brain iron: A postmortem validation study. Radiology 257, 455–462.
Langkammer, C., Schweser, F., Krebs, N., Deistung, A., Goessler, W., Scheurer, E., et al. (2012). Quantitative susceptibility mapping (Qsm) as a means to measure brain iron? A post mortem validation study. Neuroimage 62, 1593–1599. doi: 10.1016/j.neuroimage.2012.05.049
Lee, H., Baek, S.-Y., Chun, S. Y., Lee, J.-H., and Cho, H. (2018). Specific visualization of neuromelanin-iron complex and ferric iron in the human post-mortem substantia nigra using MR relaxometry at 7T. Neuroimage 172, 874–885. doi: 10.1016/j.neuroimage.2017.11.035
Lee, J. H., Han, Y. H., Kang, B. M., Mun, C. W., Lee, S. J., and Baik, S. K. (2013). Quantitative assessment of subcortical atrophy and iron content in progressive supranuclear palsy and parkinsonian variant of multiple system atrophy. J. Neurol. 260, 2094–2101. doi: 10.1007/s00415-013-6951-x
Lee, J. H., Kim, T. H., Mun, C. W., Kim, T. H., and Han, Y. H. (2015). Progression of subcortical atrophy and iron deposition in multiple system atrophy: A comparison between clinical subtypes. J. Neurol. 262, 1876–1882. doi: 10.1007/s00415-015-7785-5
Lee, J. H., and Lee, M. S. (2019). Brain iron accumulation in atypical parkinsonian syndromes: In vivo MRI evidences for distinctive patterns. Front. Neurol. 10:74. doi: 10.3389/fneur.2019.00074
Lewis, M. M., Du, G., Baccon, J., Snyder, A. M., Murie, B., Cooper, F., et al. (2018). Susceptibility MRI captures nigral pathology in patients with parkinsonian syndromes. Mov. Disord. 33, 1432–1439. doi: 10.1002/mds.27381
Li, J., Zhang, Q., Che, Y., Zhang, N., and Guo, L. (2021). Iron deposition characteristics of deep gray matter in elderly individuals in the community revealed by quantitative susceptibility mapping and multiple factor analysis. Front. Aging Neurosci. 13:611891. doi: 10.3389/fnagi.2021.611891
Li, J., Zhang, Q., Zhang, N., and Guo, L. (2020a). Increased brain iron deposition in the putamen in patients with type 2 diabetes mellitus detected by quantitative susceptibility mapping. J. Diabetes Res. 2020:7242530. doi: 10.1155/2020/7242530
Li, J., Zhang, Q., Zhang, N., and Guo, L. (2020b). Increased brain iron detection by voxel-based quantitative susceptibility mapping in type 2 diabetes mellitus patients with an executive function decline. Front. Neurosci. 14:606182. doi: 10.3389/fnins.2020.606182
Martin, W. R., Wieler, M., and Gee, M. (2008). Midbrain iron content in early Parkinson disease: A potential biomarker of disease status. Neurology 70, 1411–1417. doi: 10.1212/01.wnl.0000286384.31050.b5
McCrimmon, R. J., Ryan, C. M., and Frier, B. M. (2012). Diabetes and cognitive dysfunction. Lancet 379, 2291–2299. doi: 10.1016/s0140-6736(12)60360-2
Melis, J. P., Van Steeg, H., and Luijten, M. (2013). Oxidative DNA damage and nucleotide excision repair. Antioxid. Redox Signal. 18, 2409–2419.
Modica, C. M., Zivadinov, R., Dwyer, M. G., Bergsland, N., Weeks, A. R., and Benedict, R. H. (2015). Iron and volume in the deep gray matter: Association with cognitive impairment in multiple sclerosis. AJNR Am. J. Neuroradiol. 36, 57–62. doi: 10.3174/ajnr.A3998
Pasquier, F., Boulogne, A., Leys, D., and Fontaine, P. (2006). Diabetes mellitus and dementia. Diabetes Metabol. 32, 403–414. doi: 10.1016/s1262-3636(07)70298-7
Poon, H. F., Calabrese, V., Scapagnini, G., and Butterfield, D. A. (2004). Free radicals: Key to brain aging and heme oxygenase as a cellular response to oxidative stress. J. Gerontol. A Biol. Sci. Med. Sci. 59, 478–493.
Rajpathak, S. N., Crandall, J. P., Wylie-Rosett, J., Kabat, G. C., Rohan, T. E., and Hu, F. B. (2009). The role of iron in type 2 diabetes in humans. Biochim. Biophys. Acta 1790, 671–681. doi: 10.1016/j.bbagen.2008.04.005
Rao, I. Y., Hanson, L. R., Johnson, J. C., Rosenbloom, M. H., and Frey, W. H. II (2022). Brain glucose hypometabolism and iron accumulation in different brain regions in Alzheimer’s and Parkinson’s diseases. Pharmaceuticals (Basel) 15:551. doi: 10.3390/ph15050551
Rouault, T. A. (2013). Iron metabolism in the CNS: Implications for neurodegenerative diseases. Nat. Rev. Neurosci. 14, 551–564. doi: 10.1038/nrn3453
Sakurai, K., Kawaguchi, T., Kawai, T., Ogino, H., Hara, M., Okita, K., et al. (2010). Usefulness of 3D-PRESTO imaging in evaluating putaminal abnormality in parkinsonian variant of multiple system atrophy. Neuroradiology 52, 809–814. doi: 10.1007/s00234-009-0621-9
Schroder, N., Figueiredo, L. S., and De Lima, M. N. (2013). Role of brain iron accumulation in cognitive dysfunction: Evidence from animal models and human studies. J. Alzheimers Dis. 34, 797–812. doi: 10.3233/JAD-121996
Sun, H., Walsh, A. J., Lebel, R. M., Blevins, G., Catz, I., Lu, J. Q., et al. (2015). Validation of quantitative susceptibility mapping with Perls’ iron staining for subcortical gray matter. Neuroimage 105, 486–492. doi: 10.1016/j.neuroimage.2014.11.010
Thomas, G. E. C., Leyland, L. A., Schrag, A. E., Lees, A. J., Acosta-Cabronero, J., and Weil, R. S. (2020). Brain iron deposition is linked with cognitive severity in Parkinson’s disease. J. Neurol. Neurosurg. Psychiatry 91, 418–425. doi: 10.1136/jnnp-2019-322042
Wang, C., Foxley, S., Ansorge, O., Bangerter-Christensen, S., Chiew, M., Leonte, A., et al. (2020). Methods for quantitative susceptibility and R2* mapping in whole post-mortem brains at 7T applied to amyotrophic lateral sclerosis. Neuroimage 222:117216. doi: 10.1016/j.neuroimage.2020.117216
Wang, D., Li, Y. Y., Luo, J. H., and Li, Y. H. (2014). Age-related iron deposition in the basal ganglia of controls and Alzheimer disease patients quantified using susceptibility weighted imaging. Arch. Gerontol. Geriatr. 59, 439–449. doi: 10.1016/j.archger.2014.04.002
Wang, Y., Butros, S. R., Shuai, X., Dai, Y., Chen, C., Liu, M., et al. (2012). Different iron-deposition patterns of multiple system atrophy with predominant parkinsonism and idiopathetic Parkinson diseases demonstrated by phase-corrected susceptibility-weighted imaging. AJNR Am. J. Neuroradiol. 33, 266–273. doi: 10.3174/ajnr.A2765
Wang, Z., Luo, X. G., and Gao, C. (2016). Utility of susceptibility-weighted imaging in Parkinson’s disease and atypical Parkinsonian disorders. Transl. Neurodegener. 5:17. doi: 10.1186/s40035-016-0064-2
Ward, R. J., Zucca, F. A., Duyn, J. H., Crichton, R. R., and Zecca, L. (2014). The role of iron in brain ageing and neurodegenerative disorders. Lancet Neurol. 13, 1045–1060. doi: 10.1016/s1474-4422(14)70117-6
Wu, J., Yang, J. J., Cao, Y., Li, H., Zhao, H., Yang, S., et al. (2020). Iron overload contributes to general anaesthesia-induced neurotoxicity and cognitive deficits. J. Neuroinflammation 17:110. doi: 10.1186/s12974-020-01777-6
Yan, F., He, N., Lin, H., and Li, R. (2018). Iron deposition quantification: Applications in the brain and liver. J. Magn. Reson. Imaging 48, 301–317. doi: 10.1002/jmri.26161
Yang, A., Du, L., Gao, W., Liu, B., Chen, Y., Wang, Y., et al. (2022). Associations of cortical iron accumulation with cognition and cerebral atrophy in Alzheimer’s disease. Quant. Imaging Med. Surg. 12, 4570–4586. doi: 10.21037/qims-22-7
Keywords: type 2 diabetes mellitus, quantitative susceptibility mapping, magnetic sensitivity value, deep gray nuclei, volume, heterogeneity, brain iron deposition
Citation: Hu R, Gao B, Tian S, Liu Y, Jiang Y, Li W, Li Y, Song Q, Wang W and Miao Y (2023) Regional high iron deposition on quantitative susceptibility mapping correlates with cognitive decline in type 2 diabetes mellitus. Front. Neurosci. 17:1061156. doi: 10.3389/fnins.2023.1061156
Received: 19 October 2022; Accepted: 10 January 2023;
Published: 30 January 2023.
Edited by:
Wing-Ho Yung, The Chinese University of Hong Kong, Hong Kong SAR, ChinaReviewed by:
Edith Hofer, Medical University of Graz, AustriaCopyright © 2023 Hu, Gao, Tian, Liu, Jiang, Li, Li, Song, Wang and Miao. This is an open-access article distributed under the terms of the Creative Commons Attribution License (CC BY). The use, distribution or reproduction in other forums is permitted, provided the original author(s) and the copyright owner(s) are credited and that the original publication in this journal is cited, in accordance with accepted academic practice. No use, distribution or reproduction is permitted which does not comply with these terms.
*Correspondence: Yanwei Miao,  eXdtaWFvNzE2QDE2My5jb20=; Weiwei Wang,
  d2Vpd2VpMDgxNUAxNjMuY29t
†These authors have contributed equally to this work
Disclaimer: All claims expressed in this article are solely those of the authors and do not necessarily represent those of their affiliated organizations, or those of the publisher, the editors and the reviewers. Any product that may be evaluated in this article or claim that may be made by its manufacturer is not guaranteed or endorsed by the publisher.
Research integrity at Frontiers

Learn more about the work of our research integrity team to safeguard the quality of each article we publish.