 Xiaonan Wang1,2
 Di Wang1,2
 Xinyang Li1,2
 Wenqi Wang3Ping Gao4
 Baohui Lou1
 Josef Pfeuffer5Xianchang Zhang6
 Jinxia Zhu6
 Chunmei Li1,2*
 Min Chen1,2*
- 1Department of Radiology, National Center of Gerontology, Beijing Hospital, Institute of Geriatric Medicine, Chinese Academy of Medical Sciences, Beijing, China
- 2Graduate School of Peking Union Medical College, Chinese Academy of Medical Sciences, Beijing, China
- 3Department of Radiology, Children’s Hospital, Zhejiang University School of Medicine, Hangzhou, China
- 4Department of Neurology, National Center of Gerontology, Beijing Hospital, Institute of Geriatric Medicine, Chinese Academy of Medical Sciences, Beijing, China
- 5MR Application Development, Siemens Healthcare GmbH, Erlangen, Germany
- 6MR Collaboration, Siemens Healthineers Ltd., Beijing, China
Background: Pseudo-continuous arterial spin labeling (pCASL) is widely used to quantify cerebral blood flow (CBF) abnormalities in patients with Alzheimer’s disease (AD). T1-mapping techniques assess microstructural characteristics in various pathologic changes, but their application in AD remains in the exploratory stage. We hypothesized that combining quantitative CBF and T1 values would generate diagnostic results with higher accuracy than using either method alone in discriminating AD patients from cognitively normal control (NC) subjects.
Materials and methods: A total of 45 patients diagnosed with AD and 33 NC subjects were enrolled, and cognitive assessment was performed for each participant according to the Chinese version of the Mini-Mental State Examination (MMSE). T1-weighted magnetization-prepared 2 rapid acquisition gradient echo (MP2RAGE) and pCASL sequence were scanned on a 3T MR scanner. A brain morphometric analysis was integrated into prototype sequence, providing tissue classification and morphometric segmentation results. Quantitative CBF and T1 values of each brain region were automatically generated inline after data acquisition. Independent samples t-test was used to compare regional CBF and T1 values controlled by false discovery rate correction (corrected p < 0.01). The model with combined CBF and T1 values was compared with the individual index by performing receiver operating characteristic curves analysis. The associations between the MMSE score and CBF and T1 values of the brain were investigated using partial correlations.
Results: Cerebral blood flow of the right caudate nucleus (RCc) and left hippocampus (LHc) was significantly lower in the AD group compared with the NC group, while the T1 values of the right caudate nucleus (RCt) and left hippocampus (LHt) increased in the AD group. Prediction accuracies of 73.1, 77.2, 75.9, and 81.3% were achieved for each of the above parameters, respectively. In distinguishing patients from controls using the corresponding optimized cut-off values, most combinations of parameters were elevated (area under curve = 0.775–0.894). The highest area under curve value was 0.944, by combining RCc, LHc, RCt, and LHt.
Conclusion: In this preliminary study, the combined model based on pCASL and T1-mapping improved the diagnostic performance of discriminating AD and NC groups. T1-mapping may become a competitive technique for quantitatively measuring pathologic changes in the brain.
Introduction
Alzheimer’s disease (AD) is a neurodegenerative disease with insidious onset and progressive development. Its main clinical manifestations include memory loss (Jagust et al., 2001), cognitive impairment, and behavioral abnormalities. With the rapidly aging population, degenerative diseases of the central nervous system have become the third most common diseases affecting human survival after cardiovascular and cerebrovascular diseases and cancer (Erkkinen et al., 2018). The number of people with AD-based dementia worldwide is expected to reach 113.4 million by 2050, and the increasing incidence has created a challenging scenario for global public health care systems (Knopman et al., 2021). Despite decades of research, the exact pathogenesis of AD remains to be elucidated. In addition to classical hypotheses, including β-amyloid peptide aggregation leading to neuroplaque formation (Arnold et al., 1991; Montine et al., 2012) and abnormal phosphorylation of tau proteins causing neurogenic fiber tangles (Gallardo and Holtzman, 2019; Dujardin et al., 2020) and early synaptic loss (Rice et al., 2019), multiple risk factors for cerebrovascular disease are closely associated with the development of AD (Cortes-Canteli and Iadecola, 2020). Therefore, discovering non-invasive, objective, quantitative, and reproducible imaging methods that indirectly reflect the pathologic changes of AD pathogenesis will clarify the pathologic process of AD and detect disease progression.
Perfusion abnormality is an integral part of assessing the pathophysiology of AD. Single-photon emission computed tomography (SPECT) and positron emission tomography-computed tomography (PETCT) indirectly reflect blood perfusion through brain glucose metabolism. However, nuclear medicine methods are invasive and involve intravenous radioactive tracer administration, limiting clinical applications. With the development of magnetic resonance imaging (MRI)-based neuroradiology, arterial spin labeling (ASL) is increasingly used as a non-invasive, inexpensive, easily accessible, and reproducible alternative for perfusion measurement (Verfaillie et al., 2015). ASL can quantitatively measure relative cerebral blood flow (CBF) in different brain regions using magnetically labeled water protons in arterial blood as a contrast agent instead of injecting exogenous contrast agents (Chandra et al., 2019). The accuracy of cerebral perfusion maps in AD patients is similar to that of SPECT, whereas ASL is more sensitive to areas with reduced cerebral perfusion (Kaneta et al., 2017). Therefore, this technique may be an alternative to invasive imaging and has the potential to serve as a biomarker in the early diagnosis of preclinical dementia (Xekardaki et al., 2015). Three kinds of ASL techniques are commonly used according to the labeling strategy: continuous ASL, pulsed ASL, and pseudo-continuous ASL (pCASL). Among them, pCASL 3D imaging can be acquired in multiple segments in a short period of time, overcoming magnetic sensitivity and distortion artifacts, and provides good image quality without the need for high-level hardware support (Soman et al., 2021). In this study, we used 3D pCASL to obtain CBF in different brain regions.
Quantitative MRI parameters can reveal not only macroscopic changes in brain tissue but also microstructural changes in the biochemical environment. Among them, longitudinal relaxation time (T1) is the characteristic time governing the relaxation of longitudinal magnetization toward thermal equilibrium after excitation by an RF pulse, and different biological tissues have specific T1 values due to differences in their cellular and interstitial components. Previous studies have shown that an altered T1 value is associated with increased β-amyloid load in the brain of AD patients (House et al., 2008). Experiments based on animal models of AD have also confirmed such tissue alterations (Forster et al., 2013). Previous study found that T1 in the hippocampus, thalamus and right caudate nucleus increased significantly with disease progression in AD patients bilaterally (Su et al., 2016). Therefore, we introduced the T1 values to enhance diagnostic confidence.
We hypothesized that combining CBF and T1 values would yield diagnostic results with greater accuracy than using separate methods in differentiating patients with AD from subjects with normal cognition. To test this hypothesis, we aimed to assess the efficacy of CBF, T1 values, and their combination in discriminating between AD and normal control (NC) cohorts.
Materials and methods
Participants
From September 2020 to October 2021, we prospectively recruited patients with AD and cognitively NC subjects from Beijing Hospital. This study was approved by the Ethics Committee of Beijing Hospital (batch no. 2018BJYYEC-147-02 and 2021BJYYEC-123-01), and all participants signed an informed consent form before the examination.
Criteria for inclusion in the AD group were as follows: (1) The neurologists or psychiatrists diagnosed the patients according to the National Institute of Neurological and Communicative Disorders and Stroke/Alzheimer’s Disease and Related Disorders Association(NINCDS-ADRDA) criteria (McKhann et al., 1984). (2) MRI was completed within 48 h after the clinical diagnosis of AD. (3) Right handedness.
Normal control subjects were recruited from 20 community social centers in four districts and were included in this study based on the following criteria: (1) age and gender matching that of the AD group; (2) Chinese version of the MMSE score ≥ 27; and (3) Right handedness.
Exclusion criteria for the AD were as follows: (1) diagnosis of central nervous system tumor (n = 1), stroke (n = 2), and hydrocephalus (n = 1) on routine head MRI examination; (2) dementia of vascular origin with a score of ≥4 on the Harkinski Ischemic Index Scale (n = 2); (3) thyroid dysfunction, depression, drug addiction, substance abuse, or other diseases that cause abnormal cognitive function; (4) other reasons that prevented head MRI examination or cooperation with completion of the neuropsychologic scale, Claustrophobia diseases (n = 1); and (5) motion and metal artifacts (n = 3). Finally, 45 patients with AD and 33 NC individuals were eligible for this study.
MRI protocol
Clinical information collection and neuropsychologic scale scoring were completed at the Department of Neurology, Beijing Hospital. MRI examinations were performed within 60 min of clinical information collection.
All MR examinations were performed on a 3T MR system (MAGNETOM Prisma, Siemens Healthcare, Erlangen, Germany) with a 64-channel head coil. pCASL was performed using a prototype 3D gradient and spin-echo (GRASE) sequence with the following parameters: TR/TE = 4350/20.9 ms, FOV = 220 mm × 220 mm, matrix = 64 × 64 (interpolated to 128 × 128), bolus duration = 1,800 ms, 16 label timesTI = 800–3800 ms (Δ = 200 ms), and acquisition time = 4 min 55 s including a M0 calibration volume. Regional CBF maps were automatically generated inline after data acquisition (Buxton et al., 1998; Alsop et al., 2015). For quantification, the following parameters were used: blood/tissue water partition coefficient lambda = 0.9 mL/g, labeling efficiency alpha = 60% (four background suppression pulses accounted for), T1_blood = 1650 ms and T1_tissue = 1330 ms. T1 mapping was obtained using a prototype T1 magnetization prepared 2 rapid acquisition gradient echoes (MP2RAGE) sequence with the following parameters: TR/TE = 5000/3.59 ms, TI = 700/2500 ms, FA = 4°/5°, FOV = 230 mm × 216 mm, matrix = 320 × 240, and acquisition time = 3 min. MP2RAGE sequence produced simultaneously three contrast images (INV1, INV2, UNI) and a quantitative T1-mapping (Marques et al., 2010).
Image processing
A brain morphometry analysis was integrated into the prototype MP2RAGE sequence, providing tissue classification and morphometric segmentation results (Schmitter et al., 2014; Boto et al., 2017). In short, MP2RAGE-UNI image was used to segment the brain into 48 areas, among them. After registering the perfusion-weighted images to the MP2RAGE-UNI images, the obtained 48 brain area masks were used to extract CBF and T1 values for regional comparison between the AD and NC groups. Previous studies have shown that decreased CBF and elevated T1 values in patients with AD occur in specific brain regions (Wolk and Detre, 2012; Wang et al., 2013; Chandra et al., 2019). Therefore, we selected the bilateral thalamus, caudate nucleus, putamen, pallidum, hippocampus, frontal gray matter, parietal gray matter, occipital gray matter, temporal gray matter, cingulate gray matter, corpus callosum white matter, and insula as regions of interest to reduce the overfitting problem caused by irrelevant brain regions.
Statistical analysis
All data were analyzed using SPSS (version 24.0),1 MedCalc 19.0, and MATLAB (MathWorks, Natick, MA, United States). The Kolmogorov–Smirnov and Levene tests were used to assess the normality and variance of CBF and T1 values. Data conforming to a normal distribution are expressed as ± s, and non-conformities are denoted by M (Q1, Q3). Normally distributed data with homogeneous variances were compared between AD and NC groups using independent samples t-tests, and those with non-homogeneous variances used corrected t-tests. The non-parametric Mann–Whitney U test was used for those that were not normally distributed. The gender difference between the two groups was tested by chi-square. Logistic regression analysis was used to identify brain regions associated with AD diagnosis and establish a combined model. The diagnostic efficacy of each brain region and the combined model for AD were assessed using receiver operating characteristic (ROC) curves, and differences among non-homogeneous variances the areas under the curve (AUCs) were compared using the DeLong method. The correlation between MMSE scores was analyzed using partial correlation analysis, and the level of significance was set at P < 0.05. Multiple comparisons were controlled using false discovery rate (FDR) correction (corrected p < 0.01).
Results
Demographics of the 78 participants are shown in Table 1. The differential CBF in different brain regions between AD and NC individuals is shown in Figure 1. There were five brain regions with significantly lower CBF values in patients with AD compared with the NC subjects, including the right caudate nucleus, left hippocampus, right parietal gray matter, right corpus callosum, and right insula. Comparing the T1 values of the above five brain regions using the same method, the right caudate nucleus, left hippocampus, right parietal gray matter, and right insula were also significantly different (corrected p < 0.01). The T1 value of the right corpus callosum was higher in the NC group, but the difference was not statistically significant (corrected p = 0.375).
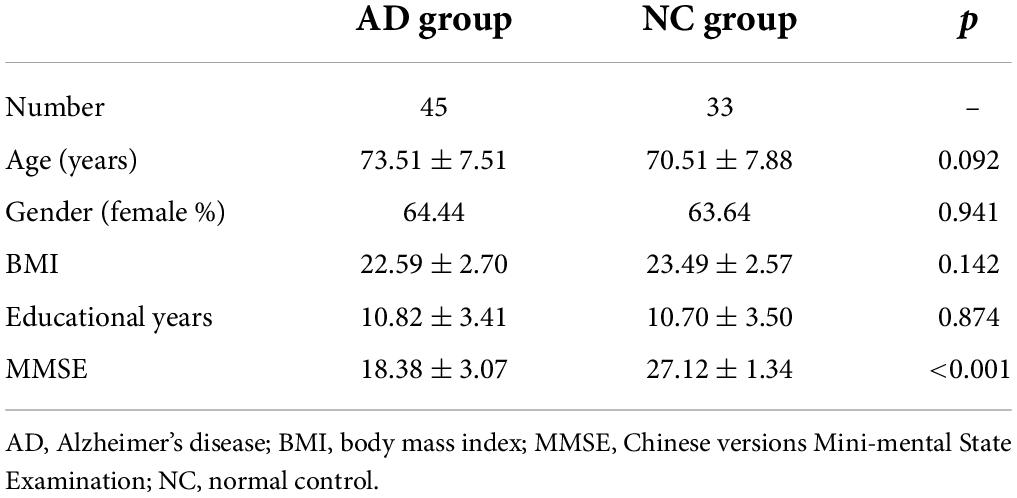
Table 1. Demographic and clinical data.
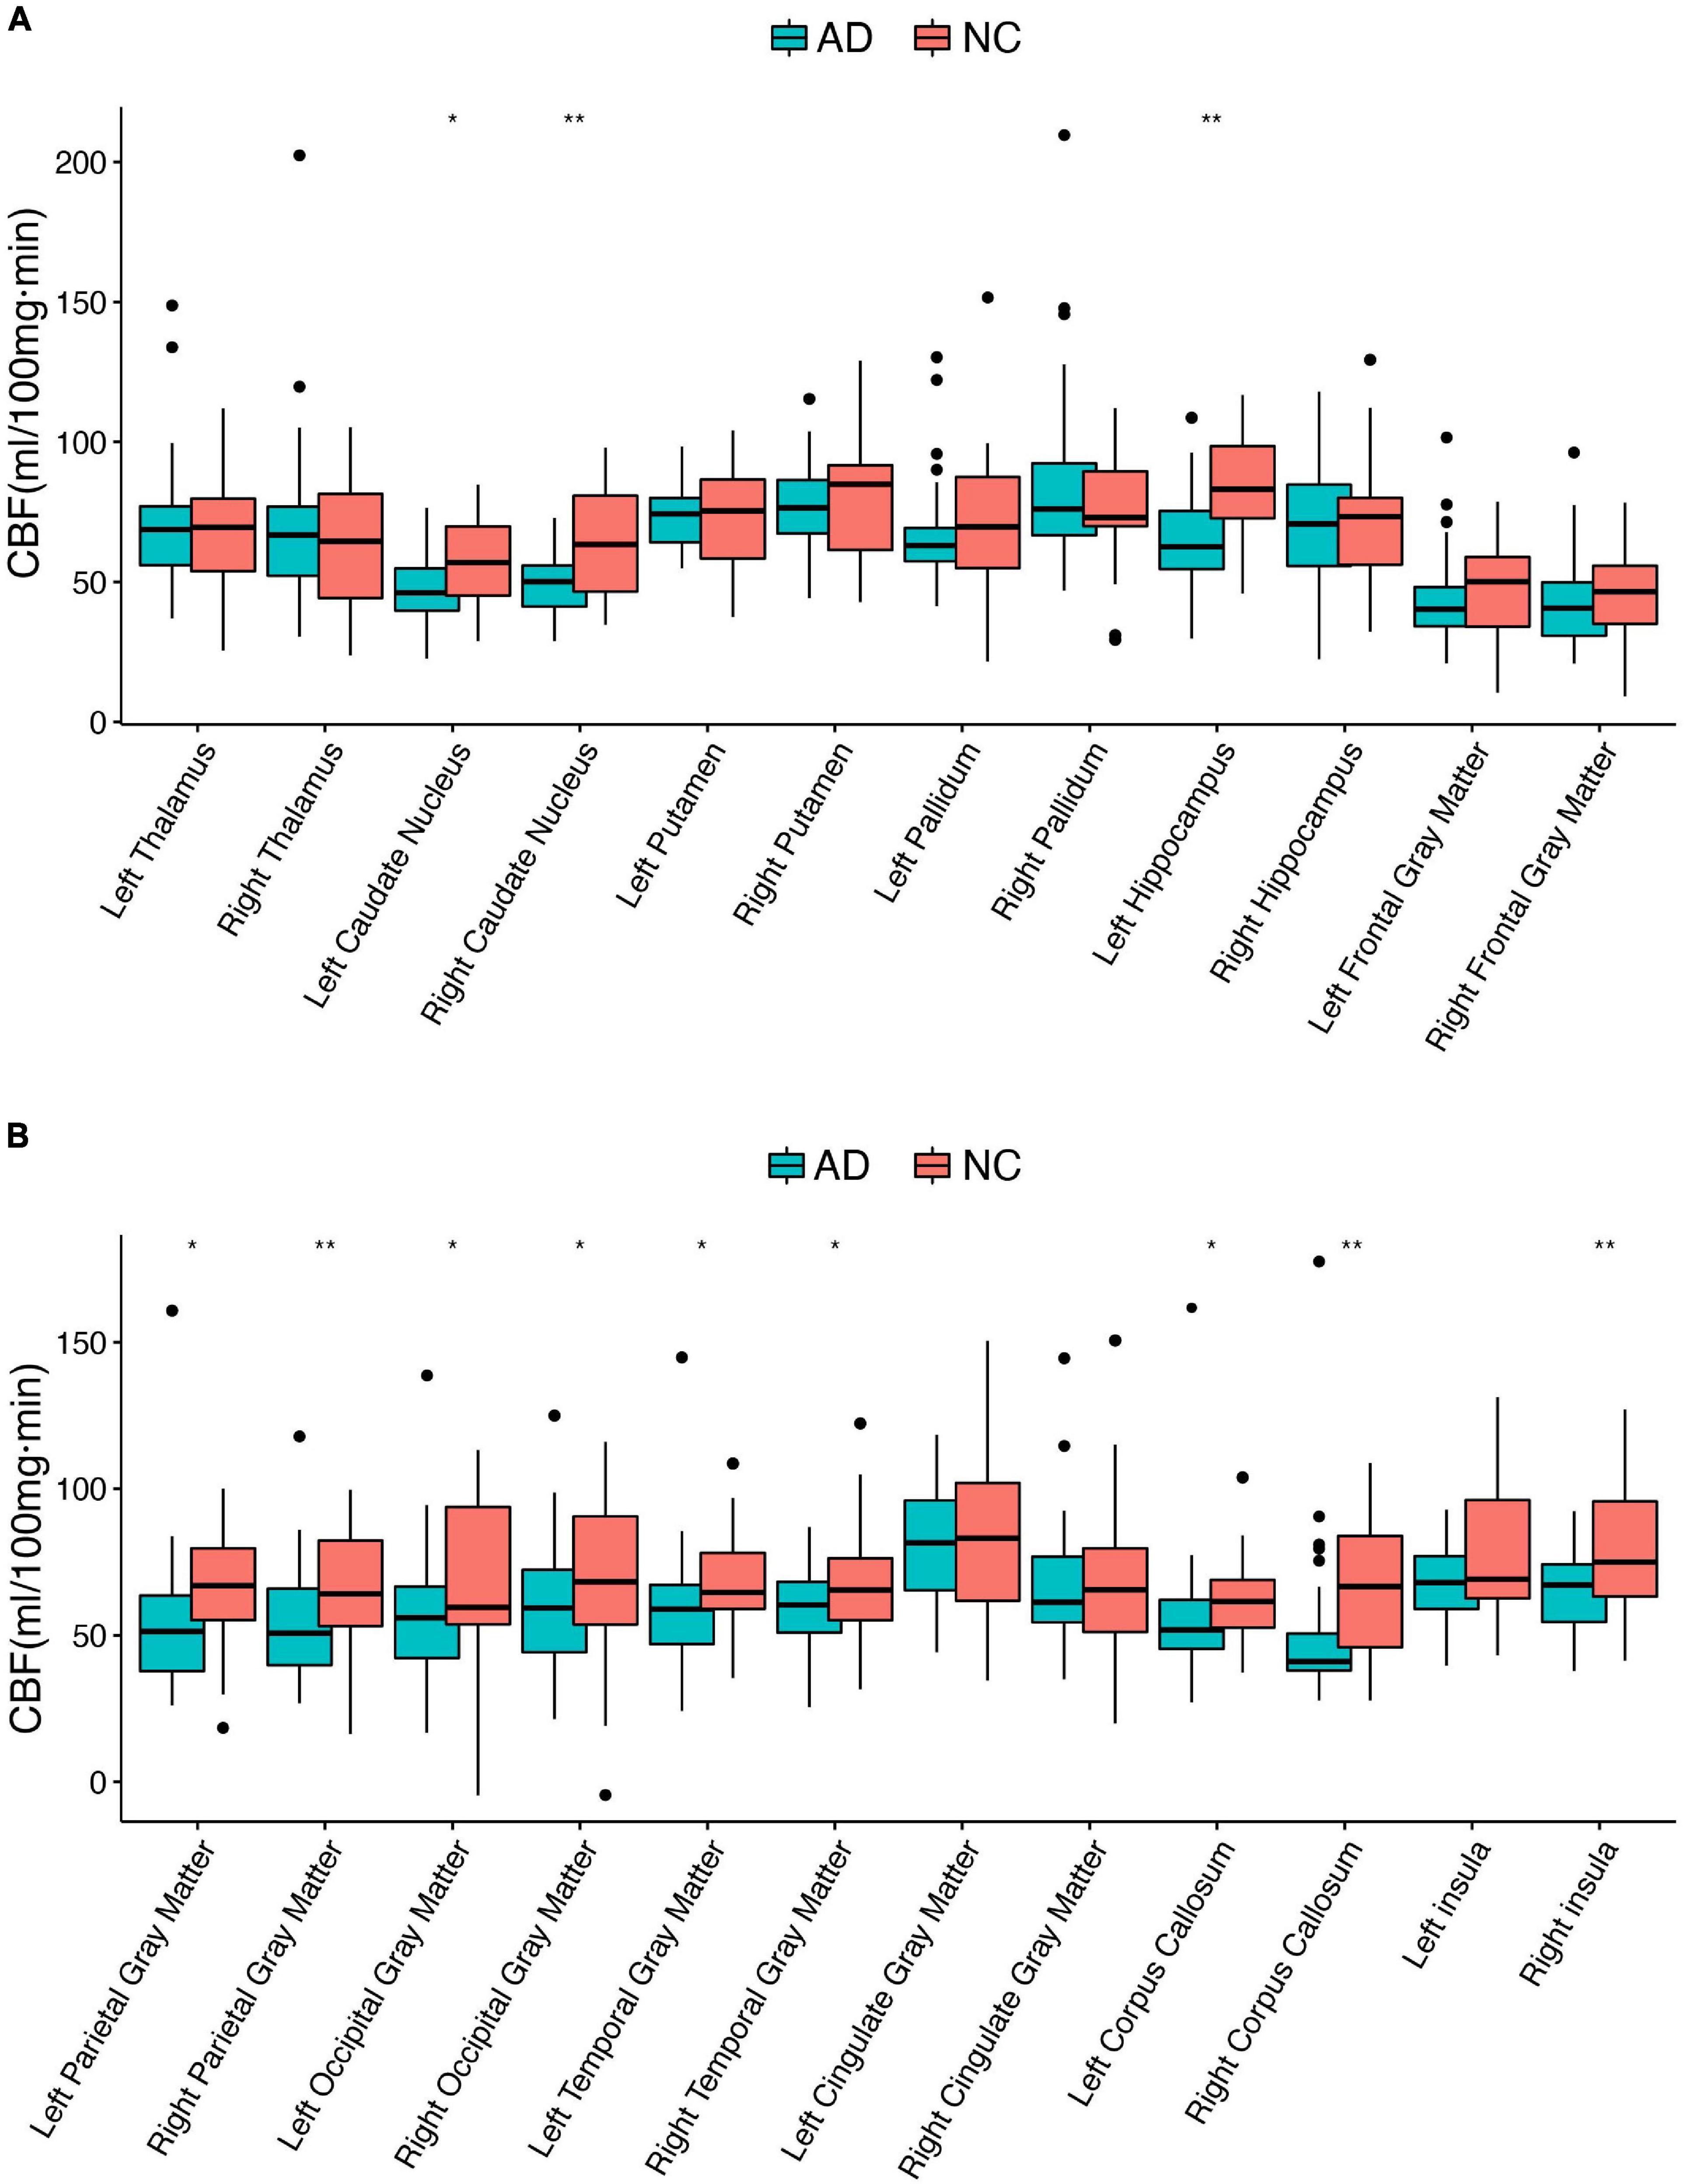
Figure 1. Differential cerebral blood flow between AD and NC individuals in 24 brain regions. AD, Alzheimer’s disease; CBF, cerebral blood flow; NC, normal controls; *corrected p < 0.05; **corrected p < 0.01. (A,B) Boxplots of the CBF in different brain regions.
According to logistic regression analysis, the right caudate nucleus (odds ratio [OR] 0.959, p < 0.05) and left hippocampus (OR 0.960, p < 0.05) were the two relevant brain regions for perfusion abnormalities in AD, CBF of the right caudate nucleus (RCc) and left hippocampus (LHc) were show in Figure 2. Then, a multiple combined model was established corresponding to the T1 values.
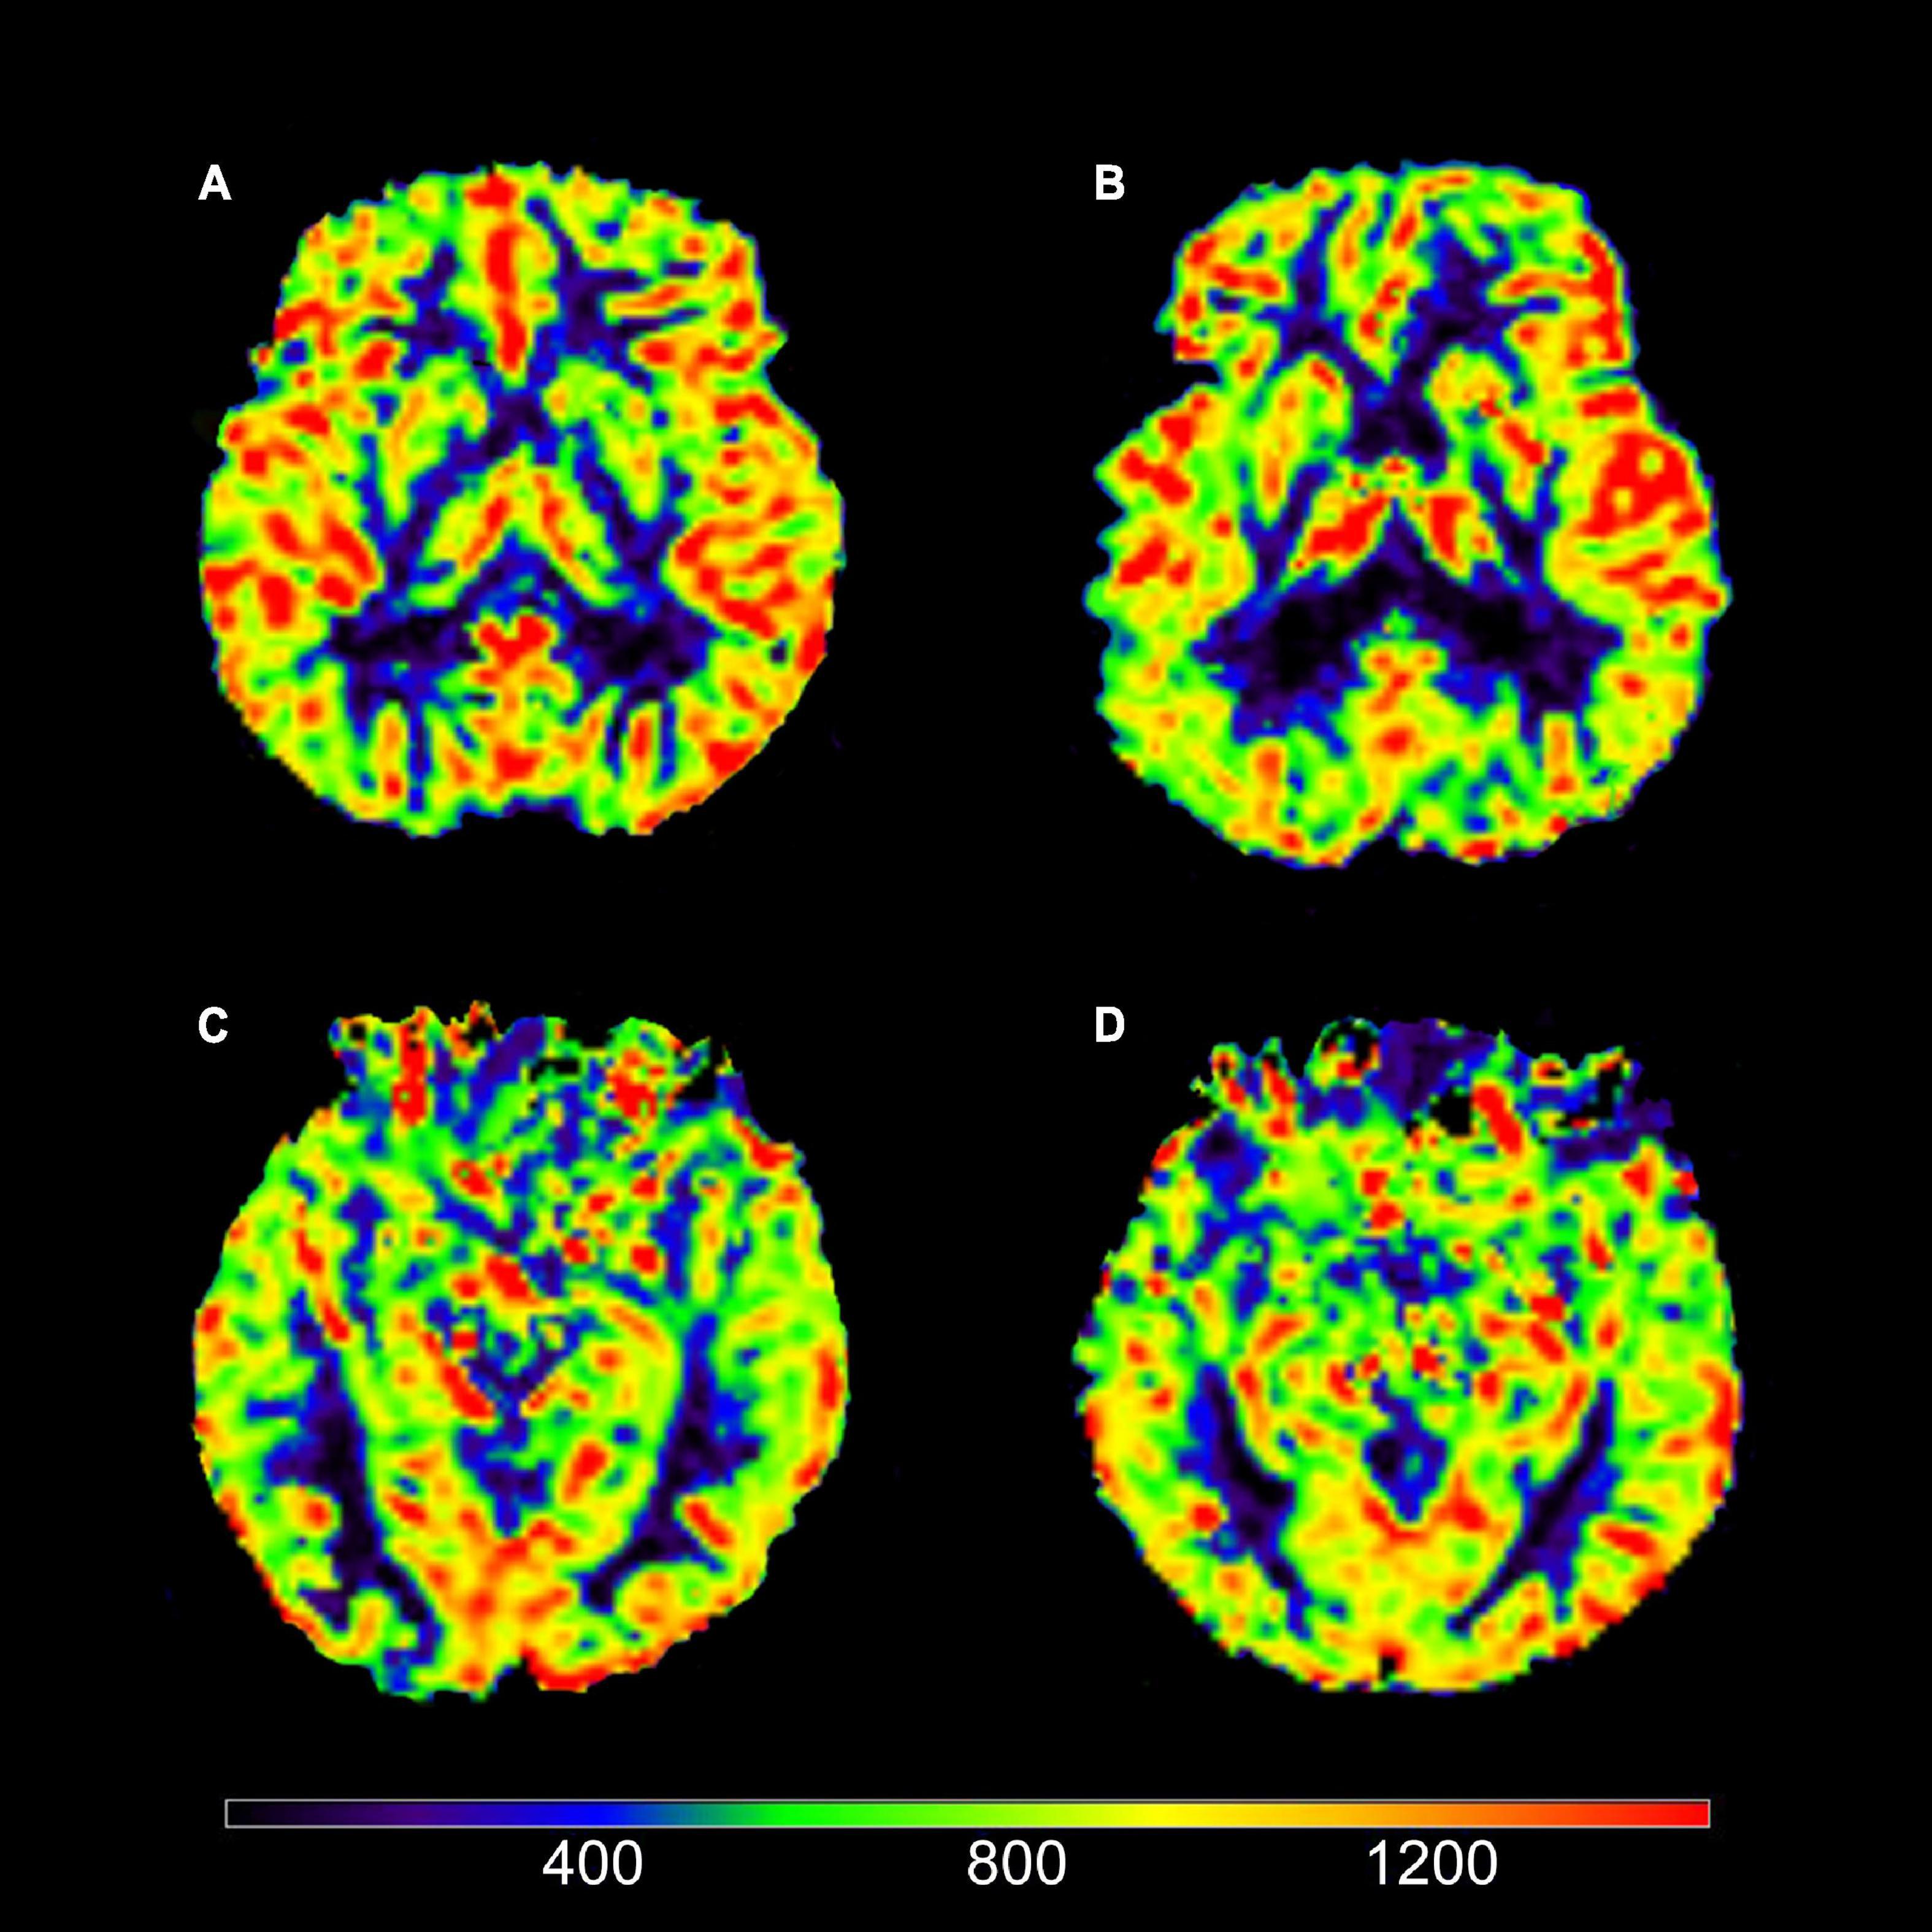
Figure 2. Axial view of cerebral blood flow (CBF). (A) Image of a typical AD patient (female; 67 years old). (B) Image of a NC subject (male; 73 years old). (C) Image of a typical AD patient (female; 64 years old). (D) Image of a NC subject (female; 64 years old). It could be intuitively shown that (A) views had decreased CBF in right caudate nucleus (RCc) compared to (B) views; (C) views had decreased CBF in left hippocampus (LHc) compared to (D) views.
The highest AUC value was 0.894 (sensitivity = 0.889, specificity = 0.818), obtained by combining CBF in the right caudate nucleus (RCc), CBF in the left hippocampus (LHc), T1 value in the right caudate nucleus (RCt), and T1 value in the left hippocampus (LHt) (Figures 3–5 and Table 2). On DeLong inspection, there was no significant difference in the diagnostic efficacy between the four single-parameter diagnostic models. The combined model had different degrees of increased diagnostic efficacy compared with the single-parameter model. RCc compared with RCc_LHc_RCt_LHt (p = 0.001); LHc compared with RCc_LHc_RCt_LHt (p = 0.006); RCt compared with RCc_LHc_RCt_LHt (p = 0.023); and LHt compared with RCc_LHc_RCt_LHt (p = 0.066).
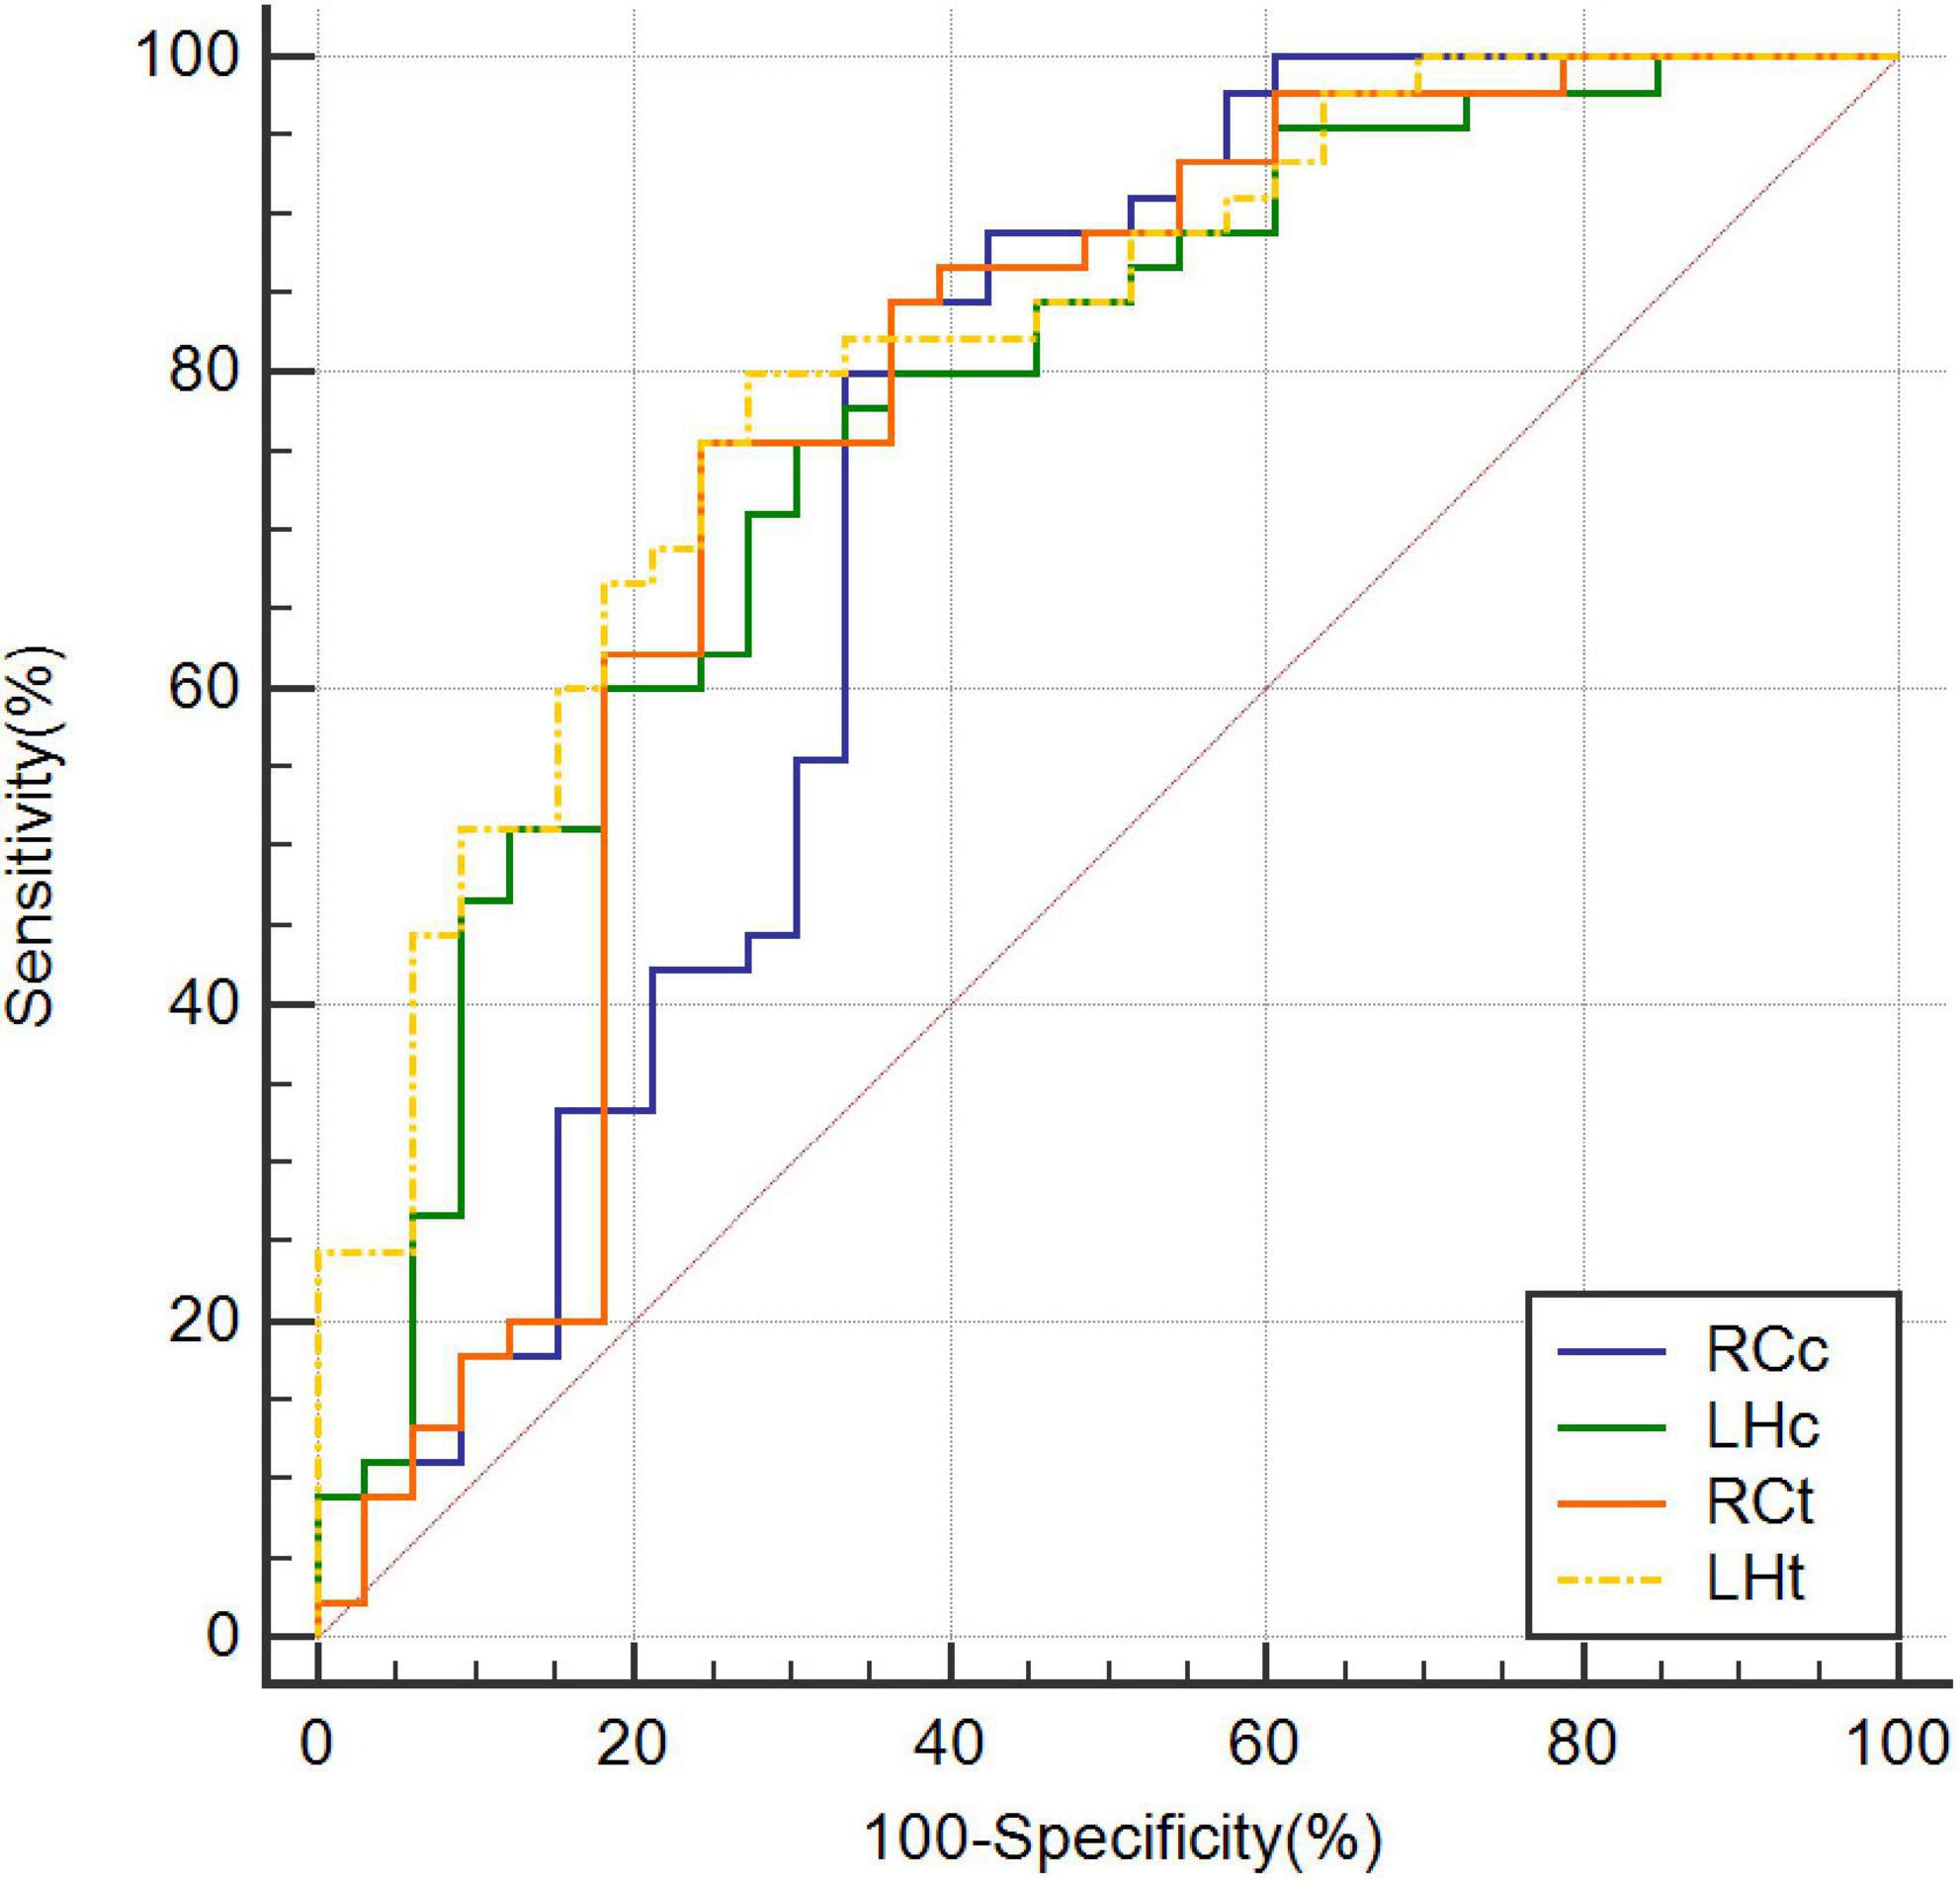
Figure 3. Receiver operating characteristic curves based on CBF of RCc, CBF of LHc, T1 value of RCt, and T1 value of LHt, respectively. CBF, cerebral blood flow; LHc, left hippocampus; LHt, left hippocampus; ROC, receiver operating characteristic; RCc, right caudate nucleus; RCt, right caudate nucleus.
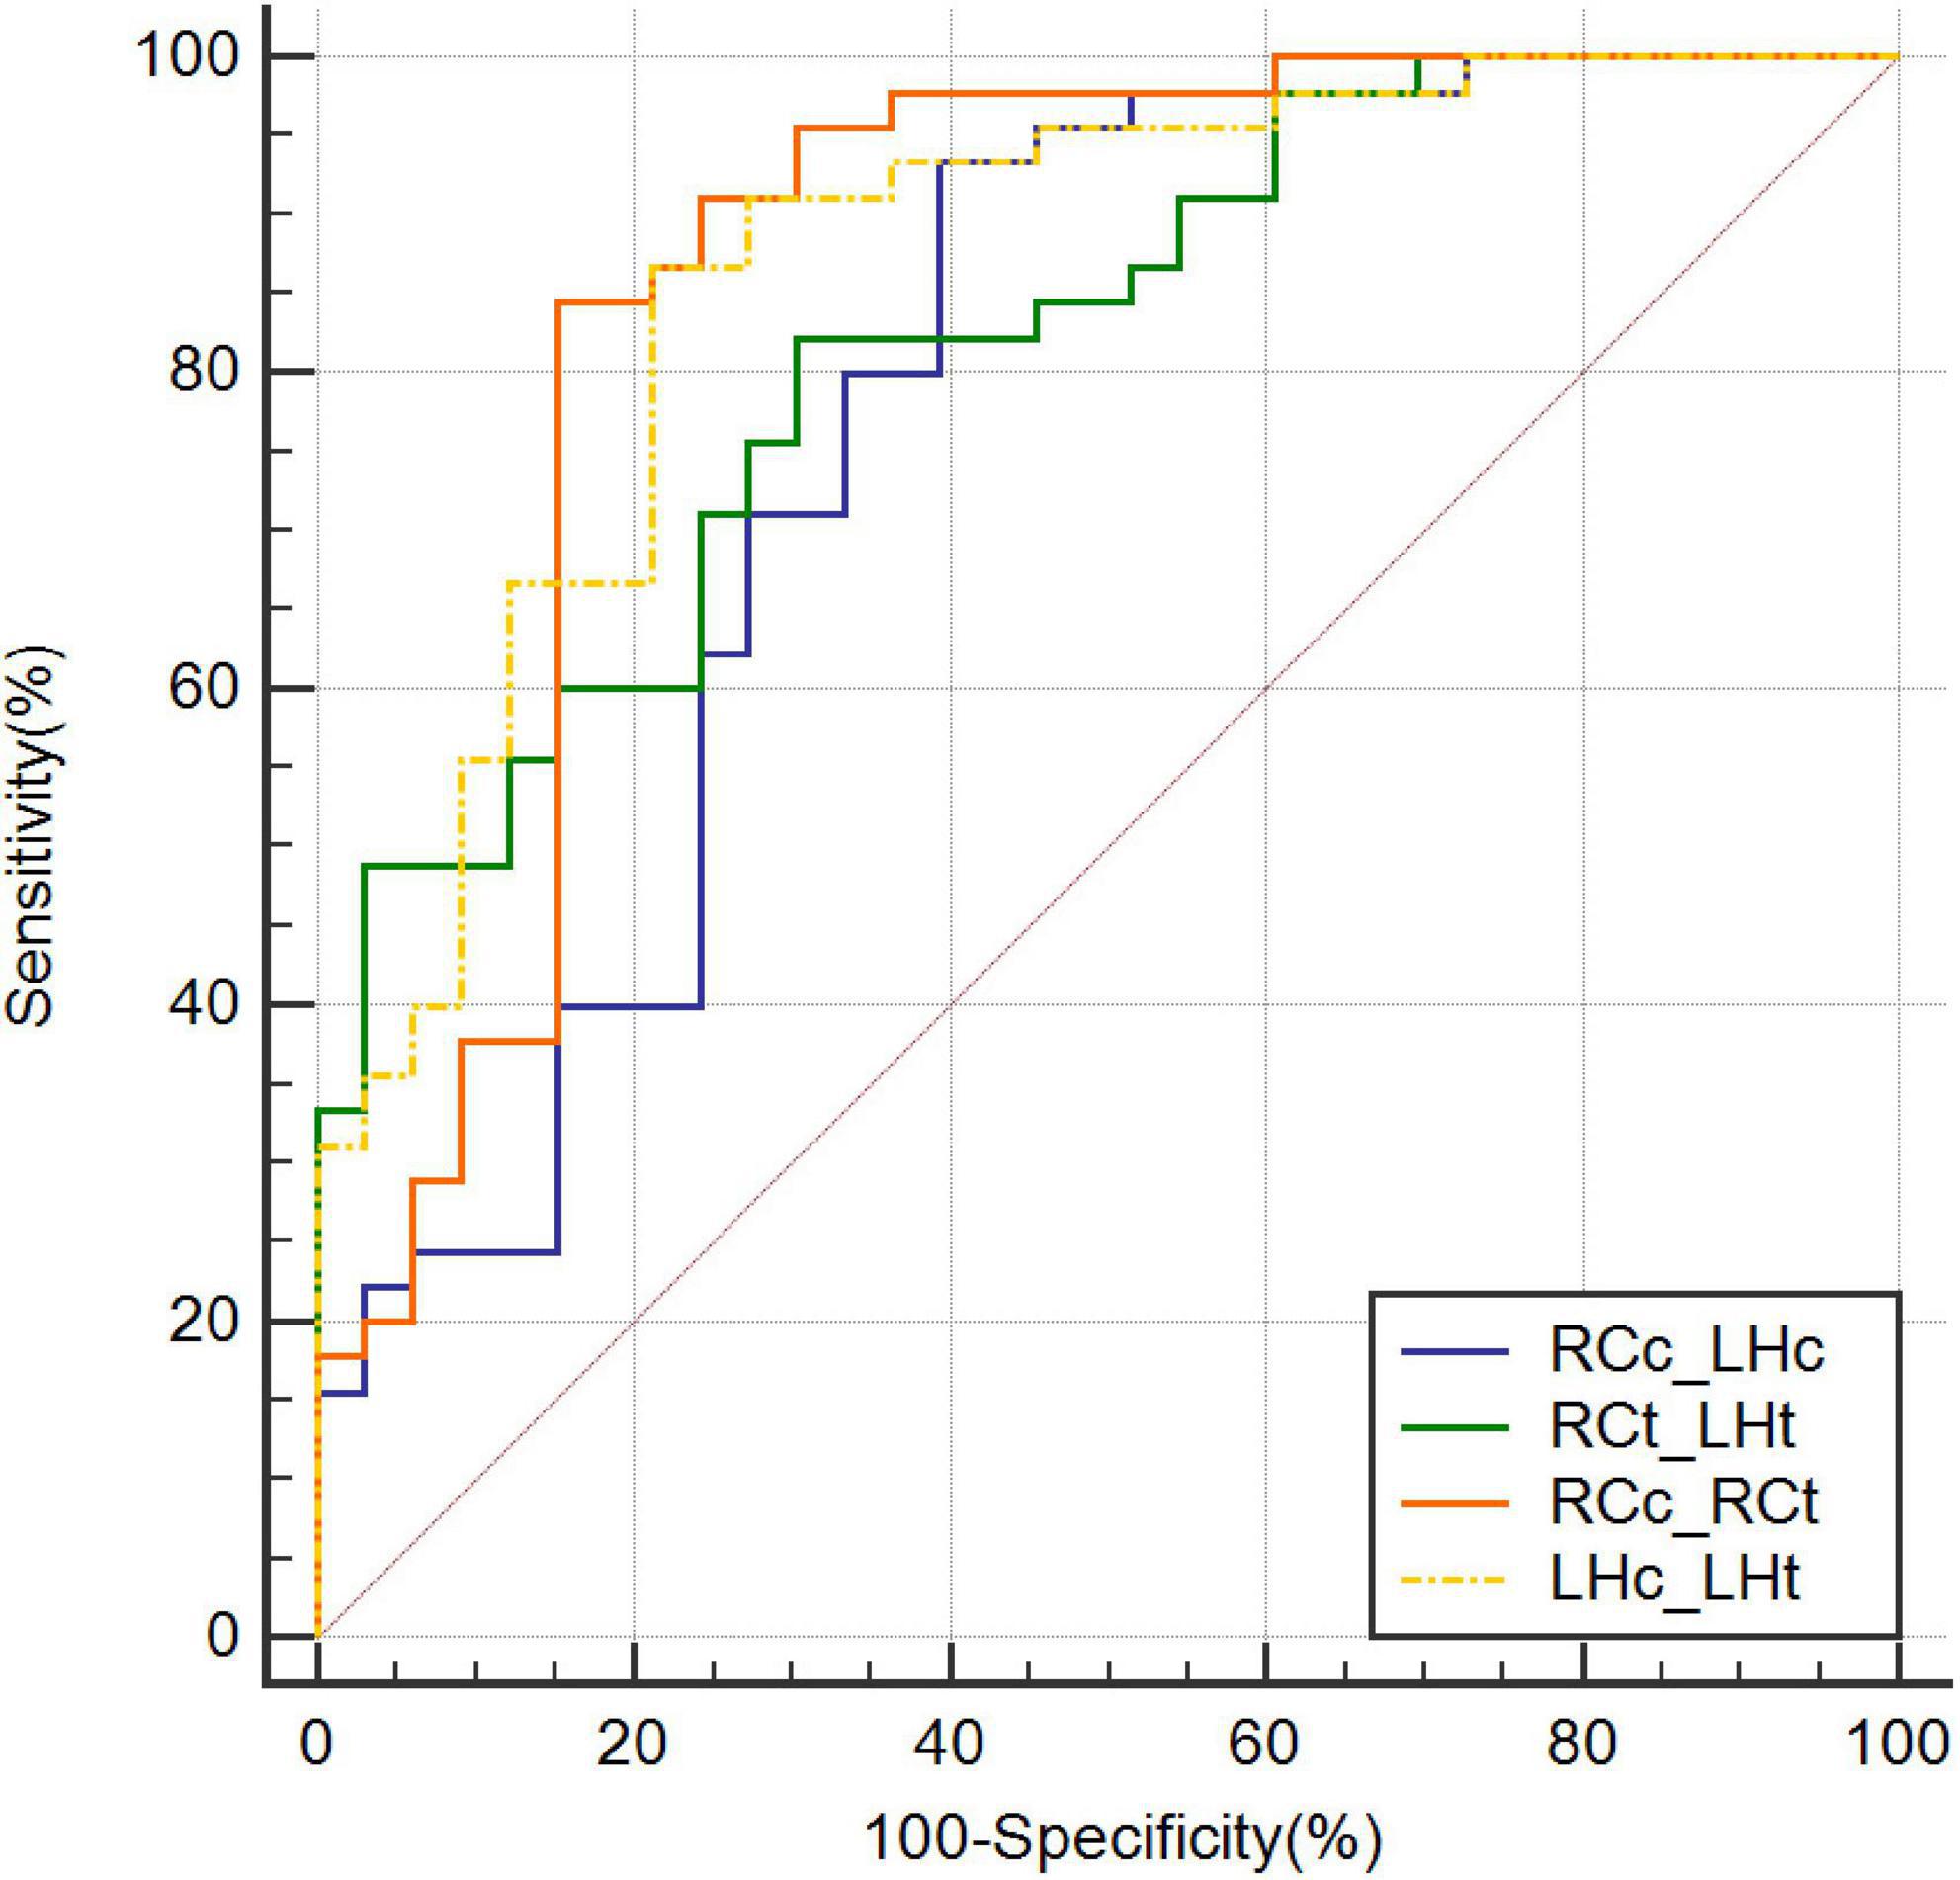
Figure 4. Receiver operating characteristic curves combining two parameters. CBF, cerebral blood flow; LHc_LHt, CBF of left hippocampus and T1 value of left hippocampus; RCc_LHc, CBF of right caudate nucleus and CBF of left hippocampus; RCc_RCt, CBF of right caudate nucleus and and T1 value of right caudate nucleus; RCt_LHt, T1 value of right caudate nucleus and T1 value of left hippocampus; ROC, receiver operating characteristic.
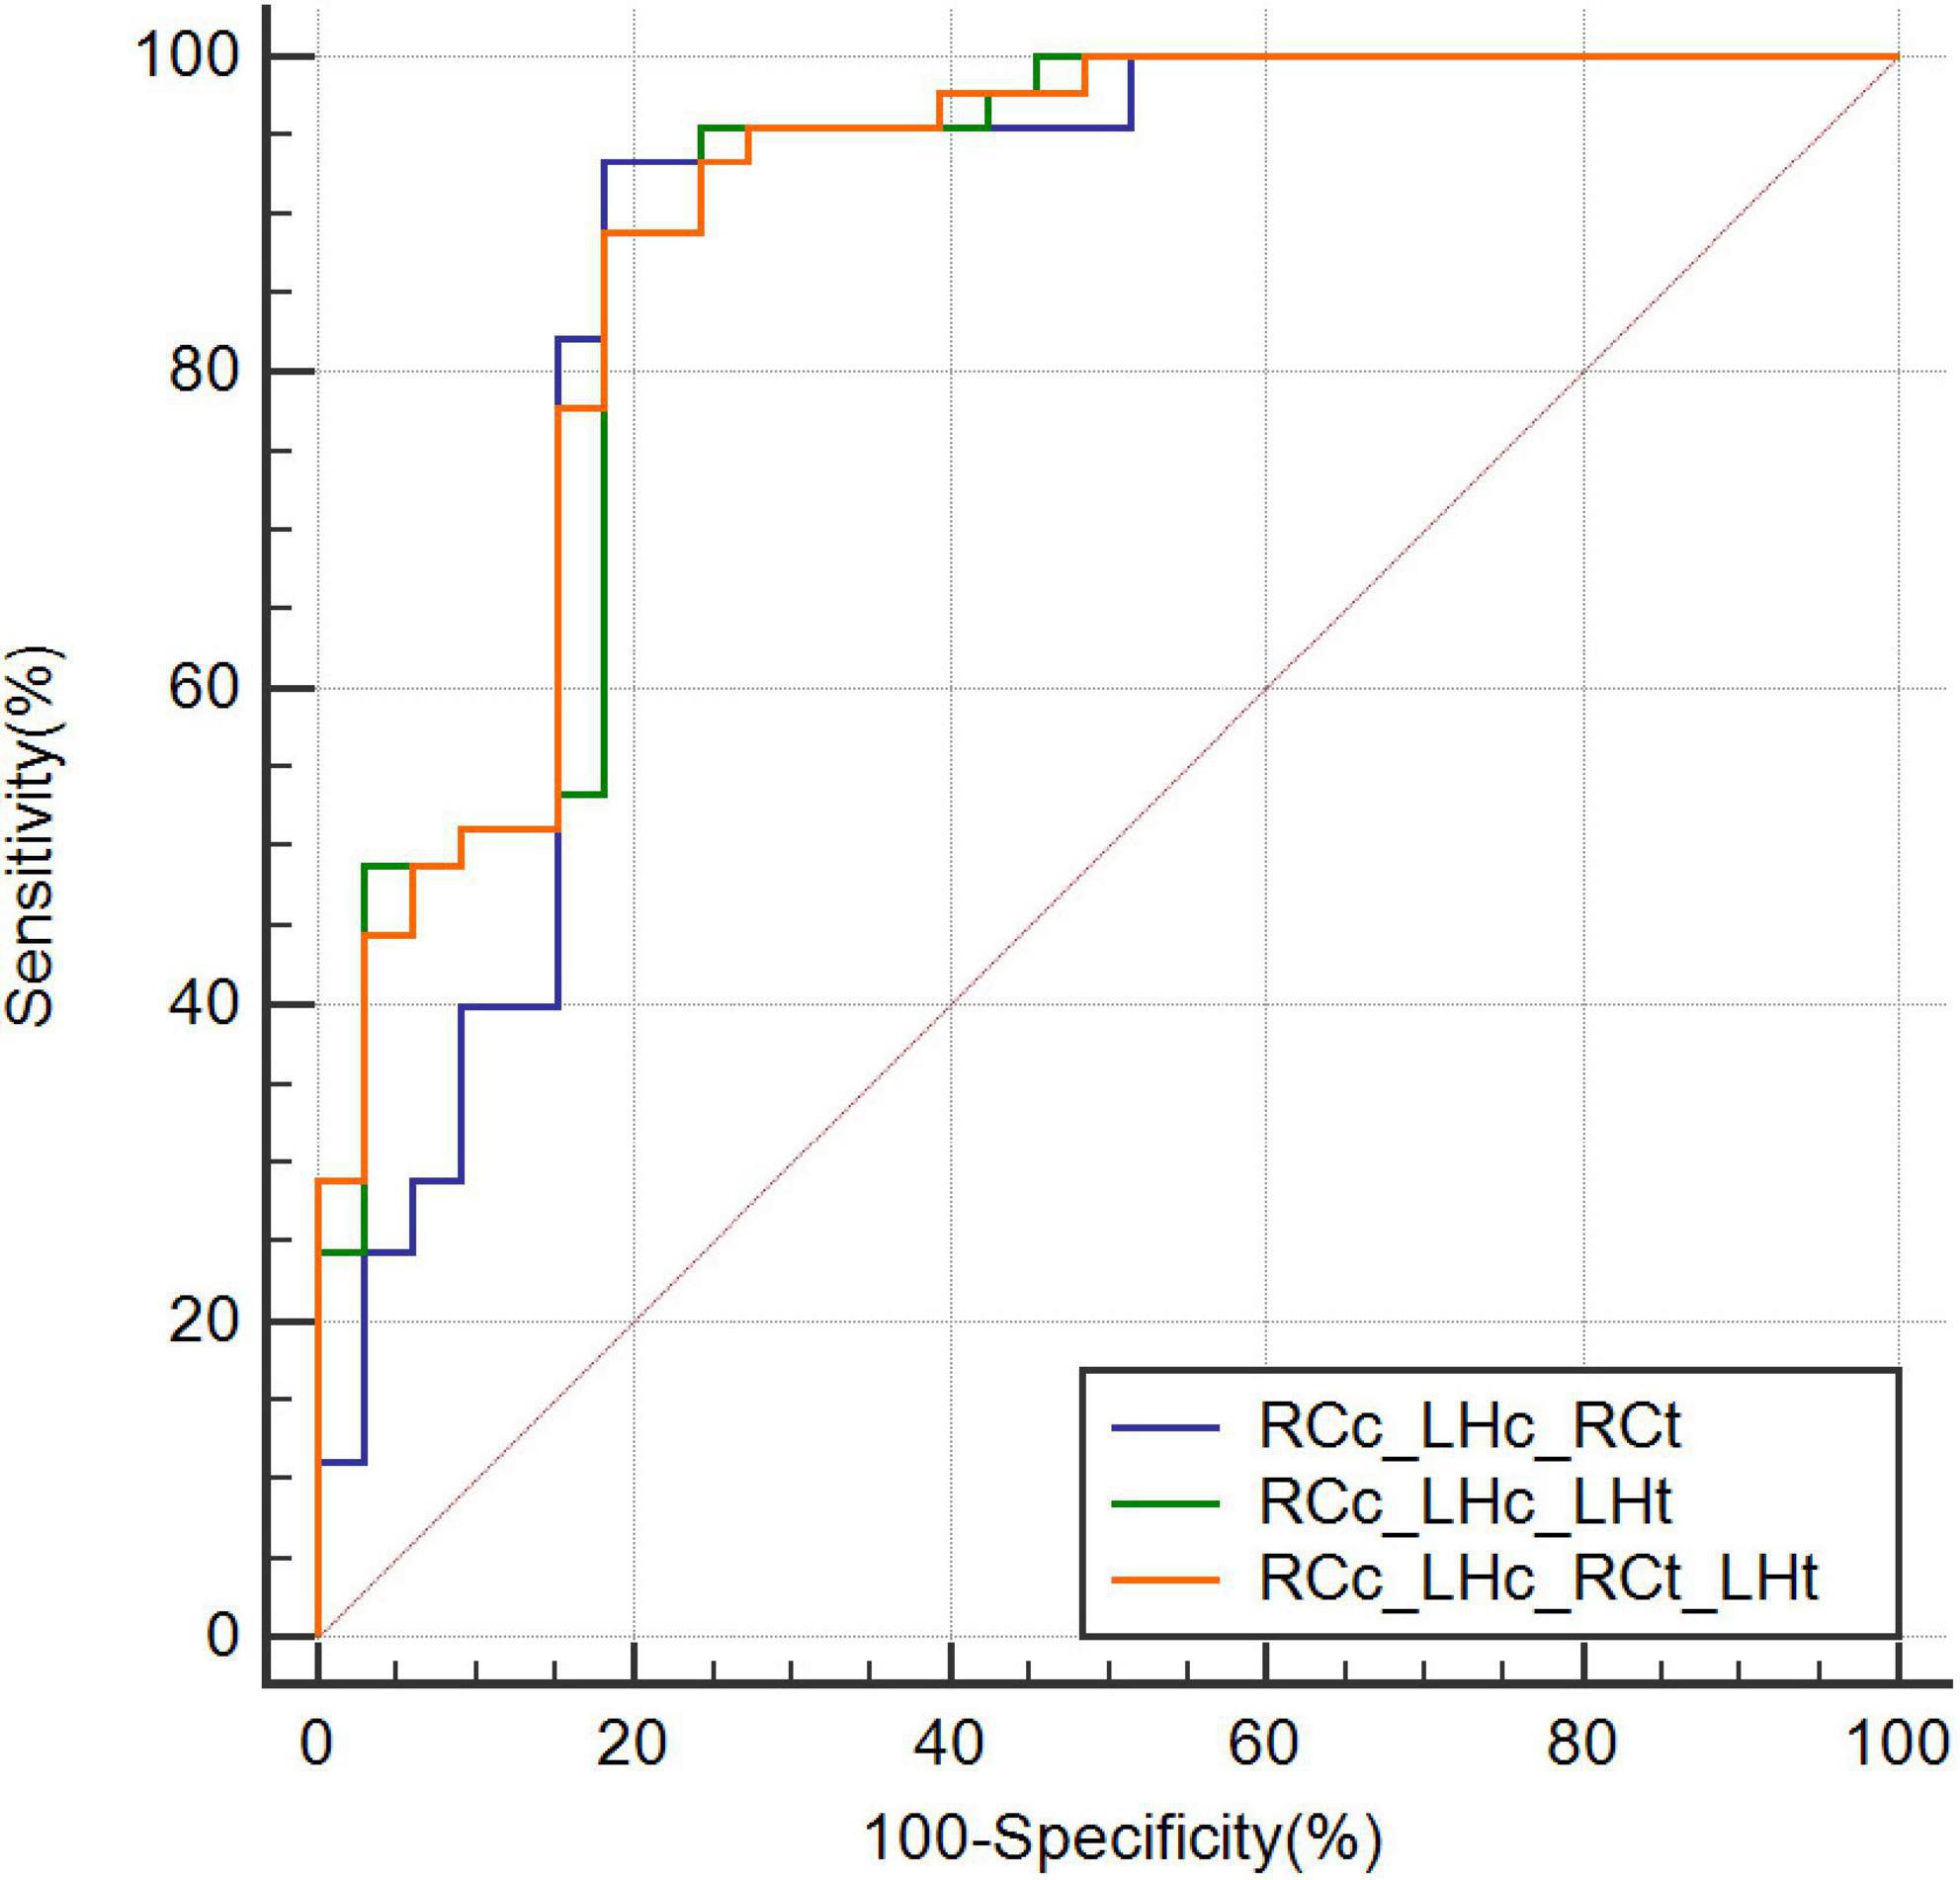
Figure 5. Receiver operating characteristic curves combining three or more parameters. CBF, cerebral blood flow; RCc_LHc_LHt, CBF of right caudate nucleus and, CBF of left hippocampus, and T1 value of left hippocampus; RCc_LHc_RCt, CBF of right caudate nucleus and, CBF of left hippocampus, and T1 value of right caudate nucleus; RCc_LHc_RCt_LHt, CBF of right caudate nucleus and, CBF of left hippocampus, T1 value of right caudate nucleus, and T1 value of left hippocampus; ROC, receiver operating characteristic.
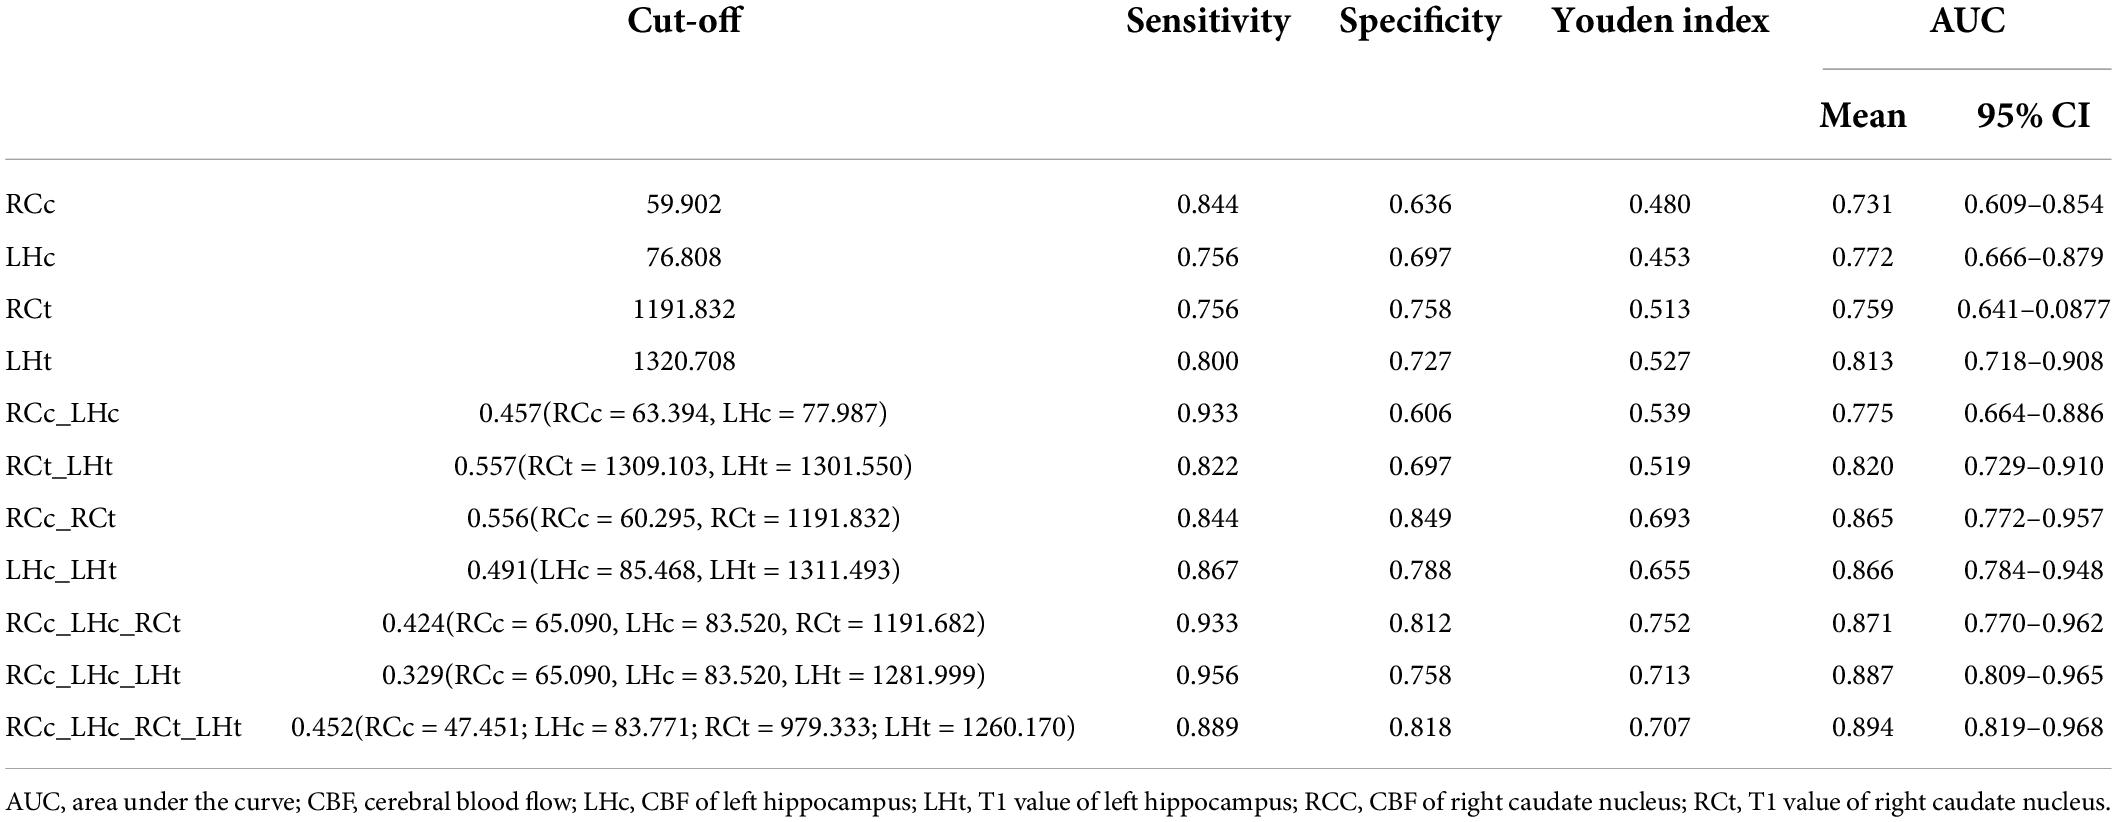
Table 2. Receiver operating characteristic (ROC) curves of various parameter combinations.
In the entire cohort of the AD and NC groups, excluding the interference of sex, age, years of education, and body mass index (BMI), RCc, LHc, RCt, and LHt were statistically significantly correlated with MMSE scores through partial correlation analysis, and the correlation cofficient of LHc is higher (r = 0.572, p < 0.01) (Table 3).
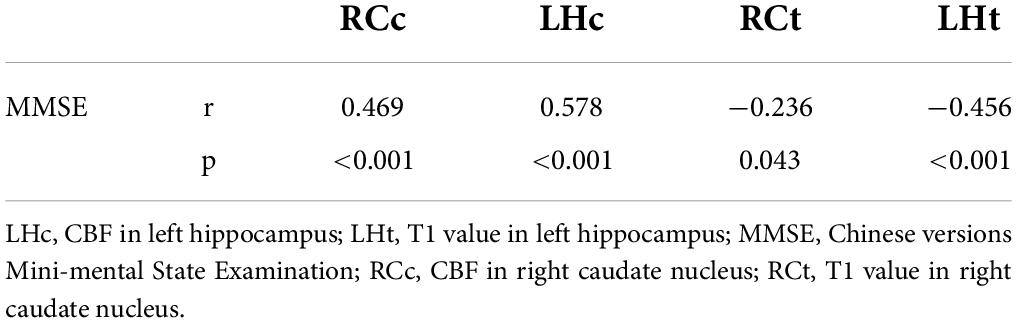
Table 3. Clinically observed severity measurements.
Discussion
This study investigated the diagnostic value of multi-modality quantitative MRI parameters. To the best of our knowledge, this is the first demonstration of the diagnostic power of CBF combined with T1-mapping. Group comparison found lower CBF values and higher T1 values in several brain areas in patients with AD compared with the NC group. Further ROC analysis demonstrated that a combined model based on both quantitative parameters achieved better diagnostic performance than either single parameter.
The present cohort included 45 AD and 33 NC subjects and compared CBF in 24 brain regions. Apart from the right thalamus and right pallidum, the mean perfusion values were reduced in the remaining 22 brain regions of patients with AD. According to previous AD neuroimaging studies, the pattern of reduced CBF in patients with AD is primarily concentrated in the hippocampus, basal nuclei clusters, and cognitive correlation cortical gray matter. Our study identified five brain regions (right caudate nucleus, left hippocampus, right parietal gray matter, right corpus callosum, and right insula) with significant differences when corrected by multiple comparisons (FDR correction, p < 0.01), consistent with findings from previous studies (Wolk and Detre, 2012; Wang et al., 2013; Wang, 2016; Camargo et al., 2021; Duan et al., 2021). These regions are closely associated with the development of AD. The caudate nucleus is a gray matter mass embedded in the medulla, buried deep in the base of the brain, responsible for the fine-tuning and coordination of movements (Valera-Bermejo et al., 2021). The hippocampus is a memory and cognitive center and is related to the occurrence and progression of AD (Dautricourt et al., 2021). The association between the corpus callosum and insula in AD is unclear, and some theories remain controversial and contradictory (Kamal et al., 2021; Giacomucci et al., 2022). However, the mean CBF values in the right thalamus and pallidum were elevated in the AD group, but these differences were not significant (p > 0.05). This result is similar to the previous finding of increased CBF in the basal nucleus cluster in the pre-AD period (Hays et al., 2018). Although the brain regions found in the Hays et al. study are not consistent with previous studies, the authors suggest that the reason for this change is suggestive of neurodegeneration leading to CBF dysregulation and the existence of a neural compensatory mechanism for cognitive decline in some brain regions.
T1-mapping has been used to study many central nervous system disorders such as epilepsy (Massire et al., 2021), multiple sclerosis (Massire et al., 2021; Thaler et al., 2021) and depression (Li et al., 2019). However, the findings of AD research are controversial (Tang et al., 2018). Su et al. found that T1 values in patients with AD at baseline were reduced in temporal and parietal lobes, which is contrary to our results. Interestingly, in the original study, as the disease worsened, T1 values increased significantly in the right caudate, bilateral hippocampus, and other regions instead of decreasing, indirectly complementing our findings (Su et al., 2016). An earlier classical low-magnetic field MRI-based study showed an overall trend in T1 values that was consistent with our results, but they did not precisely stage the brain (Besson et al., 1989). The application of high field strength in our study increased the image signal-to-noise ratio, making the image segmentation more detailed and study results more reliable. Pelkmans et al. reported that myelin determines the conduction of neuronal signals along axonal connections in brain networks, and loss of myelin integrity might result in cognitive decline in AD. Changes in T1 values can reflect myelin content, and myelin is generally associated with increased T1 values (Pelkmans et al., 2019). Future research should further investigate the predicted value of T1-mapping.
In our study, T1 values in the right caudate nucleus and left hippocampus demonstrated good diagnostic performance (AUC = 0.759 and 0.813, respectively). We also combined CBF and T1 values, which improved the diagnostic efficacy compared with that of each single parameter. The highest achievable AUC of 0.894 (sensitivity = 0.889, specificity = 0.818) was obtained using a combination of four parameters. The combination of CBF and T1 values also improved the diagnostic rate (AUC = 0.775–0.865). Our multiparametric MRI measurements improved the results for AD discrimination from NC. Furthermore, several previous studies determined cutoff values in a relatively subjective manner (e.g., less than twice the standard deviation of the control group mean) (Raji et al., 2010). In this study, we used the Jorden index, which together reflects sensitivity and specificity, as a scientific measure to derive the optimal cutoff value for our local cohort.
Like previous studies (Duan et al., 2021; Giacomucci et al., 2022), in our cohort, the severity of neuropsychologic impairment was strongly associated with brain scan measurements. A previous study confirmed that gender, age, education level, and BMI affected cognitive decline (Nebel et al., 2018); therefore, we performed a partial correlation analysis to exclude multiple confounding factors. RCc, LHc, and LHt were found to be powerful predictors of the clinically observed severity measurements.
There are several limitations of this study. First and most importantly, multiple stages of progressive diseases such as subjective cognitive decline and mild cognitive impairment, were not included. Second, we only performed cross-sectional diagnosis in all patients; future longitudinal analysis is needed. Long-term clinical follow-up may improve the diagnostic accuracy for AD. Third, the superiority of temporal lobe diagnosis was not demonstrated in our cohort (Alexopoulos et al., 2012). The temporal lobe, especially the medial temporal lobe, is associated with memory consolidation. This discrepancy may be due to the small amount of data we had and possibly to the fact that the pCASL scanning technique still needs to be refined. Future large-scale clinical studies to validate the diagnostic accuracy and robustness of the CBF and T1 values are imperative.
Conclusion
In conclusion, combining the pCASL and T1-mapping methods is superior to using a single measure in discriminating AD and NC cohorts. T1-mapping is a competitive technique that provides quantitative measurements of pathologic changes in the brain. A “one-stop-shop” study of multimodal parameters in the future is essential for diagnosing and monitoring AD.
Data availability statement
The datasets presented in this study can be found in online repositories. The names of the repository/repositories and accession number(s) can be found in the article/supplementary material.
Ethics statement
The studies involving human participants were reviewed and approved by the Ethics Committee of Beijing Hospital. The patients/participants provided their written informed consent to participate in this study. Written informed consent was obtained from the individual(s) for the publication of any potentially identifiable images or data included in this article.
Author contributions
XW, CL, and MC designed the work. XW, DW, and XL collected and integrated the data. XW, WW, PG, and BL analyzed the data and prepared the manuscript. JP, XZ, and JZ edited and revised the manuscript. All authors contributed to the article and approved the final manuscript.
Funding
This study was supported by the National Natural Science Foundation of China (grant number: 81771826).
Acknowledgments
We would like to thank Editage (www.editage.cn) for English language editing.
Conflict of interest
XZ and JZ were employedby MR collaboration, Siemens Healthineers Ltd., and JP was employed by MR Application Development, Siemens Healthcare GmbH.
The remaining authors declare that the research was conducted in the absence of any commercial or financial relationships that could be construed as a potential conflict of interest.
The reviewer GW declared a past co-authorship with one of the authors JZ to the handling editor.
Publisher’s note
All claims expressed in this article are solely those of the authors and do not necessarily represent those of their affiliated organizations, or those of the publisher, the editors and the reviewers. Any product that may be evaluated in this article, or claim that may be made by its manufacturer, is not guaranteed or endorsed by the publisher.
Abbreviations
AD, Alzheimer’s disease; ASL, arterial spin labeling; AUC, area under the curve; CBF, cerebral blood flow; FDR, false discovery rate; LHc, CBF in the left hippocampus; LHt, T1 values in the left hippocampus; MMSE, Mini-Mental State Examination; MP2RAGE, magnetization-prepared 2 rapid acquisition gradient echo images; MRI, magnetic resonance imaging; pCASL, pseudo-continuous ASL; RCc, CBF in the right caudate nucleus; RCt, T1 values in the right caudate nucleus.
Footnotes
References
Alexopoulos, P., Sorg, C., Förschler, A., Grimmer, T., Skokou, M., Wohlschläger, A., et al. (2012). Perfusion abnormalities in mild cognitive impairment and mild dementia in Alzheimer’s disease measured by pulsed arterial spin labeling MRI. Eur. Arch. Psychiatry Clin. Neurosci. 262, 69–77. doi: 10.1007/s00406-011-0226-2
Alsop, D. C., Detre, J. A., Golay, X., Günther, M., Hendrikse, J., Hernandez-Garcia, L., et al. (2015). Recommended implementation of arterial spin-labeled perfusion MRI for clinical applications: A consensus of the ISMRM perfusion study group and the European consortium for ASL in dementia. Magn. Reson. Med. 73, 102–116. doi: 10.1002/mrm.25197
Arnold, S. E., Hyman, B. T., Flory, J., Damasio, A. R., and Van Hoesen, G. W. (1991). The topographical and neuroanatomical distribution of neurofibrillary tangles and neuritic plaques in the cerebral cortex of patients with Alzheimer’s disease. Cereb. Cortex 1, 103–116. doi: 10.1093/cercor/1.1.103
Besson, J. A., Crawford, J. R., Parker, D. M., and Smith, F. W. (1989). Magnetic resonance imaging in Alzheimer’s disease, multi-infarct dementia, alcoholic dementia and Korsakoff’s psychosis. Acta Psychiatr. Scand. 80, 451–458. doi: 10.1111/j.1600-0447.1989.tb03005.x
Boto, J., Gkinis, G., Roche, A., Kober, T., Maréchal, B., Ortiz, N., et al. (2017). Evaluating anorexia-related brain atrophy using MP2RAGE-based morphometry. Eur. Radiol. 27, 5064–5072. doi: 10.1007/s00330-017-4914-9
Buxton, R. B., Frank, L. R., Wong, E. C., Siewert, B., Warach, S., and Edelman, R. R. (1998). A general kinetic model for quantitative perfusion imaging with arterial spin labeling. Magn. Reson. Med. 40, 383–396. doi: 10.1002/mrm.28422
Camargo, A., and Wang, Z. Alzheimer’s Disease Neuroimaging Initiative (2021). Longitudinal cerebral blood flow changes in normal aging and the Alzheimer’s disease continuum identified by arterial spin labeling MRI. J. Alzheimers. Dis. 81, 1727–1735. doi: 10.3233/JAD-210116
Chandra, A., Dervenoulas, G., and Politis, M. Alzheimer’s Disease Neuroimaging Initiative (2019). Magnetic resonance imaging in Alzheimer’s disease and mild cognitive impairment. J. Neurol. 266, 1293–1302. doi: 10.1007/s00415-018-9016-3
Cortes-Canteli, M., and Iadecola, C. (2020). Alzheimer’s disease and Vascular Aging: JACC Focus Seminar. J. Am. Coll. Cardiol. 75, 942–951. doi: 10.1016/j.jacc.2019.10.062
Dautricourt, S., de Flores, R., Landeau, B., Poisnel, G., Vanhoutte, M., Delcroix, N., et al. (2021). Longitudinal changes in hippocampal network connectivity in Alzheimer’s disease. Ann. Neurol. 90, 391–406. doi: 10.1002/ana.26168
Duan, W., Zhou, G. D., Balachandrasekaran, A., Bhumkar, A. B., Boraste, P. B., Becker, J. T., et al. (2021). Cerebral Blood Flow Predicts Conversion of Mild Cognitive Impairment into Alzheimer’s Disease and Cognitive Decline: An Arterial Spin Labeling Follow-up Study. J. Alzheimers Dis. 82, 293–305. doi: 10.3233/JAD-210199
Dujardin, S., Commins, C., Lathuiliere, A., Beerepoot, P., Fernandes, A. R., Kamath, T. V., et al. (2020). Tau molecular diversity contributes to clinical heterogeneity in Alzheimer’s disease. Nat. Med. 26, 1256–1263. doi: 10.1038/s41591-020-0938-9
Erkkinen, M. G., Kim, M. O., and Geschwind, M. D. (2018). Clinical Neurology and Epidemiology of the Major Neurodegenerative Diseases. Cold Spring Harb. Perspect. Biol. 10:a033118. doi: 10.1101/cshperspect.a033118
Forster, D., Davies, K., and Williams, S. (2013). Magnetic resonance spectroscopy in vivo of neurochemicals in a transgenic model of Alzheimer’s disease: a longitudinal study of metabolites, relaxation time, and behavioral analysis in TASTPM and wild-type mice. Magn. Reson. Med. 69, 944–955. doi: 10.1002/mrm.24349
Gallardo, G., and Holtzman, D. M. (2019). Amyloid-β and tau at the crossroads of Alzheimer’s disease. Adv. Exp. Med. Biol. 1184, 187–203. doi: 10.1007/978-981-32-9358-8_16
Giacomucci, G., Galdo, G., Polito, C., Berti, V., Padiglioni, S., Mazzeo, S., et al. (2022). Unravelling neural correlates of empathy deficits in subjective cognitive decline, mild cognitive impairment and Alzheimer’s Disease. Behav. Brain Res. 428:113893. doi: 10.1016/j.bbr.2022.113893
Hays, C. C., Zlatar, Z. Z., Campbell, L., Meloy, M. J., and Wierenga, C. E. (2018). Subjective Cognitive Decline Modifies the Relationship Between Cerebral Blood Flow and Memory Function in Cognitively Normal Older Adults. J. Int. Neuropsychol. Soc. 24, 213–223. doi: 10.1017/S135561771700087X
House, M. J., St Pierre, T. G., and McLean, C. (2008). 1.4T study of proton magnetic relaxation rates, iron concentrations, and plaque burden in Alzheimer’s disease and control postmortem brain tissue. Magn. Reson. Med. 60, 41–52. doi: 10.1002/mrm.21586
Jagust, W., Thisted, R., Devous, M. D., Van Heertum, R., Mayberg, H., Jobst, K., et al. (2001). SPECT perfusion imaging in the diagnosis of Alzheimer’s disease: A clinical-pathologic study. Neurology 56, 950–956. doi: 10.1212/wnl.56.7.950
Kamal, S., Park, I., Kim, Y. J., Kim, Y. J., and Lee, U. (2021). Alteration of the corpus callosum in patients with Alzheimer’s disease: Deep learning-based assessment. PLoS One 16:e0259051. doi: 10.1371/journal.pone.0259051
Kaneta, T., Katsuse, O., Hirano, T., Ogawa, M., Yoshida, K., Odawara, T., et al. (2017). Head-to-Head visual comparison between brain perfusion SPECT and arterial spin-labeling MRI with different postlabeling delays in alzheimer disease. AJNR Am. J. Neuroradiol. 38, 1562–1568. doi: 10.3174/ajnr.A5238
Knopman, D. S., Amieva, H., Petersen, R. C., Chételat, G., Holtzman, D. M., Hyman, B. T., et al. (2021). Alzheimer disease. Nat. Rev. Dis. Primers 7:33. doi: 10.1038/s41572-021-00269-y
Li, Y., Wang, C., Teng, C., Jiao, K., Song, X., Tan, Y., et al. (2019). Hippocampus-driving progressive structural alterations in medication-naïve major depressive disorder. J. Affect. Disord. 256, 148–155. doi: 10.1016/j.jad.2019.05.053
Marques, J. P., Kober, T., Krueger, G., van der Zwaag, W., Van de Moortele, P. F., and Gruetter, R. (2010). MP2RAGE, a self bias-field corrected sequence for improved segmentation and T1-mapping at high field. Neuroimage 49, 1271–1281. doi: 10.1016/j.neuroimage.2009.10.002
Massire, A., Seiler, C., Troalen, T., Girard, O. M., Lehmann, P., Brun, G., et al. (2021). T1-Based synthetic magnetic resonance contrasts improve multiple sclerosis and focal epilepsy imaging at 7 T. Invest. Radiol. 56, 127–133. doi: 10.1097/RLI.0000000000000718
McKhann, G., Drachman, D., Folstein, M., Katzman, R., Price, D., and Stadlan, E. M. (1984). Clinical diagnosis of alzheimer’s disease: report of the NINCDS-ADRDA work group under the auspices of department of health and human services task force on alzheimer’s disease. Neurology 34, 939–944. doi: 10.1212/wnl.34.7.939
Montine, T. J., Phelps, C. H., Beach, T. G., Bigio, E. H., Cairns, N. J., Dickson, D. W., et al. (2012). National Institute on Aging-Alzheimer’s Association guidelines for the neuropathologic assessment of Alzheimer’s disease: a practical approach. Acta Neuropathol. 123, 1–11. doi: 10.1007/s00401-011-0910-3
Nebel, R. A., Aggarwal, N. T., Barnes, L. L., Gallagher, A., Goldstein, J. M., Kantarci, K., et al. (2018). Understanding the impact of sex and gender in Alzheimer’s disease: a call to action. Alzheimers Dement. 14, 1171–1183. doi: 10.1016/j.jalz.2018.04.008
Pelkmans, W., Dicks, E., Barkhof, F., Vrenken, H., Scheltens, P., van der Flier, W. M., et al. (2019). Gray matter T1-w/T2-w ratios are higher in Alzheimer’s disease. Hum. Brain Mapp. 40, 3900–3909. doi: 10.1002/hbm.24638
Raji, C. A., Lee, C., Lopez, O. L., Tsay, J., Boardman, J. F., Schwartz, E. D., et al. (2010). Initial experience in using continuous arterial spin-labeled MR imaging for early detection of Alzheimer disease. AJNR Am. J. Neuroradiol. 31, 847–855. doi: 10.3174/ajnr.A1955
Rice, H. C., de Malmazet, D., Schreurs, A., Frere, S., Van Molle, I., Volkov, A. N., et al. (2019). Secreted amyloid-β precursor protein functions as a GABABR1a ligand to modulate synaptic transmission’. Science 363:eaao4827. doi: 10.1126/science.aao4827
Schmitter, D., Roche, A., Maréchal, B., Ribes, D., Abdulkadir, A., Bach-Cuadra, M., et al. (2014). An evaluation of volume-based morphometry for prediction of mild cognitive impairment and Alzheimer’s disease. Neuroimage Clin. 7, 7–17. doi: 10.1016/j.nicl.2014.11.001
Soman, S., Raghavan, S., Rajesh, P. G., Varma, R. P., Mohanan, N., Ramachandran, S. S., et al. (2021). Relationship between cerebral perfusion on arterial spin labeling (ASL) MRI with brain volumetry and cognitive performance in mild cognitive impairment and dementia due to Alzheimer’s disease. Ann. Indian Acad. Neurol. 24, 559–565. doi: 10.4103/aian.AIAN_848_20
Su, L., Blamire, A. M., Watson, R., He, J., Aribisala, B., and O’Brien, J. T. (2016). Cortical and subcortical changes in alzheimer’s disease: a longitudinal and quantitative MRI Study. Curr Alzheimer Res. 13, 534–544. doi: 10.2174/1567205013666151116141416
Tang, X., Cai, F., Ding, D. X., Zhang, L. L., Cai, X. Y., and Fang, Q. (2018). Magnetic resonance imaging relaxation time in Alzheimer’s disease. Brain Res. Bull. 140, 176–189. doi: 10.1016/j.brainresbull.2018.05.004
Thaler, C., Hartramph, I., Stellmann, J. P., Heesen, C., Bester, M., Fiehler, J., et al. (2021). T1 relaxation times in the cortex and Thalamus Are associated with working memory and information processing speed in patients with multiple sclerosis. Front. Neurol. 12:789812. doi: 10.3389/fneur.2021.789812
Valera-Bermejo, J. M., De Marco, M., and Venneri, A. (2021). Altered interplay among large-scale brain functional networks modulates multi-domain anosognosia in early Alzheimer’s disease. Front. Aging Neurosci. 13:781465. doi: 10.3389/fnagi.2021.781465
Verfaillie, S. C., Adriaanse, S. M., Binnewijzend, M. A., Benedictus, M. R., Ossenkoppele, R., Wattjes, M. P., et al. (2015). Cerebral perfusion and glucose metabolism in Alzheimer’s disease and frontotemporal dementia: Two sides of the same coin? Eur. Radiol. 25, 3050–3059. doi: 10.1007/s00330-015-3696-1
Wang, Z. (2016). “Longitudinal CBF changes predict disease conversion/revision in AD and MCI,” in Proceedings of the 22nd Annual Meeting of the Organization for Human Brain Mapping, Geneva.
Wang, Z., Das, S. R., Xie, S. X., Arnold, S. E., Detre, J. A., Wolk, D. A., et al. (2013). Arterial spin labeled MRI in prodromal Alzheimer’s disease: amulti-site study. Neuroimage Clin. 2, 630–636. doi: 10.1016/j.nicl.2013.04.014
Wolk, D. A., and Detre, J. A. (2012). Arterial spin labeling MRI: An emerging biomarker for Alzheimer’s disease and other neurodegenerative conditions. Curr. Opin. Neurol. 25, 421–428. doi: 10.1097/WCO.0b013e328354ff0a
Keywords: Alzheimer’s disease, cerebral blood flow, T1-mapping, magnetic resonance imaging, arterial spin labeling
Citation: Wang X, Wang D, Li X, Wang W, Gao P, Lou B, Pfeuffer J, Zhang X, Zhu J, Li C and Chen M (2022) A diagnostic index based on pseudo-continuous arterial spin labeling and T1-mapping improves efficacy in discriminating Alzheimer’s disease from normal cognition. Front. Neurosci. 16:974651. doi: 10.3389/fnins.2022.974651
Received: 21 June 2022; Accepted: 18 July 2022;
Published: 05 August 2022.
Edited by:
Guolin Ma, China-Japan Friendship Hospital, ChinaReviewed by:
Qingling Huang, Nanjing Brain Hospital Affiliated to Nanjing Medical University, ChinaGuangbin Wang, Shandong Provincial Hospital, China
Copyright © 2022 Wang, Wang, Li, Wang, Gao, Lou, Pfeuffer, Zhang, Zhu, Li and Chen. This is an open-access article distributed under the terms of the Creative Commons Attribution License (CC BY). The use, distribution or reproduction in other forums is permitted, provided the original author(s) and the copyright owner(s) are credited and that the original publication in this journal is cited, in accordance with accepted academic practice. No use, distribution or reproduction is permitted which does not comply with these terms.
*Correspondence: Chunmei Li, YmVlOTAyMEAxMjYuY29t; Min Chen, Y2pyLmNoZW5taW5AdmlwLjE2My5jb20=