- 1Shanghai Universal Medical Imaging Diagnostic Center, Shanghai, China
- 2School of Business Administration, José Rizal University, Mandaluyong, Philippines
- 3College of Information Science and Technology, Nanjing Forestry University, Nanjing, China
- 4College of Mathematics and Statistics, Chongqing Jiaotong University, Chongqing, China
- 5Department of Medical Imaging, Tongji Hospital, Tongji University School of Medicine, Tongji University, Shanghai, China
Objective: Autism spectrum disorder (ASD) is a common neurodevelopmental disorder characterized by the development of multiple symptoms, with incidences rapidly increasing worldwide. An important step in the early diagnosis of ASD is to identify informative biomarkers. Currently, the use of functional brain network (FBN) is deemed important for extracting data on brain imaging biomarkers. Unfortunately, most existing studies have reported the utilization of the information from the connection to train the classifier; such an approach ignores the topological information and, in turn, limits its performance. Thus, effective utilization of the FBN provides insights for improving the diagnostic performance.
Methods: We propose the combination of the information derived from both FBN and its corresponding graph theory measurements to identify and distinguish ASD from normal controls (NCs). Specifically, a multi-kernel support vector machine (MK-SVM) was used to combine multiple types of information.
Results: The experimental results illustrate that the combination of information from multiple connectome features (i.e., functional connections and graph measurements) can provide a superior identification performance with an area under the receiver operating characteristic curve (ROC) of 0.9191 and an accuracy of 82.60%. Furthermore, the graph theoretical analysis illustrates that the significant nodal graph measurements and consensus connections exists mostly in the salience network (SN), default mode network (DMN), attention network, frontoparietal network, and social network.
Conclusion: This work provides insights into potential neuroimaging biomarkers that may be used for the diagnosis of ASD and offers a new perspective for the exploration of the brain pathophysiology of ASD through machine learning.
Introduction
As a neural developmental syndrome, autism spectrum disorder (ASD) is commonly defined as defective or restricted communication, repetitive behaviors, and social reciprocity, leading to dysfunction in social, educational, and professional fields (Lord et al., 2000; Frith and Happé, 2005; Baio, 2014; Wee et al., 2016); the definition is based on the diagnosis and disease severity assessment. Approximately 1.47% of American children present with some form of ASD, the incidence of which has increased by nearly 30% per 2 years (Baio, 2014). Unfortunately, the diagnosis of ASD is dependent on the symptoms and behavioral patterns of ASD (Gillberg, 1993; Segal, 2000; Lord and Jones, 2012), due to which timely and appropriate treatments cannot be availed. Meanwhile, although gene expression-based diagnostic methods (Wang et al., 2009; O’Roak et al., 2012) can benefit early diagnosis, they are often costly and complicated. Fortunately, several studies have illustrated that abnormal functional disruptions in certain brain regions (Allen and Courchesne, 2003; Anderson et al., 2011; Delmonte et al., 2012) are highly correlated with ASD. Therefore, a potential method of identifying biomarkers for ASD can be adopted by analyzing brain activity data.
Functional magnetic resonance imaging (fMRI) has been successfully utilized in brain mechanism research and clinical diagnosis (Brunetti et al., 2006; Kevin et al., 2008; Jin et al., 2010; Li et al., 2020b). Particularly, several studies have suggested that patients with ASD show atrophy of gray matter volume, degeneration of white matter fiber structure, and reduction of spontaneous functional activity in the hippocampus and frontal region (Brambilla et al., 2003; Anderson et al., 2011; Li et al., 2017). However, because spontaneous brain activities are asynchronous and random across subjects, direct comparison of fMRI data (i.e., time courses) to identify and distinguish ASD patients from normal controls (NCs) remains challenging. As an alternative, the functional brain network (FBN) can provide insights into an effective method that can be developed to obtain data on relatively stable biomarkers that can be used for ASD identification (Smith et al., 2011; Sporns, 2011; Wee et al., 2012; Stam, 2014; Rosa et al., 2015). Moreover, several studies have confirmed that significant changes in FBN are highly correlated with neurological diseases such as ASD (Theije et al., 2011; Gotts et al., 2012), Alzheimer’s disease (Supekar et al., 2008; Huang et al., 2009; Liu et al., 2012), and mild cognitive impairment (Gao et al., 2020), among others.
Specifically, brain connectome analysis, including functional connections and graph theory topological measurements, has attracted significant attention owing to the complex brain network mechanism and various types of diagnostic information (Biswal et al., 1995; Li et al., 2019, 2021). In a series of resting-state FBN studies, several attempts have been reported on the consideration of the functional connections among individuals to train a classifier and findings have revealed a significant change in the default mode network (DMN), salience network (SN), and language network (O’Roak et al., 2012; Nielsen et al., 2013; Verly et al., 2014; Wee et al., 2014; Li et al., 2017). Other ASD studies have focused on utilizing graph theory to reveal the difference (Keown et al., 2017). However, most studies were conducted separately depending on brain network functional connections, and a certain portion of the information derived from the graph theory attributes might have been lost, which limited their performance. Thus, a more robust tactic is to combine the information of the brain network functional connections and graph theory attributes. Considering the potential superiority of multi-view learning tricks, we utilized the most commonly considered multi-kernel support vector machine (MK-SVM) method to combine information for accurate ASD diagnosis. This study may provide valuable insights into the pathophysiological mechanisms of preclinical ASD. The main contributions of this study can be summarized as follows.
1) Our findings revealed a new pathway that could be considered to efficiently identify and distinguish ASD from NCs by combining information from the brain network functional connections and graph theory attributes.
2) We used the MK-SVM as an example to confirm the information combination approach by identifying the ASD from NCs and achieved an 82.60% classification accuracy, which demonstrated a competitive finding.
3) A graph theoretic analysis suggested that the discriminative brain regions of ASD patients were mainly distributed in the limbic system, subcutaneous nuclei, cortex, and connections among them, which corresponded to the SN, DMN, attention network, frontoparietal network, and social network.
4) Our research further revealed that ASD patients showed enhanced integration function and weakened segregation functions of the brain network. Additionally, the functional connections related to the medial temporal lobe (e.g., the parahippocampal gyrus, hippocampus, and entorhinal cortex) and subcutaneous nuclei (e.g., putamen and pallidum) were mainly increased, while the related connections of the frontal lobe, parietal lobe, and occipital lobe were mainly decreased.
Materials and Methods
Data Acquisition
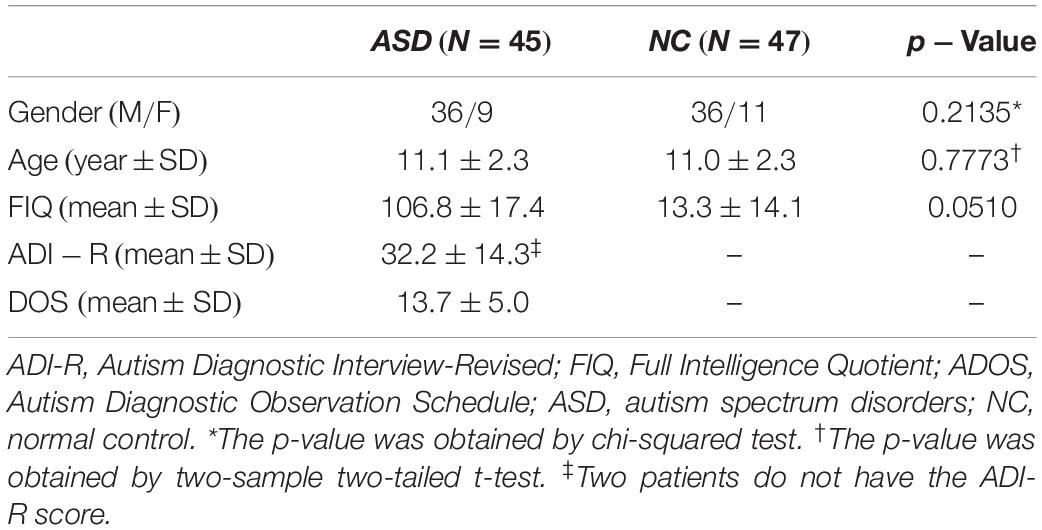
We collected the resting-state fMRI (rs-fMRI) data related to 47 NC subjects and 45 ASD subjects (with ages ranging from 7 to 15 years), and data were deduced from a publicly available dataset named ABIDE (Di et al., 2014). There were no significant differences in gender and age between the ASD and NC groups, and the demographic information of the samples has been listed in Table 1. Data were similar to those reported in a recent study (Wee et al., 2016). For more details, refer to Wee et al. (2016).
Data Preprocessing
All rs-fMRI images were acquired using the 3T Siemens Allegra scanner. The imaging parameters included flip angle = 90°, TR/TE = 2000/15ms with 180 volumes, 33 slices, and 4.0mm voxel thickness. Specifically, the SPM8 toolbox1 and DPARSFA (version 2.2)2 were adopted to execute the fMRI pre-processing pipeline. Particularly, the pre-processing pipeline in this study is referenced to the well-defined pipeline reference in the DPABI manual, including (1) the removal of the first 10 time series; (2) normalization; (3) regression of nuisance signals (ventricle, white matter, global signals, and head motion) with the Friston 24-parameter model (Friston et al., 1996); (4) filtering of data (0.01−0.08Hz); and (5) the conduction of de-trending. Subsequently, the pre-processed BOLD time-series signals were partitioned into 90 ROIs according to the automated anatomical labeling atlas (Tzourio-Mazoyer et al., 2002).
Network Estimation
To define the network, we adopted the Pearson correlation (PC) to estimate FBNs, the details of which have been expressed as follows:
where xi ∈ Rtrepresent the average BOLD signal corresponding to the i-th brain region, t represents the time length, represents a vector whose elements are the mean values of the elements in xi, i = 1,2,⋯,n, and n represents the number of ROIs.
Computation of Graph Measurements
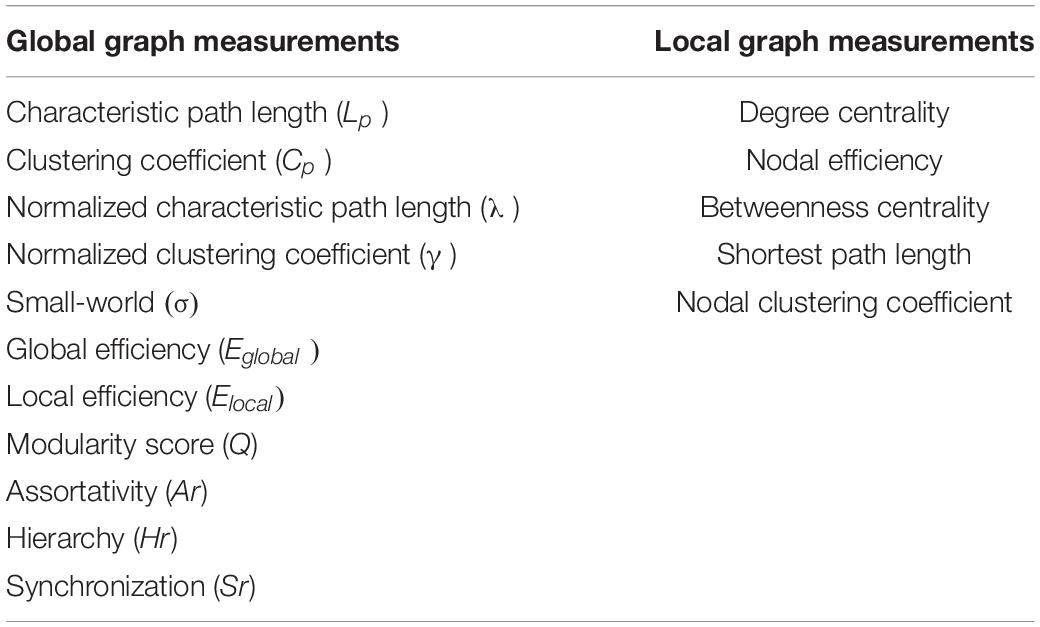
To investigate the altered reconfiguration patterns of individual brain connectomes for ASD, we first performed a graph theory analysis of the FBN based on the graph network analysis toolbox (Gretna).3 Specifically, we considered both global graph theory measurements and the nodal property to characterize the different patterns of connections in the brain network, as shown in Table 2. The definitions of these measurements can be found in the paper published by Wang et al. (2015). Note that we focused on the binary network by considering the different sparsity thresholds (ranging from 0.02 to 0.5, with steps of 0.01). A total of 49 values under the sparsity threshold were obtained for each graph measurement. We then utilized the area under the curve (AUC; the sum of 49 values) as input for the attributes to train the classifier, which ensure that there was only one for each node value corresponding to one graph metric.
Hub Node of the Estimates Functional Brain Network
The top 5% regions of the brain with the greatest weight were selected as the hubs of the group-level brain network. Specifically, we utilized the mean value of the entire individual brain network to establish the ASD/HC group-level network.
Information Combination for Autism Spectrum Disorder Identification
To accurately identify ASD from NCs, we attempted to combine the information from the connection weight and its topological information. We used the multi-kernel (MK) trick to combine different types of information. Specifically, we utilized the LIB-SVM toolbox to solve the support vector machine (SVM) classification problem. The MK-SVM is used to solve the following primary problem:
where n denotes the sample size, and represent the connection value, the global and nodal graph measurements of the i-th sample, and yi ∈ {1,−1} correspond to its class label, respectively, and m denotes the corresponding index of modality,wm represents the normal vector of the hyperplane in the Hilbert kernel space (RHKS), ϕm represents the mapping function from the original space to the present RHKS, and βm denotes the weight of the m-th modality. Then, the dual form of the MK-SVM can be represented as:
where denotes a kernel matrix. Finally, the predictive level based on MK-SVM can be formulated as follows:
Feature Selection and Validation
To alleviate the confounding effect of the different steps in the classification pipeline, we conducted the simplest feature selection method (i.e., t-test with p < 0.05). Additionally, to evaluate the performance of different classification methods, we adopted the most commonly used leave-one-out cross-validation (LOOCV) strategy owing to the limited sample size (Li et al., 2020a). Specifically, the optimal parameter (hyper-parameter C for MK-SVM) was selected in the inner cross-validation, and the classification performance was evaluated in the outlier validation loop. The range of the hyperparameter C was from 2−5 to 25. We compared the classification performance of a single aspect [i.e., connection weight (C), global typological information (G), nodal typological information (N)], and combinations of different modes (i.e., C + G, C + N, G + N, and C + G + N). The entire pipeline used in this study is shown in Figure 1. In contrast to the traditional methods which only utilize the information of connections, global graph metrics or nodal graph metrics, it should be noted that our novelty is that we using kernel combination trick and firstly combine the information from different modal for ASD identification.
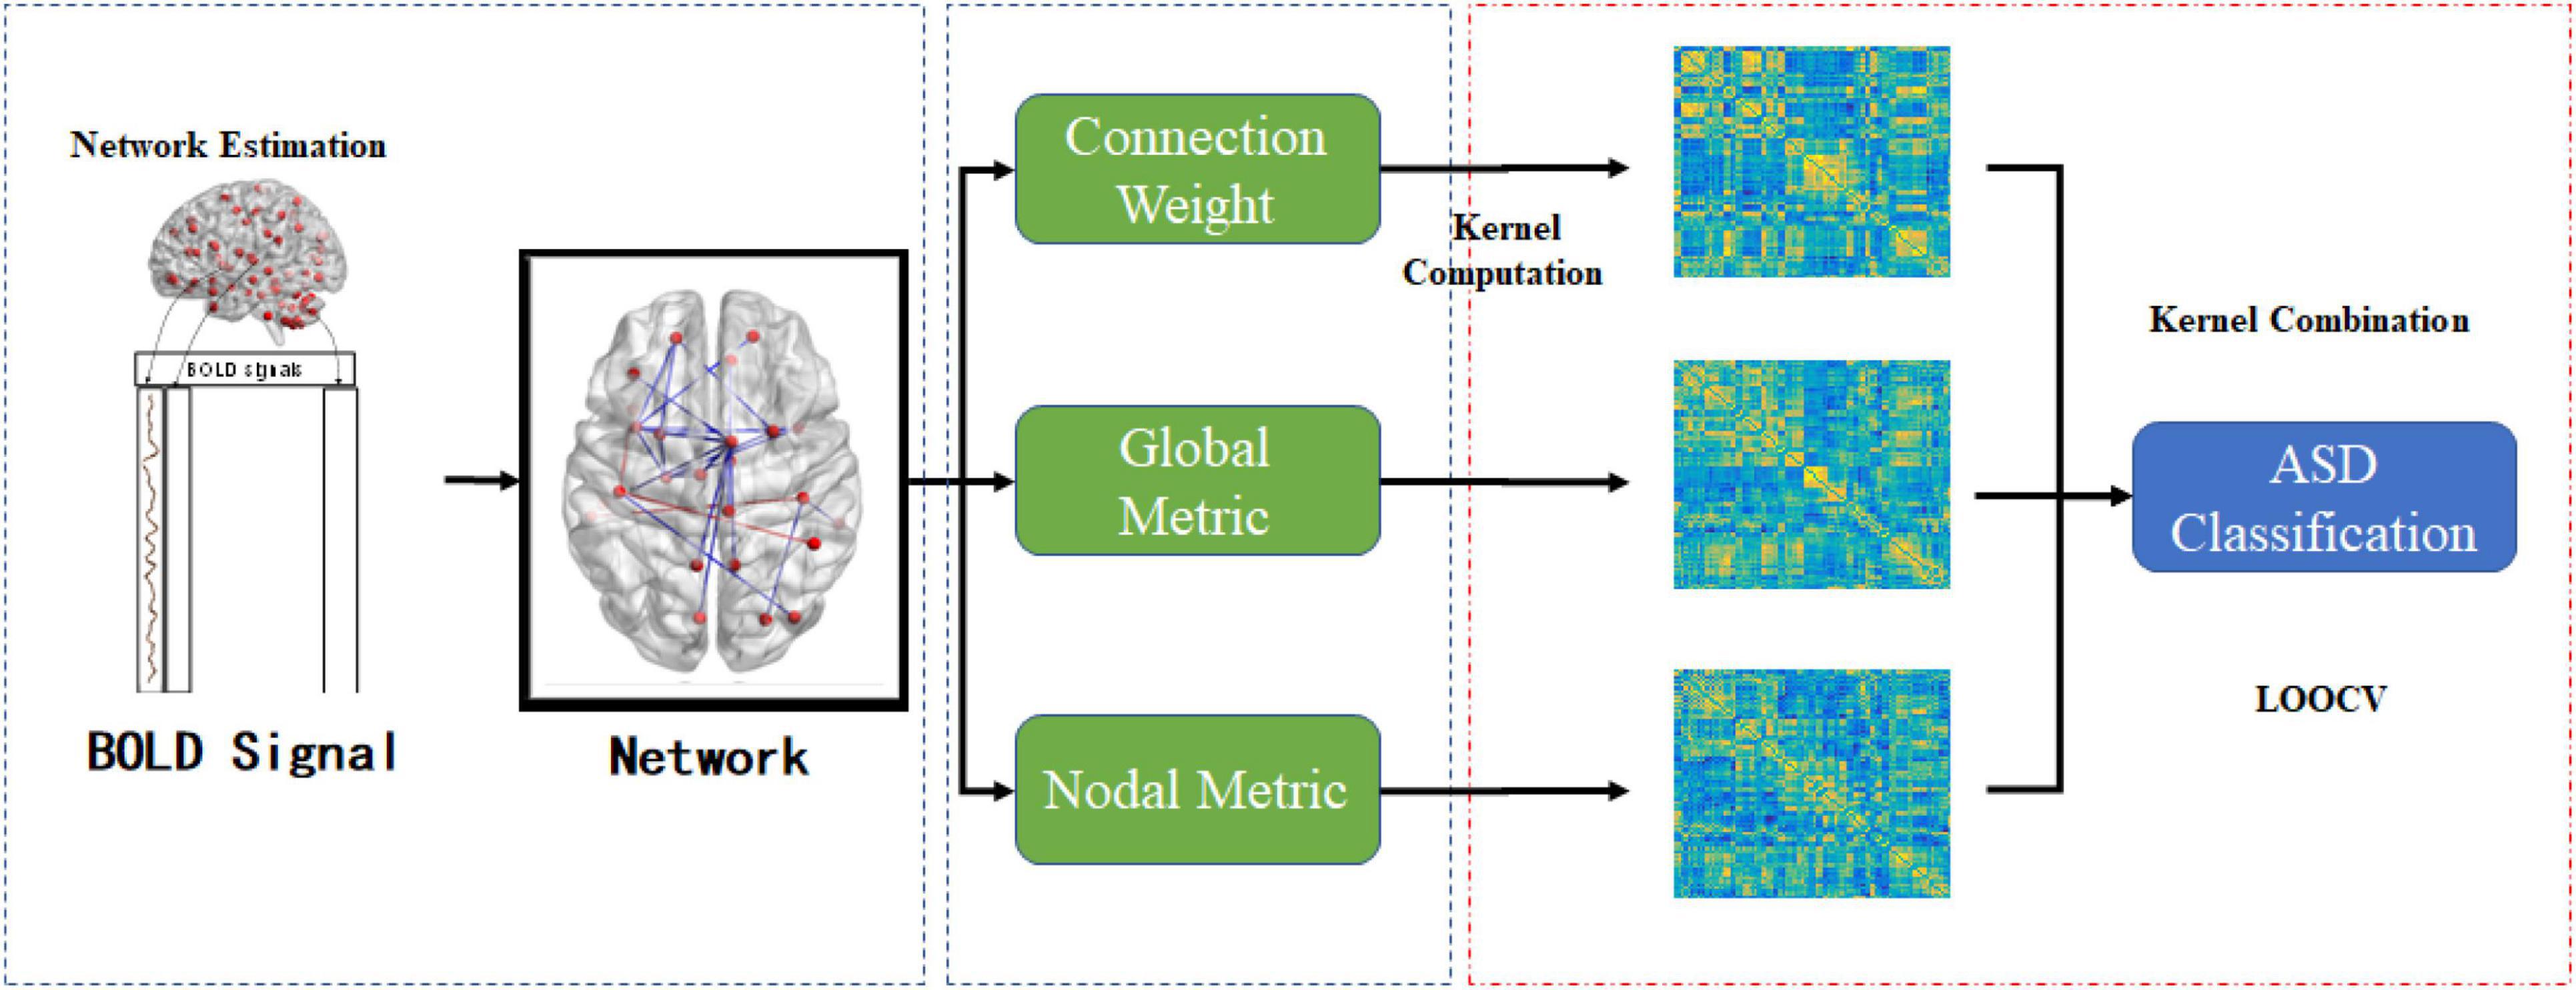
Figure 1. The entire pipeline of the proposed ASD classification task under the multiple graph view.
Classification Measurements
The classification performance of information combination methods is evaluated via several measurements, including sensitivity, specificity, and accuracy. The mathematical definitions of these three measures are as follows:
Additionally, the receiver operating characteristic curve (ROC) and AUC of these methods are also provided.
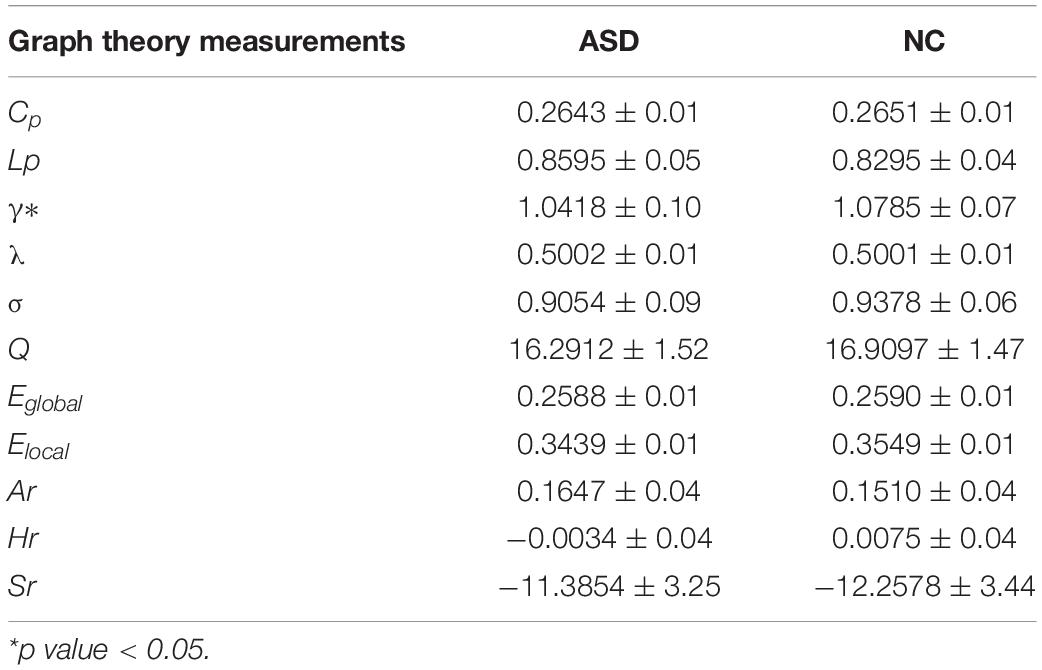
Ar, assortativity; Eglobal, global efficiency; Lp, characteristic path length; Q, modularity score; Elocal, local efficiency; Cp, clustering coefficient; Hr, hierarchy; σ, small-world; γ, normalized clustering coefficient; Sr, synchronization; λ, normalized characteristic path length. *p-value < 0.05.
Results
Graph Theory Measurements of Functional Brain Connectome
The results of the graph measurements of the ASD and NC groups are shown in Table 3. The results illustrated that Lp, λ, Ar, and Sr were increased, whereas Cp, γ, Eglobal, and Hr were decreased in ASD. Statistical analyses revealed that γ was significantly decreased in the ASD group compared to the NC group (p < 0.05).
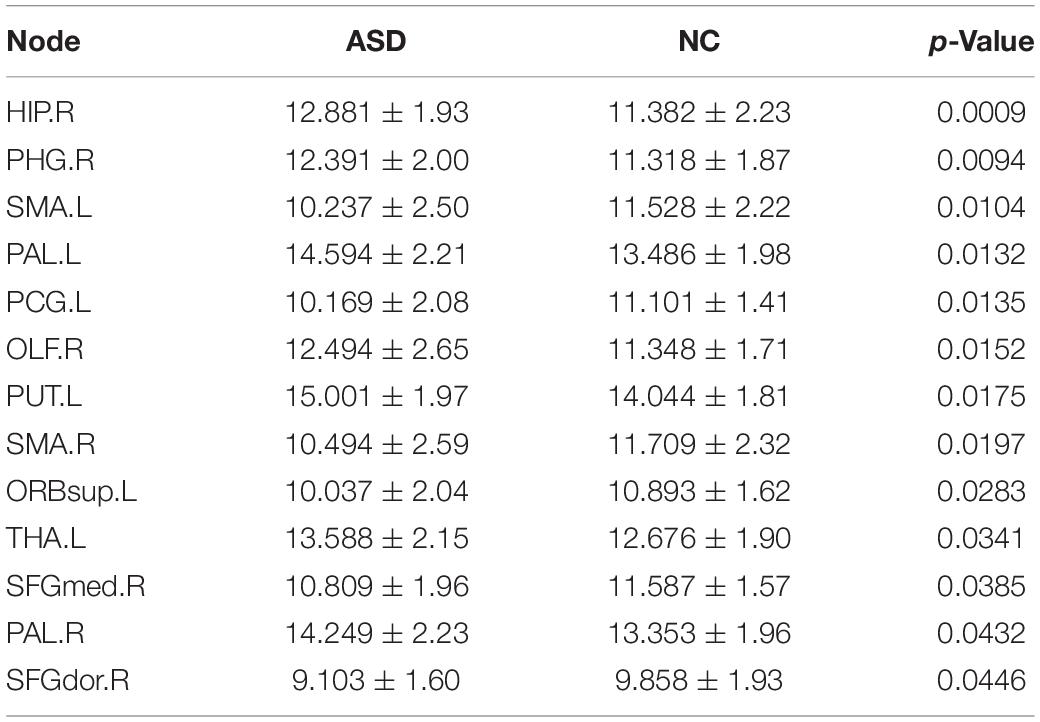
Degree Analysis of the Functional Brain Connectome
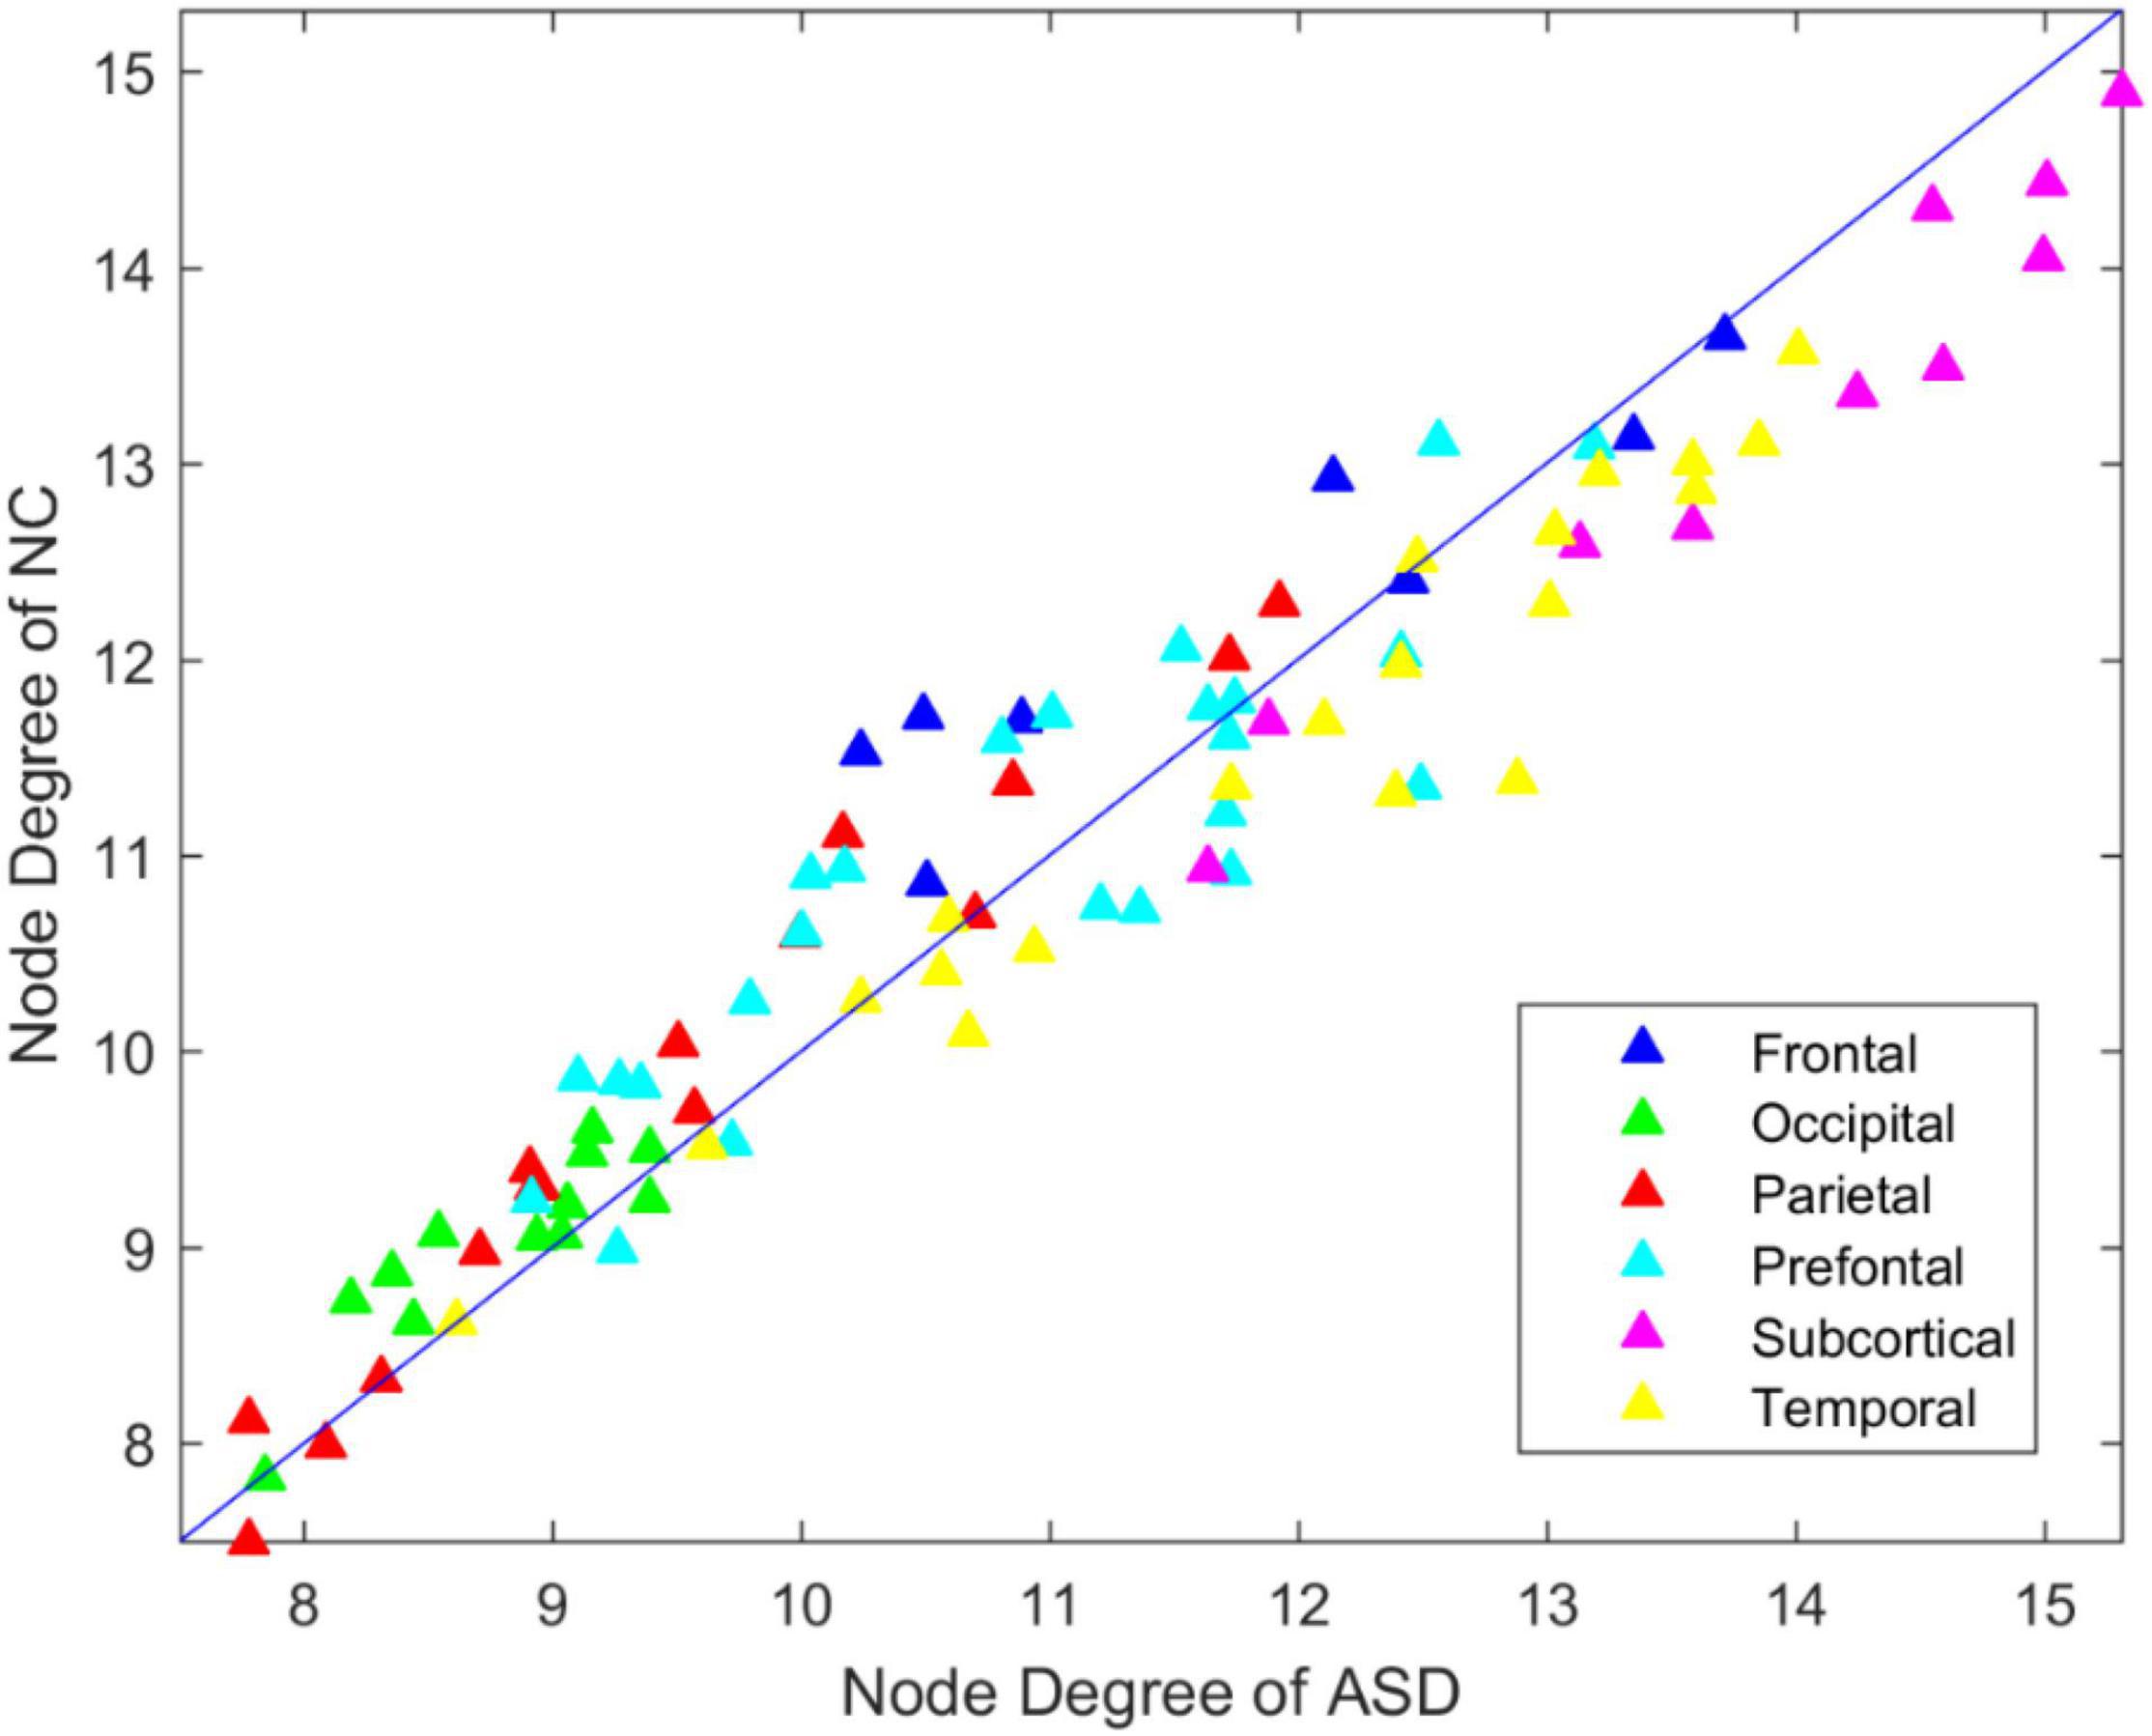
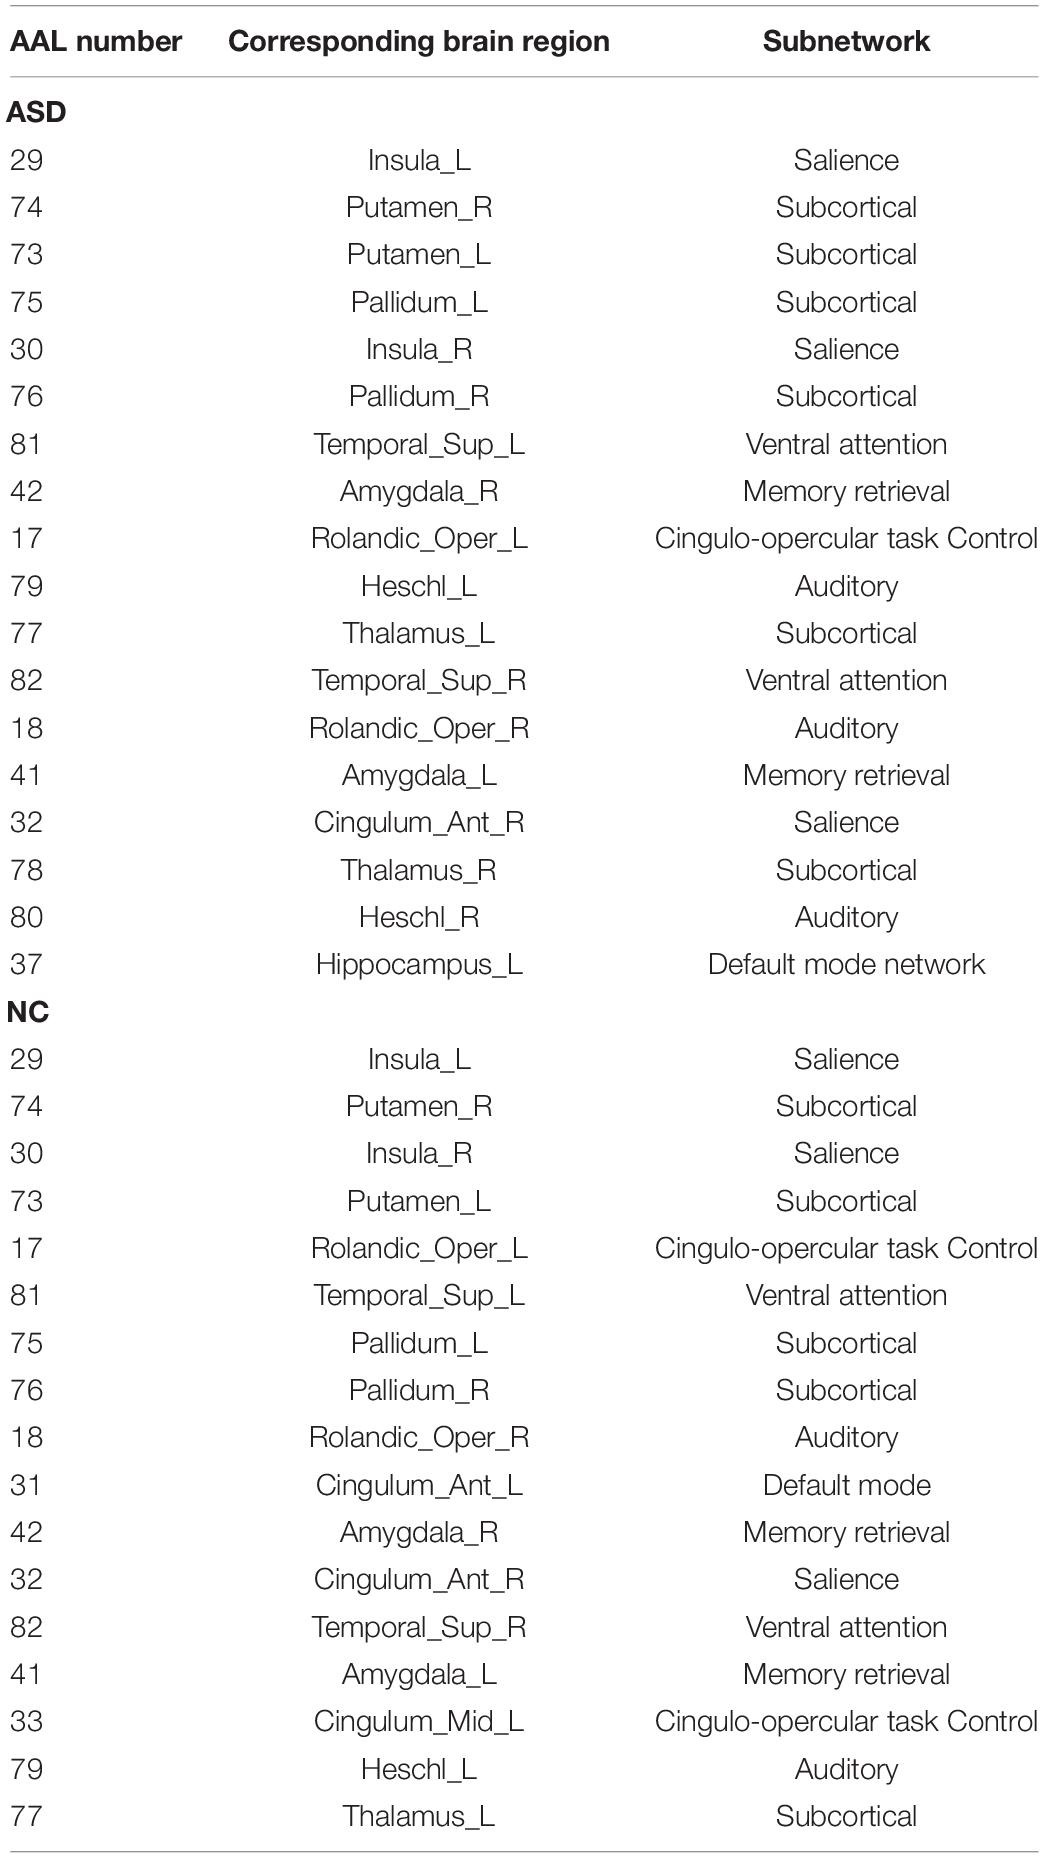
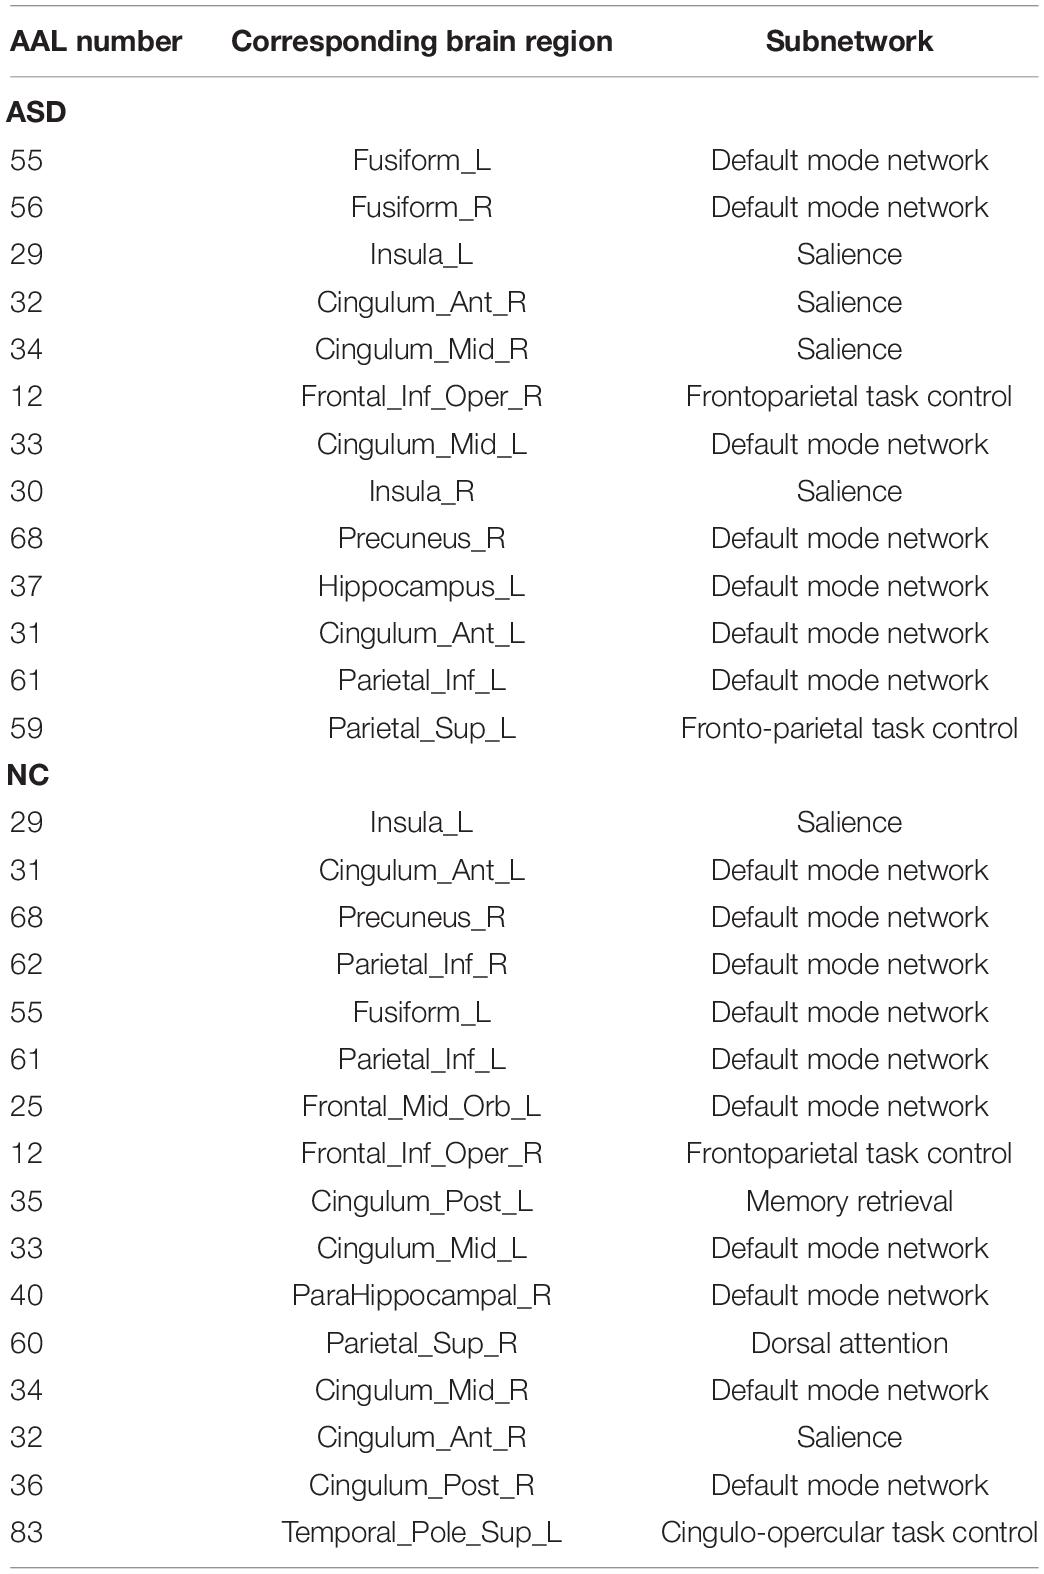
To investigate the degree distribution of the estimated brain network, we reported the mean degree of each node in the ASD and NC groups. As shown in Figure 2, the degree in the frontal, occipital parietal, and prefrontal regions tended to decrease in ASD, while it tended to increase in the temporal and subcortical regions. The 13 significant nodes with an average degree in the ASD and NC groups are listed in Table 4. The hub nodes of the ASD and NC groups are shown in Table 5. It was evident that most nodes overlapped across ASD and NC groups, including INS.L, PUT. L/R, PAL.L/R, INS.R, ROL.L, STG.L, ROL.R, AMYG.L/R, ACG.R, STG.R, and HES.L. Additionally, several specific hub nodes existed that corresponded to different groups. Specifically, in estimated brain network, ACG.L and IOG.R were only noted in the hub nodes of the NCs, while THA.L, HES.R, and HIP.L/R were only noted in ASD group as hub node.
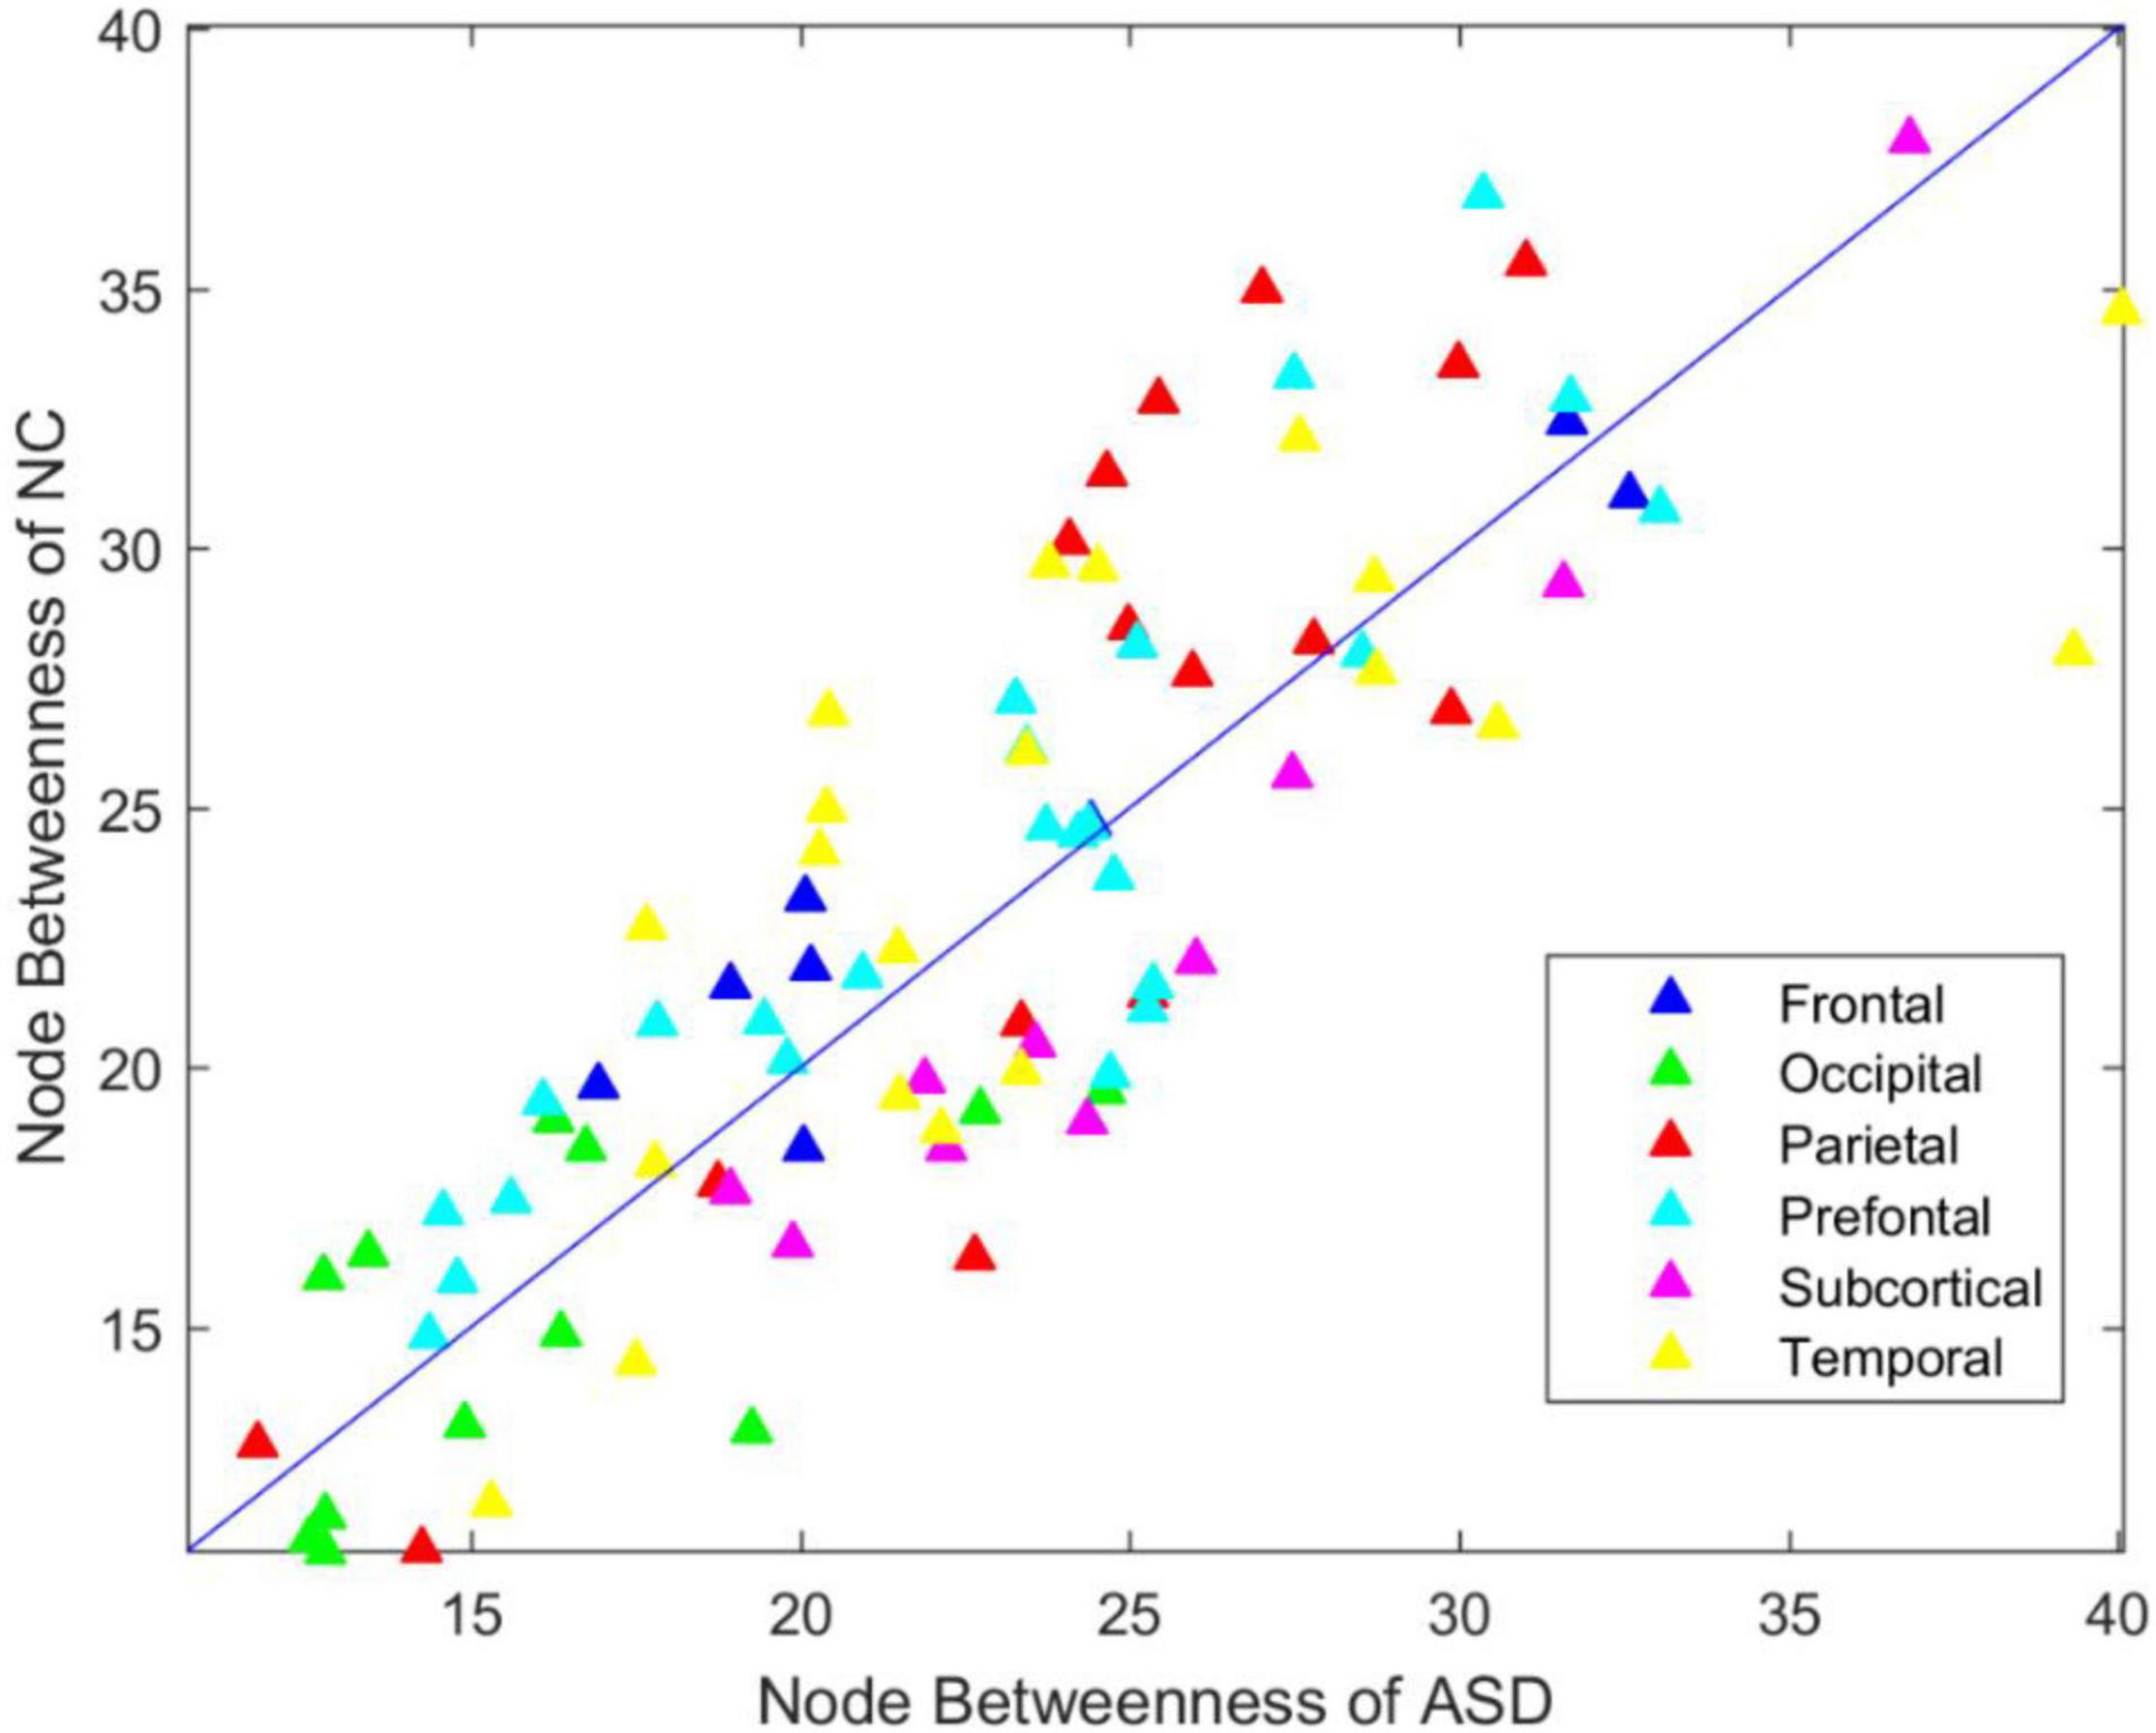
Betweenness Analysis of the Functional Brain Connectome
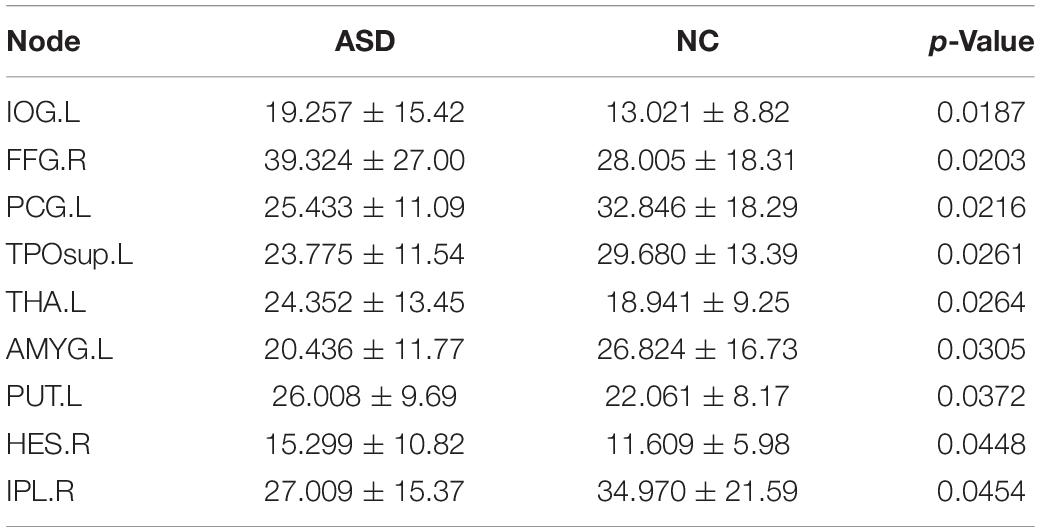
To investigate the betweenness distribution of the estimated functional brain connectome, we noted the mean betweenness of the ASD and NC groups (Figure 3). This finding illustrated that betweenness in the frontal, parietal, and prefrontal regions tended to decrease in ASD, while tended to increase in the subcortical regions. The significant nodes with average betweenness in the ASD and NC groups are listed in Table 6.
The betweenness hub nodes of ASD patients and NCs are shown in Table 7. The results illustrated that most betweenness hubs overlapped across ASD and NC groups, including FFG.L, INS.L, ACG.L/R, DCG.L/R, IFGoperc.R, PCUN.R, IPL.L, and SPG.L. The FFG.R, HIP.L, and INS.R were only noted in hub nodes of the NCs, while IPL.R, ORBsupmed.L, PCG.L, PHG.R, SPG.R, PCG.R, and TPOsup.L were only noted in ASD group as hub node.
Consensus Connections Analysis
We noted all selected connections during the entire validation process, that is, consensus connections, as shown in Figure 4 because the selected connections in each inner validation loop could be different. Specifically, we selected the connections with a p-value < 0.05, in each loop to train the classifier, which resulted in the obtainment of 103 consensus connections. The most significant connection in consensus connection was PHG.R–PAL.L. The red line in the right side of figure represents the weights in ASD, which tends to increase, while blue line represents a decrease.
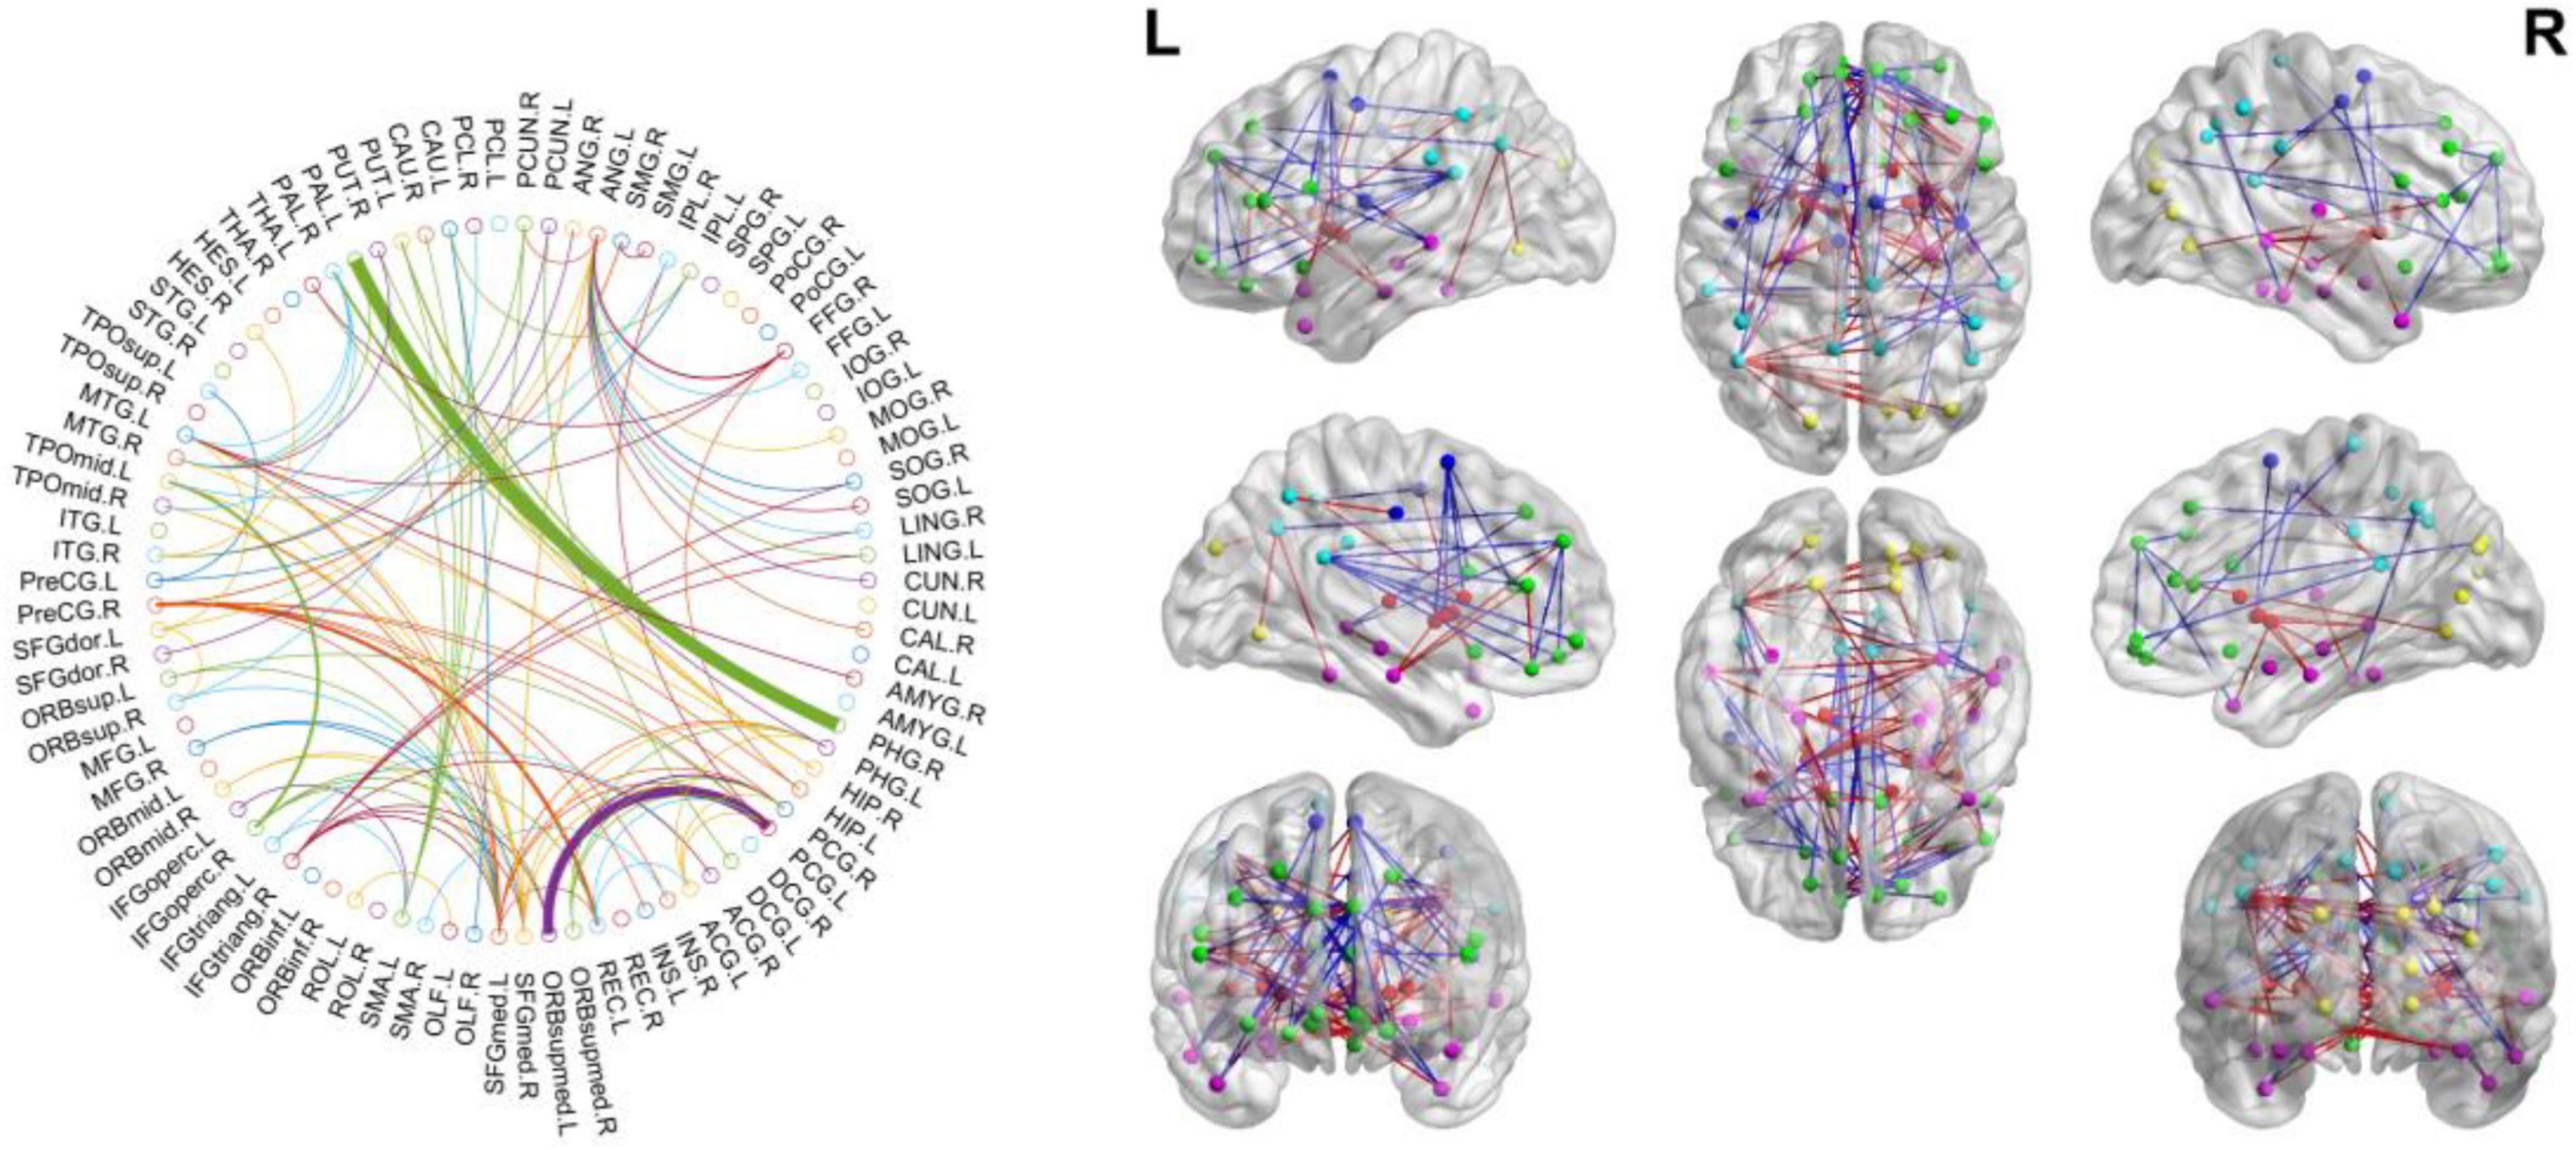
Figure 4. Consensus connection over the LOOCV by p-value < 0.05. The red line in the right figure represents the weights in ASD tends to be increased while the blue line represents decrease.
Classification
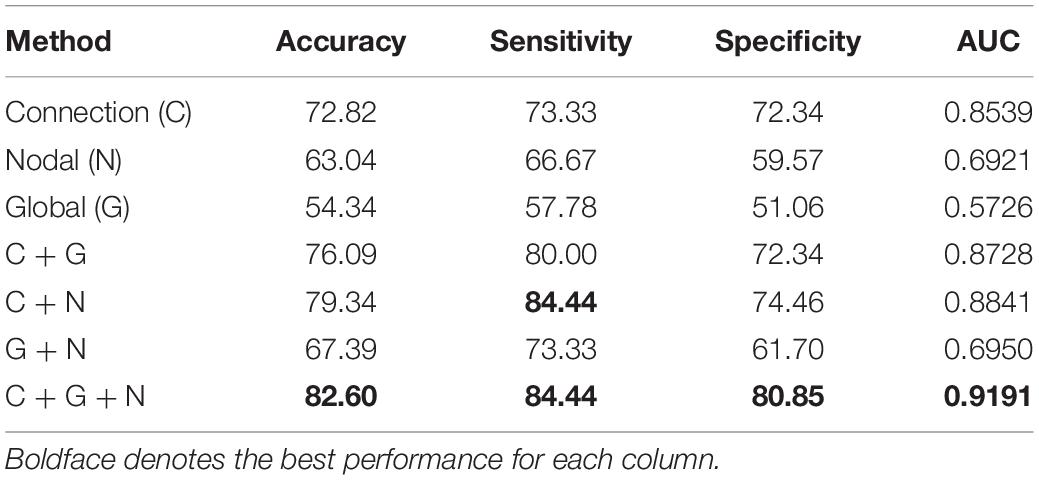
To confirm the information combination trick, we also validated the performance of the single kernel SVM classification result based on the connection, global measurements, and nodal measurements, and the results have been depicted in Table 8 and Figure 5. The classification accuracy of connection weight, global graph measurements, and nodal graph measurements were estimated to be 72.82, 63.04, and 54.34%, respectively. Additionally, using DeLong’s non-parametric statistical significance test (Zhang et al., 2016), C + G + N methods have been found to be significantly superior to Connection, Nodal, Global, C + G, C + N, and G + N methods under 95% confidence intervals with p-values of 0.004, 5×10⁻⁶, 3×10⁻¹⁰, 0.0247, 0.0278, and 1×10⁻⁵, respectively. These results revealed the superiority of the information combination strategy.
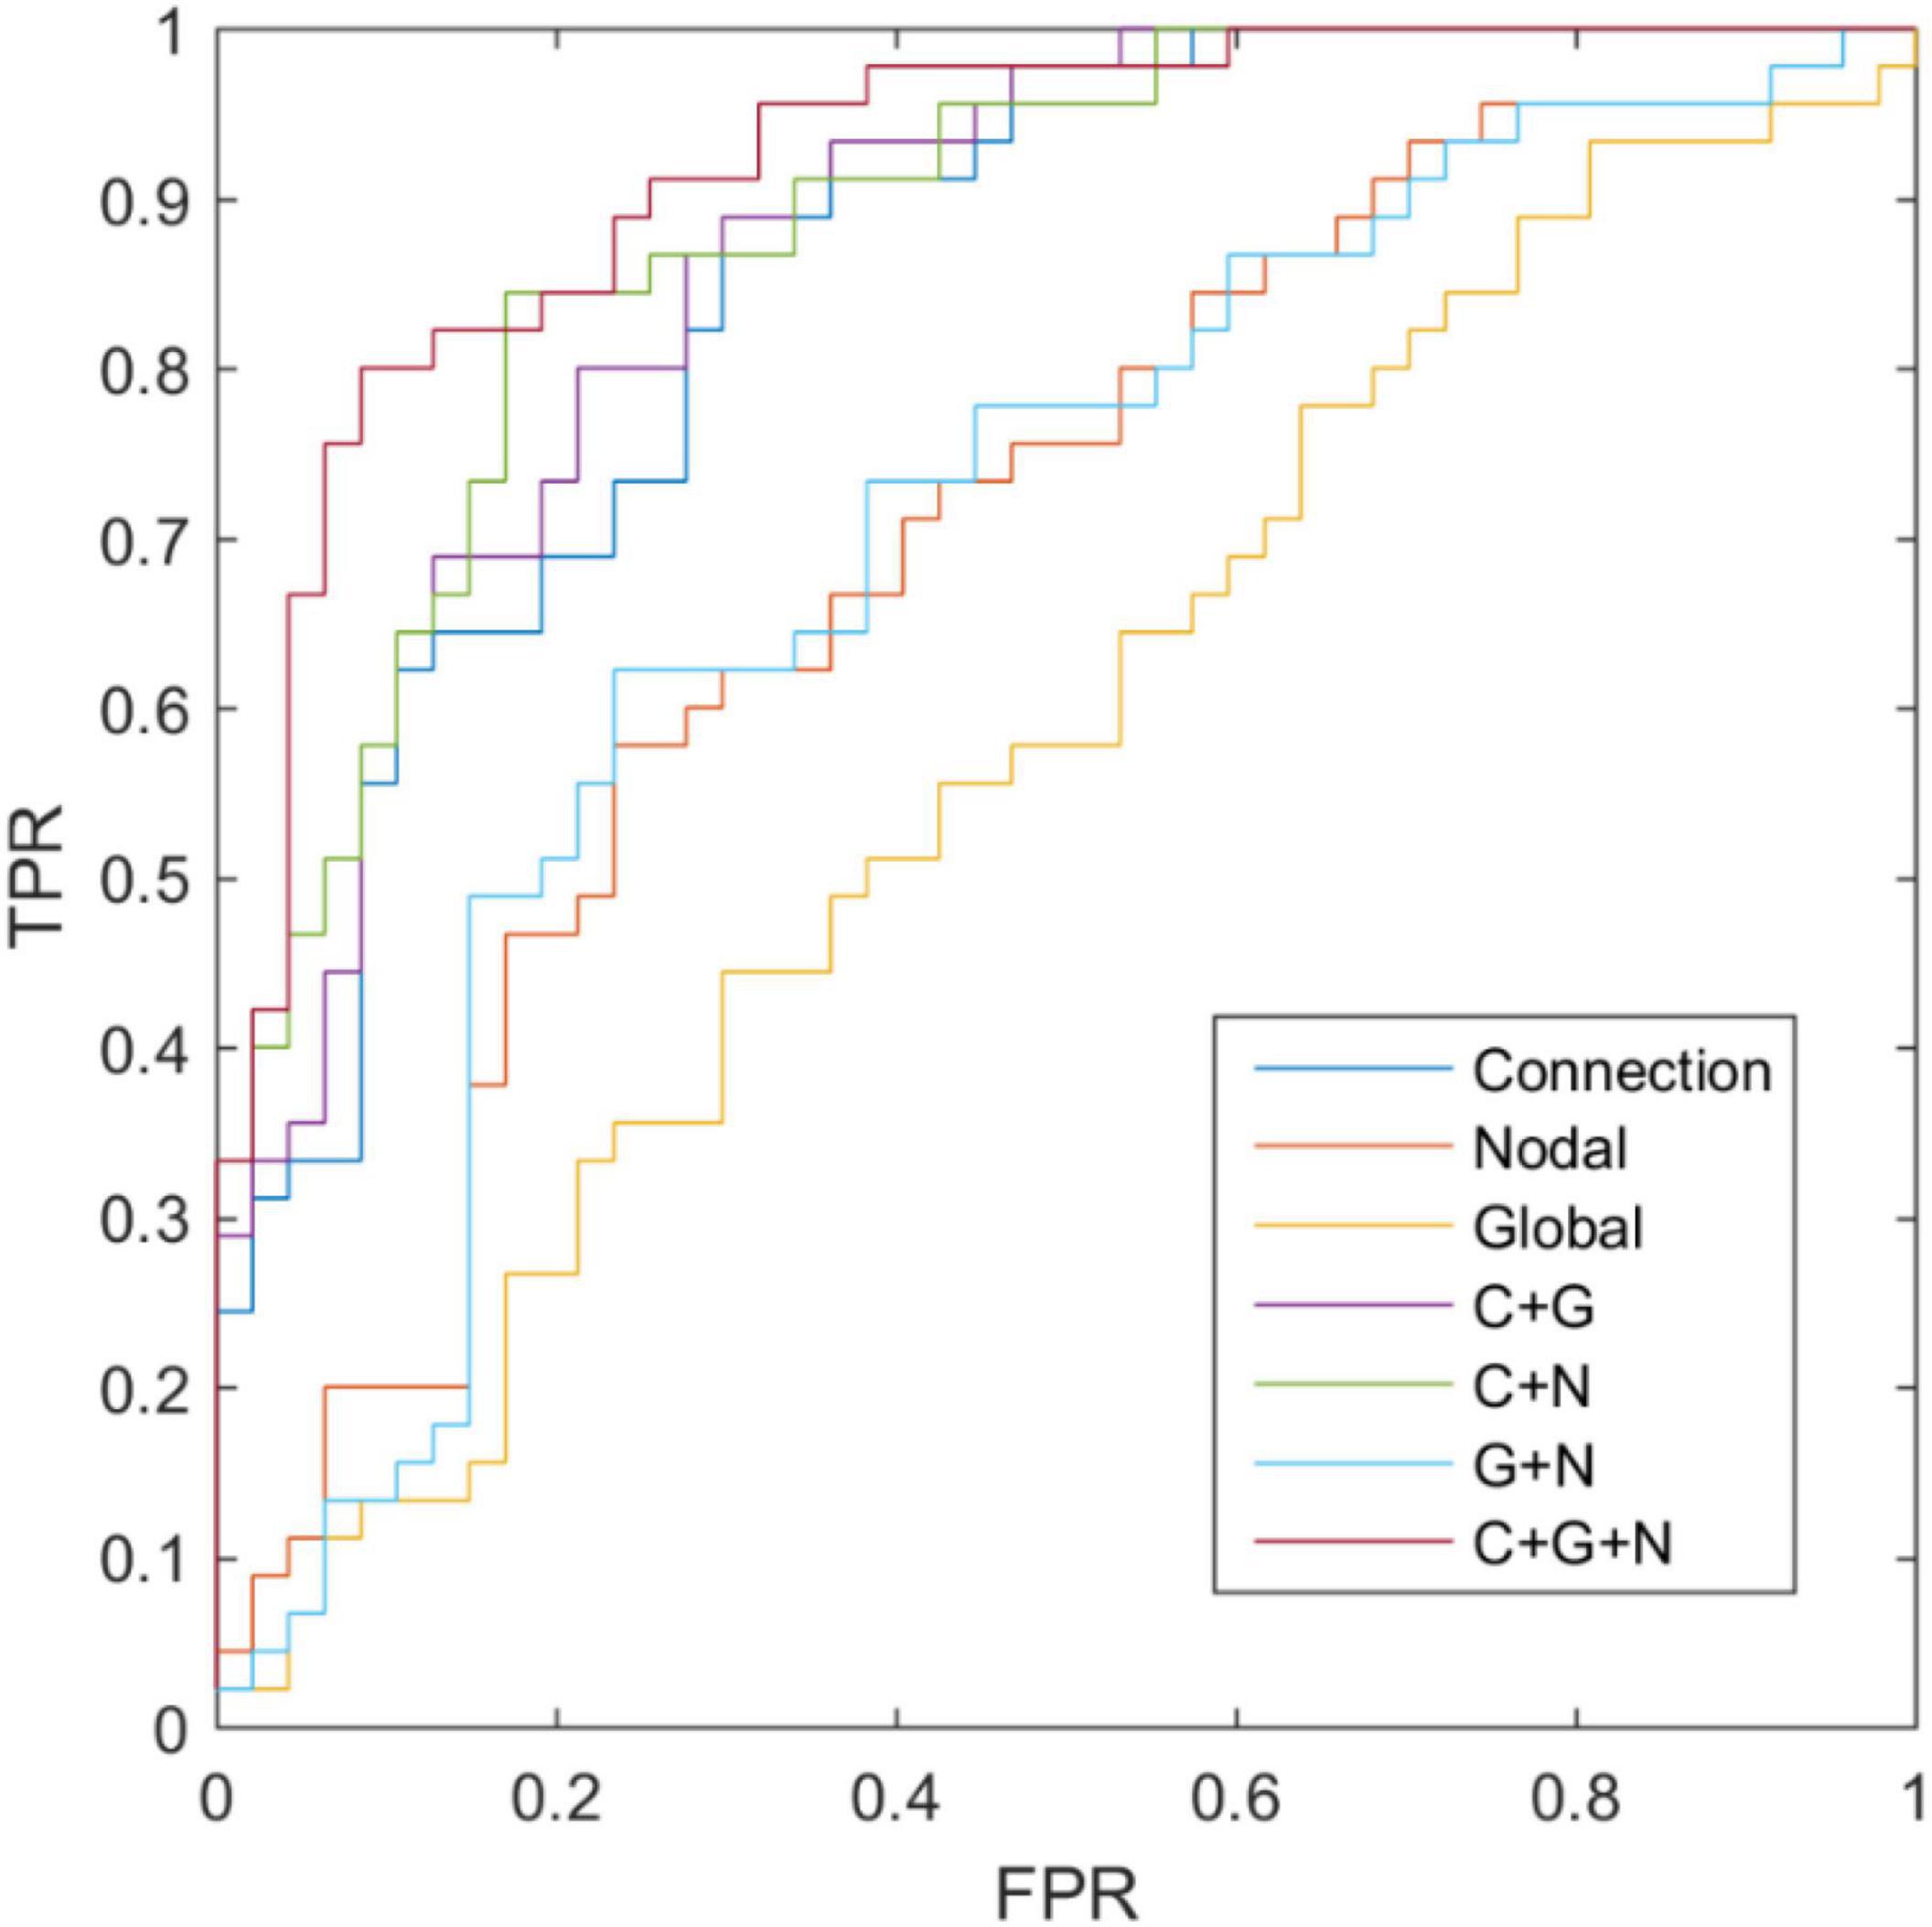
Figure 5. Receiver operating characteristic curve of classification based on different connectome features.
Discussion
In the present study, we aimed to explore the biomarkers and pathological mechanisms of brain network connectivity in individuals with ASD. Our results indicated that the combination of three modalities (i.e., connection weight, global measurements, and nodal measurements) using MK-SVM could significantly improve the classification performance of ASD individuals, since such methods not only utilized the information of the connection weight but also effectively incorporated several topological inputs. Moreover, the distribution of the discriminative brain regions and altered patterns of the brain connectome revealed the pathological mechanisms of individuals with ASD.
Distribution of the Discriminative Brain Regions and Brain Networks
Regarding functional connectivity at the whole brain level, we found that the consensus connection with the most significant difference between ASD and NC was PHG.R–PAL.L. Additionally, the brain regions with significant differences in degree and betweenness between the ASD and NC groups were mainly distributed in the medial temporal lobe (e.g. HIP, PHG, and PCG), subcutaneous nuclei (e.g. PUT, PAL, and THA), and frontal and occipital parietal lobes. Meanwhile, the hub nodes of the ASD and NC groups, defined by degree and betweenness, mostly overlapped with the above-mentioned brain regions. Among them, brain regions, such as HIP, PHG, AMYG, and CG, belong to the limbic system. Therefore, our results indicated that the discriminative brain regions of ASD patients were mainly distributed in the limbic system, subcutaneous nuclei, cortex, and connections among them. Furthermore, by projecting these brain regions into brain subnetworks, we found that most were involved in the DMN, SN, attention network, frontoparietal network, and social network (Schmälzle et al., 2017). These sub-networks play an important role in learning and memory (Sanjeevan et al., 2020), emotional expression (Sagar-Ouriaghli et al., 2018), behavior control, and social skills (Sato and Uono, 2019).
Altered Pattern of the Brain Network Connectome in Autism Spectrum Disorder
Graph theoretic analysis conducted in our study indicated that in terms of global graph measurements, Lp, λ, Ar, and Sr were increased, whereas Cp, γ, σ, Q, Eglobal, Elocal, and Hr were decreased in ASD. Although only γ seemed to be statistically significant, the graph theory attributes that reflected the segregation function of brain networks, including Cp, γ, Q, and Elocal, exhibited a decreased trend in ASD patients. Meanwhile, the graph theory attributes that reflected the integration function of brain networks, such as Lp and λ, exhibited an increased trend in individuals with ASD. Therefore, our results suggested that patients with ASD exhibited abnormal functional connectivity. This finding was also mentioned in previous studies (Just et al., 2004; Kana et al., 2011; Zu et al., 2019). Our research further revealed that ASD patients showed enhanced integration function and weakened segregation functions of the brain network. This suggests that the ability to rapidly synthesize specialized information from distributed brain regions has increased, while the occurrence of specialized processing within densely interconnected groups of brain regions has decreased (Rubinov and Sporns, 2010).
Moreover, in terms of local graph measurements, we found that the topological attributes of ASD, such as degree, betweenness, and hub nodes, exhibited abnormalities in multiple brain areas in the cortex-subcortical circuits. Among them, the functional connections related to the medial temporal lobe (e.g. the hippocampus, parahippocampal gyrus, and entorhinal cortex) and subcutaneous nuclei (e.g. putamen and pallidum) were mainly increased, while the related connections of the frontal lobe, parietal lobe, and occipital lobe were mainly decreased. In previous studies, the dysfunction of connections has been demonstrated to be associated with abnormal social, language, and other behaviors of ASD patients (Gao et al., 2019; Verly et al., 2014; Sato and Uono, 2019). Additionally, the hub nodes of ASD and NCs mostly overlapped. Our results indicated the disappearance of certain hubs in the ASD group, which suggested that the brain network integration function of ASD might have changed. This might be related to the pathological changes in ASD.
Classification of Multi-Kernel Support Vector Machine
The classification results illustrate that combination of more information can be considered to effectively enhance the classifier for ASD diagnosis. Moreover, although global theory achieves 54.24% accuracy, it can provide a 6.52% accuracy gain for C + N. The results indicate that different types of information can provide different types of discriminative information for ASD diagnosis, which further confirms the effectiveness of the proposed information combination method. More importantly, such results are achieved with the use of only single modal data, that is, fMRI, which thereby provides novel insights for improving the identification performance in such neurodevelopmental disorders.
Conclusion
We report the application of FBNs as well as their topological information for investigation of potential biomarkers of ASD in the afflicted individuals. The discriminative connections of FBNs highlighted the abnormality of connections between the PHG.R and PAL.L of the ASD groups. Additionally, the combination of the information derived from the FBN with MK-SVM helped achieve the best classification performance and significantly outperformed the performance achieved using only single connection information. In the end, due to the limited sample sizes, it is still necessary for us to verify the robustness and generalization ability of the proposed methods on larger and higher quality databases in the future.
Data Availability Statement
The original contributions presented in the study are included in the article/supplementary material, further inquiries can be directed to the corresponding authors.
Author Contributions
XX and LP designed the study and drafted the manuscript. LP and XL collected the MRI data. XC and XX analyzed and interpreted the results of the data. XG and XC revised the manuscript. All authors approved the final manuscript.
Funding
This work was partially supported by the Natural Science Foundation of Hainan Province (620RC558); Key Research and Development Program of Hainan province (ZDYF2021GXJS017); the Fundamental Research Funds for the Central Universities (22120190219); The National Natural Science Foundation of China (81830059, 81771889, and 82160345); The National Pillar Program of China Ministry of Science and Technology (2009BAI77B03); Group Building Scientific Innovation Project for Universities in Chongqing (CXQT21021); Clinical Research Plan of SHDC (SHDC2020CR1038B); Shanghai Municipal Commission of Health and Family Planning Smart Medical Special Research Project (2018ZHYL0105); Shanghai Science and Technology Committee (20Y11906800); Shanghai Municipal Commission of Health and Family Planning Science and Research Subjects (201740010 and 202140464); Clinical Research Center Project of Shanghai Mental Health Center (CRC2017ZD02); Shanghai Mental Health Center (2018-FX-05 and 2020zd01); and Scientific Research Subjects of Shanghai Universal Medical Imaging Technology Limited Company (UV2020Z02 and UV2021Z01).
Conflict of Interest
The authors declare that the research was conducted in the absence of any commercial or financial relationships that could be construed as a potential conflict of interest.
Publisher’s Note
All claims expressed in this article are solely those of the authors and do not necessarily represent those of their affiliated organizations, or those of the publisher, the editors and the reviewers. Any product that may be evaluated in this article, or claim that may be made by its manufacturer, is not guaranteed or endorsed by the publisher.
Footnotes
- ^ https://www.fil.ion.ucl.ac.uk/spm
- ^ http://restfmri.net/forum/index.php
- ^ www.nitrc.org/projects/gretna/
References
Allen, G., and Courchesne, E. (2003). Differential effects of developmental cerebellar abnormality on cognitive and motor functions in the cerebellum: an fMRI study of autism. Am. J. Psychiatry 160, 262–273. doi: 10.1176/appi.ajp.160.2.262
Anderson, J. S., Druzgal, T. J., Froehlich, A., Dubray, M. B., Lange, N., Alexander, A. L., et al. (2011). Decreased interhemispheric functional connectivity in autism. Cereb. Cortex 21, 1134–1146. doi: 10.1093/cercor/bhq190
Baio, J. (2014). Prevalence of autism spectrum disorder among children aged 8 years-autism and developmental disabilities monitoring network, 11 sites, United States, 2010 1. Morbidity Mortal. Week. Report. Surveil. Summar. 63, 1–21. doi: 10.1177/1744629515577876
Biswal, B., Yetkin, F. Z., Haughton, V. M., and Hyde, J. S. (1995). Functional connectivity in the motor cortex of resting human brain using echo-planar MRI. Mag. Reson. Med. 34, 537–541. doi: 10.1002/mrm.1910340409
Brambilla, P., Hardan, A., Nemi, S. U. D., Perez, J., Soares, J. C., and Barale, F. (2003). Brain anatomy and development in autism: review of structural MRI studies. Brain Res. Bull. 61, 557–569. doi: 10.1016/j.brainresbull.2003.06.001
Brunetti, M., Belardinelli, P., Gratta, C. D., Pizzella, V., Penna, S. D., Ferretti, A., et al. (2006). Human brain activation elicited by the localization of sounds delivering at attended or unattended positions: an fMRI/MEG study. Cogn. Process. 7, 116–117. doi: 10.1007/s10339-006-0093-3
Delmonte, S., Gallagher, L., O’hanlon, E., Mcgrath, J., and Balsters, J. H. (2012). Functional and structural connectivity of frontostriatal circuitry in Autism Spectrum Disorder. Front. Hum. Neurosci. 7:233–242. doi: 10.3389/fnhum.2013.00430
Di, M. A., Yan, C. G., Li, Q., Denio, E., Castellanos, F. X., Alaerts, K., et al. (2014). The autism brain imaging data exchange: towards a large-scale evaluation of the intrinsic brain architecture in autism. Mol. Psychiatry 19, 659–667. doi: 10.1038/mp.2013.78
Friston, K. J., Williams, S., Howard, R., Frackowiak, R. S. J., and Turner, R. (1996). Movement-Related effects in fMRI time-series. Mag. Reson. Med. Official J. Soc. Mag. Reson. Med. 35, 346–355. doi: 10.1002/mrm.1910350312
Gao, X., Xu, X., Hua, X., Wang, P., Li, W., and Li, R. (2020). Group Similarity Constraint Functional Brain Network Estimation for Mild Cognitive Impairment Classification. Front. Neurosci. 14:165. doi: 10.3389/fnins.2020.00165
Gao, Y., Linke, A., Jao Keehn, R. J., Punyamurthula, S., Jahedi, A., Gates, K., et al. (2019). The language network in autism: Atypical functional connectivity with default mode and visual regions. Autism Res. 12, 1344–1355. doi: 10.1002/aur.2171
Gotts, S. J., Simmons, W. K., Milbury, L. A., Wallace, G. L., Cox, R. W., and Martin, A. (2012). Fractionation of social brain circuits in autism spectrum disorders. Brain A J. Neurol. 135, 2711–2725. doi: 10.1093/brain/aws160
Huang, S., Li, J., Sun, L., Liu, J., Wu, T., Chen, K., et al. (2009). “. Learning Brain Connectivity of Alzheimer’s Disease from Neuroimaging Data,” in Advances in Neural Information Processing Systems 22: Conference on Neural Information Processing Systems 2009. Proceedings of A Meeting Held 7-10 December 2009, eds B. Yoshua, S. Dale, D. L. John, K. I. W. Christopher, and C. Aron (Vancouver, British Columbia, Canada: Curran Associates, Inc), 808–816.
Jin, H. L., Durand, R., Gradinaru, V., Feng, Z., Goshen, I., Kim, D. S., et al. (2010). Global and local fMRI signals driven by neurons defined optogenetically by type and wiring. Nature 465, 788–792. doi: 10.1038/nature09108
Just, M. A., Cherkassky, V. L., Keller, T. A., and Minshew, N. J. (2004). Cortical activation and synchronization during sentence comprehension in high-functioning autism: evidence of underconnectivity. Brain 127, 1811–1821. doi: 10.1093/brain/awh199
Kana, R. K., Libero, L. E., and Moore, M. S. (2011). Disrupted cortical connectivity theory as an explanatory model for autism spectrum disorders. Phys. Life Rev. 8, 410–437. doi: 10.1016/j.plrev.2011.10.001
Keown, C. L., Datko, M. C., Chen, C. P., Maximo, J. O., Jahedi, A., and Müller, R.-A. (2017). Network organization is globally atypical in autism: a graph theory study of intrinsic functional connectivity. Biol. Psychiatry 2, 66–75. doi: 10.1016/j.bpsc.2016.07.008
Kevin, W., Doug, W., Matthias, S., and Gerhard, S. (2008). Correspondence of Visual Evoked Potentials with Fmri Signals in Human Visual Cortex. Brain Topogr. 21, 86–92. doi: 10.1007/s10548-008-0069-y
Li, W., Geng, C., and Chen, S. (2020a). Leave Zero Out: Toward4s a No-Cross-Validation Approach for Model Selection. arXiv. [Preprint]. arXiv:2012.13309
Li, W., Xu, X., Jiang, W., Wang, P., and Gao, X. (2020b). Functional connectivity network estimation with an inter-similarity prior for mild cognitive impairment classification. Aging 12:17328. doi: 10.18632/aging.103719
Li, W., Wang, Z., Zhang, L., Qiao, L., and Shen, D. (2017). Remodeling Pearson’s correlation for functional brain network estimation and autism spectrum disorder identification. Front. Neuroinform. 11:55. doi: 10.3389/fninf.2017.00055
Li, W., Xu, X., Wang, Z., Peng, L., Wang, P., and Gao, X. (2021). Multiple connection pattern combination from single-mode data for mild cognitive impairment identification. Front. Cell Dev. Biol. 9:782727. doi: 10.3389/fcell.2021.782727
Li, W., Zhang, L., Qiao, L., and Shen, D. (2019). Towards a Better Estimation of Functional Brain Network for Mild cognitive impairmen Identification: A Transfer Learning View. IEEE J. Biomed. Health Inform. 24, 1160–1168. doi: 10.1101/684779
Liu, F., Wee, C. Y., Chen, H., and Shen, D. (2012). “Inter-modality relationship constrained multi-task feature selection for AD/MCI classification,” in Proceedings of the Medical Image Computing and Computer-Assisted Intervention – MICCAI 2013, eds K. Mori, I. Sakuma, Y. Sato, C. Barillot, and N. Navab (Berlin: Springer), 308–315. doi: 10.1007/978-3-642-40811-3_39
Lord, C., Cook, E. H., Leventhal, B. L., and Amaral, D. G. (2000). Autism Spectrum Disorders. Neuron 41, 541–543.
Lord, C., and Jones, R. M. (2012). Annual Research Review: Re-thinking the classification of autism spectrum disorders. J. Child Psychol. Psychiatry Allied Discipl. 53, 490–509. doi: 10.1111/j.1469-7610.2012.02547.x
Nielsen, J. A., Zielinski, B. A., Fletcher, P. T., Alexander, A. L., Lange, N., Bigler, E. D., et al. (2013). Multisite functional connectivity MRI classification of autism: ABIDE results. Front. Hum. Neurosci. 7:599. doi: 10.3389/fnhum.2013.00599
O’Roak, B. J., Vives, L., Fu, W., Egertson, J. D., Stanaway, I. B., Phelps, I. G., et al. (2012). Multiplex Targeted Sequencing Identifies Recurrently Mutated Genes in Autism Spectrum Disorders. Science 338, 1619–1622. doi: 10.1126/science.1227764
Rosa, M. J., Portugal, L., Hahn, T., Fallgatter, A. J., Garrido, M. I., Shawe-Taylor, J., et al. (2015). Sparse network-based models for patient classification using fMRI. Neuroimage 105, 493–506. doi: 10.1016/j.neuroimage.2014.11.021
Rubinov, M., and Sporns, O. (2010). Complex network measures of brain connectivity: uses and interpretations. Neuroimage 52, 1059–1069. doi: 10.1016/j.neuroimage.2009.10.003
Sagar-Ouriaghli, I., Lievesley, K., and Santosh, P. J. (2018). Propranolol for treating emotional, behavioural, autonomic dysregulation in children and adolescents with autism spectrum disorders. J. Psychopharmacol. 32, 641–653. doi: 10.1177/0269881118756245
Sanjeevan, T., Hammill, C., Brian, J., Crosbie, J., Schachar, R., Kelley, E., et al. (2020). Exploring the Neural Structures Underlying the Procedural Memory Network as Predictors of Language Ability in Children and Adolescents With Autism Spectrum Disorder and Attention Deficit Hyperactivity Disorder. Front. Hum. Neurosci. 14:587019. doi: 10.3389/fnhum.2020.587019
Sato, W., and Uono, S. (2019). The atypical social brain network in autism: advances in structural and functional MRI studies. Curr. Opin. Neurol. 32, 617–621. doi: 10.1097/WCO.0000000000000713
Schmälzle, R., Brook O’donnell, M., Garcia, J. O., Cascio, C. N., Bayer, J., Bassett, D. S., et al. (2017). Brain connectivity dynamics during social interaction reflect social network structure. Proc. Natl. Acad. Sci. U S A 114, 5153–5158. doi: 10.1073/pnas.1616130114
Segal, L. D. (2000). Diagnostic and Statistical Manual of Mental Disorders (Dsm-Iv-Tr). Virginia, US: American Psychiatric Association.
Smith, S. M., Miller, K. L., Salimi-Khorshidi, G., Webster, M., Beckmann, C. F., Nichols, T. E., et al. (2011). Network modelling methods for FMRI. Neuroimage 54, 875–891. doi: 10.1016/j.neuroimage.2010.08.063
Stam, C. J. (2014). Modern network science of neurological disorders. Nat. Rev. Neurosci. 15, 683–695. doi: 10.1038/nrn3801
Supekar, K., Menon, V., Rubin, D., Musen, M., and Greicius, M. D. (2008). Network Analysis of Intrinsic Functional Brain Connectivity in Alzheimer’s Disease. PLoS Comput. Biol. 4:e1000100. doi: 10.1371/journal.pcbi.1000100
Theije, C. G. M. D., Wu, J., Silva, S. L. D., Kamphuis, P. J., Garssen, J., Korte, S. M., et al. (2011). Pathways underlying the gut-to-brain connection in autism spectrum disorders as future targets for disease management. Eur. J. Pharmacol. 668, S70–80. doi: 10.1016/j.ejphar.2011.07.013
Tzourio-Mazoyer, N., Landeau, B., Papathanassiou, D., Crivello, F., Etard, O., Delcroix, N., et al. (2002). Automated Anatomical Labeling of Activations in SPM Using a Macroscopic Anatomical Parcellation of the MNI MRI Single-Subject Brain. Neuroimage 15, 273–289. doi: 10.1006/nimg.2001.0978
Verly, M., Verhoeven, J., Zink, I., Mantini, D., Peeters, R., Deprez, S., et al. (2014). Altered functional connectivity of the language network in ASD: role of classical language areas and cerebellum. Neuroimage Clin. 4, 374–382. doi: 10.1016/j.nicl.2014.01.008
Wang, J., Wang, X., Xia, M., Liao, X., Evans, A., and He, Y. (2015). GRETNA: a graph theoretical network analysis toolbox for imaging connectomics. Front. Hum. Neurosci. 9:386. doi: 10.3389/fnhum.2015.00386
Wang, K., Zhang, H., Ma, D., Bucan, M., Glessner, J. T., Abrahams, B. S., et al. (2009). Common genetic variants on 5p14.1 associate with autism spectrum disorders. Nature 459, 528–533. doi: 10.1038/nature07999
Wee, C. Y., Wang, L., Shi, F., Yap, P. T., and Shen, D. (2014). Diagnosis of autism spectrum disorders using regional and interregional morphological features. Hum. Brain Mapp. 35, 3414–3430. doi: 10.1002/hbm.22411
Wee, C. Y., Yap, P. T., and Shen, D. (2016). Diagnosis of Autism Spectrum Disorders Using Temporally Distinct Resting-State Functional Connectivity Networks. Cns Neurosci. Therapeut. 22, 212–219. doi: 10.1111/cns.12499
Wee, C. Y., Yap, P. T., Zhang, D., Denny, K., Browndyke, J. N., Potter, G. G., et al. (2012). Identification of MCI individuals using structural and functional connectivity networks. Neuroimage 59, 2045–2056. doi: 10.1016/j.neuroimage.2011.10.015
Zhang, F., Yuan, N. J., Lian, D., Xie, X., and Ma, W.-Y. (2016). “Collaborative knowledge base embedding for recommender systems”. in Proceedings of the 22nd ACM SIGKDD International Conference on Knowledge Discovery and Data Mining, San Francisco, CA.
Keywords: Pearson’s correlation, functional magnetic resonance imaging, functional brain network, autism spectrum disorder, MK-SVM
Citation: Peng L, Liu X, Ma D, Chen X, Xu X and Gao X (2022) The Altered Pattern of the Functional Connectome Related to Pathological Biomarkers in Individuals for Autism Spectrum Disorder Identification. Front. Neurosci. 16:913377. doi: 10.3389/fnins.2022.913377
Received: 05 April 2022; Accepted: 20 April 2022;
Published: 06 May 2022.
Edited by:
Zhengxia Wang, Hainan University, ChinaCopyright © 2022 Peng, Liu, Ma, Chen, Xu and Gao. This is an open-access article distributed under the terms of the Creative Commons Attribution License (CC BY). The use, distribution or reproduction in other forums is permitted, provided the original author(s) and the copyright owner(s) are credited and that the original publication in this journal is cited, in accordance with accepted academic practice. No use, distribution or reproduction is permitted which does not comply with these terms.
*Correspondence: Xiaowen Xu, MTcxMDQ1MUB0b25namkuZWR1LmNu; Xin Gao, Z2FveGluQHV2Y2xpbmljLmNu
†These authors have contributed equally to this work and share first authorship
 Liling Peng1†
 Di Ma
Di Ma Xin Gao