 Lei Zhang
 Hua Li2†
 Kun Fang
 Cheng Huang
 Jun Li
94% of researchers rate our articles as excellent or good
Learn more about the work of our research integrity team to safeguard the quality of each article we publish.
Find out more
ORIGINAL RESEARCH article
Front. Neurosci., 12 May 2022
Sec. Perception Science
Volume 16 - 2022 | https://doi.org/10.3389/fnins.2022.913042
This article is part of the Research TopicInterplay Between Pain and Cognitive DysfunctionView all 12 articles
Dexmedetomidine, as an α2-adrenoceptor agonist, plays anti-sympathetic, sedative and analgesic roles in perioperative period. Also, dexmedetomidine can reduce the minimal alveolar concentration (MAC) of sevoflurane and the risk of postoperative cognitive dysfunction (POCD) induced by sevoflurane anesthesia. But so far, the electroencephalogram (EEG) mechanism of dexmedetomidine deepening sevoflurane anesthesia is not clear. In this study, by analyzing the changes of the power spectrum and bicoherence spectrum of EEG before and after dexmedetomidine infusion, the EEG mechanism of dexmedetomidine deepening sevoflurane anesthesia was studied. We analyzed dexmedetomidine-induced changes in power spectrum and bicoherence spectrum in 23 patients under sevoflurane anesthesia. After anesthesia induction, the sevoflurane concentration was maintained at 0.8 MAC for 15 min, and then dexmedetomidine was administered at a loading dose of 0.8 μg/kg in 10 min, followed by a maintenance rate of 0.5 μg⋅kg–1⋅h–1. Frontal EEG data from 5 min before and 10 min after dexmedetomidine infusion were compared. After dexmedetomidine infusion, the mean α power peak decreased from 6.09 to 5.43 dB and shifted to a lower frequency, the mean θ bicoherence peak increased from 29.57 to 41.25% and shifted to a lower frequency, and the median α bicoherence peak increased from 41.49 to 46.36% and shifted to a lower frequency. These results demonstrate that dexmedetomidine deepens sevoflurane anesthesia, and enhances α and θ bicoherences while shifting peak values of these bands to lower frequencies through regulating thalamo-cortical reverberation networks probably.
Dexmedetomidine is an active dextral isomer of medetomidine, which plays anti-sympathetic, sedative, and analgesic roles by activating the α2-adrenoceptor. It is commonly used as a sedative and anesthetic adjunct during perioperative period and can reduce postoperative neurological complications under sevoflurane anesthesia (Gerresheim and Schwemmer, 2013; Keating, 2015). In practice, the minimal alveolar concentration (MAC) is often used to evaluate the potency of various inhalational anesthetics, and as an indicator of anesthesia depth (Eger et al., 1965). Several studies have shown that dexmedetomidine can reduce the MAC and requirement of sevoflurane (Gozalo-Marcilla et al., 2013; Patel et al., 2013). However, the electroencephalographic (EEG) mechanism of the effect of dexmedetomidine on sevoflurane anesthesia remains unclear.
Spontaneous EEG activity is a commonly used physiological index reflecting the state of consciousness or depth of anesthesia (Freye and Levy, 2005). A growing body of evidence suggests that anesthetics could induce characteristic oscillations by altering or disrupting information processing and communications in the brain (Chauvette et al., 2011; Purdon et al., 2013; Akeju et al., 2014b). These anesthesia-induced oscillations are different as they act on different targets (Musizza and Ribaric, 2010; Purdon et al., 2015b). Dexmedetomidine primarily acts at presynaptic α2 adrenergic receptors to hyperpolarize locus coeruleus neurons by decreasing norepinephrine release (Nacif-Coelho et al., 1994). The reduced release of norepinephrine can result in loss of inhibitory inputs to the preoptic area of the hypothalamus, loss of excitatory inputs to intralaminar nucleus of the thalamus, cortex and decreased thalamo-cortical connectivity (Brown et al., 2011; Akeju et al., 2014a). Sedation under dexmedetomidine is characterized in EEG by spindles and slow-δ oscillations (Huupponen et al., 2008; Xi et al., 2018). Sevoflurane exerts sedative and anesthetic effects mainly through binding at multiple targets in central nervous system including gamma-aminobutyric acid type A receptors (GABAAR), N-methyl-D-aspartic acid receptors (NMDAR), and so on (Nishikawa, 2004). Akeju et al. (2014b) have found that sevoflurane induces coherent frontal α oscillations and slow-wave oscillations to sustain the unconscious state, indicating that sevoflurane may interfere with thalamo-cortical information processing and fragment cortical activity. In view of this, the combination of dexmedetomidine and sevoflurane may produce synergistic or enhancing effects on sedation levels and EEG performance.
Researches continue to validate that α and δ-θ oscillations in EEG induced by anesthetics are associated with neural network regulation and resonance of the thalamo-cortical and cortico-thalamic axons (Schneider and Kochs, 2007; Ching et al., 2010; Akeju et al., 2014b). Bicoherence analysis is a power-independent bispectral analysis that has been developed to detect cross-frequency phase coupling and examine non-linear regulation of brain electrical activities (Hayashi et al., 2008b). In non-linear reverberating system such as seen between the cortex and thalamus, the output signal from the reverberation circuit is reenter into the system as the input signal, leading to self-regulation characteristics and quadratic phase coupling of a variety of different signal wave components (Hayashi et al., 2008b; Araki et al., 2018). Several studies have indicated that bicoherence can reveal the reverberating components and evaluate the electroencephalographic mechanism of combined use of anesthetics (Hagihira et al., 2002; Morimoto et al., 2006; Araki et al., 2018).
In this study, we analyzed changes in EEG bicoherence resulting from dexmedetomidine infusion, and studied the EEG mechanism underlying the effect of dexmedetomidine on sevoflurane anesthesia. We hypothesized that dexmedetomidine deepens sevoflurane anesthesia, and that it changes the power spectra and bicoherence patterns by regulating thalamo-cortical networks.
Ethical approval for this study (PJ2019-14-17) was provided by the Ethics Committee of the First Affiliated Hospital of Anhui Medical University, Hefei, China (Chairperson Prof. Heng Wang) on November 1, 2019. Written informed consent was obtained from all patients. The trial was registered before patient enrollment at http://www.ChiCTR.org.cn (ChiCTR1900026955).
Patients aged 18–65 years with American Society of Anesthesiologists (ASA) physical status 1 and 2 who underwent non-cranial and non-cardiac surgeries were recruited. Patients with dementia, intellectual disability or other neuropsychiatric disorders, severe bradycardia, histories of cerebrovascular disorders, hearing impairment or other factors lead to communication difficulty and those receiving treatment with α2 agonists or antagonists were excluded. Of the 26 enrolled patients, two cases were excluded because EEG data collection was not completed before surgery commenced in accordance with our protocol, one case was excluded due to poor quality EEG. So, twenty-three patients were included in the final analysis. Figure 1 presents a flow chart of patient selection and exclusion.
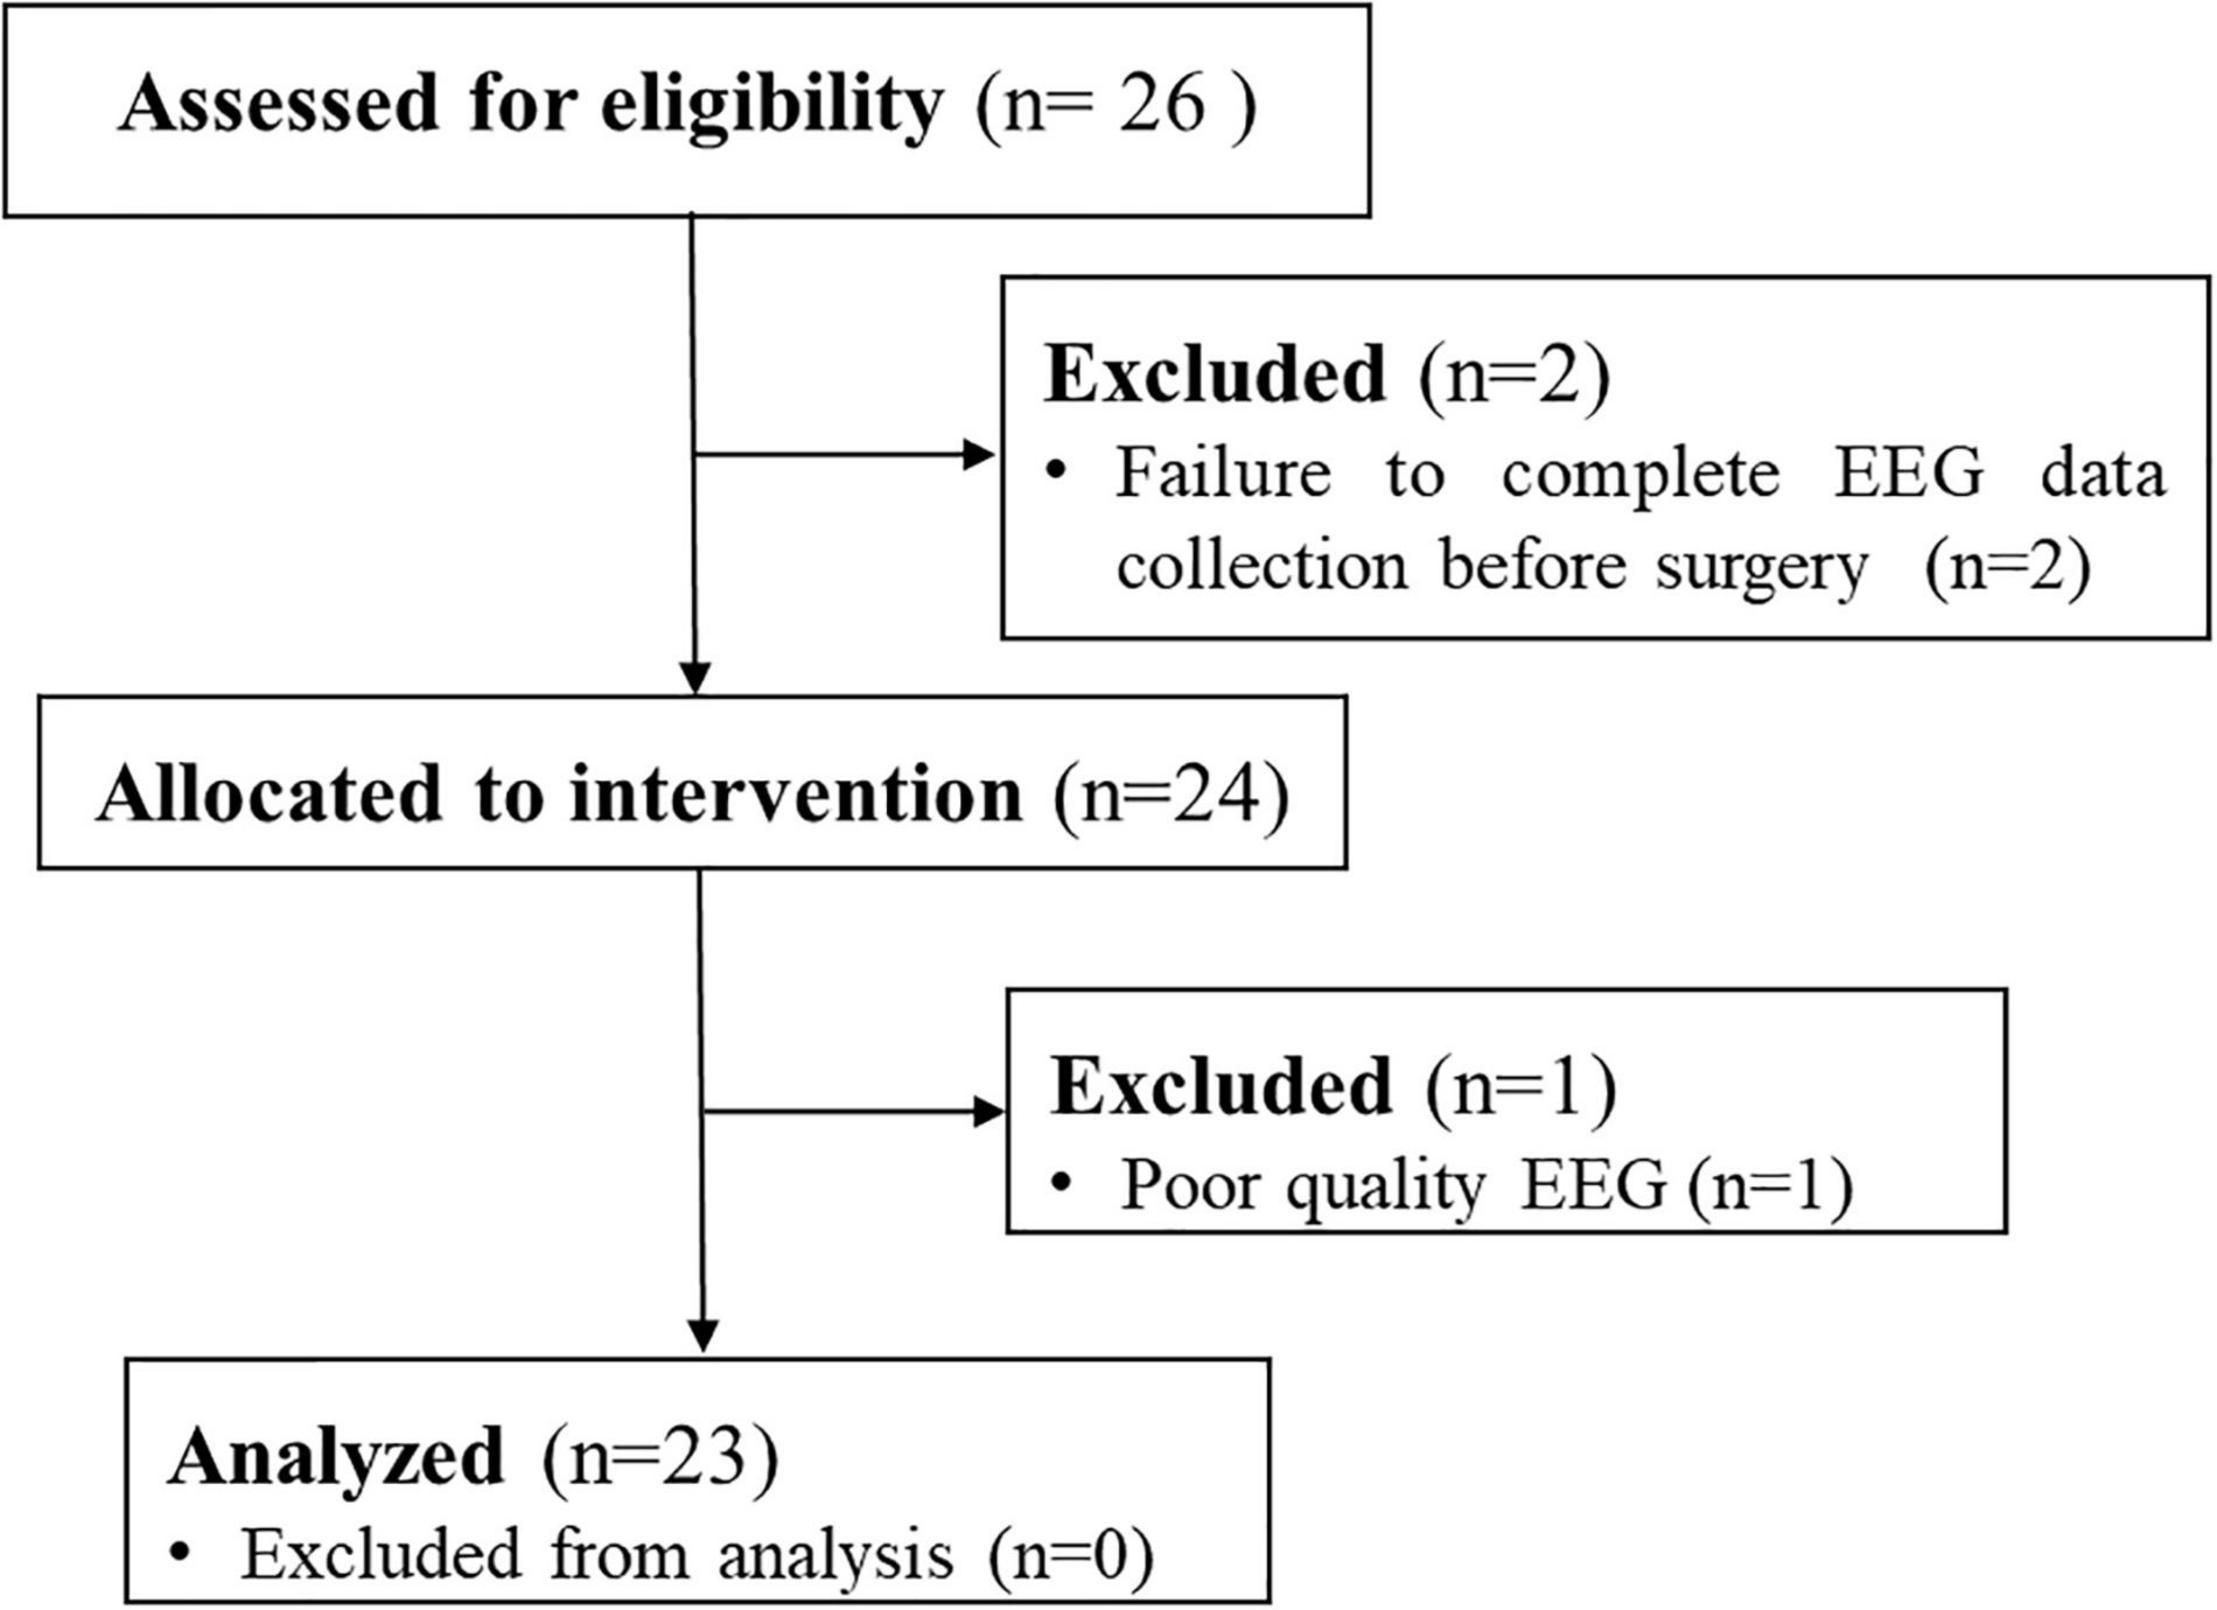
Figure 1. Flow chart of patient selection and exclusion.
Patients fasted for at least 8 h before surgery and were given no preoperative medication. Standard vital signs (i.e., of non-invasive blood pressure, electrocardiogram, end-tidal carbon dioxide, and pulse oxygen saturation) and EEG monitoring were initiated upon patients’ entry into the operating room, and the baseline vital signs were recorded.
Anesthesia was induced with a combination of sevoflurane (6%), sufentanil (0.5 μg/kg), and cisatracurium (0.2 mg/kg). All patients underwent laryngeal mask ventilation, and the sevoflurane concentration was maintained at 0.8 MAC for anesthesia maintenance. After approximately 15 min of stable sevoflurane maintenance (Morimoto et al., 2006), dexmedetomidine (0.8 μg/kg) was administered in a 10 min intravenous infusion. The dose of dexmedetomidine was then changed to 0.5 μg⋅kg–1⋅h–1 for continuous infusion (Harsoor et al., 2014). We maintained intraoperative blood pressure and heart rate fluctuating within 20% of base values. Drugs such as atropine, noradrenaline and ephedrine were used as needed.
Data collection for this study was completed before surgery began. Frontal EEG data were recorded continuously by a SedLine brain function monitor (Masimo Corporation, Irvine, CA, United States) with a sampling rate of 178 Hz and a preamplifier bandwidth of 0.5–89 Hz, using the system’s standard Sedtrace electrode array [six electrodes at approximately Fp1, Fp2, F7, F8, Fpz (ground), and 1 cm above Fpz (reference)]. Electrode impedance for each channel was ≤5 kΩ.
The patient state index (PSI) is a clinically validated measure of monitoring depth of anesthesia and sedation. PSI is a dimensionless number in the range between 100 (fully awake) and 0 (deeply anesthetized) with decreasing values indicating increasing levels of hypnosis (Drover and Ortega, 2006; Buget et al., 2016). The 95% spectral edge frequency (SEF95) is one of the processed EEG measures and the values typically range between 0 and 30 Hz with decreasing values indicating a lower level of responsiveness (Tonner and Bein, 2006). The PSI and SEF95 were recorded every minute.
We applied the linear finite impulse response filter from the EEGLAB toolbox to the raw EEG signals (0.5–50 Hz) (Tort et al., 2008). An experienced investigator visually excluded noise and artifacts. For each subject, we selected two 3-min-long artifact-free EEG segments at 5 min before and 10 min after dexmedetomidine infusion for spectral and bicoherence analysis.
We examined power spectra, defined as quantifications of EEG power at each frequency, and constructed spectrograms, consisting of temporally consecutive power spectra, using the multi-taper method with the Chronux toolbox (Percival and Walden, 1993). The following parameters were used for spectral analysis: window length = 2 s with 0 s overlap, time-bandwidth product = 3, number of tapers = 5 and spectral resolution = 3 Hz. Group-level spectrograms were constructed for the two timepoints by taking the medians across all patients. Group-level spectra and 95% confidence intervals (CIs) were computed by taking median across spectrograms at each timepoint by bootstrap method (Purdon et al., 2015a). Briefly, we resampled spectrogram estimates to obtain replicates and calculated bootstrap group median spectra. We also calculated differences between the group median spectra estimates from the two timepoints for each frequency. The differences were considered significant only when the contiguous frequency bandwidth exceeded the spectral resolution (Akeju et al., 2016). These procedures were repeated 10,000 times, and the percentile method was used to calculate 95% CIs.
Similar to the methods used in previous studies (Hayashi et al., 2008a,b, 2010, 2014; Araki et al., 2018), bicoherence at the two timepoints was examined by calculating all pairs of frequencies from 0.5 to 20 Hz at 0.5-Hz intervals, which were represented as two-dimensional moving averages. Nine points of bicoherence were used to calculate diagonal bicoherence (every 0.5 Hz from 1.5 to 20 Hz). The 3-min-long EEG signals were divided into 360 2-s epochs, with 75% overlap, and the Blackman window function was applied. The following equations were used to calculate bicoherence:
Sum of the absolute triple product
Bispectrum and
Bicoherence ,
Where j is the epoch number, Xj (f1) is a complex value calculated by Fourier transformation of the jth epoch and Xi* (f1+f2) is the conjugate of Xi (f1+f2). A bicoherent spectrum was represented along the diagonals (the same frequency pairs). The group median diagonal bicoherence (f1 = f2) and 95% CIs were calculated using a bootstrap procedure, with medians of bootstrap samples drawn from the full sample of diagonal bicoherence for each subject at each timepoint. MATLAB was used for all bootstrap calculations (Araki et al., 2018). This procedure was repeated 10,000 times, and the percentile method was used to calculate 95% CIs.
The PSI, SEF95, α power and bicoherence peaks, frequencies at those peaks, and the θ bicoherence peak and their frequencies values from electroencephalogram were compared between 5 min before and 10 min after dexmedetomidine infusion under sevoflurane anesthesia. According to the results of Shapiro–Wilk normality tests of the difference between the two timepoints, the Wilcoxon signed-rank test (non-normal parameters) or paired t-test (normal parameters) were used. The GraphPad Prism software version 5.0 was used for the statistical analysis, and the results were expressed as medians (25th and 75th percentiles) or means ± SD, respectively. Mean/median difference and 95% CIs between groups were calculated by the bootstrap method. P < 0.05 was considered to represent statistically significance.
The demographic and clinical characteristics of the 23 patients who participated in this study are presented in Table 1.
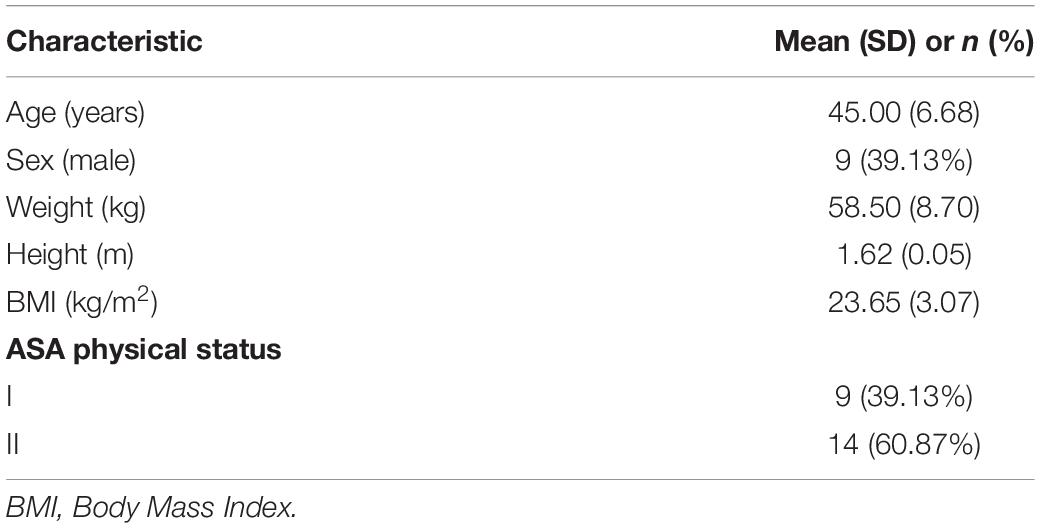
Table 1. Characteristics of patients receiving dexmedetomidine infusions under sevoflurane anesthesia.
Representative time courses of power and bicoherence spectra before and after dexmedetomidine infusion for a 29-year-old man undergoing meniscoplasty under sevoflurane anesthesia are shown in Figure 2. 10 min after dexmedetomidine infusion, EEG activity changed gradually and then achieved the maximum effect; the peak value of θ-band bicoherence increased and moved to a lower frequency, the α-band power peak decreased and moved to a lower frequency, and the bicoherence peak increased and moved to a lower frequency.
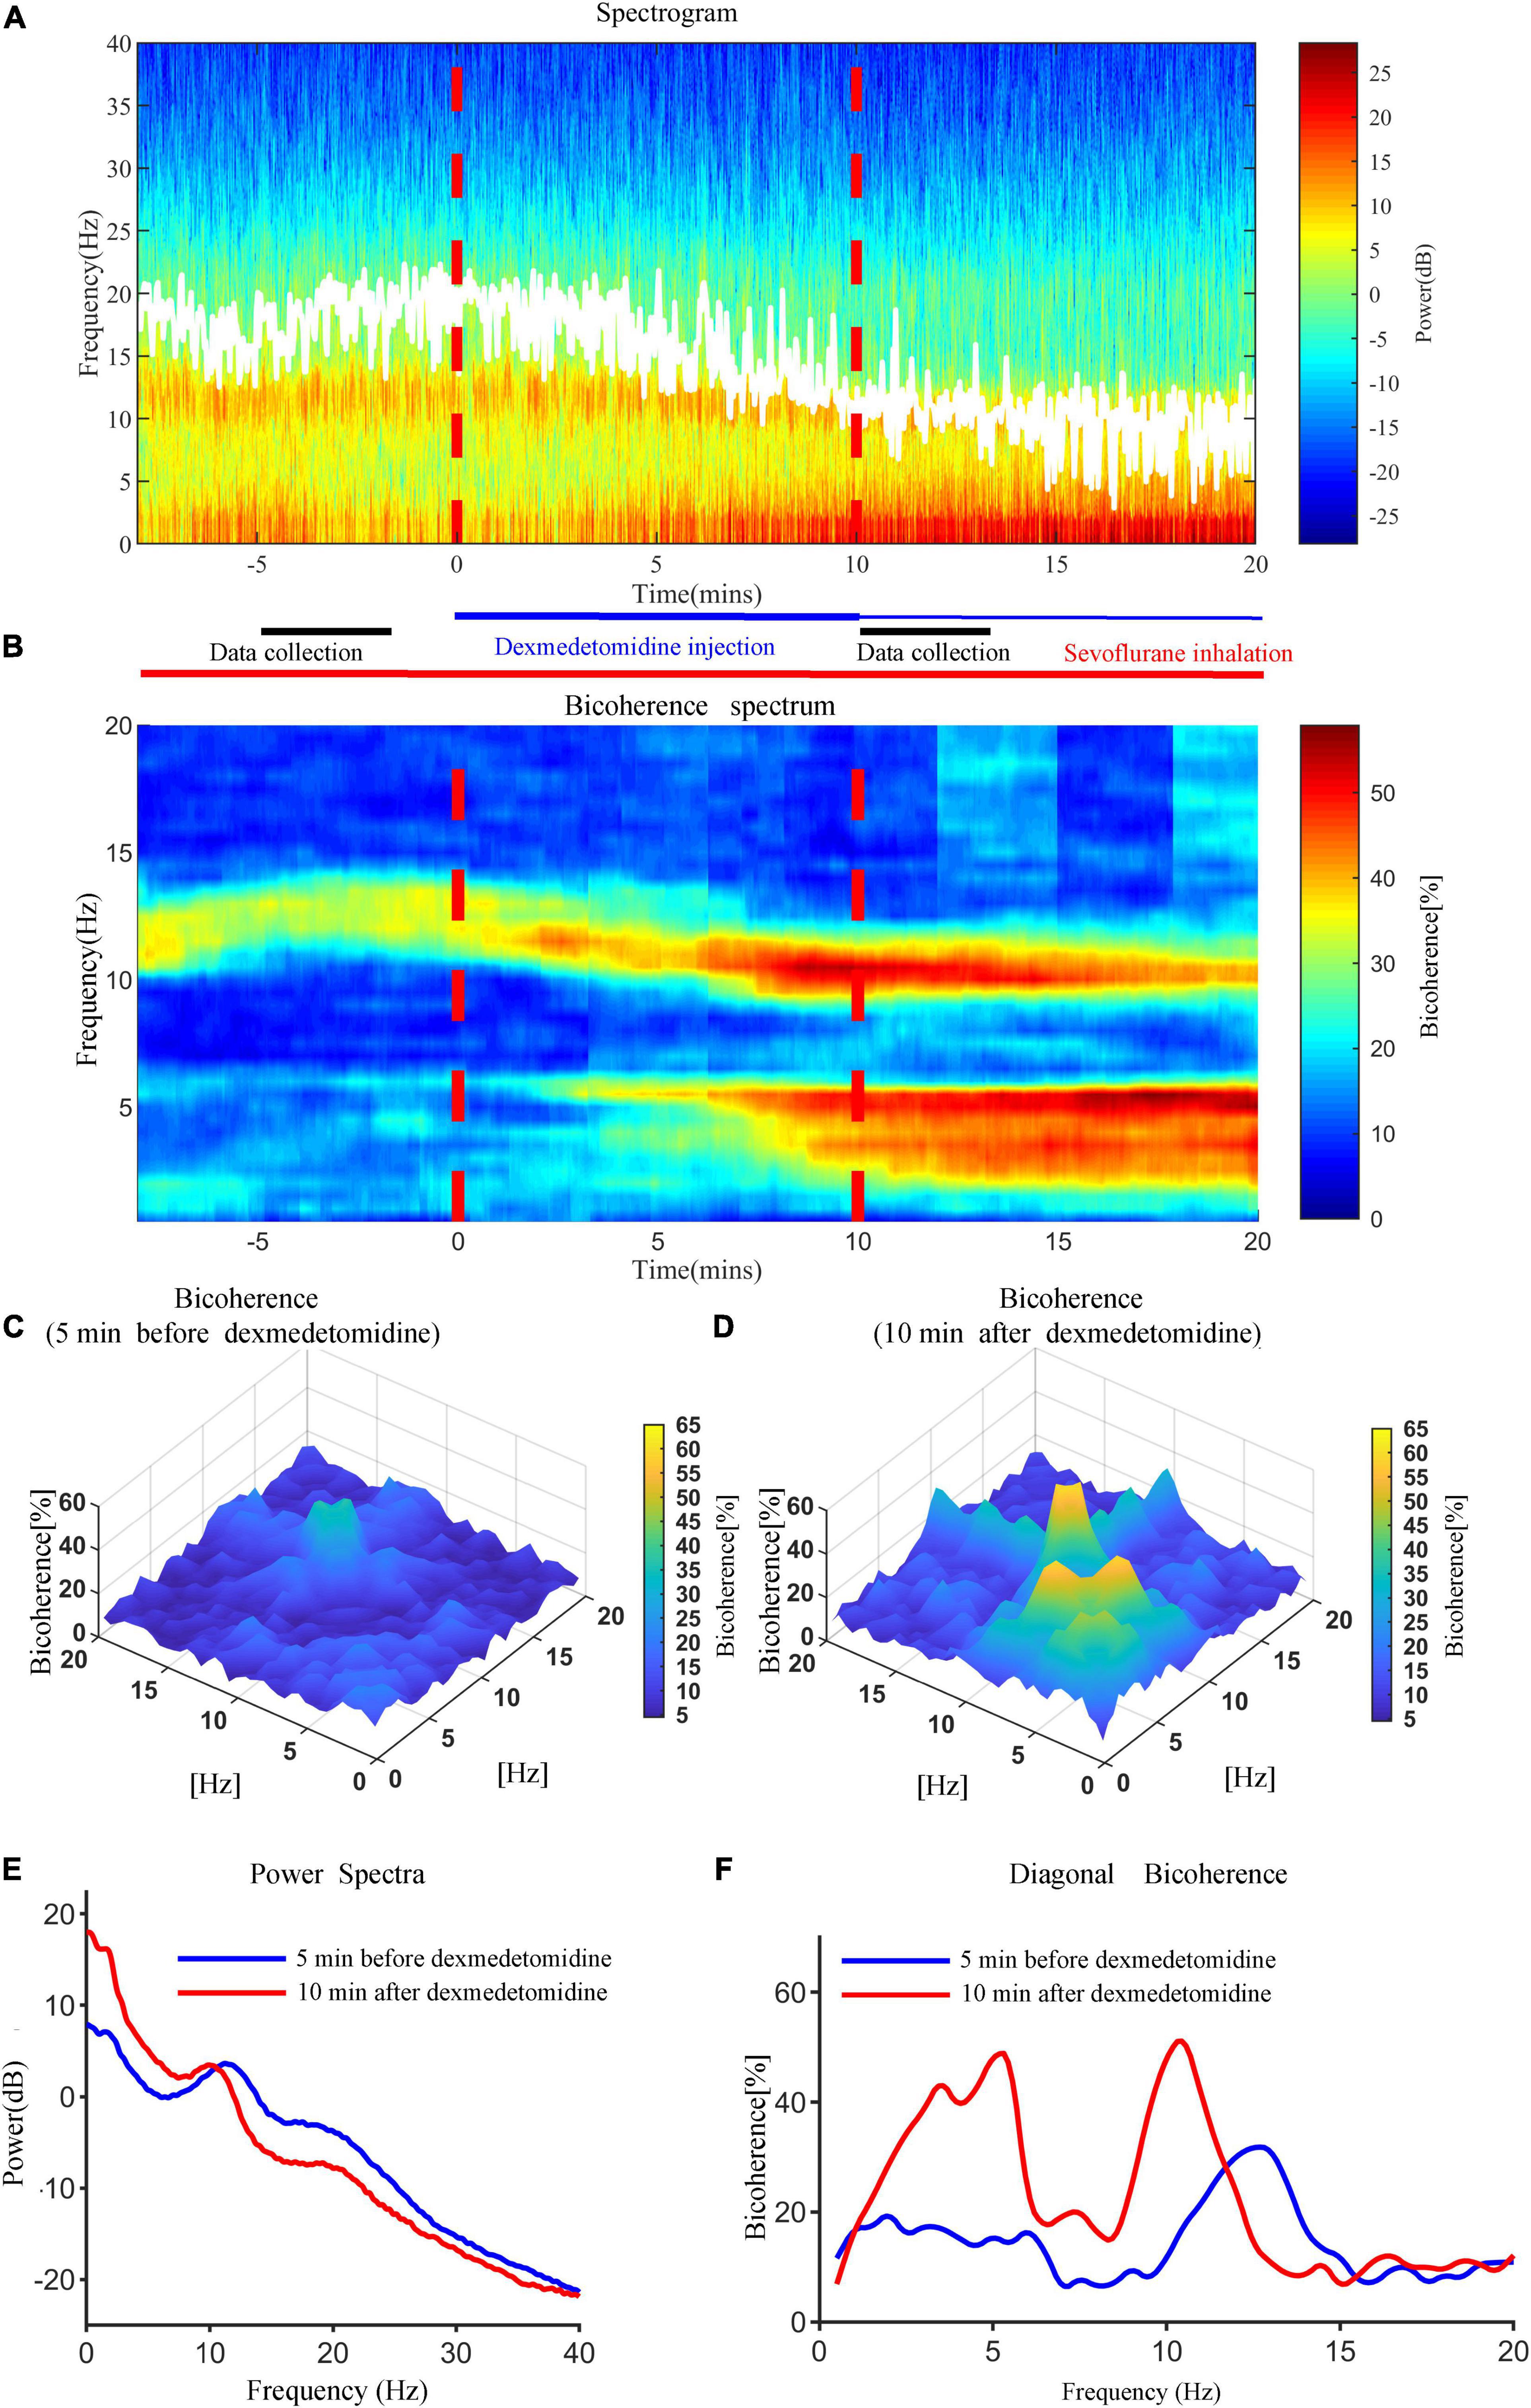
Figure 2. Representative time courses of power and bicoherence spectra 5 min before and 10 min after dexmedetomidine infusion for a 29-year-old man under sevoflurane anesthesia. (A) Time-frequency spectrogram of the frontal cortex during anesthesia. (B) Bicoherence spectrum of the frontal cortex during anesthesia. White solid lines in (A) represent SEF95. (C) Bicoherence spectra 5 min before dexmedetomidine infusion for all pairs of frequencies. (D) Bicoherence spectra 10 min after dexmedetomidine infusion for all pairs of frequencies. (E) Power spectra 5 min before (blue line) and 10 min after (red line) dexmedetomidine infusion. (F) Diagonal bicoherence 5 min before (blue line) and 10 min after (red line) dexmedetomidine infusion.
Compared with baseline (5 min before dexmedetomidine infusion), the SEF95 and PSI decreased after dexmedetomidine infusion [from 16.24 ± 2.54 Hz to 13.22 ± 2.58 Hz (P < 0.0001) and from 30.91 ± 7.98 to 24.30 ± 6.68 (P < 0.001), respectively] (Figure 3).
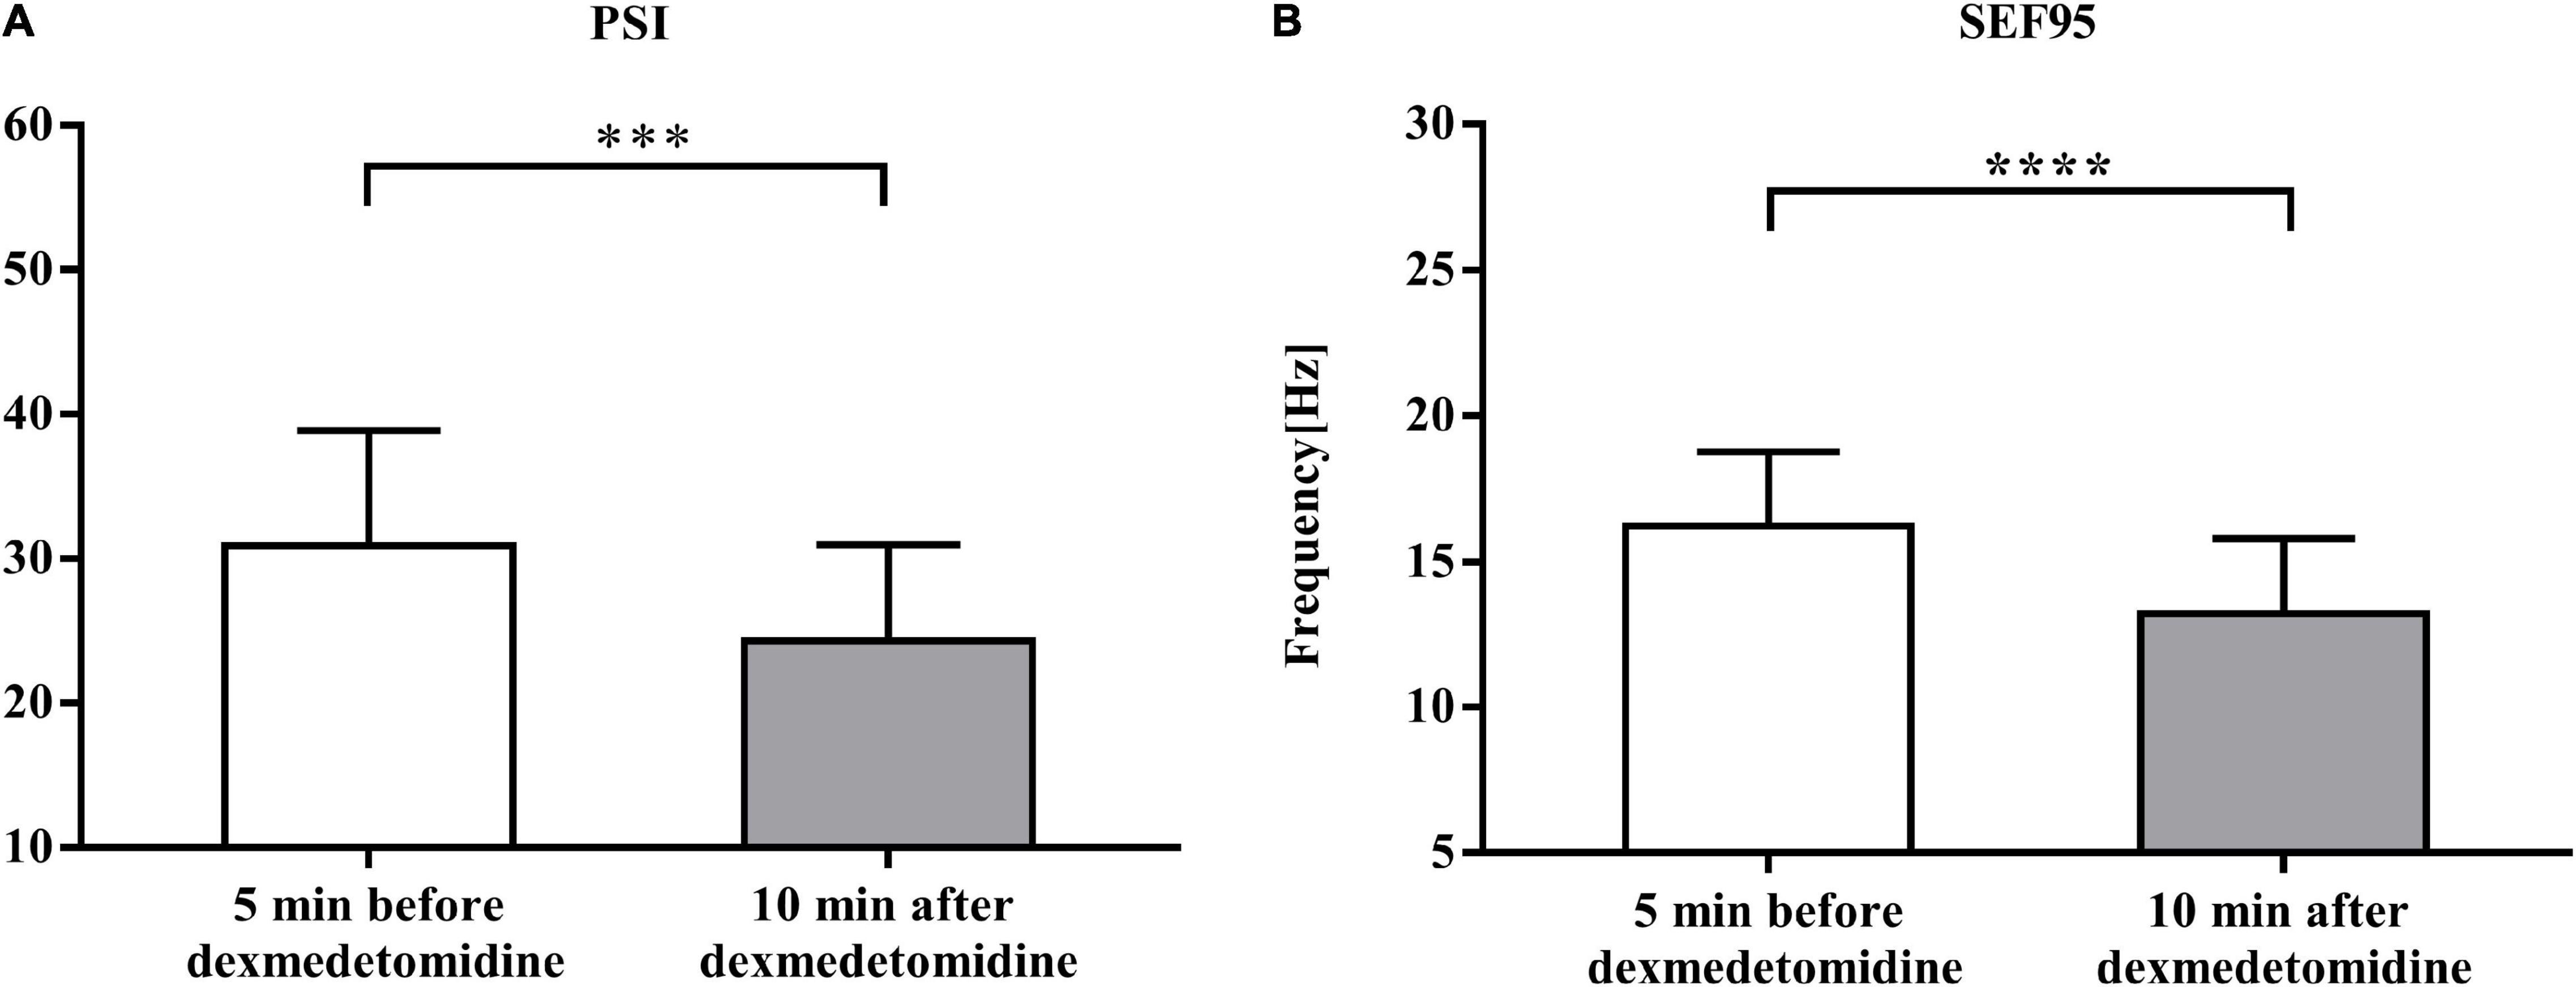
Figure 3. Comparison of EEG monitoring data 5 min before and 10 min after dexmedetomidine infusion. (A) Comparison of values of patient status index (PSI) data 5 min before and 10 min after dexmedetomidine infusion under sevoflurane anesthesia. Data are given as mean ± SD (Paired t-test probability is indicated as: ***P < 0.001; ****P < 0.0001, n = 23). (B) Comparison of values of spectral edge frequency 95 (SEF95) data. Details as in (A).
Group-level spectrograms show that slow-wave power increased after dexmedetomidine infusion (Figures 4A,B). The α power peaks decreased [from 6.09 ± 3.45 dB to 5.43 ± 2.90 dB (P < 0.05); bootstrap mean difference, −0.66 (−2.46 to 1.16) dB] and moved to lower frequencies [from 10.98 ± 0.78 Hz to 9.92 ± 1.00 Hz (P < 0.0001); bootstrap mean difference, −1.06 (−1.56 to −0.56) Hz (Figure 4)]. After dexmedetomidine infusion, the θ-band bicoherence peaks increased and moved to lower frequencies [from 29.57 ± 9.14% to 41.25 ± 8.67% (P < 0.0001), bootstrap mean difference 11.63% (6.42–16.50%) and from 5.50 (5.50, 6.00) Hz to 5.00 (5.00, 5.50) Hz (P < 0.0001), bootstrap median difference –0.5 (–0.5 to 0) Hz (Figures 5A,D,E)]. The same pattern was observed for the α-band bicoherence peaks [from 41.49% (30.68%, 49.08%) to 46.36% (39.89%, 54.21%) (P < 0.001), bootstrap median difference 4.83% (−2.55 to 14.11%) and from 11.00 (10.50, 11.50) Hz to 10.00 (9.50, 11.00) Hz (P < 0.0001), bootstrap median difference –1.00 (–1.50 to 0.00) Hz (Figures 5B,C)].
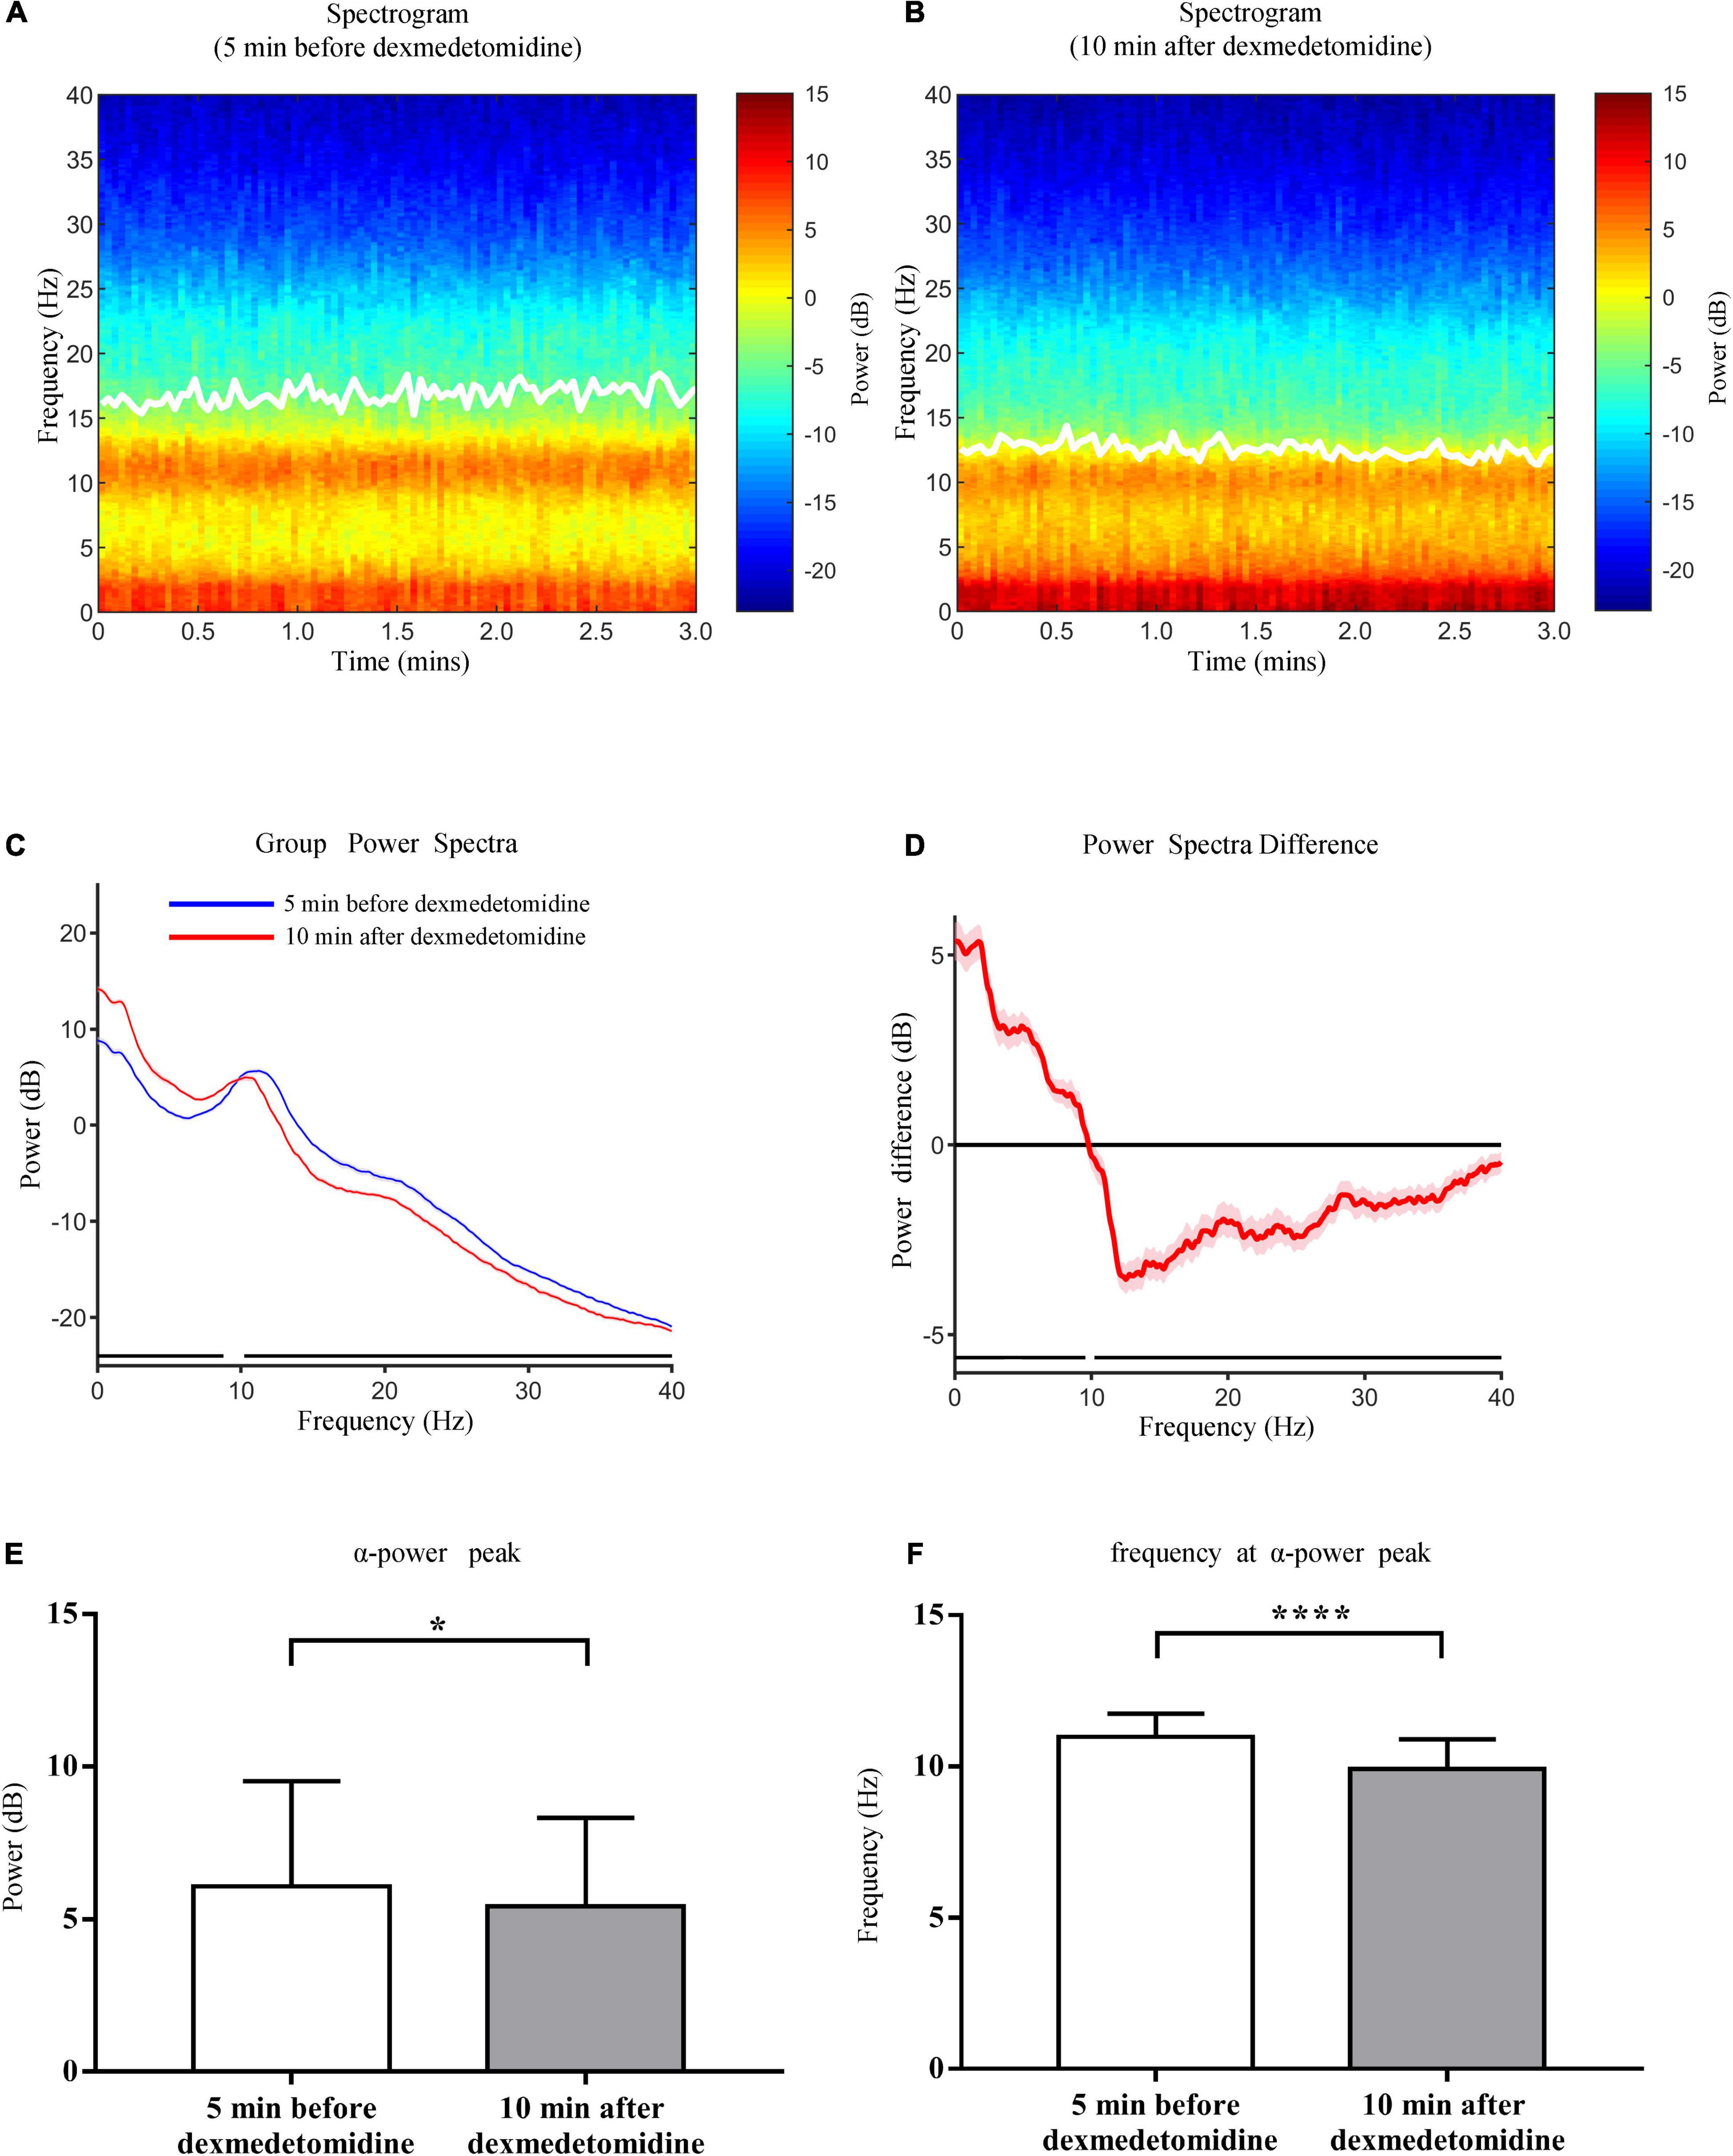
Figure 4. Comparison of group-level power spectral analysis 5 min before and 10 min after dexmedetomidine infusion. (A) Frontal spectrogram of 23 cases 5 min before dexmedetomidine infusion. (B) Frontal spectrogram 10 min after dexmedetomidine infusion. White solid lines in (A,B) represent SEF95. (C) Comparison of group-level power spectra 5 min before (blue line) and 10 min after (red line) dexmedetomidine infusion, shading represents 95% CI range. (D) Median spectral power difference of two periods at each frequency, shading represents 95% CI range. The horizontal black lines in (C,D) represent frequency segments with significant differences across two time periods (0–9.56 Hz and 10.22–40 Hz). (E) Comparison of power of α peaks 5 min before and 10 min after dexmedetomidine infusion. Data are given as mean ± SD (Paired t-test probability is indicated as: *P < 0.05; ****P < 0.0001, n = 23). (F) Comparison of frequencies of α peaks. Details as in (E).
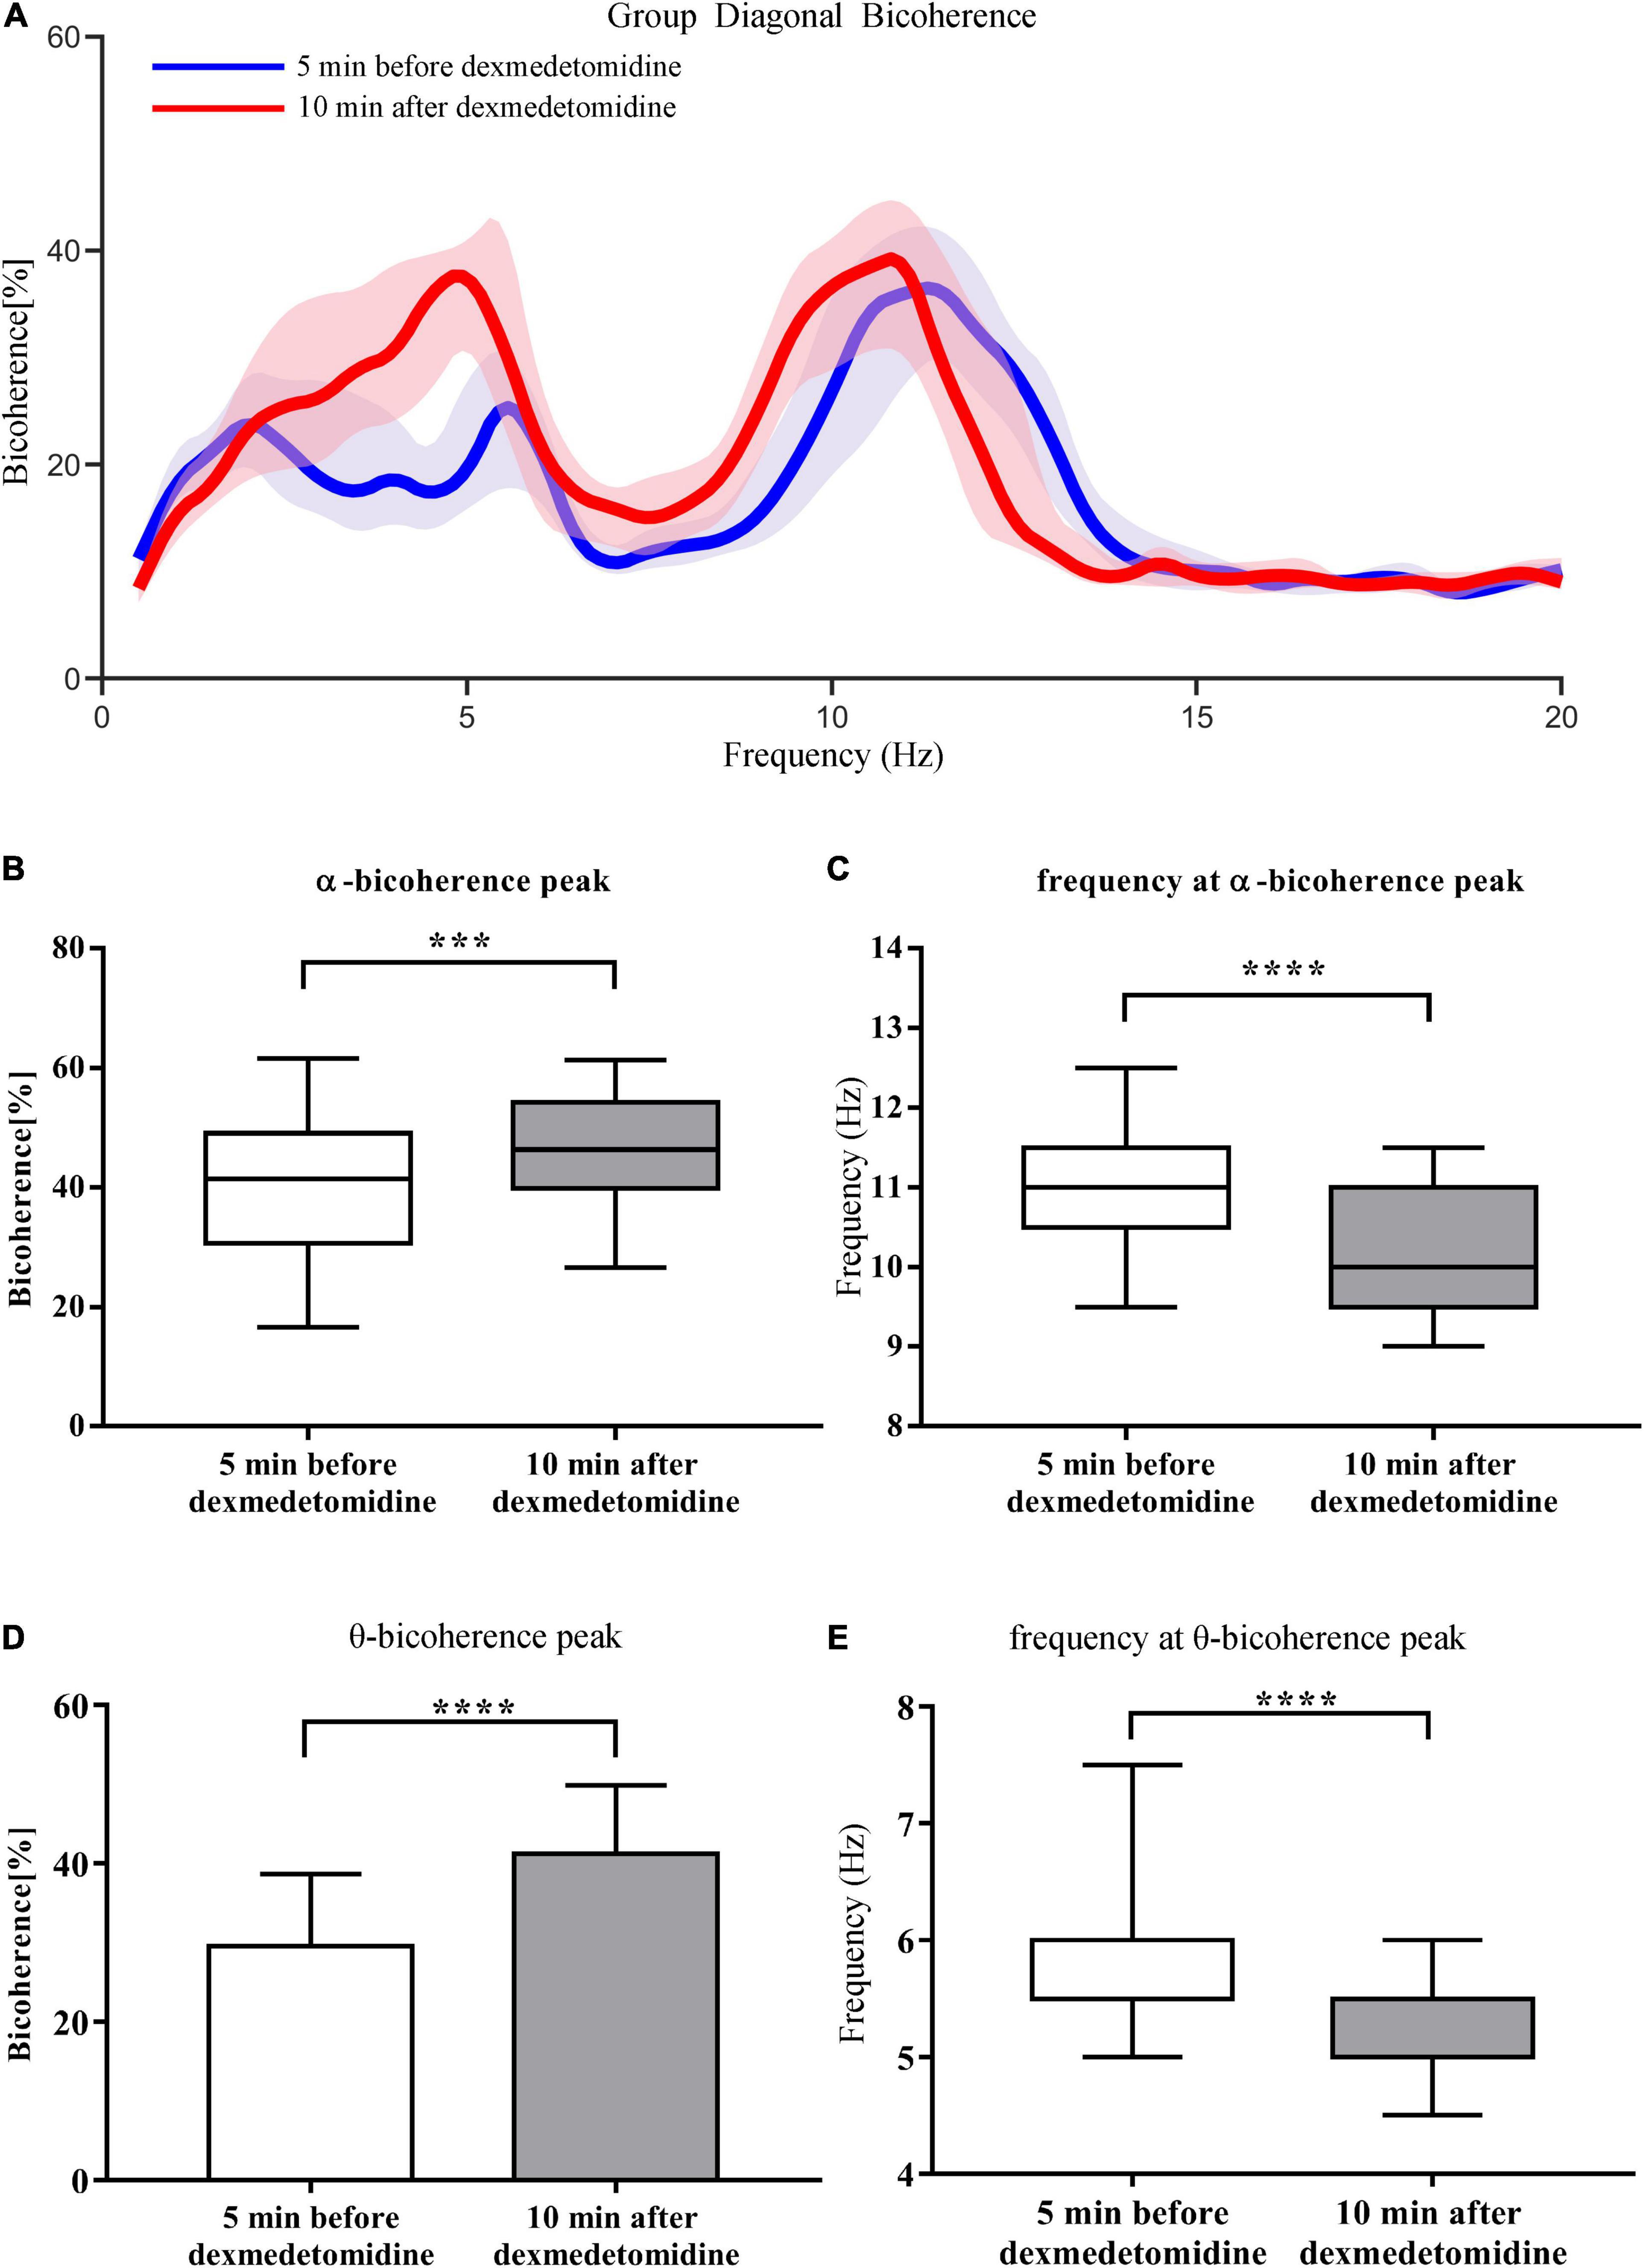
Figure 5. Comparison of group-level diagonal bicoherence analysis 5 min before and 10 min after dexmedetomidine infusion. (A) Comparison of diagonal bicoherence spectra from 23 cases 5 min before (blue line) and 10 min after (red line) dexmedetomidine infusion, shading represents 95% CI range. (B) Comparison of bicoherence of α peaks 5 min before and 10 min after dexmedetomidine infusion. Data are given as box plots (Wilcoxon signed-rank test probability is indicated as: ***P < 0.001; ****P < 0.0001, n = 23). (C) Comparison of frequencies of α bicoherence peaks. Details as in (B). (D) Comparison of bicoherence of θ peaks. Data are given as mean ± SD (Paired t-test probability is indicated as: ****P < 0.0001, n = 23). (E) Comparison of frequencies of θ bicoherence peaks. Details as in (B).
The findings of the present study showed that significant decreases in both PSI and SEF95 values after intravenous dexmedetomidine infusion in patients under sevoflurane anesthesia, indicating dexmedetomidine can induce sevoflurane anesthesia from moderate level (PSI value approximately 31) into a deeper level (PSI value approximately 24). After dexmedetomidine infusion, the α power peak decreased and moved to a lower frequency, and the θ and α bicoherence peaks increased and moved to lower frequencies. Previous studies have found that coherent α and θ oscillations are generally viewed as originating primarily from thalamo-cortical oscillations (Morimoto et al., 2006; Araki et al., 2018). These results indicate that dexmedetomidine augments the effect of sevoflurane anesthesia probably by regulating thalamo-cortical networks.
When dexmedetomidine is administered as a low-dose infusion, the EEG shows a combination of slow-δ oscillations with spindles (Huupponen et al., 2008). As the infusion rate of dexmedetomidine increases, the spindles will disappear and the power of slow-δ oscillations will increase. The spindles induced by dexmedetomidine are thought to be generated by thalamo-cortical loop mechanisms (Brown et al., 2011). The slow-wave oscillations induced by dexmedetomidine probably result from decreased excitatory inputs to the cortex and decreased adrenergically mediated excitatory inputs to the basal forebrain, the intralaminar nucleus of the thalamus and cortex (Brown et al., 2011). Similarly, different sevoflurane concentrations can cause different EEG manifestations. When sevoflurane is administered at sub-MAC concentrations, the EEG shows slow-δ oscillations and coherent α oscillations, as the concentration is increased to MAC levels and above, a strong θ oscillation appears, indicates a more profound state of unconsciousness (Akeju et al., 2014b; Purdon et al., 2015b). The EEG changes induced by sevoflurane indicate decreasing frontal and thalamo-cortical connectivity (Ranft et al., 2016). In the current study, we found that after dexmedetomidine infusion under sub-MAC sevoflurane anesthesia, the α power peaks decreased and moved to lower frequencies, and the slow-wave power increased, suggest that dexmedetomidine enhances sevoflurane anesthesia and may be associated with decreased thalamo-cortical connectivity.
The use of bicoherence analysis, as in this study, enables quantification of the degree of phase coupling between signal components and the elucidation of EEG features that cannot be analyzed using simple power spectra (Sigl and Chamoun, 1994; Hayashi et al., 2008b). The signal processing techniques used in previous studies enable the evaluation only of linear processes, thereby ignoring potential non-linear interactions between signal components (Hayashi et al., 2008a). Bicoherence analysis can track changes in non-linear re-input systems, such as that between the cortex and thalamus (Hayashi et al., 2008b). Researchers have reported that when sevoflurane concentration increase from 1% to 3%, α and δ-θ peak frequencies decrease proportionally, and bicoherence in the δ-θ area increases with deepening anesthesia, indicating the obtained features are consistent with characteristics of the thalamo-cortical reverberating networks (Hayashi et al., 2008b). Consistent with their results, we found that α and θ bicoherence increased and their peak frequencies moved to a lower frequency after dexmedetomidine infusion, suggesting dexmedetomidine deepen sevoflurane anesthesia partly by regulating the thalamo-cortical reverberation networks.
Dexmedetomidine is a highly selective α2-adrenoceptor agonist, which has strong sedative and analgesic effects (Gerresheim and Schwemmer, 2013). α2-adrenoceptors are seven-fold transmembrane receptors belonging to the G-protein–coupled receptor family (Kamibayashi and Maze, 2000). Postsynaptic α2-adrenoceptors exist in many tissues, such as the cerebral cortex and thalamus. Dexmedetomidine activates the Gi protein after interacting with the α2-adrenoceptor (Khan et al., 1999), inhibiting the activity of adenylate cyclase (Afonso and Reis, 2012; Gu et al., 2015; Im et al., 2018). Adenylate cyclase catalyzes the formation of cyclic AMP (cAMP), and cAMP can activate downstream signals as an important second messenger molecule by acting on membrane ion channels. Dexmedetomidine inhibits the voltage-gated sodium channel current by reducing the amount of cAMP, this may be the mechanism by which it deepens sevoflurane anesthesia (Nelson et al., 2001; Gu et al., 2015). The Gi protein also activates potassium ion channels (Khan et al., 1999; Chen et al., 2009), causing cell hyperpolarization, which reduces the activation of excitable cells in the central nervous system, inhibits the discharge of locus neurons (Kamibayashi and Maze, 2000) and inhibits the activity of the norepinephrine pathway. So, dexmedetomidine might regulate the thalamo-cortical reverberation networks through Gi-related mechanisms.
There are several limitations in this study. First, the theoretical analysis of the results is based on our extrapolation of the elucidated electrophysiological knowledge, we did not study the brain nuclei associated with the bicoherence and power spectrum changes, or their possible internal linkages or molecular mechanisms. In future, we could use functional magnetic resonance imaging and animal experiments to identify the specific pathways and networks involved in dexmedetomidine-induced deepening of sevoflurane anesthesia. Second, we only assessed frontal EEG, the bicoherence spectrums may differ between different cortical areas (Hayashi et al., 2014), we will use high-density electroencephalogram to explore a more comprehensive mechanism in the future. Third, we did not examine the effect of different doses of dexmedetomidine on sevoflurane anesthesia, which may have yielded different electroencephalogram and molecular mechanisms.
After dexmedetomidine infusion during sevoflurane anesthesia, the PSI and SEF95 decreased, the α power peak decreased and moved to a lower frequency, and the θ and α bicoherence peaks increased and moved to lower frequencies. These results revealed the EEG mechanisms on dexmedetomidine-induced deepening of sevoflurane anesthesia, which might through regulating thalamo-cortical reverberation networks.
The original contributions presented in the study are included in the article/supplementary material, further inquiries can be directed to the corresponding author/s.
The studies involving human participants were reviewed and approved by the Ethics Committee of the First Affiliated Hospital of Anhui Medical University. The patients/participants provided their written informed consent to participate in this study.
LZ conceived the project, supervised the data analysis, and wrote and revised the manuscript. HL collected the data and wrote the manuscript. LD analyzed the data and wrote the manuscript. KF collected and analyzed the data. YC and CH revised the manuscript. EG and JL designed the project, wrote and revised the manuscript. All authors contributed to the article and approved the submitted version.
The present work was supported by the National Natural Science Foundation of China (NSFC, Grant Numbers: U19A2001 and 81770298), Anhui Provincial Universities Natural Science Foundation (Grant Number: KJ2019A0233), and University Synergy Innovation Program of Anhui Province (Grant Numbers: GXXT-2020-063 and GXXT-2020-025).
The authors declare that the research was conducted in the absence of any commercial or financial relationships that could be construed as a potential conflict of interest.
All claims expressed in this article are solely those of the authors and do not necessarily represent those of their affiliated organizations, or those of the publisher, the editors and the reviewers. Any product that may be evaluated in this article, or claim that may be made by its manufacturer, is not guaranteed or endorsed by the publisher.
Afonso, J., and Reis, F. (2012). Dexmedetomidine: current role in anesthesia and intensive care. Rev. Bras. Anestesiol. 62, 118–133. doi: 10.1016/s0034-7094(12)70110-1
Akeju, O., Westover, M. B., Pavone, K. J., Sampson, A. L., Hartnack, K. E., Brown, E. N., et al. (2014b). Effects of sevoflurane and propofol on frontal electroencephalogram power and coherence. Anesthesiology 121, 990–998. doi: 10.1097/ALN.0000000000000436
Akeju, O., Loggia, M. L., Catana, C., Pavone, K. J., Vazquez, R., Rhee, J., et al. (2014a). Disruption of thalamic functional connectivity is a neural correlate of dexmedetomidine-induced unconsciousness. Elife 3:e04499. doi: 10.7554/eLife.04499
Akeju, O., Song, A. H., Hamilos, A. E., Pavone, K. J., Flores, F. J., Brown, E. N., et al. (2016). Electroencephalogram signatures of ketamine anesthesia-induced unconsciousness. Clin. Neurophysiol. 127, 2414–2422. doi: 10.1016/j.clinph.2016.03.005
Araki, R., Hayashi, K., and Sawa, T. (2018). Dopamine D2-receptor antagonist droperidol deepens sevoflurane anesthesia. Anesthesiology 128, 754–763. doi: 10.1097/aln.0000000000002046
Brown, E. N., Purdon, P. L., and Van Dort, C. J. (2011). General anesthesia and altered states of arousal: a systems neuroscience analysis. Annu. Rev. Neurosci. 34, 601–628. doi: 10.1146/annurev-neuro-060909-153200
Buget, M. I., Atalar, A. C., Edipoglu, I. S., Sungur, Z., Sivrikoz, N., Karadeniz, M., et al. (2016). Patient state index and cerebral blood flow changes during shoulder arthroscopy in beach chair position. Braz. J. Anesthesiol. 66, 470–474. doi: 10.1016/j.bjane.2015.02.002
Chauvette, S., Crochet, S., Volgushev, M., and Timofeev, I. (2011). Properties of slow oscillation during slow-wave sleep and anesthesia in cats. J. Neurosci. 31, 14998–15008. doi: 10.1523/JNEUROSCI.2339-11.2011
Chen, B. S., Peng, H., and Wu, S. N. (2009). Dexmedetomidine, an alpha2-adrenergic agonist, inhibits neuronal delayed-rectifier potassium current and sodium current. Br. J. Anaesth. 103, 244–254. doi: 10.1093/bja/aep107
Ching, S., Cimenser, A., Purdon, P. L., Brown, E. N., and Kopell, N. J. (2010). Thalamocortical model for a propofol-induced alpha-rhythm associated with loss of consciousness. Proc. Natl. Acad. Sci. U.S.A 107, 22665–22670. doi: 10.1073/pnas.1017069108
Drover, D., and Ortega, H. R. (2006). Patient state index. Best Pract. Res. Clin. Anaesthesiol. 20, 121–128. doi: 10.1016/j.bpa.2005.07.008
Eger, E. I. II, Saidman, L. J., and Brandstater, B. (1965). Minimum alveolar anesthetic concentration: a standard of anesthetic potency. Anesthesiology 26, 756–763. doi: 10.1097/00000542-196511000-00010
Freye, E., and Levy, J. V. (2005). Cerebral monitoring in the operating room and the intensive care unit: an introductory for the clinician and a guide for the novice wanting to open a window to the brain. Part I: the electroencephalogram. J. Clin. Monit. Comput. 19, 1–76. doi: 10.1007/s10877-005-0712-z
Gerresheim, G., and Schwemmer, U. (2013). [Dexmedetomidine]. Anaesthesist 62, 661–674. doi: 10.1007/s00101-013-2206-6
Gozalo-Marcilla, M., Hopster, K., Gasthuys, F., Hatz, L., Krajewski, A. E., and Schauvliege, S. (2013). Effects of a constant-rate infusion of dexmedetomidine on the minimal alveolar concentration of sevoflurane in ponies. Equine Vet. J. 45, 204–208. doi: 10.1111/j.2042-3306.2012.00613.x
Gu, X. Y., Liu, B. L., Zang, K. K., Yang, L., Xu, H., Pan, H. L., et al. (2015). Dexmedetomidine inhibits Tetrodotoxin-resistant Nav1.8 sodium channel activity through Gi/o-dependent pathway in rat dorsal root ganglion neurons. Mol. Brain 8:15. doi: 10.1186/s13041-015-0105-2
Hagihira, S., Takashina, M., Mori, T., Mashimo, T., and Yoshiya, I. (2002). Changes of electroencephalographic bicoherence during isoflurane anesthesia combined with epidural anesthesia. Anesthesiology 97, 1409–1415. doi: 10.1097/00000542-200212000-00012
Harsoor, S. S., Rani, D. D., Lathashree, S., Nethra, S. S., and Sudheesh, K. (2014). Effect of intraoperative Dexmedetomidine infusion on sevoflurane requirement and blood glucose levels during entropy-guided general anesthesia. J. Anaesthesiol. Clin. Pharmacol. 30, 25–30. doi: 10.4103/0970-9185.125693
Hayashi, K., Sawa, T., and Matsuura, M. (2008b). Anesthesia depth-dependent features of electroencephalographic bicoherence spectrum during sevoflurane anesthesia. Anesthesiology 108, 841–850. doi: 10.1097/ALN.0b013e31816bbd9b
Hayashi, K., Fujikawa, M., and Sawa, T. (2008a). Hyperventilation-induced hypocapnia changes the pattern of electroencephalographic bicoherence growth during sevoflurane anaesthesia. Br. J. Anaesth. 101, 666–672. doi: 10.1093/bja/aen269
Hayashi, K., Mita, K., and Sawa, T. (2010). Electroencephalographic changes in the late cardiopulmonary bypass period are not reflected in the bispectral index. Clin. Neurophysiol. 121, 1198–1204. doi: 10.1016/j.clinph.2010.03.018
Hayashi, K., Mukai, N., and Sawa, T. (2014). Simultaneous bicoherence analysis of occipital and frontal electroencephalograms in awake and anesthetized subjects. Clin. Neurophysiol. 125, 194–201. doi: 10.1016/j.clinph.2013.06.024
Huupponen, E., Maksimow, A., Lapinlampi, P., Sarkela, M., Saastamoinen, A., Snapir, A., et al. (2008). Electroencephalogram spindle activity during dexmedetomidine sedation and physiological sleep. Acta Anaesthesiol. Scand. 52, 289–294. doi: 10.1111/j.1399-6576.2007.01537.x
Im, S. T., Jo, Y. Y., Han, G., Jo, H. J., Kim, Y. H., and Park, C. K. (2018). Dexmedetomidine inhibits voltage-gated sodium channels via alpha2-adrenoceptors in trigeminal ganglion neurons. Mediators Inflamm. 2018:1782719. doi: 10.1155/2018/1782719
Kamibayashi, T., and Maze, M. (2000). Clinical uses of alpha2 -adrenergic agonists. Anesthesiology 93, 1345–1349. doi: 10.1097/00000542-200011000-00030
Keating, G. M. (2015). Dexmedetomidine: a review of Its use for sedation in the intensive care setting. Drugs 75, 1119–1130. doi: 10.1007/s40265-015-0419-5
Khan, Z. P., Ferguson, C. N., and Jones, R. M. (1999). alpha-2 and imidazoline receptor agonists. their pharmacology and therapeutic role. Anaesthesia 54, 146–165. doi: 10.1046/j.1365-2044.1999.00659.x
Morimoto, Y., Hagihira, S., Yamashita, S., Iida, Y., Matsumoto, M., Tsuruta, S., et al. (2006). Changes in electroencephalographic bicoherence during sevoflurane anesthesia combined with intravenous fentanyl. Anesth. Analg. 103, 641–645. doi: 10.1213/01.ane.0000229699.99371.3c
Musizza, B., and Ribaric, S. (2010). Monitoring the depth of anaesthesia. Sensors (Basel) 10, 10896–10935. doi: 10.3390/s101210896
Nacif-Coelho, C., Correa-Sales, C., Chang, L. L., and Maze, M. (1994). Perturbation of ion channel conductance alters the hypnotic response to the alpha 2-adrenergic agonist dexmedetomidine in the locus coeruleus of the rat. Anesthesiology 81, 1527–1534. doi: 10.1097/00000542-199412000-00029
Nelson, L., You, T., Maze, M., and Franks, N. (2001). Evidence that the mechanism of hypnotic action in dexmedetomidine and muscimol-induced anesthesia converges on the endogenous sleep pathway. Anesthesiology 95:A1368.
Nishikawa, K. (2004). [Volatile anesthetics and synaptic transmission in the central nervous system]. Masui 53, 873–881.
Patel, C. R., Engineer, S. R., Shah, B. J., and Madhu, S. (2013). The effect of dexmedetomidine continuous infusion as an adjuvant to general anesthesia on sevoflurane requirements: a study based on entropy analysis. J. Anaesthesiol. Clin. Pharmacol. 29, 318–322. doi: 10.4103/0970-9185.117066
Percival, D. B., and Walden, A. T. (1993). Spectral Analysis for Physical Applications–Multitaper and Conventional Univariate Techniques. Cambridge: Cambridge University Press.
Purdon, P. L., Sampson, A., Pavone, K. J., and Brown, E. N. (2015b). Clinical electroencephalography for anesthesiologists: part I: background and basic signatures. Anesthesiology 123, 937–960. doi: 10.1097/ALN.0000000000000841
Purdon, P. L., Pavone, K. J., Akeju, O., Smith, A. C., Sampson, A. L., Lee, J., et al. (2015a). The ageing brain: age-dependent changes in the electroencephalogram during propofol and sevoflurane general anaesthesia. Br. J. Anaesth. 115, i46–i57. doi: 10.1093/bja/aev213
Purdon, P. L., Pierce, E. T., Mukamel, E. A., Prerau, M. J., Walsh, J. L., Wong, K. F., et al. (2013). Electroencephalogram signatures of loss and recovery of consciousness from propofol. Proc. Natl. Acad. Sci. U.S.A 110, E1142–E1151. doi: 10.1073/pnas.1221180110
Ranft, A., Golkowski, D., Kiel, T., Riedl, V., Kohl, P., Rohrer, G., et al. (2016). Neural correlates of sevoflurane-induced unconsciousness identified by simultaneous functional magnetic resonance imaging and electroencephalography. Anesthesiology 125, 861–872. doi: 10.1097/ALN.0000000000001322
Schneider, G., and Kochs, E. F. (2007). The search for structures and mechanisms controlling anesthesia-induced unconsciousness. Anesthesiology 107, 195–198. doi: 10.1097/01.anes.0000271869.27956.d1
Sigl, J. C., and Chamoun, N. G. (1994). An introduction to bispectral analysis for the electroencephalogram. J. Clin. Monit. 10, 392–404. doi: 10.1007/bf01618421
Tonner, P. H., and Bein, B. (2006). Classic electroencephalographic parameters: median frequency, spectral edge frequency etc. Best Pract. Res. Clin. Anaesthesiol. 20, 147–159. doi: 10.1016/j.bpa.2005.08.008
Tort, A. B., Kramer, M. A., Thorn, C., Gibson, D. J., Kubota, Y., Graybiel, A. M., et al. (2008). Dynamic cross-frequency couplings of local field potential oscillations in rat striatum and hippocampus during performance of a T-maze task. Proc. Natl. Acad. Sci. U.S.A 105, 20517–20522. doi: 10.1073/pnas.0810524105
Keywords: dexmedetomidine, cognitive function, sevoflurane, electroencephalogram, anesthesia depth
Citation: Zhang L, Li H, Deng L, Fang K, Cao Y, Huang C, Gu E and Li J (2022) Electroencephalogram Mechanism of Dexmedetomidine Deepening Sevoflurane Anesthesia. Front. Neurosci. 16:913042. doi: 10.3389/fnins.2022.913042
Received: 05 April 2022; Accepted: 25 April 2022;
Published: 12 May 2022.
Edited by:
Hongxing Zhang, Xuzhou Medical University, ChinaReviewed by:
He Liu, Zhejiang University School of Medicine, ChinaCopyright © 2022 Zhang, Li, Deng, Fang, Cao, Huang, Gu and Li. This is an open-access article distributed under the terms of the Creative Commons Attribution License (CC BY). The use, distribution or reproduction in other forums is permitted, provided the original author(s) and the copyright owner(s) are credited and that the original publication in this journal is cited, in accordance with accepted academic practice. No use, distribution or reproduction is permitted which does not comply with these terms.
*Correspondence: Erwei Gu, YXlfZ3Vld19tekAxNjMuY29t; Jun Li, bGpAYWhtdS5lZHUuY24=
†These authors have contributed equally to this work
Disclaimer: All claims expressed in this article are solely those of the authors and do not necessarily represent those of their affiliated organizations, or those of the publisher, the editors and the reviewers. Any product that may be evaluated in this article or claim that may be made by its manufacturer is not guaranteed or endorsed by the publisher.
Research integrity at Frontiers
Learn more about the work of our research integrity team to safeguard the quality of each article we publish.