 Jan Muncke
 Ivine Kuruvila
 Ulrich Hoppe
- 1Department of Audiology, ENT-Clinic, University Hospital Erlangen, Erlangen, Germany
- 2WS Audiology, Erlangen, Germany
Objective: Understanding speech in noisy conditions is challenging even for people with mild hearing loss, and intelligibility for an individual person is usually evaluated by using several subjective test methods. In the last few years, a method has been developed to determine a temporal response function (TRF) between speech envelope and simultaneous electroencephalographic (EEG) measurements. By using this TRF it is possible to predict the EEG signal for any speech signal. Recent studies have suggested that the accuracy of this prediction varies with the level of noise added to the speech signal and can predict objectively the individual speech intelligibility. Here we assess the variations of the TRF itself when it is calculated for measurements with different signal-to-noise ratios and apply these variations to predict speech intelligibility.
Methods: For 18 normal hearing subjects the individual threshold of 50% speech intelligibility was determined by using a speech in noise test. Additionally, subjects listened passively to speech material of the speech in noise test at different signal-to-noise ratios close to individual threshold of 50% speech intelligibility while an EEG was recorded. Afterwards the shape of TRFs for each signal-to-noise ratio and subject were compared with the derived intelligibility.
Results: The strongest effect of variations in stimulus signal-to-noise ratio on the TRF shape occurred close to 100 ms after the stimulus presentation, and was located in the left central scalp region. The investigated variations in TRF morphology showed a strong correlation with speech intelligibility, and we were able to predict the individual threshold of 50% speech intelligibility with a mean deviation of less then 1.5 dB.
Conclusion: The intelligibility of speech in noise can be predicted by analyzing the shape of the TRF derived from different stimulus signal-to-noise ratios. Because TRFs are interpretable, in a manner similar to auditory evoked potentials, this method offers new options for clinical diagnostics.
1. Introduction
According to the latest World Health Organization world report on hearing, more than 430 million people suffer from hearing impairment and hearing loss (HL) is the third largest cause of disability during a person's lifetime (World Health Organization, 2021). Even mild HL may lead to communication deficits caused by impaired speech intelligibility, particularly in noisy conditions (Dubno et al., 1984). The primary aims of audiological diagnosis are (1) to identify the underlying pathology for HL, and (2) to quantify the amount of HL and its effects on communication in daily life.
A number of objective audiological tests—such as measurements of acoustic impedance, of otoacoustic emissions, and of auditory evoked responses—are aimed at localizing the source of the deficiency. The determination of the degree of HL is usually carried out by subjective tests, in which the test person has to cooperate actively and to indicate the perception of auditory stimuli. The problem gets worse when we want to quantify the impact of a person's HL on their social life. Most often, this is carried out by using speech tests in quiet and in noise. These tests are usually performed by counting the number of words repeated correctly from certain test lists in a specific acoustic situation. Speech intelligibility measurements, especially in noise, require a high level of vigilance and cooperation. Hence, methods to measure the intelligibility of speech in noise (SiN) without active cooperation by the subjects are highly desirable in clinical audiological diagnosis.
A commonly used objective method for diagnosis is the measurement of auditory evoked potential (AEP) using electroencephalography (EEG). From repeated EEG measurements synchronized with the beginning of the auditory stimuli, as tone-bursts or clicks, specific waveforms can be derived. EEG changes caused by auditory processing can last up to 500 ms after the stimulus onset (Burkard et al., 2007). The AEPs are classified as short (1–10 ms, cochlear), middle (10–50 ms, auditory brainstem), and long (50–300 ms, auditory cortex) latency. Long latency AEP possesses a waveform structure characterized by the peaks P1 (positive, around 50 ms), N1 (negative, around 100 ms), P2 (positive, around 150 ms), and N2 (negative, around 300 ms). Compared with the background EEG, AEPs are considerably smaller, with a signal to noise ratio (SNR) of about -10 dB (Hoppe et al., 2001). Hence, to extract an AEP, the stimulus needs to be presented over several iterations (trials), and the EEG signals should be averaged over these trials (Burkard et al., 2007). In the past few decades it has been shown that short speech stimuli, presented as syllables, can be used for AEP measurements (Burger et al., 2009; Digeser et al., 2009). However, it was observed that the latency of the N1 peak and the P2 peak differs between syllables depending on the stimulus onset time (Sharma and Dorman, 1999), making it difficult to compare or average them. Moreover, presenting the speech stimulus repeatedly over several trials may not be the best choice because of altered speech processing caused by repetition. The analysis becomes more challenging when cortical responses to continuous speech are measured. Contrarily, to short and isolated stimuli, a continuous and time varying stimulus that elicits a lot of concatenated responses, can not be averaged over several trials. Hence, an alternative method to estimate cortical responses to continuous speech would be highly attractive.
Different methods that circumvent the aforementioned constraints in estimating the response to continuous speech by using ridge regression (Machens et al., 2004), boosting (David et al., 2007), or the Bayesian principle (Kuruvila et al., 2020) have been described recently. Roughly, these methods consider speech evoked EEG responses as a linear convolution of the speech envelope and an unknown impulse response plus internal noise. The impulse response function is determined by the auditory system and is referred to as the temporal response function (TRF), or the forward model (Speech → EEG). The method to estimate the TRF used in this paper is a regularized ridge regression based on the least-squares estimation principle (Lalor et al., 2006, 2009). Numerous studies have used the intensity of the stimulus as the acoustic cue to estimate the TRF (Aiken and Picton, 2008; Lalor and Foxe, 2010; Ding and Simon, 2012a; Mesgarani and Chang, 2012), and intensity is represented to a good approximation by the acoustic envelope of the stimulus. Since TRF describes the impulse response, once determined, it can be used to predict the EEG response to any input signal. Conversely, the response function could be estimated in the backward direction (EEG → Speech). The estimated backward model could then be used to reconstruct the stimulus from the EEG, accordingly this method is known as stimulus reconstruction (O'Sullivan et al., 2014). The accuracy of prediction, or reconstruction, can be estimated as the correlation coefficient between the derived and the predicted EEG, or between the original and the reconstructed envelope.
The relationship between recognition of speech in noise and the accuracy of stimulus reconstruction has been the focus of several recent studies (Etard and Reichenbach, 2019; Iotzov and Parra, 2019; Zou et al., 2019). Vanthornhout et al. (2018) investigated stimulus reconstruction accuracy for measurements with different SNRs using EEG measurements from 64 electrodes. They found a strong correlation between speech envelope reconstruction and actual speech envelopes. The method was refined by Lesenfants et al. (2019) using a forward model and the prediction accuracy of selected electrodes. They were able to predict individual's speech recognition thresholds (i.e. the SNR at which 50 % is understood, SRT50) with an accuracy of 1–2 decibels. In all of the studies mentioned, EEG measurements were used for speech in quiet to estimate the TRF, and these TRFs were applied to SiN measurements. Hence, those authors did not take account of possible changes in TRF morphology caused by the noise, even though such changes are well known (Zou et al., 2019; McHaney et al., 2021). Accou et al. (2021) chose a nonlinear approach by using a convolutional model, trained on speech in quiet, to solve a match—mismatch paradigm at different stimulus SNR and predict the SRT50. As the convolutional model can bee seen as a black-box, it is hardly physiologically interpretable.
The aim of this study was to determine the TRFs associated with speech signals in noise, at different SNRs covering the complete transition region of speech intelligibility. The shape of the individual TRFs was used to extract intelligibility relevant parameters as an objective and physiologically interpretable measure of speech intelligibility. By comparing these parameters with individual speech intelligibility scores, we aimed to derive EEG based measures of SiN. Finally, the combination of scalp electrodes and features yielding the highest correlation with changes of SNR were compared with subjective evaluation of speech intelligibility.
2. Materials and Methods
2.1. Participants
Eighteen normal hearing, right-handed German native speakers (6 male / 12 female) with a median age of 31 years (range 20–60 years) were recruited for this study. All subjects reported no history of neurological disorders and underwent an audiological examination including pure tone audiometry and otoscopy before the experiment. Normal hearing was defined as a maximum pure tone threshold of 25 dB HL for all octave frequencies between 0.5 and 4 kHz at the better ear. Additionally, the speech recognition for Freiburg monosyllabic words had to be 100% at a presentation level of 50 dB SPL.
2.2. Test Procedure
Figure 1 displays an overview of the entire test procedure. Measurements were carried out on two different days in order to avoid effects of fatigue. On the first day, otological and audiological assessments were carried out. Thereafter, the behavioral SiN measurements were performed by using the Oldenburg Sentence test (Wagener et al., 1999c). At first, the individual's speech recognition threshold, SRT50 (i.e. the SNR at which 50 % of the speech material can be repeated correctly) was measured by using an adaptive routine (Kollmeier et al., 2015) with constant speech level at 60 dB SPL. Thereafter, the speech recognition rate at each of six different SNRs below and above the individual SRT50 (SRT50 +4 dB, +2 dB, +0.5 dB, –0.5 dB, –2 dB, and –4 dB) was determined by evaluating 20 sentences per condition. The masker noise was played without interruption during every test. According to the psychometric function of Wagener et al. (1999b), recognition rates of 93, 80, 60, 40, 20, and 6% are expected (Wagener et al., 1999c). The different SNR conditions will hereinafter be referred to as ΔSNR. With the aim of comparing theoretical and measured values, the psychometric function of Wagener et al. (1999b), with s indicating the slope, was fitted to the evaluated intelligibility over all subjects by using a non linear least squares approach.
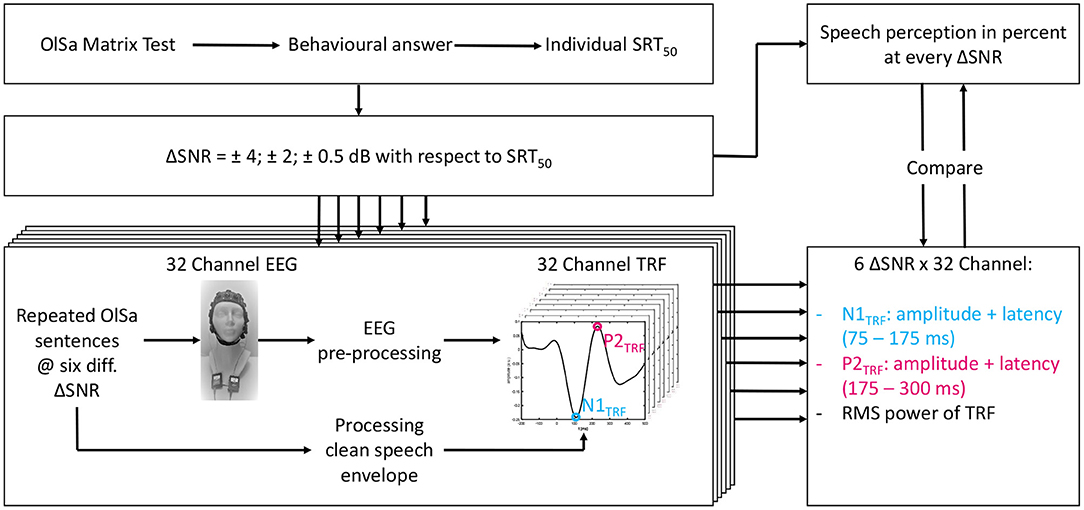
Figure 1. Scheme of the test procedure for each subject. First the individual SRT50 was obtained (upper left). The subsequent tests were all performed under six different ΔSNR conditions (defined below). TRF estimation is shown in the lower left and feature extraction in the lower right corner. Finally, features with highest correlation with speech intelligibility in per cent per ΔSNR condition were compared. All behavioral measurements took place on the first and all objective measurements on the second day.
All stimuli were presented diotically via Etymotec ER-2 insert phones connected to a Fireface UC sound card (RME Haimhausen Germany). The insert phones were calibrated to a speech level of Ls = 60 dB with a 2 cc coupler. EEGs were recorded by using a 32-channel gTec USBAMP device with active electrodes (g.tec, Schiedlberg, Austria) and all the measurements took place in a soundproof and acoustically damped room. Analyses and results presented in this paper were carried out with MATLAB R2019b (MathWorks, Nattick, MA; USA) in combination with the EEGLAB Toolbox (Brunner et al., 2013; Iversen and Makeig, 2019) and SPSS 24 (IBM, New York, NY, USA).
2.2.1. EEG Experiments
EEG measurements were performed on a single day, 1 week later. Subjects listened passively to sentences of the Oldenburg Sentence test (OlSa). For each ΔSNR condition the same 10 sentences of the OlSa content where put in a complete randomized order, with every sentence appearing 15 times. When presenting the sentences, they were concatenated per condition while the masking noise (randomly overlapped sentences of the OlSa content; Wagener et al., 1999a) was played without interruption. The speech level was kept fixed at a level LS = 60 dB SPL in all trials, to avoid effects of stimulus intensity on the derived TRFs (Verschueren et al., 2021). The noise level was adjusted per condition. The mean interval between sentences was 1.4 s (ranging from 0.9 to 1.8 s) and as a result, the duration of the experiment per ΔSNR condition was about 9 min. In order to keep the vigilance constant over the test duration (Vanthornhout et al., 2019) and to reduce eye movement (Kong et al., 2014), subjects were allowed to watch a silent movie. After measurement under each condition short breaks were taken. EEG and stimuli were synchronized to the recording system at the beginning and at the end of each sentence. Electrodes were mounted according to the international 10–20 system: the reference electrode was placed at the right earlobe and ground was placed at the F9 location. EEG was recorded at a sampling rate of 4,800 Hz.
2.3. Data Processing
The quality and reliability of the estimated TRF depends on the upper and lower cut-off frequencies of the bandpass filter applied to the raw EEG-recordings. While some studies reported that the highest correlation between speech intelligibility and analyzed EEG was obtained when a filter in the delta band (1–4 Hz) was used (Ding and Simon, 2014; Etard and Reichenbach, 2019; Iotzov and Parra, 2019), other studies reported the highest correlation when the theta band (4–8 Hz) was used (Lesenfants et al., 2019). However, we found the most highly significant results when we applied a filter including the delta and theta bands, resulting in a frequency band from 1 to 10 Hz. The chosen range includes the mean matrix test syllable rate of 3.8 Hz (Wagener et al., 1999a), which is close to the cut off frequency between delta and theta band.
The EEG-recording was down sampled to 120 Hz. Subsequently the signal was band-pass filtered non causal, zero phase between 1 and 10 Hz by applying a Hamming windowed-sinc FIR filter, order 397. Finally, an independent component analysis was applied to the EEG recordings in order to reduce the influence of eye blinks (Mennes et al., 2010). The envelope of the speech signal was obtained by taking the absolute value of the speech signal followed by power law compression by 0.6 according to Biesmans et al. (2017). Afterwards, the speech signal was down sampled to to 120 Hz to apply the same band-pass filter as had been used for filtering the EEG recordings. The standard functions of the EEGLAB Toolbox (Brunner et al., 2013; Iversen and Makeig, 2019) were used for the preprocessing procedure.
2.4. TRF Using Regularized Linear Regression
For a given input stimulus s and the observed response r(t) at an EEG electrode, the TRF of the system can be approximated by a linear regression model (Lalor et al., 2006, 2009). Mathematically, the predicted response at time t can be expressed as a linear convolution between the input stimulus s and the TRF for the specified time lags τ, such that
The cost function J(t), which is defined as the squared error between the measured response and the predicted response, can be written as
An optimum estimate of the TRF can be obtained by minimizing the cost function J(t) (Kay, 1993). At minima, the gradient of J(t) vanishes and the estimated TRF can be expressed as
The columns of the correlation matrix S are generated from the time-lagged versions of the stimulus envelope s. As a result, the TRF may overfit to fast fluctuations of the specific data set, particularly in noisy conditions (Crosse et al., 2016). Hence, regularization is employed by penalizing the L2 norm of the solution (Lampe and Voss, 2013) in order to smooth the TRF. The regularized solution of (3) is given by
where λ is the regularization parameter and I is the identity matrix.
In our analysis, a single TRF was calculated at every electrode, for each ΔSNR condition and subject. Time lags τ considered to generate the correlation matrix S were chosen from –200 ms to 500 ms in steps of 8,3 ms. Since the regularization parameter λ has an effect on the shape and the amplitude of TRF, it was kept constant (λ = 215) through out the analysis. The λ parameter was optimized iterative in order to maximize Spearman correlation (see Section 2.6). The TRF estimations were performed using the mTRF Toolbox for MATLAB (Crosse et al., 2016).
2.5. TRF Feature Extraction
From the evaluated data, we calculated a total of 192 TRFs for each subject, corresponding to 32 channels and six SNR conditions. Because a TRF can be interpreted similarly to slow AEP (Picton, 2013; Di Liberto et al., 2015; Fiedler et al., 2019; Kuruvila et al., 2021), peaks corresponding to the waves N1 and P2 of AEP can be detected. Here they are designated as N1TRF and P2TRF (see Figure 1). Five features (the absolute amplitude and latency of N1TRF, the amplitude and latency of P2TRF, and a windowed root mean square (RMS) value (Zou et al., 2019) were extracted for each TRF in order to analyze speech intelligibility. N1TRF was determined as the center of the first local minimum in the latency range between 75 and 175 ms, identified by evaluating the first derivative. Similarly P2TRF was identified as the first local maximum in a range from 175 ms to 300 ms. If no N1TRF and P2TRF were detected, latency was set to its maximum value and amplitude was set to zero. The RMS value was calculated as the root mean square of the TRF per EEG channel, after applying a time window to the TRF. The lower (0 to 100 ms) and the upper (108 to 200 ms) limits of the windows were optimized around the prominent N1 peak (Billings et al., 2013; Bidelman and Howell, 2016) for each electrode in order to achieve maximum Spearman correlation with ΔSNR over all subjects (see Section 2.6).
2.6. Statistical Analysis
We expected a lower amplitude and a higher latency of waves N1TRF and P2TRF with decreasing SNR (Mirkovic et al., 2019; Zou et al., 2019). Consequently, we expected smaller RMS values for lower SNRs. To find out which electrodes best fulfilled this expectation (e.g. higher SNR lower latency; higher SNR higher amplitude), the monotonicity was evaluated by calculating Spearman's ρ of ΔSNR and the investigated feature for each subject and electrode. Furthermore, for each electrode the mean over all subjects was determined. In order to test the hypothesis that ΔSNR conditions have the same mean, a Kruskal-Wallis test was performed for each electrode and feature. If the hypothesis was rejected, a Dunn-Bonferroni post-hoc test was performed for a pairwise comparison of ΔSNR conditions.
3. Results
3.1. Behavioral Test
The individual SRT50 for the SiN test was used as the baseline for all tests for each subject. Mean SRT50 was –7.0 dB±0.9 dB (standard deviation), ranging from –4.9 to –8.9 dB. Individual speech intelligibility scores evaluated at the six ΔSNR conditions are shown in Figure 2 together with the sigmoid fit (Wagener et al., 1999b) and the reference psychometric function according to Wagener et al. (1999c). The root mean square error of actual values and the reference function was 6.9%, the largest difference was 29%.
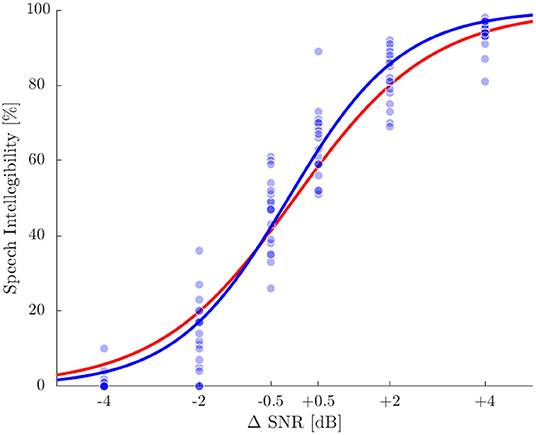
Figure 2. Speech intelligibility in percentage for the six ΔSNR conditions. Blue dots represent single measurements and the blue line displays a sigmoid function fitted to the single values. The red line represents the reference function according to Wagener et al. (1999c).
3.2. TRF Analysis
EEG measurements for six SNR × 32 electrodes × 18 subjects were performed resulting in estimations of 3456 TRFs which were further analyzed. Figure 3 shows the grand average for the TRFs from electrode C3 at ΔSNR from –4 to +4 dB. At the highest SNR a clear negative deflection at about 100 ms is seen followed by a positive deflection at about 200 ms. TRF morphologies and latencies are congruent with those obtained from tone evoked AEP measurements. With decreasing SNR, N1TRF and P2TRF amplitudes decrease while corresponding latencies increase.
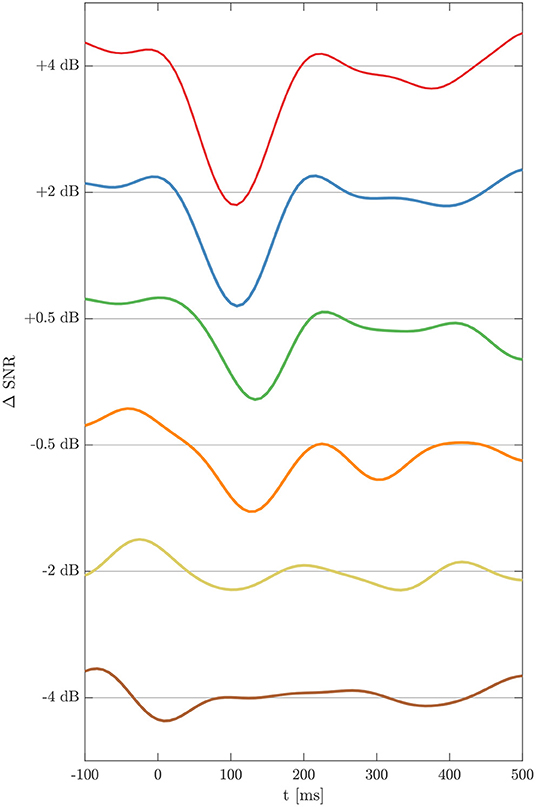
Figure 3. Temporal response functions for the six ΔSNR conditions, calculated as grand average over all subjects for electrode C3. TRFs exhibit peaks N1TRF and P2TRF down to a ΔSNR of –2 dB.
3.2.1. Amplitude and Latency for N1TRF
For each subject and electrode the Spearman correlation as described in Section 2.6 was calculated. The highest correlation for feature N1TRF amplitude was found at electrode C3 (ρ = 0.78; p < 0.001). The distribution of Spearman's ρ is displayed in detail in Figure 4A and shows a slight dominance in the left hemisphere. Amplitude decreased significantly with decreasing SNR for 27 out of 32 electrodes, reaching highest significance on electrode C3 (χ2 = 53.3; p < 0.001). The values of N1TRF amplitude obtained for the electrode with the highest correlation are shown in Figure 4B.
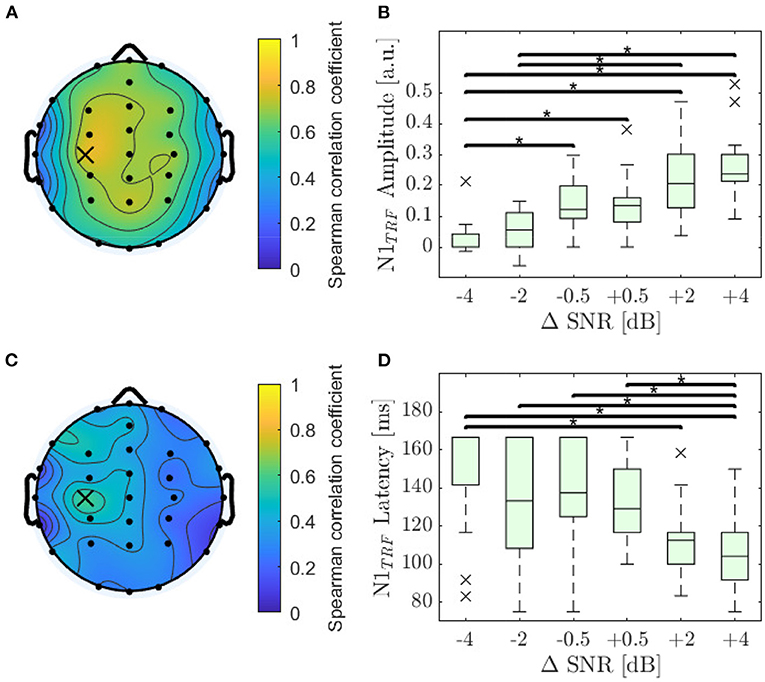
Figure 4. Analysis of the N1TRF. (A) Distribution of the monotonicity for amplitude of the N1TRF evaluated by using Spearman's ρ, reaching its maximum value at electrode C3 (ρ = 0.78; p < 0.001). (B) Amplitude values for N1TRF as a function of ΔSNR at electrode C3. Asterisks denote significant differences evaluated by a Dunn-Bunferroni post-hoc test. (C) Distribution of the absolute monotonicity for the N1TRF latencies evaluated by using Spearman's ρ, reaching its maximum value at electrode C3 (marked with a cross; ρ = 0.48; p < 0.001). (D) Latencies for N1TRF as a function of ΔSNR at electrode C3.
The highest correlation for N1TRF latency was also found on electrode C3 (ρ = –0.59; p < 0.001). The distribution of Spearman's ρ for N1TRF latency, displayed in detail in Figure 4C, shows a slight dominance of the left hemisphere. Latency increased significantly with decreasing SNR for 19 out of 32 electrodes, reaching the highest significance at electrode C3 (χ2 = 32.7; p < 0.001). The values of N1TRF latency obtained for the electrode with the highest correlation are shown in Figure 4D.
3.2.2. Amplitude and Latency for P2TRF
Spearman correlation for P2TRF features reached a medium effect size, with a maximum for amplitude of ρ = 0.35 (p < 0.001) and a maximum for latency of ρ = –0.45 (p < 0.001). For the amplitude feature, the mean of amplitude was found to be the same across different conditions at all electrodes. Findings were the same for the latency feature except for three fronto-temporal electrodes (maximum χ2 = 20.1; p = 0.001). Therefore, detection of P2 seems not to be appropriate for evaluating speech intelligibility.
3.2.3. Windowed RMS-Power
The RMS value of every TRF was calculated by applying a rectangular time window to each TRF that was optimized in order to reach maximum correlation for each electrode. The resulting lower and upper limits of the windows are displayed in Figures 5A,B. The highest Spearman correlation for feature RMS was found at electrode CP3 (ρ = 0.81; p < 0.001). The distribution of Spearman's ρ is displayed in Figure 5C, showing a slight dominance of the left hemisphere. The RMS value decreased significantly with decreasing SNR for 30 out of 32 electrodes, reaching highest significance at electrode CPz (χ2 = 60.7; p < 0.001) for a window from 83 to 133 ms, followed by electrodes CP3 (92 ms to 125 ms), and C3 (83–125 ms). It can be observed that the highest Spearman's ρ are related to narrow windows around the N1 peak.
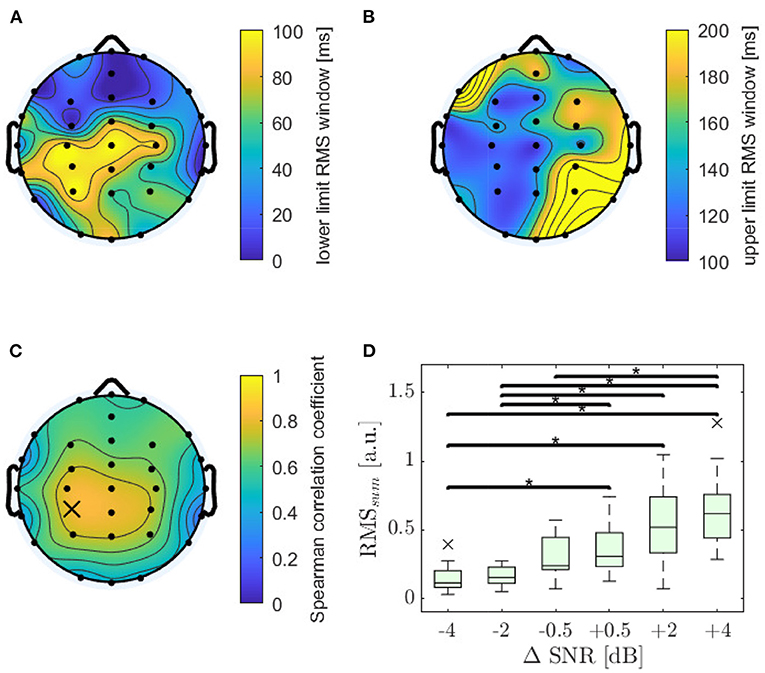
Figure 5. Analysis of wave RMS-power. (A) Optimal lower limits of the time window. (B) Optimal upper limits of the time window. (C) Distribution of monotonicity for windowed RMS-power, with an optimized window for each channel, evaluated using Spearman's ρ, which reached its maximum value at electrode CP3 (marked with a cross; ρ = 0.81; p < 0.001). (D) RMSsum values as sum of RMS values for electrode C3, CP3, and CPz for six ΔSNR and 18 subjects. Asterisks show significant differences evaluated by a Dunn-Bonferroni post-hoc test, all with a strong effect.
For further investigations the RMS values for the three electrodes CPz, CP3, and C3 were summed up to give RMSsum. RMSsum achieved a strong Spearman correlation (ρ = 0.82; p < 0.001) and increased significantly with increasing SNR (χ2 = 60.0; p < 0.001). Detailed results of RMSsum displayed in Figure 5D show increasing variance with increasing SNR.
3.2.4. Features vs. Speech Intelligibility
A high Spearman correlation and a good ability to discriminate between the six ΔSNR conditions were achieved by the RMSsum feature. The optimum time windows of the three electrodes for evaluating RMSsum cover a narrow region close around the prominent N1TRF peak. Finally, the simple RMSsum feature was chosen as the single feature to be compared with speech intelligibility.
To estimate individual SRT50 a psychometric function was fitted to the speech intelligibility evaluated at the different ΔSNRs. In the same way, to obtain the threshold related to an intelligibility of 50% (RMS50), we fitted the exponential function , with b being the optimized parameter, by using a non-linear least squares approach. The resulting function starts from zero % for a RMSsum of zero and converges to 100% for higher values. When using the RMSsum data of all subjects to fit the function, the RMS50 thus determined was 0.287 (Figure 6) and b was 2.415 with a 95% confidence interval from 2.03 to 2.799.
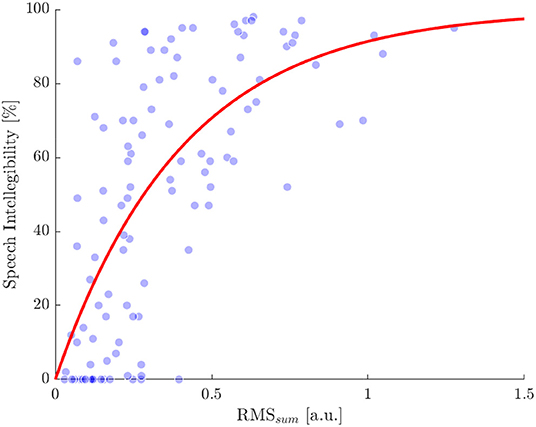
Figure 6. Comparison of speech intelligibility and the RMSsum obtained for each ΔSNR condition and subject. Single values are indicated by blue dots. The red line shows a exponential function fitted to the single values. Root mean square error of the dots compared with the fitted curve is 25% and the RMSsum value related to an intelligibility of 50% is 0.287.
In order to prevent from over fitting, a leave one out method was applied to predict the individual SRT50 per subject. This was done by calculating the RMS50, without considering the RMSsum data of the investigated subject. Subsequently, the value of ΔSNR at which RMSsum exceeds the threshold RMS50 for the first time with increasing SNR and increasing RMSsum, indicates the predicted SRT50.
Individual speech intelligibility and RMSsum are compared with respect to ΔSNR in Figure 7, showing a strong correlation (Spearman's ρ = 0.71; p < 0.001). The mean deviation between predicted and behavioral SRT50 was 1.2 dB in a range from –1.8 dB to +3.1 dB.
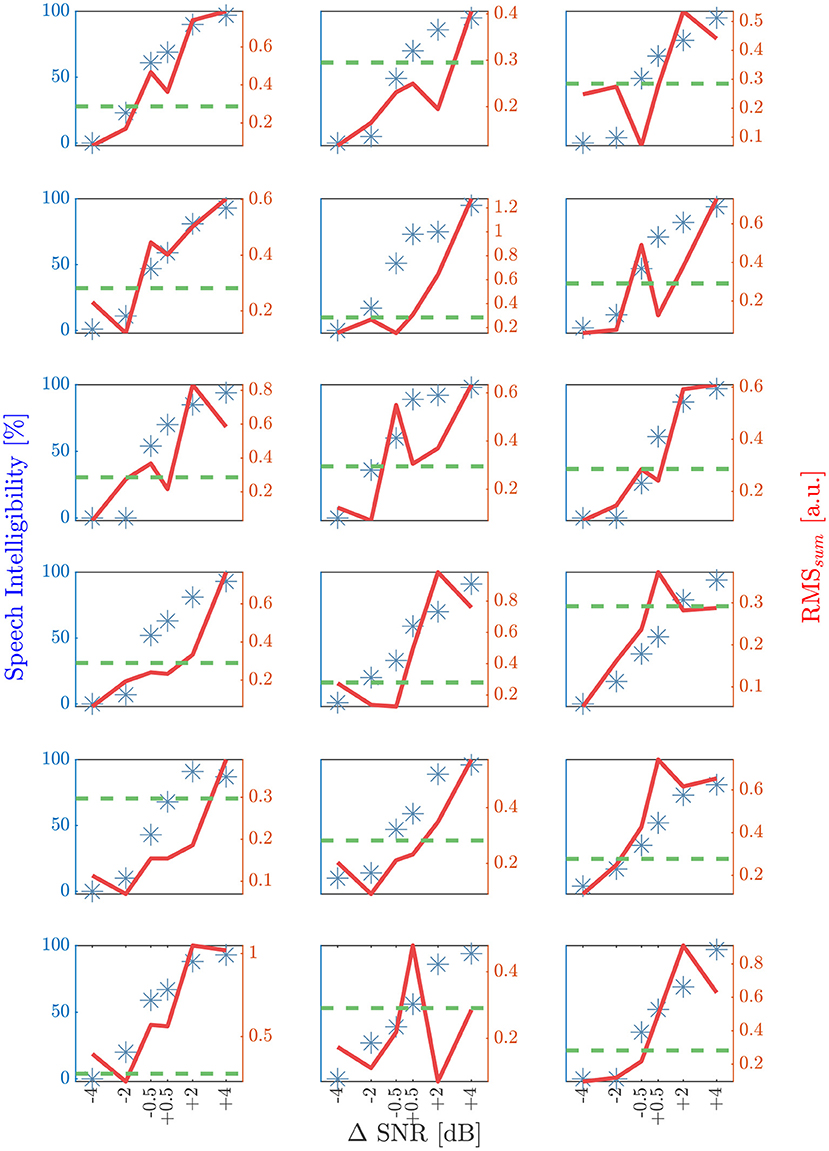
Figure 7. Results of the speech intelligibility and RMSsum (ρ = 0.71; p > 0.001) for the six different ΔSNR conditions for each subject. A ΔSNR of zero dB corresponds to the behavioral SRT50. Blue stars are indicating the speech intelligibility in percentage and the red solid line shows the corresponding RMSsum value. Green dashed horizontal line is representing the RMS50, determined by using a leave one out method per subject. The first intersection point with increasing RMSsum and increasing SNR is located in a range of ±1 dB for seven and ±2 dB with respect to behavioral SRT50 for 16 out of 18 subjects.
4. Discussion
Reduced understanding of speech in noise is one of the first symptoms of hearing loss. All available tests to evaluate the intelligibility for an individual person are subjective tests that require subjects to repeat the words that they understood. First attempts to evaluate the SRT50 of a SiN test using EEG techniques was recently undertaken by Vanthornhout et al. (2018) and Lesenfants et al. (2019). In one procedure the reconstruction accuracy, and in the other procedure the prediction accuracy was chosen as predictor for SRT50. Regrettably, the authors of both studies used prediction or reconstruction accuracy to indicate intelligibility, without taking a closer look at changes in TRF morphology. Our results presented here show that changes in the TRF obtained at different SNRs can be used as a feature to predict individual SRT50 values for an SiN test. Because a TRF shows a waveform similar to an AEP (Ding and Simon, 2012b; Picton, 2013; Di Liberto et al., 2015; Fiedler et al., 2019), TRF morphology can be regarded as more amenable to physiological interpretation for clinical diagnostics than reconstruction or prediction accuracy. In order to find the features of TRF that are most strongly correlated with speech intelligibility we analyzed five features of TRF (N1TRF amplitude, N1TRF latency, P2TRF amplitude, P2TRF latency and RMSsum) evaluated for 18 subjects at six SNR values close to the respective individual SRT50.
The largest Spearman correlation with changes in SNR was found for the RMSsum feature, using optimum windows, i.e., in the range from 82 to 133 ms. This range covers the latency of N1TRF, and N1TRF amplitude also revealed a high Spearman correlation. In contrast, P2TRF features showed only weak correlations with changes in SNR. Our findings correspond to those described in Billings et al. (2013) and Bidelman and Howell (2016), the authors of which investigated AEP evoked by syllables at different SNRs. The authors of both publications found the best correlation with speech intelligibility for the amplitude of wave N1, and the RMSsum feature was finally used for comparison with speech intelligibility in our study.
We found the highest amplitudes for N1TRF and RMSsum in the central and fronto central scalp region, corresponding to the N1 wave of an AEP measurement that is known to be evoked in the planum temporale and Heschl's gyrus (Woods, 1995; Picton et al., 1999). Highest reconstruction accuracy is also often found in this scalp region (Etard and Reichenbach, 2019; Zou et al., 2019). Electrodes in the central and the fronto-central region have also been used by Lesenfants et al. (2019) to predict speech intelligibility. In contrast to those authors findings, the electrodes found in our study to be best suited for prediction of speech intelligibility were located in the central and the left-central scalp area (CPz, C3, and CP3). The distribution of monotonicity shows that the region crucial for speech intelligibility is concentrated slightly more in a posterior orientation with dominance of the left hemisphere. Our results correspond to the findings of other authors (Leff et al., 2008; Abrams et al., 2013) that the posterior superior temporal sulcus has a strong influence on processing speech intelligibility.
Even in a passive listening task the focal attention of the subject could vary with the perceived stimulus quality (e.g. SNR). The focal attention could affect the quality and amplitude of the derived TRF and probably has an effect on this study (Lesenfants and Francart, 2020). Speech in noise measurements for native and non-native speakers has been investigated by Etard and Reichenbach (2019) and by Zou et al. (2019). Those authors described similar behavior for both groups tested for reconstruction accuracy and power of a TRF by using the EEG theta band. Additionally, differences have been described between the groups only in the low-frequency EEG delta band (Etard and Reichenbach, 2019). We used a combination of both frequency bands and thus presumably included both effects. The correspondence of the location of best electrodes with earlier findings (Leff et al., 2008; Abrams et al., 2013) indicates a connection with speech intelligibility, whereas the presentation of the silent movie may have reduced slightly the subjects active listening and comprehension (Vanthornhout et al., 2019). On the contrary to repeating the same stimulus (Billings et al., 2013), we presented 10 different sentences in a random order and there was no a priori knowledge about the next sentence. Hence, listening to every sentence 15 times should have no effect due to the complete random order.
The theory of a network of speech comprehension (Leff et al., 2008; Abrams et al., 2013) and phonetic detection (Zatorre et al., 1992) located in different cortical areas and initialized at the posterior and anterior superior temporal sulcus corresponds to the electrodes used for RMSsum. It seems possible that our findings relate primarily to investigation of the auditory pathway to a certain stage depending on electrode localization. Not all cognitive requirements for a complete understanding of speech can be investigated by these measurements (Decruy et al., 2020a; Devaraju et al., 2021). Additionally, the chosen stimuli aim to imitate a matrix sentence test, resulting in periods between the single sentences, which only contain noise. Consequently, the sentence onset responses may have a slightly larger effect on the N1TRF amplitude than the continuous speech (Brodbeck et al., 2018), suppressed with a higher noise level. Further investigations will be required to elucidate which stage of auditory processing is being examined here. This will be a prerequisite for using this method for differential diagnostics.
We achieved an RMSsum level that was comparable across all subjects with increasing standard deviation for increasing SNR. The constancy of the TRF amplitude was supported by using active electrodes, which are less prone to quality of connection (Laszlo et al., 2014) and by applying a least squares approach with a constant regularization (Lalor et al., 2009; Power et al., 2012). Due to these facts the threshold for RMSsum value in relation to speech intelligibility (RMS50) was evaluated. The intersection point of RMS50 and RMSsum for individual subjects is in a range of ± 1 dB for 7 and ± 2 dB for 16 out of 18 subjects. Our results compare well with the prediction made in Lesenfants et al. (2019), even though the earlier study was based on a relatively technical approach while our results are more physiologically based. It seems possible to examine the physiological requirements for speech intelligibility in noise within a range of ± 2 dB using features extracted from TRF at different SNR values. Part of the variance can be explained by behavioral test-retest deviation (Wagener and Brand, 2005) and by the spread of behavioral speech intelligibility at fixed ΔSNR.
Many subjects reported that they got tired during the experiment. It would approve the practicability of the procedure if the time required could be reduced, maybe by increasing the steps between SNR conditions. Additionally, a reduction in the time required could reduce the influence of focal attention on the derived TRFs (Lesenfants and Francart, 2020). The procedure and the RMS50 value will have to be verified with younger and with hearing-impaired subjects, because the reconstruction accuracy is known to increase with hearing impairment (Decruy et al., 2020b), and AEPs are known to mature with age for children (Kummer et al., 2007).
5. Conclusion
We have shown that single features of the shape of TRFs are highly correlated with intelligibility for speech in noise. The detection of a RMSsum level in the area of N1TRF allowed at least approximate prediction of individual SRT50 values. Because TRFs are interpretable in a manner similar to AEPs, the method developed may offer new options for clinical diagnostics of difficulties during speech understanding in noise. With the aim of closer localizing the source of the deficit, it can be combined with other audiometric diagnostics starting from pure tone audiometry up to short and middle latency AEP which are related to the cochlear and the auditory brainstem. Additionally it can be possible to test subjects who may be less cooperative. It will be necessary to investigate to which stage of auditory processing the requirements for speech comprehension are examined and the method should be improved by fine tuning to make shorter trials possible. Additionally, further research should focus on testing the procedure with hearing-impaired and with younger subjects.
Data Availability Statement
The raw data supporting the conclusions of this article will be made available by the authors, without undue reservation.
Ethics Statement
The studies involving human participants were reviewed and approved by Ethics Committee at the University of Erlangen-Nuremberg (Ref. No. 449 18B). The patients/participants provided their written informed consent to participate in this study.
Author Contributions
JM: conceived and designed the research, carried out the experiment, and performed the analysis. IK: verified the analytical methods. UH: conceived and designed the research and supervised the project. All authors discussed the results, contributed to the final article, and approved the submitted version.
Funding
This work was funded by the Deutsche Forschungsgemeinschaft (DFG, German Research Foundation)—419293003—HO 2177/6.
Conflict of Interest
IK was employed by the company WS Audiology.
The remaining authors declare that the research was conducted in the absence of any commercial or financial relationships that could be construed as a potential conflict of interest.
Publisher's Note
All claims expressed in this article are solely those of the authors and do not necessarily represent those of their affiliated organizations, or those of the publisher, the editors and the reviewers. Any product that may be evaluated in this article, or claim that may be made by its manufacturer, is not guaranteed or endorsed by the publisher.
Acknowledgments
The authors would like to thank all participants who took part in the study and Peter Woolley for his careful revision of language and proofreading.
References
Abrams, D. A., Ryali, S., Chen, T., Balaban, E., Levitin, D. J., and Menon, V. (2013). Multivariate activation and connectivity patterns discriminate speech intelligibility in wernicke's, broca's, and geschwind's areas. Cereb. Cortex 23, 1703–1714. doi: 10.1093/cercor/bhs165
Accou, B., Monesi, M. J., Van Hamme, H., and Francart, T. (2021). Predicting speech intelligibility from eeg in a non-linear classification paradigm. J. Neural Eng. 18, 066008. doi: 10.1088/1741-2552/ac33e9
Aiken, S. J., and Picton, T. W. (2008). Human cortical responses to the speech envelope. Ear. Hear. 29, 139–157. doi: 10.1097/AUD.0b013e31816453dc
Bidelman, G. M., and Howell, M. (2016). Functional changes in inter-and intra-hemispheric cortical processing underlying degraded speech perception. Neuroim 124, 581–590. doi: 10.1016/j.neuroimage.2015.09.020
Biesmans, W., Das, N., Francart, T., and Bertrand, A. (2017). Auditory-inspired speech envelope extraction methods for improved eeg-based auditory attention detection in a cocktail party scenario. IEEE Trans. Neural Syst. Rehabil. Eng. 25, 402–412. doi: 10.1109/TNSRE.2016.2571900
Billings, C. J., McMillan, G. P., Penman, T. M., and Gille, S. M. (2013). Predicting perception in noise using cortical auditory evoked potentials. J. Assoc. Res. Otolaryngol., 14, 891–903. doi: 10.1007/s10162-013-0415-y
Brodbeck, C., Hong, L. E., and Simon, J. Z. (2018). Rapid transformation from auditory to linguistic representations of continuous speech. Cur. Biol. 28, 3976–3983. doi: 10.1016/j.cub.2018.10.042
Brunner, C., Delorme, A., and Makeig, S. (2013). Eeglab - an open source matlab toolbox for electrophysiological research. Biomed. Eng. 58:000010151520134182. doi: 10.1515/bmt-2013-4182
Burger, M., Hoppe, U., Lohscheller, J., Eysholdt, U., and Döllinger, M. (2009). The influence of temporal stimulus changes on speech-evoked potentials revealed by approximations of tone-evoked waveforms. Ear. Hear. 30, 16–22. doi: 10.1097/AUD.0b013e31818fbb9d
Burkard, R. F., Don, M., and Eggermont, J. J. (2007). Auditory Evoked Potentials: Basic Principles and Clinical Application. Baltimore, PA: Lippincott Williams and Wilkins.
Crosse, M., Di Liberto, G., Bednar, A., and Lalor, E. (2016). The multivariate temporal response function (mtrf) toolbox: a matlab toolbox for relating neural signals to continous stimuli. Front. Hum. Neurosci. 10, 604. doi: 10.3389/fnhum.2016.00604
David, S. V., Mesgarani, N., and Shamma, S. A. (2007). Estimating sparse spectro-temporal receptive fields with natural stimuli. Comput. in Neur. Sys. 18, 191–212. doi: 10.1080/09548980701609235
Decruy, L., Lesenfants, D., Vanthornhout, J., and Francart, T. (2020a). Top-down modulation of neural envelope tracking: The interplay with behavioral, self-report and neural measures of listening effort. Eur. J. Neurosci. 52, 3375–3393. doi: 10.1111/ejn.14753
Decruy, L., Vanthornhout, J., and Francart, T. (2020b). Hearing impairment is associated with enhanced neural tracking of the speech envelope. Hear. Res. 393, 107961. doi: 10.1016/j.heares.2020.107961
Devaraju, D. S., Kemp, A., Eddins, D. A., Shrivastav, R., Chandrasekaran, B., and Wray, A. H. (2021). Effects of task demands on neural correlates of acoustic and semantic processing in challenging listening conditions. J. Speech Lang. Hear. Res. 64, 3697–3706. doi: 10.1044/2021_JSLHR-21-00006
Di Liberto, G. M., O'Sullivan, J. A., and Lalor, E. C. (2015). Low-frequency cortical entrainment to speech reflects phoneme-level processing. Curr. Biol. 25, 2457–2465. doi: 10.1016/j.cub.2015.08.030
Digeser, F. M., Wohlberedt, T., and Hoppe, U. (2009). Contribution of spectrotemporal features on auditory event-related potentials elicited by consonant-vowel syllables. Ear. Hear. 30, 704–712. doi: 10.1097/AUD.0b013e3181b1d42d
Ding, N., and Simon, J. Z. (2012a). Emergence of neural encoding of auditory objects while listening to competing speakers. Proc. Natl. Acad. Sci. U.S.A. 109, 11854–11859. doi: 10.1073/pnas.1205381109
Ding, N., and Simon, J. Z. (2012b). Neural coding of continuous speech in auditory cortex during monaural and dichotic listening. J. Neurophysiol. 107, 78–89. doi: 10.1152/jn.00297.2011
Ding, N., and Simon, J. Z. (2014). Cortical entrainment to continuous speech: functional roles and interpretations. Front. Hum. Neurosci. 8, 311. doi: 10.3389/fnhum.2014.00311
Dubno, J. R., Dirks, D. D., and Morgan, D. E. (1984). Effects of age and mild hearing loss on speech recognition in noise. J. Acoust. Soc. Am. 76, 87–96. doi: 10.1121/1.391011
Etard, O., and Reichenbach, T. (2019). Neural speech tracking in the theta and in the delta frequency band differentially encode clarity and comprehension of speech in noise. J. Neurosci. 39, 5750–5759. doi: 10.1523/JNEUROSCI.1828-18.2019
Fiedler, L., Wöstmann, M., Herbst, S. K., and Obleser, J. (2019). Late cortical tracking of ignored speech facilitates neural selectivity in acoustically challenging conditions. Neuroimage 186, 33–42. doi: 10.1016/j.neuroimage.2018.10.057
Hoppe, U., Weiss, S., Stewart, R. W., and Eysholdt, U. (2001). An automatic sequential recognition method for cortical auditory evoked potentials. IEEE Trans. Biomed. Eng. 48, 154–164. doi: 10.1109/10.909636
Iotzov, I., and Parra, L. C. (2019). EEG can predict speech intelligibility. J. Neural Eng. 16, 036008. doi: 10.1088/1741-2552/ab07fe
Iversen, J. R., and Makeig, S. (2019). “MEG/EEG data analysis using EEGLAB,” in Magnetoencephalography: From Signals to Dynamic Cortical Networks (Cham: Springer International Publishing). 391–406. doi: 10.1007/978-3-030-00087-5_8
Kay, S. M. (1993). Fundamentals of Statistical Signal Processing: Estimation Theory. Upper Saddle River, NJ: Prentice-Hall Inc.
Kollmeier, B., Warzybok, A., Hochmuth, S., Zokoll, M. A., Uslar, V., Brand, T., et al. (2015). The multilingual matrix test: Principles, applications, and comparison across languages: a review. Int. J. Audiol. 54, 3–16. doi: 10.3109/14992027.2015.1020971
Kong, Y.-Y., Mullangi, A., and Ding, N. (2014). Differential modulation of auditory responses to attended and unattended speech in different listening conditions. Hear. Res. 316, 73–81. doi: 10.1016/j.heares.2014.07.009
Kummer, P., Burger, M., Schuster, M., Rosanowski, F., Eysholdt, U., and Hoppe, U. (2007). Cortical auditory evoked potentials to acoustic changes in speech stimuli in children. Folia Phoniatr. Logop. 59, 273–280. doi: 10.1159/000104466
Kuruvila, I., Demir, K. C., Fischer, E., and Hoppe, U. (2021). Inference of the selective auditory attention using sequential lmmse estimation. IEEE Trans. Biomed. Eng. 68, 3501–3512. doi: 10.1109/TBME.2021.3075337
Kuruvila, I., Fischer, E., and Hoppe, U. (2020). “An lmmse-based estimation of temporal response function in auditory attention decoding,” in 2020 42nd Annual International Conference IEEE Engineering Medical Biology Sociology (EMBC) (Montreal, QC), 2837–2840.
Lalor, E. C., and Foxe, J. J. (2010). Neural responses to uninterrupted natural speech can be extracted with precise temporal resolution. Eur. J. Neurosci. 31, 189–193. doi: 10.1111/j.1460-9568.2009.07055.x
Lalor, E. C., Pearlmutter, B. A., Reilly, R. B., McDarby, G., and Foxe, J. J. (2006). The vespa: a method for the rapid estimation of a visual evoked potential. Neuroimage 32, 1549–1561. doi: 10.1016/j.neuroimage.2006.05.054
Lalor, E. C., Power, A. J., Reilly, R. B., and Foxe, J. J. (2009). Resolving precise temporal processing properties of the auditory system using continuous stimuli. J. Neurophysiol. 102, 349–359. doi: 10.1152/jn.90896.2008
Lampe, J., and Voss, H. (2013). Large-scale tikhonov regularization of total least squares. J. Comput. Appl. Math. 238, 95–108. doi: 10.1016/j.cam.2012.08.023
Laszlo, S., Ruiz-Blondet, M., Khalifian, N., Chu, F., and Jin, Z. (2014). A direct comparison of active and passive amplification electrodes in the same amplifier system. J. Neurosci. Meth. 235, 298–307. doi: 10.1016/j.jneumeth.2014.05.012
Leff, A. P., Schofield, T. M., Stephan, K. E., Crinion, J. T., Friston, K. J., and Price, C. J. (2008). The cortical dynamics of intelligible speech. J. Neurosci. 28, 13209–13215. doi: 10.1523/JNEUROSCI.2903-08.2008
Lesenfants, D., and Francart, T. (2020). The interplay of top-down focal attention and the cortical tracking of speech. Sci. Rep. 10, 6922. doi: 10.1038/s41598-020-63587-3
Lesenfants, D., Vanthornhout, C., Decruy, L., Verschueren, E., and Francart, T. (2019). Predicting individual speech intelligibility from the cortical tracking of acoustic- and phonetic-level speech representations. Hear. Res. 380, 1–9. doi: 10.1016/j.heares.2019.05.006
Machens, C. K., Wehr, M. S., and Zador, A. Z. (2004). Linearity of cortical receptive fields measured with natural sounds. J. Neurophysci. 24, 1089–1100. doi: 10.1523/JNEUROSCI.4445-03.2004
McHaney, J. R., Gnanateja, G. N., Smayda, K. E., Zinszer, B. D., and Chandrasekaran, B. (2021). Cortical tracking of speech in delta band relates to individual differences in speech in noise comprehension in older adults. Ear. Hear. 42, 343–354. doi: 10.1097/AUD.0000000000000923
Mennes, M., Wouters, H., Vanrumste, B., Lagae, L., and Stiers, P. (2010). Validation of ica as a tool to remove eye movement artifacts from eeg/erp. Psychophysiology 47, 1142–1150. doi: 10.1111/j.1469-8986.2010.01015.x
Mesgarani, N., and Chang, E. F. (2012). Selective cortical representation of attended speaker in multi-talker speech perception. Nature 7397, 233–236. doi: 10.1038/nature11020
Mirkovic, B., Debener, S., Schmidt, J., Jaeger, M., and Neher, T. (2019). Effects of directional sound processing and listener's motivation on eeg responses to continuous noisy speech: do normal-hearing and aided hearing-impaired listeners differ? Hear. Res. 377, 260–270. doi: 10.1016/j.heares.2019.04.005
O'Sullivan, J. A., Power, A. J., Mesgarani, N., Rajaram, S., Foxe, J. J., Shinn-Cunningham, B. G., et al. (2014). Attentional selection in a cocktail party environment can be decoded from single-trial eeg. Cereb. Cortex 25, 1697–1706. doi: 10.1093/cercor/bht355
Picton, T. (2013). Hearing in time: evoked potential studies of temporal processing. Ear Hear. 34, 385–401. doi: 10.1097/AUD.0b013e31827ada02
Picton, T., Alain, C., Woods, D. L., John, M., Scherg, M., Valdes-Sosa, P., et al. (1999). Intracerebral sources of human auditory-evoked potentials. Audiol. Neurotol. 4, 64–79. doi: 10.1159/000013823
Power, A. J., Foxe, J. J., Forde, E.-J., Reilly, R. B., and Lalor, E. C. (2012). At what time is the cocktail party? a late locus of selective attention to natural speech. Eur. J. Neurosci. 35, 1497–1503. doi: 10.1111/j.1460-9568.2012.08060.x
Sharma, A., and Dorman, M. F. (1999). Cortical auditory evoked potential correlates of categorical perception of voice-onset time. J. Acoust. Soc. Am. 106, 1078–1083. doi: 10.1121/1.428048
Vanthornhout, C., Decruy, L., Wouters, J., Simon, J. S., and Francart, T. (2018). Speech intelligibility predicted from neural entrainment of the speech envelope. J. Assoc. Res. Otolaryngol. 19, 181–191. doi: 10.1007/s10162-018-0654-z
Vanthornhout, J., Decruy, L., and Francart, T. (2019). Effect of task and attention on neural tracking of speech. Front. Neurosci. 13, 977. doi: 10.3389/fnins.2019.00977
Verschueren, E., Vanthornhout, J., and Francart, T. (2021). The effect of stimulus intensity on neural envelope tracking. Hear. Res., 403, 108–175. doi: 10.1016/j.heares.2021.108175
Wagener, K., Brand, T., and Kollmeier, B. (1999a). Entwicklung und evaluation eines satztests fur die deutsche sprache.teil i: design des oldenburger satztests (development and evaluation of a sentence test for the german language. part i: design of the oldenburg sentence test). Z. Audiol. 38, 4–15.
Wagener, K., Brand, T., and Kollmeier, B. (1999b). Entwicklung und evaluation eines satztests fur die deutsche sprache.teil ii: optimierung des oldenburger satztests (development and evaluation of a sentence test for the german language. part ii: optimization of the oldenburg sentence test). Z. Audiol. 38, 44–56.
Wagener, K., Brand, T., and Kollmeier, B. (1999c). Entwicklung und evaluation eines satztests fur die deutsche sprache. teil iii: evaluation des oldenburger satztests (development and evaluation of a sentence test for the german language. part iii: evaluation of the oldenburg sentence test). Z. Audiol. 38, 86–95.
Wagener, K. C., and Brand, T. (2005). Sentence intelligibility in noise for listeners with normal hearing and hearing impairment: influence of measurement procedure and masking parameters. Int. J. Audiol. 44, 144–156. doi: 10.1080/14992020500057517
Woods, D. L. (1995). The component structure of the n 1 wave of the human auditory evoked potential. Electroencephalogr. Clin. Neurophysiol. Suppl. 44, 102–109.
Zatorre, R., Evans, A., Meyer, E., and Gjedde, A. (1992). Lateralization of phonetic and pitch discrimination in speech processing. Science 256, 846–849. doi: 10.1126/science.256.5058.846
Keywords: speech intelligibility, objective speech audiometry, EEG measures, speech tracking, auditory evoked potentials, speech in noise
Citation: Muncke J, Kuruvila I and Hoppe U (2022) Prediction of Speech Intelligibility by Means of EEG Responses to Sentences in Noise. Front. Neurosci. 16:876421. doi: 10.3389/fnins.2022.876421
Received: 15 February 2022; Accepted: 13 March 2022;
Published: 01 June 2022.
Edited by:
Fei Chen, Southern University of Science and Technology, ChinaCopyright © 2022 Muncke, Kuruvila and Hoppe. This is an open-access article distributed under the terms of the Creative Commons Attribution License (CC BY). The use, distribution or reproduction in other forums is permitted, provided the original author(s) and the copyright owner(s) are credited and that the original publication in this journal is cited, in accordance with accepted academic practice. No use, distribution or reproduction is permitted which does not comply with these terms.
*Correspondence: Ulrich Hoppe, dWxyaWNoLmhvcHBlQHVrLWVybGFuZ2VuLmRl