 Han Jin1†
 Yu-Lin Zhong
 Ping-Hong Lai
 Xin Huang
- 1Department of Ophthalmology, Jiangxi Provincial People’s Hospital, The First Affiliated Hospital of Nanchang Medical College, Nanchang, China
- 2Department of Radiology, Jiangxi Provincial People’s Hospital, The First Affiliated Hospital of Nanchang Medical College, Nanchang, China
Background: Comitant exotropia (CE) is a common eye movement disorder, characterized by impaired eye movements and stereoscopic vision. CE patients reportedly exhibit changes in the central nervous system. However, it remains unclear whether large-scale brain network changes occur in CE patients.
Purpose: This study investigated the effects of exotropia and stereoscopic vision dysfunction on large-scale brain networks in CE patients via independent component analysis (ICA).
Methods: Twenty-eight CE patients (mean age, 15.80 ± 2.46 years) and 27 healthy controls (HCs; mean age, 16.00 ± 2.68 years; closely matched for age, sex, and education) underwent resting-state magnetic resonance imaging. ICA was applied to extract resting-state networks (RSNs) in both groups. Two-sample’s t-tests were conducted to investigate intranetwork functional connectivity (FC) within RSNs and interactions among RSNs between the two groups.
Results: Compared with the HC group, the CE group showed increased intranetwork FC in the bilateral postcentral gyrus of the sensorimotor network (SMN). The CE group also showed decreased intranetwork FC in the right cerebellum_8 of the cerebellum network (CER), the right superior temporal gyrus of the auditory network (AN), and the right middle occipital gyrus of the visual network (VN). Moreover, functional network connectivity (FNC) analysis showed that CER-AN, SMN-VN, SN-DMN, and DMN-VN connections were significantly altered between the two groups.
Conclusion: Comitant exotropia patients had abnormal brain networks related to the CER, SMN, AN, and VN. Our results offer important insights into the neural mechanisms of eye movements and stereoscopic vision dysfunction in CE patients.
Introduction
Comitant exotropia (CE) is a common eye movement disorder, characterized by ocular deviation and impaired stereoscopic vision function; CE affects 1.0% of all children (Govindan et al., 2005). Impaired stereoscopic vision is an important clinical manifestation of CE (Feng et al., 2015). Binocular vision is an important physiological basis for stereoscopic vision. Symmetrical eye positioning allows considerable visual field overlapping between eyes, which is essential for both binocular and stereoscopic vision (Chopin et al., 2019). CE patients exhibit impaired stereoscopic vision because of anomalous retinal correspondence for the same object in both eyes. The fundamental nature of stereoscopic vision depends on good vision in both eyes, good oculomotor control, and intact cortical mechanisms (Li et al., 2017). Moreover, central nervous system function is important for stereoscopic vision.
Stereoscopic vision is a fundamental aspect of human visual function. The visual cortex has an important role in maintaining stereoscopic vision. Neuroimaging studies have shown that the medial temporal lobe plays important roles in stereoscopic depth processing (Backus et al., 2001; Chen et al., 2020). Moreover, the dorsal visual pathway is involved in stereoscopic depth processing (Goncalves et al., 2015). Ban et al. (2012) demonstrated that the dorsal stream is important for binocular vision fusion, while Zheng et al. (2020) found that the dorsal visual regions showed predominant advantages in decoding the disparities present in three-dimensional images. Furthermore, stereoscopic vision is closely related to gray and white matter structures in the brain. Numerous cortical areas are reportedly involved in binocular disparity processing (Ohzawa et al., 1990; Parker, 2007). Abed Rabbo et al. (2018) describe extensive white matter connections between the visual areas and the lateral geniculate nucleus within stereoscopic visual areas. Prins et al. (2017) found that volumetric decreases in the superior lateral occipital cortices are associated with depth perception in monocularly blind patients. Oishi et al. (2018) demonstrated that stereoscopic depth discrimination is involved in dorsoventral communication through the vertical occipital fasciculus. Gillebert et al. (2015) found that the right posterior inferior temporal cortex and right premotor cortex are responsible for three-dimensional shape processing. The aforementioned studies showed that stereoscopic vision is closely related to specific brain structures and functions. However, the effects of impaired stereoscopic vision on large-scale resting-state functional network connectivity (FNC) have not been explored in CE patients.
The human brain exhibits blood oxygenation level-dependent (BOLD) signals in the resting state. Low-frequency fluctuations (<0.01 Hz) in resting-state BOLD signals reflect spontaneous neural activity and imply spatiotemporal correlations in functional networks (Auer, 2008). Low-frequency fluctuations are closely related to several physiological functions including motor (Biswal et al., 1995), vision (Oke et al., 2010), and higher cognitive function (Kong et al., 2016). The low-frequency fluctuations (<0.01 Hz) in BOLD signals reportedly correspond to functionally relevant resting-state networks (RSNs) (e.g., visual, sensorimotor, auditory, default mode, executive, and salience) (Damoiseaux et al., 2006; Smith et al., 2009). The independent component analysis (ICA) method is a powerful data-driven approach for the identification of independent patterns in multivariate data (van de Ven et al., 2004). Importantly, the ICA method does not require a preset seed point, compared with resting-state functional connectivity-based seed points. Moreover, the ICA method has been successfully used to investigate changes in neurophysiological mechanisms that occur in neurological diseases (Du et al., 2015; Chen et al., 2019). To our knowledge, the effects of impaired stereoscopic vision on large-scale resting-state FNC have not been investigated in CE patients.
This study was performed to investigate how impaired stereoscopic vision influences large-scale resting-state FNC in CE patients. We hypothesized that CE patients might exhibit widespread RSN changes involving VNs and vision-related supporting networks. Our findings might provide new insights into the mechanisms of RSN changes that contribute to impaired stereoscopic vision in CE patients.
Materials and Methods
Participants
Twenty-eight CE patients and twenty-seven healthy controls (HCs) were recruited from Jiangxi Provincial People’s Hospital, The First Affiliated Hospital of Nanchang Medical College. The diagnostic criteria of CE patients were as follows: (1) comitant exotropia, exodeviation angles between 15 and 80Δ; (2) without a history of strabismus surgery; (3) participant should have undergone fusional control score, Worth 4-dot test, and Titmus stereopsis test.
The exclusion criteria of CE individuals in the study were as follows: (1) additional ocular-related complications (e.g., cataract, glaucoma, high myopia, or optic neuritis); (2) sensory exotropia, fixed exotropia; and (3) concomitant exotropia was associated with amblyopia.
Magnetic Resonance Imaging Acquisition
Magnetic resonance imaging (MRI) scanning was performed on a 3-T magnetic resonance scanner (Discovery MR 750W system; GE Healthcare, Milwaukee, WI, United States) with eight-channel head coil. Functional images were obtained by using a gradient-echo-planar imaging sequence. All the subjects were instructed to rest quietly with their eyes closed and relaxed without thinking about anything in particular or falling asleep. Whole-brain T1 weights were obtained with three-dimensional brain volume imaging (3D-BRAVO) MRI with the following parameters: repetition time [TR]/echo time [TE] = 8.5/3.3, thickness = 1.0 mm, no intersection gap, acquisition matrix = 256 × 256, field of view = 240 mm × 240 mm, and flip angle = 12°. Functional images were obtained by using a gradient-echo-planar imaging sequence with the following parameters: TR/TE = 2,000 ms/25 ms, thickness = 3.0 mm, gap = 1.2 mm, acquisition matrix = 64 × 64, flip angle = 90°, field of view = 240 mm × 240 mm, voxel size = 3.6 mm × 3.6 mm × 3.6 mm, and 35 axial slices.
fMRI Data Analysis
All pre-processing was performed using the toolbox for Data Processing and Analysis of Brain Imaging (DPABI1) (Yan et al., 2016), which is based on Statistical Parametric Mapping (SPM12)2 implemented in MATLAB 2013a (MathWorks, Natick, MA, United States) and briefly the following steps: (1) Remove the first 10 volumes. (2) Slice timing effects, motion corrected. For head motion parameters, more than 2 mm or for whom rotation exceeded 1.5° during scanning were excluded (Van Dijk et al., 2012). (3) Normalized data [in Montreal Neurological Institute (MNI) 152 space] were re-sliced at a resolution of 3 mm × 3 mm × 3 mm. (4) Spatial smoothing by convolution with an isotropic Gaussian kernel of 6 mm × 6 mm × 6 mm full width at half maximum.
Group Independent Component Analysis
Group ICA was performed to decompose the data into independent components (ICs) using the GIFT toolbox (version 3.0b).3 First, 31 IC maps were estimated in this study using the minimum description length criterion to adjust for spatial correlation. Second, the ICs for each subject were derived from the group ICA back-reconstruction step and were converted into z-scores (Zuo et al., 2010). Components retained for further analysis among the 31 estimated ICs were selected based on the largest spatial correlation with specific RSN templates (Shirer et al., 2012; Wang et al., 2014). The IC time courses and spatial maps for each subject were transformed to z-scores. Fourteen RSNs were identified in this study.
Intranetwork Functional Connectivity Analysis
The intranetwork FC was represented by the z−score of each voxel, which reflects the degree to which the time series of a given voxel correlates with the mean time series of its corresponding component.
Functional Network Connectivity Analysis
The FNC analysis was performed using the MANCOVAN toolbox in GIFT software to explore changes in the predefined 14 spatial IC pairs of functional connections. First, at 0.01–0.15 Hz, de-trend, de-peak, and low-pass filtering were performed on the selected IC. Then, the pair correlations of these ICs were calculated and transformed using Fisher’s Z-transform.
Statistical Analysis
Spatial Maps for Each of the Resting-State Networks
The ICs corresponding to fourteen RSNs were extracted from all subjects. Fourteen of these components coincided with RSNs, namely, IC1 (LECN, left executive control network); IC5 (DAN, dorsal attention network); IC6 (CER, cerebellum network); IC8 (RECN, right executive control network); IC12 (VN1, visual network1); IC13 (DMN1, default mode network1); IC18 (SN, salience network); IC22 (SMN, sensorimotor network); IC23 (AN, auditory network); IC24 (VN2, visual network2); IC26 (VN3, visual network3); IC27 (DMN2, default mode network2); IC29 (VN4, visual network4); and IC30 (DMN3, default mode network3).
Intranetwork Functional Connectivity Analysis
Two-sample’s t-tests were used to compare differences between the two groups in the intranetwork FC within RSN maps; the Gaussian random field method was used to correct for multiple comparisons and regressed covariates of age and sex using SPM12 software. Group comparisons were masked to the voxels within corresponding RSNs (two-tailed, voxel-level p < 0.01, Gaussian random field correction, cluster-level p < 0.05).
Internetwork Functional Connectivity Analysis
Internetwork functional connectivity analysis was used to calculate temporal relationships between RSNs. Corresponding to the significant correlation combinations, the average time lags were calculated for each group; these represented the amount of delay between time courses of two correlated RSNs. Two-sample’s t-tests were used to compare distinct temporal relationships between RSNs between the two groups (p < 0.05, uncorrected).
Results
Demographics and Visual Measurements
There were no significant differences in the gender and age between the groups (Table 1).
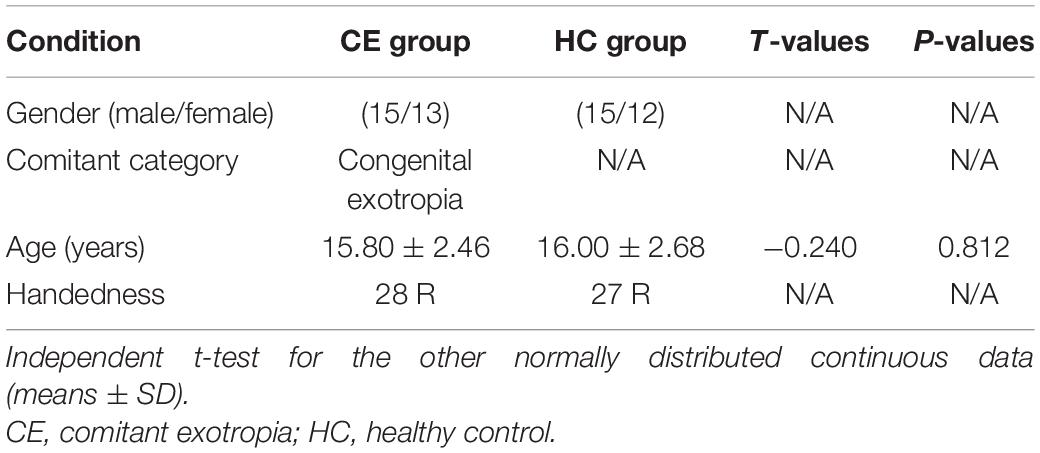
Table 1. Demographics and visual measurements between two groups.
Identifications of the Resting-State Networks
The group ICA approach automatically generated 31 ICs. The typical spatial patterns in each RSN of both CE and HC groups are illustrated in Figure 1. Fourteen of these components coincided with RSNs, namely, IC1 (LECN, left executive control network); IC5 (DAN, dorsal attention network); IC6 (CER, cerebellum network); IC8 (RECN, right executive control network); IC12 (VN1, visual network1); C13 (DMN1, default mode network1); IC18 (SN, salience network); IC22 (SMN, sensorimotor network); IC23 (AN, auditory network); IC24 (VN2, visual network2); IC26 (VN3, visual network3); IC27 (DMN2, default mode network2); IC29 (VN4, visual network4); and IC30 (DMN3, default mode network3).
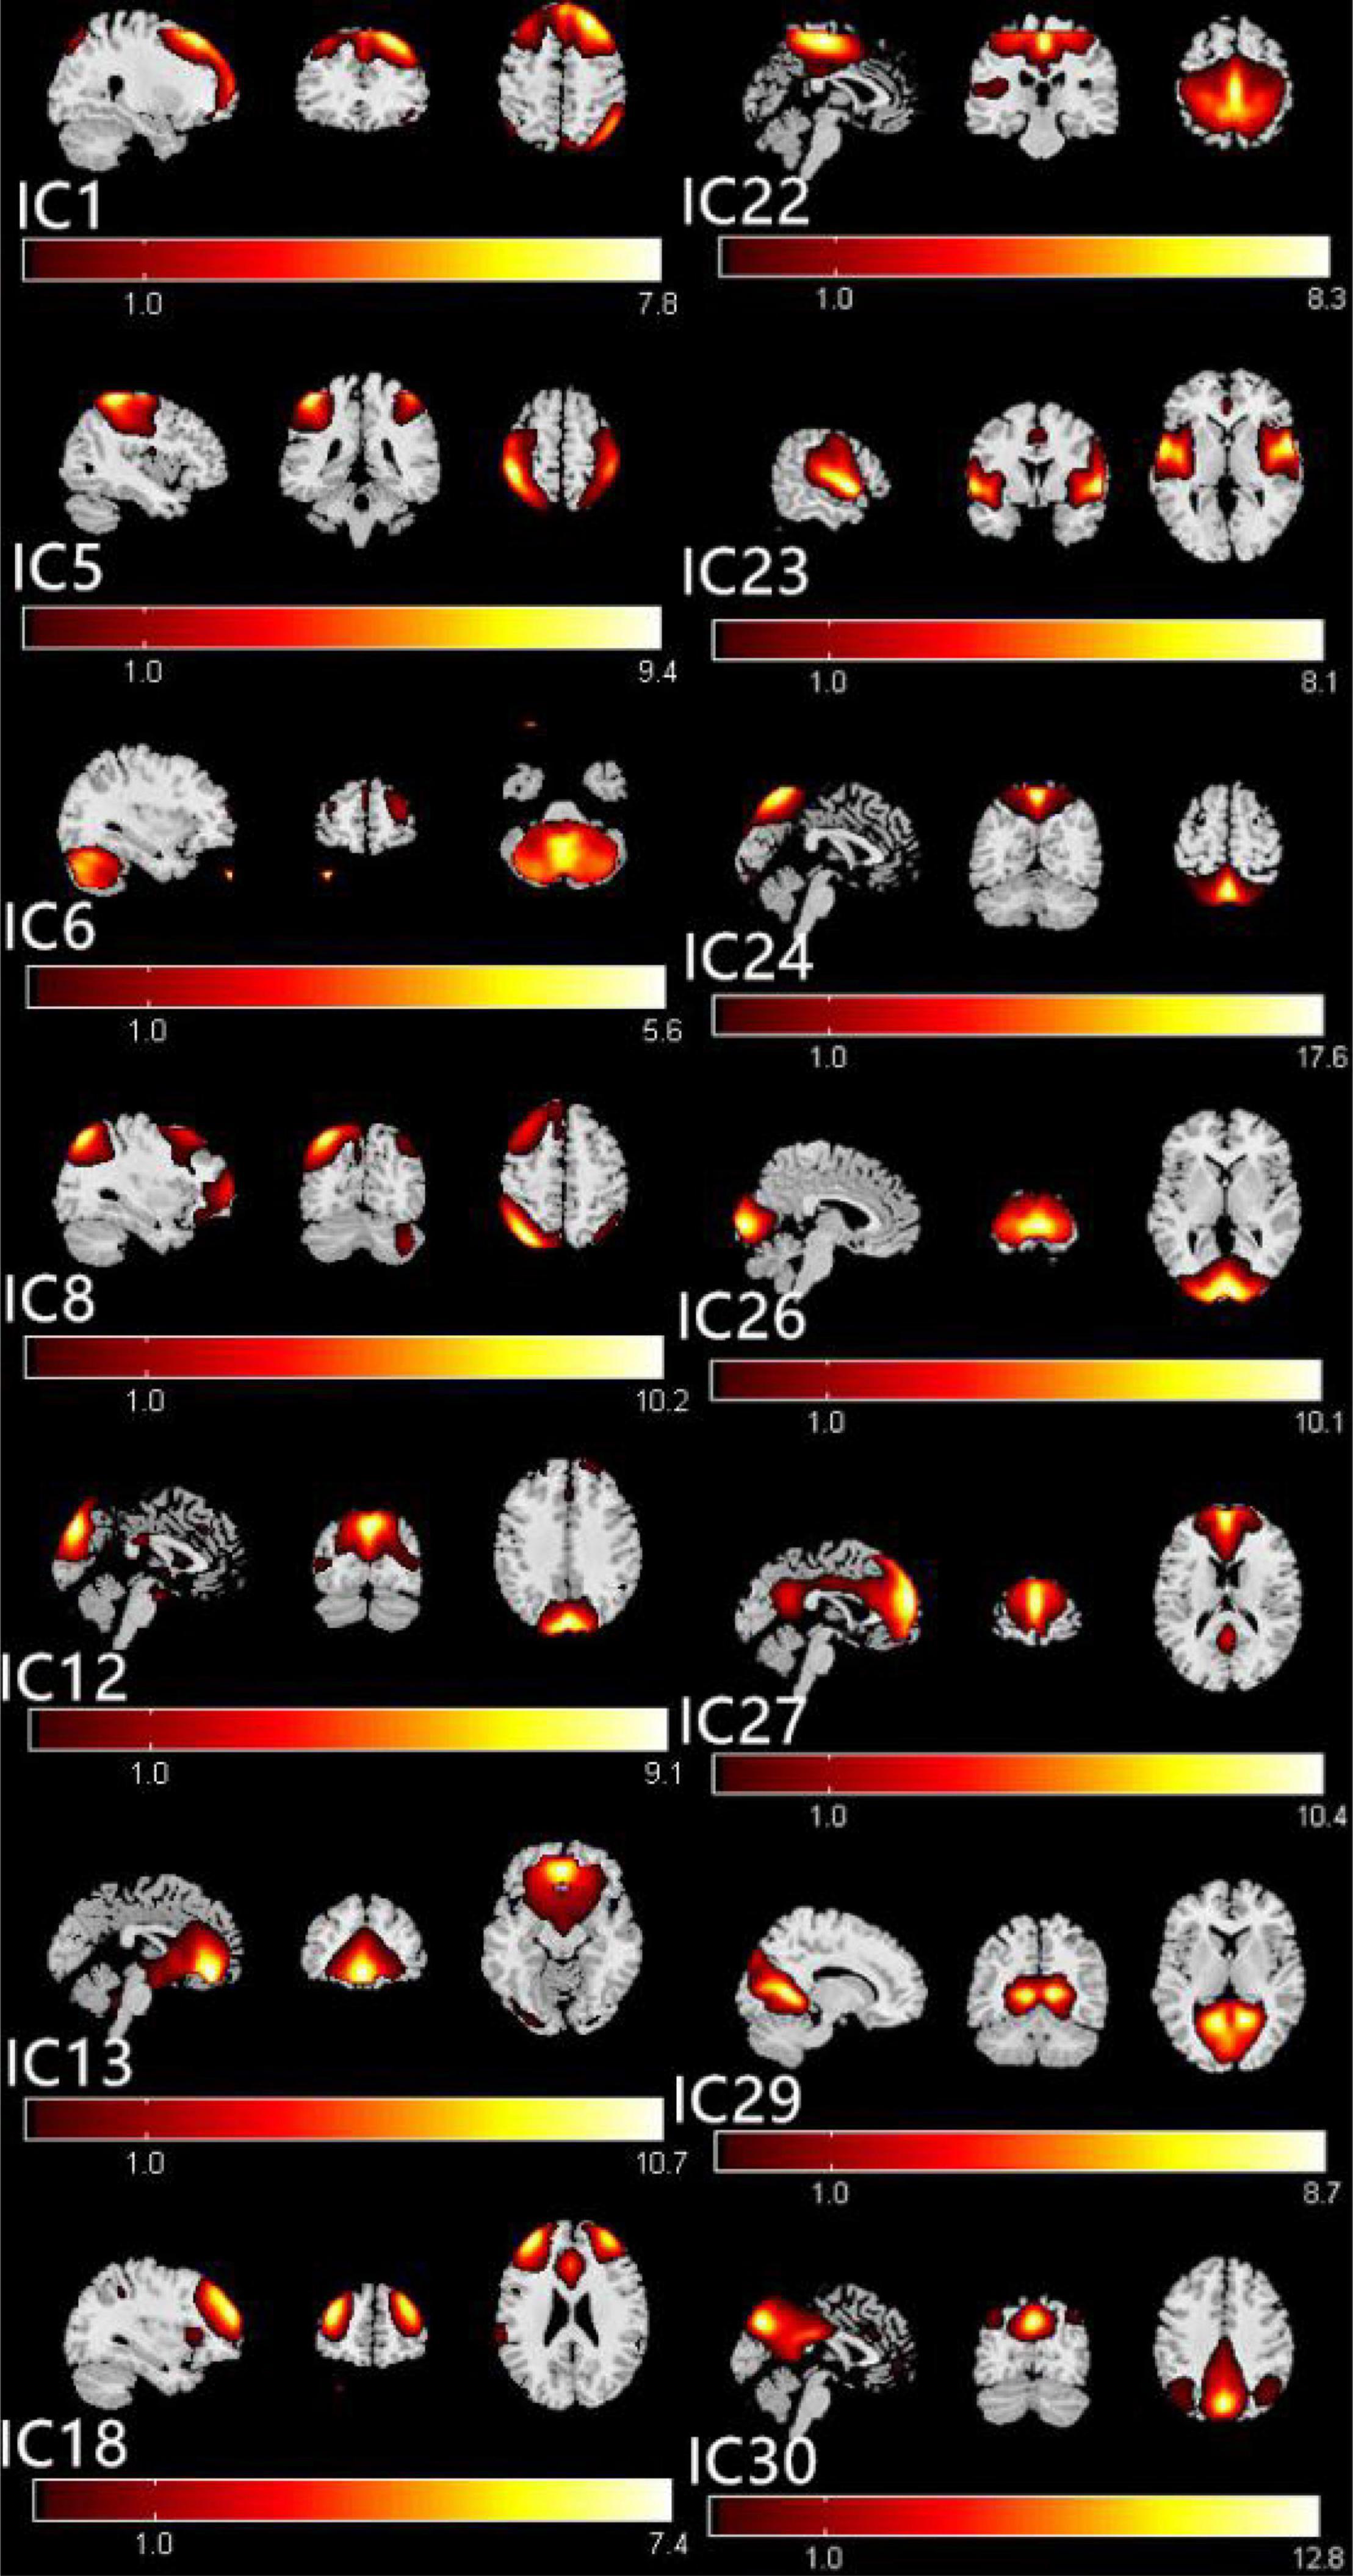
Figure 1. The typical spatial patterns in each RSN of both CE and HC groups, including IC1(LECN), IC5(DAN), IC6(CER), IC8(RECN), IC12(VN1), C13(DMN1), IC18(SN), IC22(SMN), IC23(AN), IC24(VN2), IC26(VN3), IC27(DMN2), IC29(VN4), and IC30 (DMN3). Scale represents T-values with a range of 1–17.6 in each RSN. CE, comitant exotropia; HC, healthy control; lECN, left executive control network; DAN, dorsal attention network; CER, cerebellum network; RECN, right executive control network; VN, visual network; DMN, default mode network; SN, salience network; SMN, sensorimotor network; AN, auditory network.
Abnormal Intranetwork Functional Connectivity Changes Between Groups
Compared with the HC group, the CE group showed increased intranetwork FC in the bilateral postcentral gyrus of the SMN. Meanwhile, the PD group showed decreased intranetwork FC in the right cerebelum_8 of the CER, the right superior temporal gyrus of the AN, and the right middle occipital gyrus of the VN (Figure 2 and Table 2) (two-tailed, voxel-level p < 0.01, GRF correction, cluster-level p < 0.05).
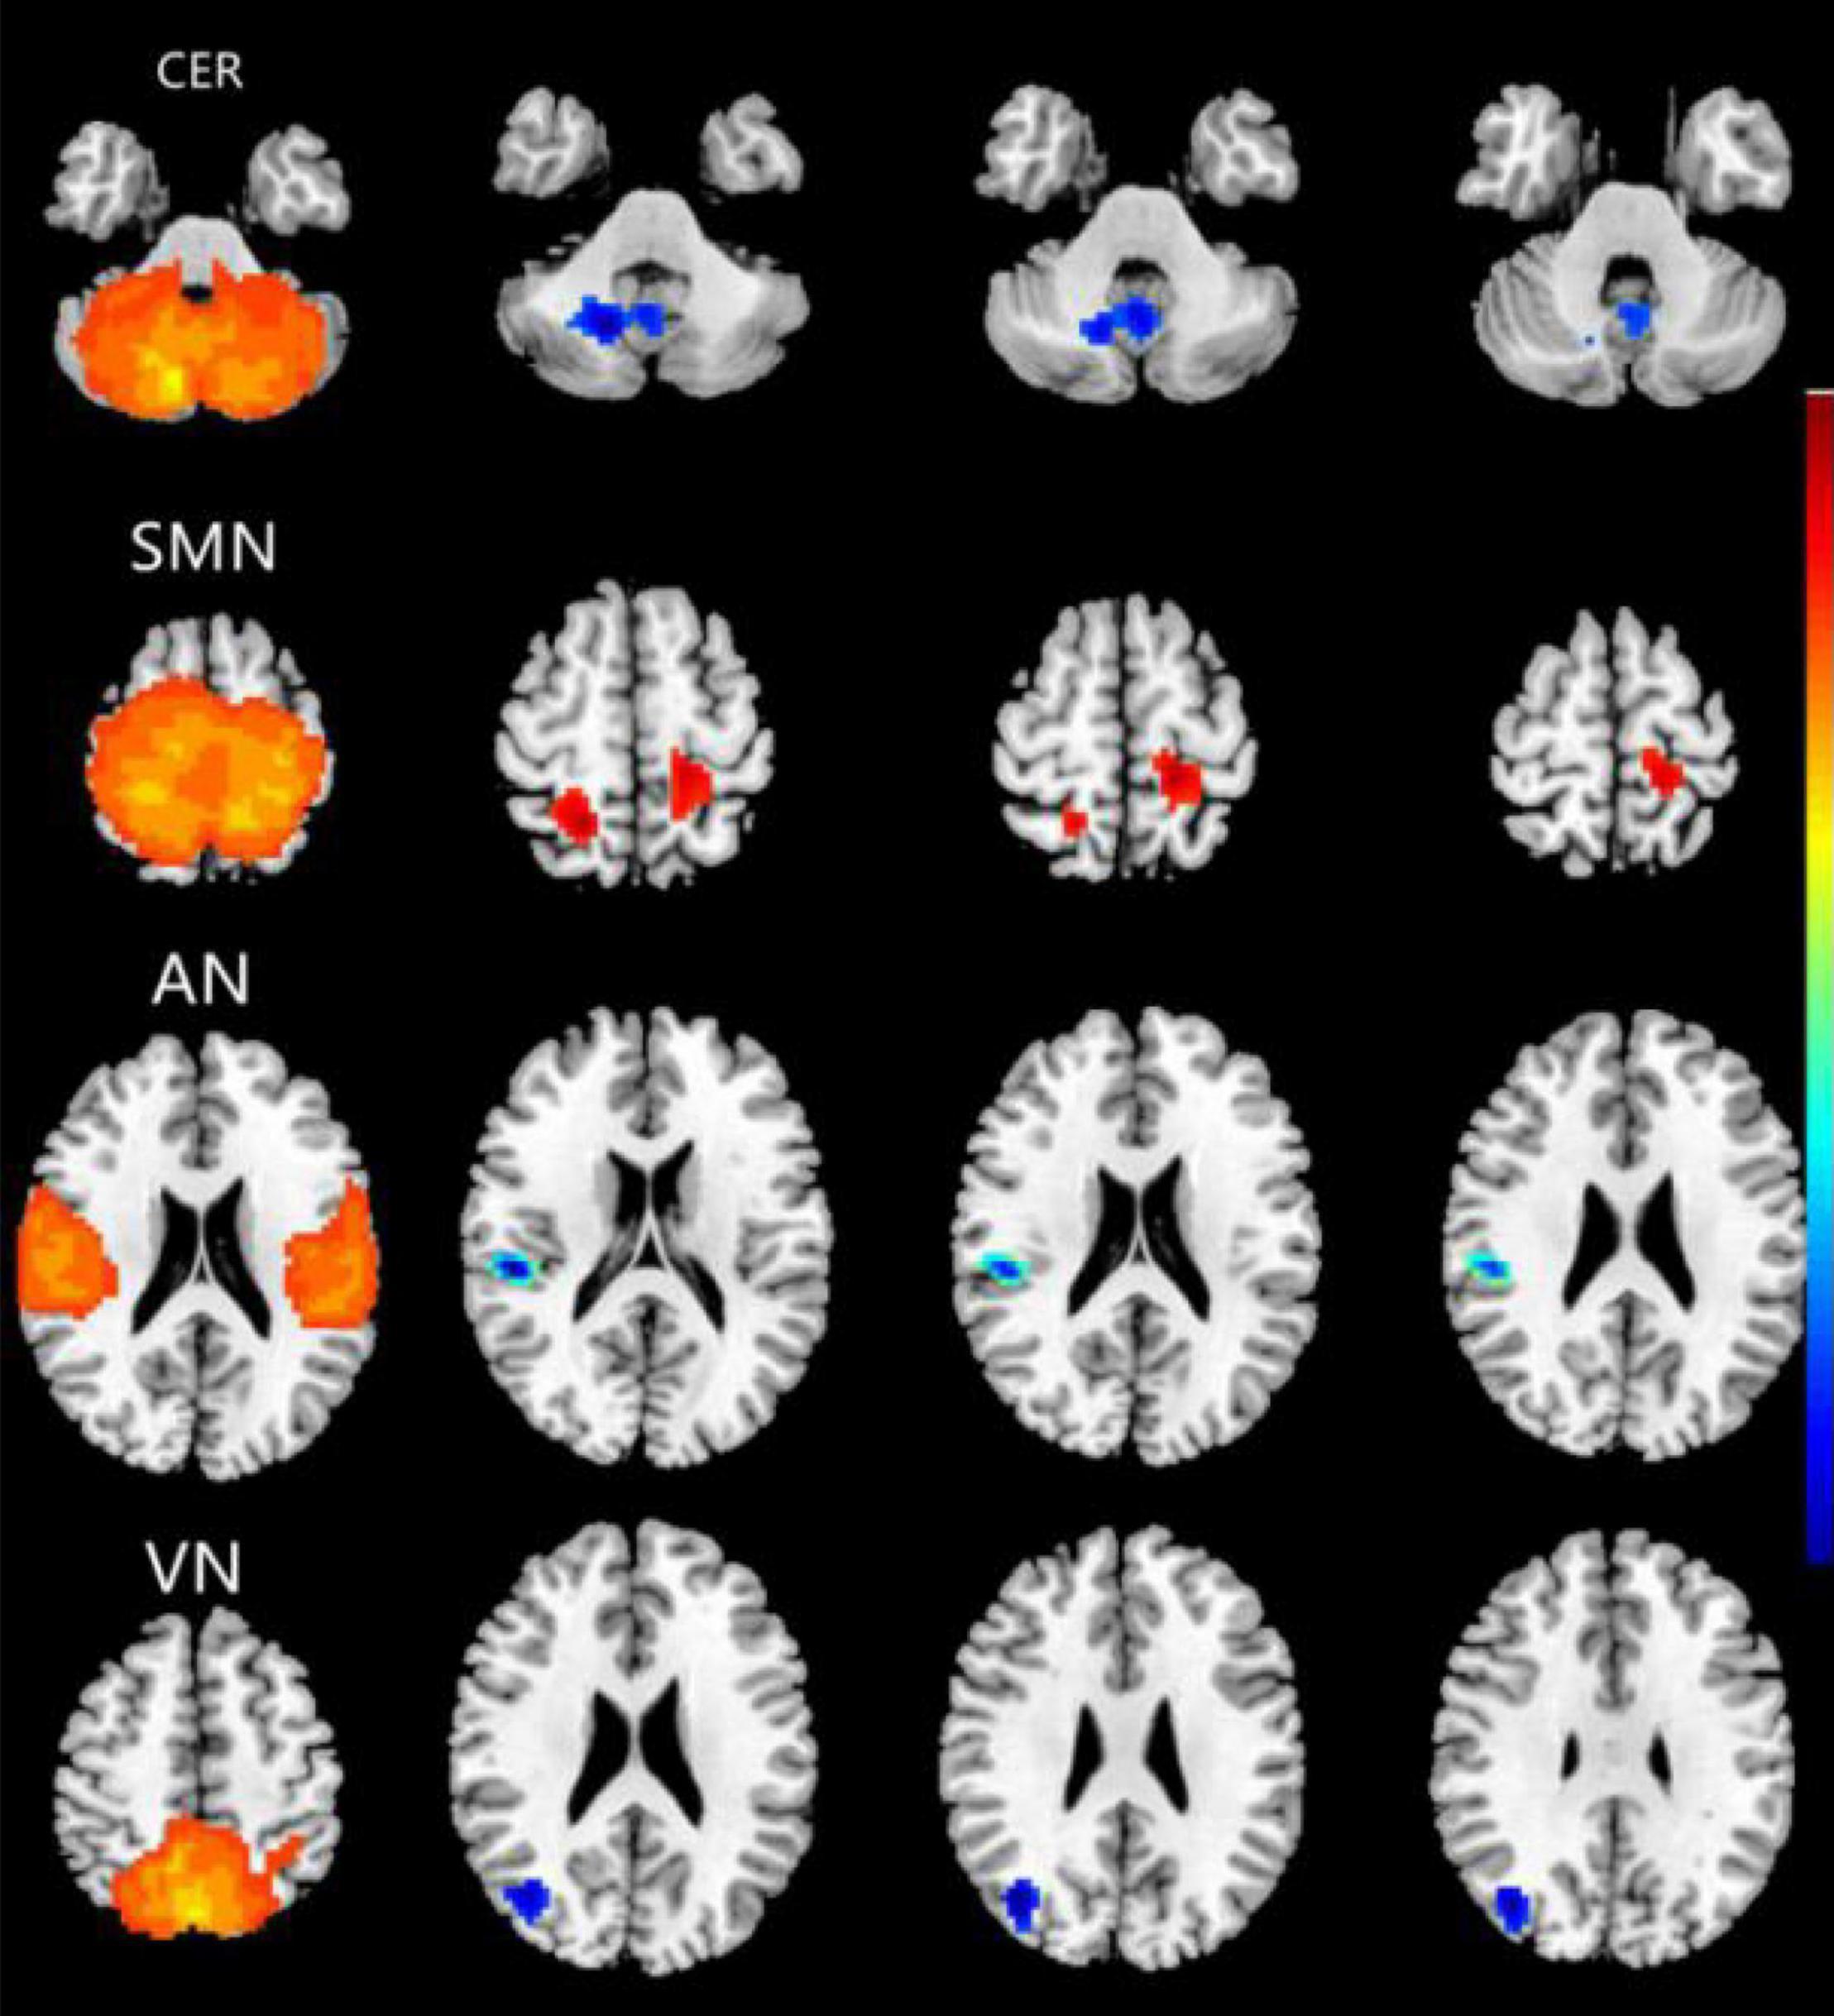
Figure 2. Brain regions with significant differences for five RSNs in the CE group vs. the HC group (two-tailed, voxel-level p < 0.01, GRF correction, cluster-level p < 0.05). Compared with the HC group, cool colors indicated the decreased functional connectivity and hot colors indicated the increased functional connectivity in the CE group. The pictures correspond to different resting-state networks. CER, SMN, AN and VN. CE, comitant exotropia; HC, healthy control; CER, cerebellum network; SMN, sensorimotor network; AN, auditory network; VN, visual network.
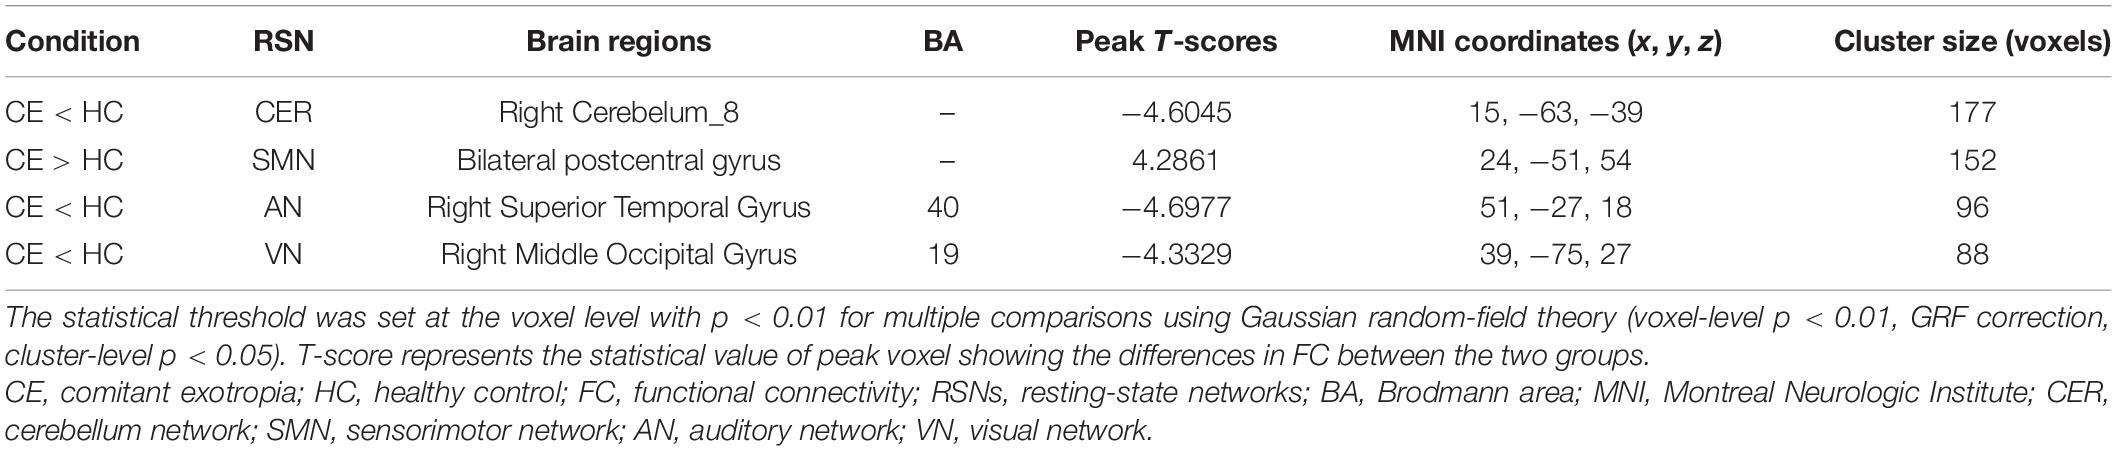
Table 2. Different intranetwork FC of RSNs between two groups.
Functional Network Connectivity Analysis
The markers indicate significant functional connection between networks IC1 (LECN), IC5 (DAN), IC6 (CER), IC8 (RECN), IC12 (VN1), C13 (DMN1), IC18 (SN), IC22 (SMN), IC23 (AN), IC24 (VN2), IC26 (VN3), IC27 (DMN2), IC29 (VN4), and IC30 (DMN3) (p < 0.05, uncorrected). Matrix shows differences of internetwork functional connectivity between two groups (Figures 3A,B). Significance and direction following two-sample t-tests (CE-HC) on each pairwise correlation are depicted as the −sign(t val)log10(p val) (Figure 3C); the CER-AN, SMN-VN, SN-DMN, and DMN-VN connections were found to be significantly altered between two groups (p < 0.05) (Figure 3D).
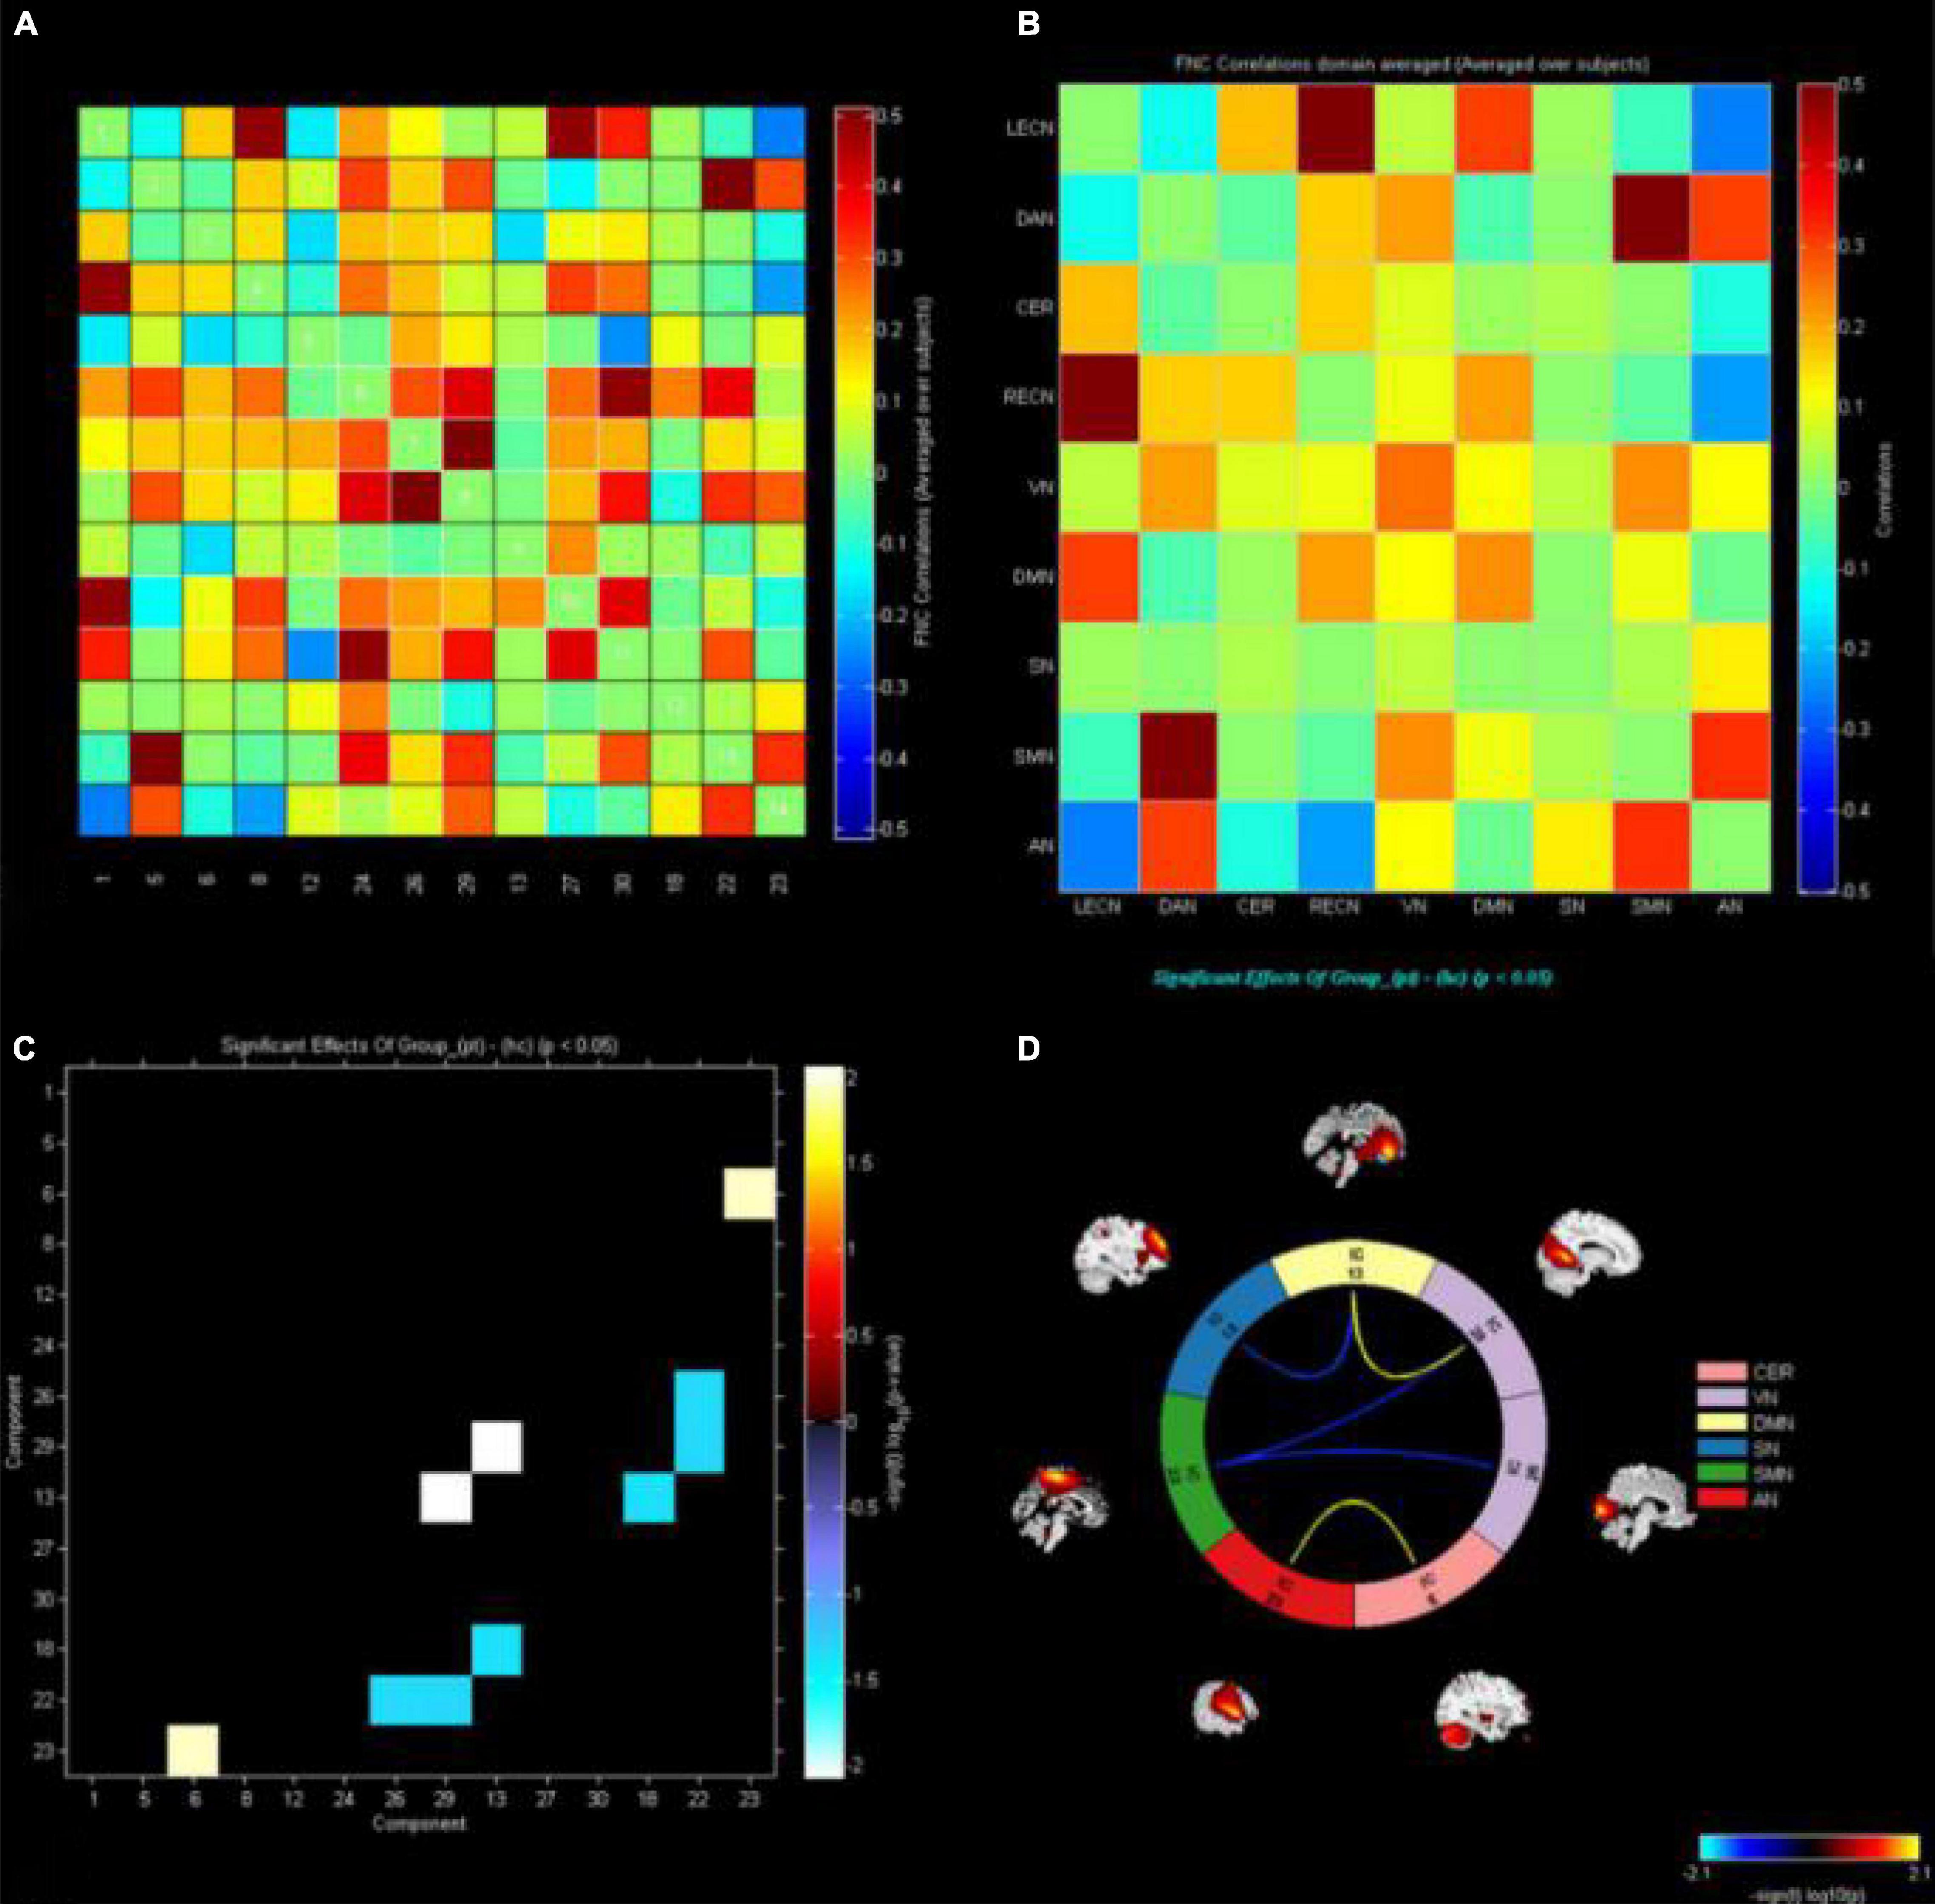
Figure 3. The functional connectivity correlation matrix between all RSNs. The color scale represents the value of the correlations. Warm color represents positive correlations, and cold color represents anti–correlations. The markers indicate significant functional connection between networks IC1(LECN), IC5(DAN), IC6(CER), IC8(RECN), IC12(VN1), C13(DMN1), IC18(SN), IC22(SMN), IC23(AN), IC24(VN2), IC26(VN3), IC27(DMN2), IC29(VN4), and IC30 (DMN3) (p < 0.05 uncorrected). (A,B) Matrix shows differences of internetwork functional connectivity between two groups. (C) Significance and direction following two–sample’s t–tests (CE–HC) on each pairwise correlation are depicted as the –sign (t value) log10 (p value); the CER-AN, SMN-VN, SN-DMN, and DMN-VN connections were found to be significantly altered between two groups (p < 0.05). (D). CE, comitant exotropia; HC, healthy control; lECN, left executive control network; DAN, dorsal attention network; CER, cerebellum network; RECN, right executive control network; VN, visual network; DMN, default mode network; SN, salience network; SMN, sensorimotor network; AN, auditory network.
Discussion
To our knowledge, this is the first study to investigate the effects of impaired stereoscopic vision on large-scale resting-state FNC in CE patients using the ICA method. Compared with the HC group, the CE group showed increased intranetwork FC in the bilateral postcentral gyrus of the SMN; it also showed decreased intranetwork FC in the right cerebellum_8 of the CER, the right superior temporal gyrus of the AN, and the right middle occipital gyrus of the VN. Moreover, CER-AN, SMN-VN, SN-DMN, and DMN-VN connections were significantly altered between the two groups.
Altered Intranetwork Functional Connectivity in the Comitant Exotropia Group
The CE group showed decreased intranetwork FC in the right cerebellum_8 of the CER. The CER is closely related to movement and balance functions. Moreover, the cerebellum is important for controlling eye movements and binocular disparity (Gulyas and Roland, 1994; Versino et al., 1996; Beh et al., 2017). Ouyang et al. (2017) reported that comitant strabismus patients showed changes in gray matter volume in the left cerebellum. Musazadeh et al. (2004) reported that cerebellar tumors caused esotropia. Leguire et al. (2011) demonstrated that patients with idiopathic infantile nystagmus syndrome exhibited significant activation increases in the declive of the cerebellum. Consistent with these prior reports, we found that the CE group had decreased functional connectivity in the right cerebellum_8 of the CER, which might lead to impaired eye movement and binocular vision in CE patients.
Notably, the CE group exhibited increased intranetwork FC in the bilateral postcentral gyrus of the SMN. The postcentral gyrus (i.e., the sensorimotor gyrus) has an important role in proprioception, which implies involvement in providing sensory information that helps to control voluntary movement. Sweeney et al. (2007) demonstrated that sensorimotor brain systems have critical roles in eye movement control, while van Beers et al. (2001) reported that sensorimotor integration is involved in the localization of static objects during smooth pursuit eye movements. Sensorimotor function is also closely related to the formation of stereovision (Ringach et al., 1996). Here, we found that CE patients showed decreased functional connectivity within the SMN, which might lead to the impaired eye movements and stereoscopic vision observed in such patients.
The AN is located in the temporal lobe, which is involved in auditory information processing. The CE group showed decreased intranetwork FC in the right superior temporal gyrus of the AN. There are close relationships between the visual and auditory systems; cross-modal interactions between these systems have been observed in patients with vision loss (Collignon et al., 2007; Lunghi et al., 2014). Petrus et al. (2015) demonstrated that vision loss contributes to cross-modal interactions between the primary auditory and visual cortices. To our knowledge, no studies have shown that the loss of stereovision might contribute to auditory dysfunction. In the present study, the CE group showed decreased functional connectivity within the AN, which might lead to the loss of stereoscopic vision and thus contribute to auditory dysfunction. In the future, we plan to investigate the underlying neural mechanism of AN dysfunction in CE patients.
Furthermore, we found that the CE group showed decreased intranetwork FC in the right middle occipital gyrus of the VN. The VN is located in the occipital cortex, which is involved in visual information processing. Wong et al. (2005) revealed metabolic suppression in the visual cortices of strabismic macaques (Economides et al., 2021). Additionally, Yan et al. (2019) reported that CE patients had increased functional connectivity between the primary visual cortex and other brain areas. Yang et al. (2014) found that the infantile esotropia group showed lower BOLD signals in the left cingulate gyrus, bilateral precuneus, and left angular gyrus during a visual stimulus, compared with controls. Yan et al. (2010) reported that adult strabismus patients had decreased white matter volumes in the right middle occipital gyrus and right occipital lobe/cuneus. Consistent with these prior reports, we also found that the CE group showed decreased functional connectivity within the VN.
Finally, FNC analysis showed that CER-AN, SMN-VN, SN-DMN, and DMN-VN connections were significantly altered between the two groups. We speculate that altered interactions among these networks might lead to RSN compensation in CE patients with stereoscopic vision loss.
Some limitations should be acknowledged in this study. First, the sample size of CE patients in our study was small. Second, RSN values based on fMRI signals would still be affected by physiological noise, such as cardiac and respiratory activity.
Conclusion
Comitant exotropia patients had abnormal brain networks related to the CER, SMN, AN, and VN. Our results offer important insights into the neural mechanisms of eye movements and stereoscopic vision dysfunction in CE patients.
Data Availability Statement
The raw data supporting the conclusions of this article will be made available by the authors, without undue reservation.
Ethics Statement
The studies involving human participants were reviewed and approved by the Medical Ethics Committee of the Jiangxi Provincial People’s Hospital Affiliated to Nanchang University. Written informed consent to participate in this study was provided by the participants’ legal guardian/next of kin.
Author Contributions
HJ, R-BC, Y-LZ, P-HL, and XH contributed to data collection and statistical analyses and wrote the manuscript and designed the protocol, and contributed to the MRI analysis. HJ, R-BC, and Y-LZ designed the study and oversaw all clinical aspects of study conduct and manuscript preparation. All authors contributed to the article and approved the submitted version.
Conflict of Interest
The authors declare that the research was conducted in the absence of any commercial or financial relationships that could be construed as a potential conflict of interest.
Publisher’s Note
All claims expressed in this article are solely those of the authors and do not necessarily represent those of their affiliated organizations, or those of the publisher, the editors and the reviewers. Any product that may be evaluated in this article, or claim that may be made by its manufacturer, is not guaranteed or endorsed by the publisher.
Acknowledgments
We acknowledge the assistance provided by the Natural Science Foundation of Jiangxi Province (20192BAB205048 and 20212BAB216058), the National Nature Science Foundation of China (grant no. 81060080), and the Jiangxi Provincial Health Technology Project (202210012).
Footnotes
References
Abed Rabbo, F., Koch, G., Lefevre, C., and Seizeur, R. (2018). Stereoscopic visual area connectivity: a diffusion tensor imaging study. Surg. Radiol. Anat. 40, 1197–1208. doi: 10.1007/s00276-018-2076-3
Auer, D. P. (2008). Spontaneous low-frequency blood oxygenation level-dependent fluctuations and functional connectivity analysis of the ‘resting’ brain. Magn. Reson. Imaging 26, 1055–1064. doi: 10.1016/j.mri.2008.05.008
Backus, B. T., Fleet, D. J., Parker, A. J., and Heeger, D. J. (2001). Human cortical activity correlates with stereoscopic depth perception. J. Neurophysiol. 86, 2054–2068. doi: 10.1152/jn.2001.86.4.2054
Ban, H., Preston, T. J., Meeson, A., and Welchman, A. E. (2012). The integration of motion and disparity cues to depth in dorsal visual cortex. Nat. Neurosci. 15, 636–643. doi: 10.1038/nn.3046
Beh, S. C., Frohman, T. C., and Frohman, E. M. (2017). Cerebellar Control of Eye Movements. J. Neuroophthalmol. 37, 87–98. doi: 10.1097/WNO.0000000000000456
Biswal, B., Yetkin, F. Z., Haughton, V. M., and Hyde, J. S. (1995). Functional connectivity in the motor cortex of resting human brain using echo-planar MRI. Magn. Reson. Med. 34, 537–541. doi: 10.1002/mrm.1910340409
Chen, H., Shi, M., Zhang, H., Zhang, Y. D., Geng, W., Jiang, L., et al. (2019). Different patterns of functional connectivity alterations within the default-mode network and sensorimotor network in basal ganglia and pontine stroke. Med. Sci. Monit. 25, 9585–9593. doi: 10.12659/MSM.918185
Chen, N., Chen, Z., and Fang, F. (2020). Functional specialization in human dorsal pathway for stereoscopic depth processing. Exp. Brain Res. 238, 2581–2588. doi: 10.1007/s00221-020-05918-4
Chopin, A., Chan, S. W., Guellai, B., Bavelier, D., and Levi, D. M. (2019). Binocular non-stereoscopic cues can deceive clinical tests of stereopsis. Sci. Rep. 9:5789. doi: 10.1038/s41598-019-42149-2
Collignon, O., Lassonde, M., Lepore, F., Bastien, D., and Veraart, C. (2007). Functional cerebral reorganization for auditory spatial processing and auditory substitution of vision in early blind subjects. Cereb. Cortex 17, 457–465. doi: 10.1093/cercor/bhj162
Damoiseaux, J. S., Rombouts, S. A., Barkhof, F., Scheltens, P., Stam, C. J., Smith, S. M., et al. (2006). Consistent resting-state networks across healthy subjects. Proc. Natl. Acad. Sci. U. S. A. 103, 13848–13853. doi: 10.1073/pnas.0601417103
Du, Y., Pearlson, G. D., Liu, J., Sui, J., Yu, Q., He, H., et al. (2015). A group ICA based framework for evaluating resting fMRI markers when disease categories are unclear: application to schizophrenia, bipolar, and schizoaffective disorders. Neuroimage 122, 272–280. doi: 10.1016/j.neuroimage.2015.07.054
Economides, J. R., Adams, D. L., and Horton, J. C. (2021). Interocular suppression in primary visual cortex in strabismus. J. Neurosci. 41, 5522–5533. doi: 10.1523/JNEUROSCI.0044-21.2021
Feng, X., Zhang, X., and Jia, Y. (2015). Improvement in fusion and stereopsis following surgery for intermittent exotropia. J. Pediatr. Ophthalmol. Strabismus 52, 52–57. doi: 10.3928/01913913-20141230-08
Gillebert, C. R., Schaeverbeke, J., Bastin, C., Neyens, V., Bruffaerts, R., De Weer, A. S., et al. (2015). 3D shape perception in posterior cortical atrophy: a visual neuroscience perspective. J. Neurosci. 35, 12673–12692. doi: 10.1523/JNEUROSCI.3651-14.2015
Goncalves, N. R., Ban, H., Sanchez-Panchuelo, R. M., Francis, S. T., Schluppeck, D., and Welchman, A. E. (2015). 7 tesla FMRI reveals systematic functional organization for binocular disparity in dorsal visual cortex. J. Neurosci. 35, 3056–3072. doi: 10.1523/JNEUROSCI.3047-14.2015
Govindan, M., Mohney, B. G., Diehl, N. N., and Burke, J. P. (2005). Incidence and types of childhood exotropia: a population-based study. Ophthalmology 112, 104–108. doi: 10.1016/j.ophtha.2004.07.033
Gulyas, B., and Roland, P. E. (1994). Processing and analysis of form, colour and binocular disparity in the human brain: functional anatomy by positron emission tomography. Eur. J. Neurosci. 6, 1811–1828. doi: 10.1111/j.1460-9568.1994.tb00574.x
Kong, F., Xue, S., and Wang, X. (2016). Amplitude of low frequency fluctuations during resting state predicts social well-being. Biol. Psychol. 118, 161–168. doi: 10.1016/j.biopsycho.2016.05.012
Leguire, L. E., Kashou, N. H., Fogt, N., Smith, M. A., Lewis, J. R., Kulwin, R., et al. (2011). Neural circuit involved in idiopathic infantile nystagmus syndrome based on FMRI. J. Pediatr. Ophthalmol. Strabismus 48, 347–356. doi: 10.3928/01913913-20110118-03
Li, Y., Zhang, C., Hou, C., Yao, L., Zhang, J., and Long, Z. (2017). Stereoscopic processing of crossed and uncrossed disparities in the human visual cortex. BMC Neurosci. 18:80. doi: 10.1186/s12868-017-0395-7
Lunghi, C., Morrone, M. C., and Alais, D. (2014). Auditory and tactile signals combine to influence vision during binocular rivalry. J. Neurosci. 34, 784–792. doi: 10.1523/JNEUROSCI.2732-13.2014
Musazadeh, M., Hartmann, K., and Simon, F. (2004). Late onset esotropia as first symptom of a cerebellar tumor. Strabismus 12, 119–123. doi: 10.1080/09273970490517557
Ohzawa, I., DeAngelis, G. C., and Freeman, R. D. (1990). Stereoscopic depth discrimination in the visual cortex: neurons ideally suited as disparity detectors. Science 249, 1037–1041. doi: 10.1126/science.2396096
Oishi, H., Takemura, H., Aoki, S. C., Fujita, I., and Amano, K. (2018). Microstructural properties of the vertical occipital fasciculus explain the variability in human stereoacuity. Proc. Natl. Acad. Sci. U. S. A. 115, 12289–12294. doi: 10.1073/pnas.1804741115
Oke, O. O., Magony, A., Anver, H., Ward, P. D., Jiruska, P., Jefferys, J. G., et al. (2010). High-frequency gamma oscillations coexist with low-frequency gamma oscillations in the rat visual cortex in vitro. Eur. J. Neurosci. 31, 1435–1445. doi: 10.1111/j.1460-9568.2010.07171.x
Ouyang, J., Yang, L., Huang, X., Zhong, Y. L., Hu, P. H., Zhang, Y., et al. (2017). The atrophy of white and gray matter volume in patients with comitant strabismus: evidence from a voxel-based morphometry study. Mol. Med. Rep. 16, 3276–3282. doi: 10.3892/mmr.2017.7006
Parker, A. J. (2007). Binocular depth perception and the cerebral cortex. Nat. Rev. Neurosci. 8, 379–391. doi: 10.1038/nrn2131
Petrus, E., Rodriguez, G., Patterson, R., Connor, B., Kanold, P. O., and Lee, H. K. (2015). Vision loss shifts the balance of feedforward and intracortical circuits in opposite directions in mouse primary auditory and visual cortices. J. Neurosci. 35, 8790–8801. doi: 10.1523/JNEUROSCI.4975-14.2015
Prins, D., Jansonius, N. M., and Cornelissen, F. W. (2017). Loss of binocular vision in monocularly blind patients causes selective degeneration of the superior lateral occipital cortices. Invest. Ophthalmol. Vis. Sci. 58, 1304–1313. doi: 10.1167/iovs.16-20404
Ringach, D. L., Hawken, M. J., and Shapley, R. (1996). Binocular eye movements caused by the perception of three-dimensional structure from motion. Vision Res. 36, 1479–1492. doi: 10.1016/0042-6989(95)00285-5
Shirer, W. R., Ryali, S., Rykhlevskaia, E., Menon, V., and Greicius, M. D. (2012). Decoding subject-driven cognitive states with whole-brain connectivity patterns. Cereb. Cortex 22, 158–165. doi: 10.1093/cercor/bhr099
Smith, S. M., Fox, P. T., Miller, K. L., Glahn, D. C., Fox, P. M., Mackay, C. E., et al. (2009). Correspondence of the brain’s functional architecture during activation and rest. Proc. Natl. Acad. Sci. U. S. A. 106, 13040–13045. doi: 10.1073/pnas.0905267106
Sweeney, J. A., Luna, B., Keedy, S. K., McDowell, J. E., and Clementz, B. A. (2007). fMRI studies of eye movement control: investigating the interaction of cognitive and sensorimotor brain systems. Neuroimage 36, T54–T60. doi: 10.1016/j.neuroimage.2007.03.018
van Beers, R. J., Wolpert, D. M., and Haggard, P. (2001). Sensorimotor integration compensates for visual localization errors during smooth pursuit eye movements. J. Neurophysiol. 85, 1914–1922. doi: 10.1152/jn.2001.85.5.1914
van de Ven, V. G., Formisano, E., Prvulovic, D., Roeder, C. H., and Linden, D. E. (2004). Functional connectivity as revealed by spatial independent component analysis of fMRI measurements during rest. Hum. Brain Mapp. 22, 165–178. doi: 10.1002/hbm.20022
Van Dijk, K. R., Sabuncu, M. R., and Buckner, R. L. (2012). The influence of head motion on intrinsic functional connectivity MRI. Neuroimage 59, 431–438. doi: 10.1016/j.neuroimage.2011.07.044
Versino, M., Hurko, O., and Zee, D. S. (1996). Disorders of binocular control of eye movements in patients with cerebellar dysfunction. Brain 119, 1933–1950. doi: 10.1093/brain/119.6.1933
Wang, D., Qin, W., Liu, Y., Zhang, Y., Jiang, T., and Yu, C. (2014). Altered resting-state network connectivity in congenital blind. Hum. Brain Mapp. 35, 2573–2581. doi: 10.1002/hbm.22350
Wong, A. M., Burkhalter, A., and Tychsen, L. (2005). Suppression of metabolic activity caused by infantile strabismus and strabismic amblyopia in striate visual cortex of macaque monkeys. J. AAPOS 9, 37–47. doi: 10.1016/j.jaapos.2004.09.004
Yan, C. G., Wang, X. D., Zuo, X. N., and Zang, Y. F. (2016). DPABI: data processing & analysis for (resting-state) brain imaging. Neuroinformatics 14, 339–351. doi: 10.1007/s12021-016-9299-4
Yan, X., Lin, X., Wang, Q., Zhang, Y., Chen, Y., Song, S., et al. (2010). Dorsal visual pathway changes in patients with comitant extropia. PLoS One 5:e10931. doi: 10.1371/journal.pone.0010931
Yan, X., Wang, Y., Xu, L., Liu, Y., Song, S., Ding, K., et al. (2019). Altered functional connectivity of the primary visual cortex in adult comitant strabismus: a resting-state functional MRI study. Curr. Eye Res. 44, 316–323. doi: 10.1080/02713683.2018.1540642
Yang, X., Zhang, J., Lang, L., Gong, Q., and Liu, L. (2014). Assessment of cortical dysfunction in infantile esotropia using fMRI. Eur. J. Ophthalmol. 24, 409–416. doi: 10.5301/ejo.5000368
Zheng, H., Yao, L., Chen, M., and Long, Z. (2020). 3D contrast image reconstruction from human brain activity. IEEE Trans. Neural Syst. Rehabil. Eng. 28, 2699–2710. doi: 10.1109/TNSRE.2020.3035818
Keywords: comitant exotropia, independent component analysis, resting-state networks, functional connectivity, functional network connectivity, fMRI
Citation: Jin H, Chen R-B, Zhong Y-L, Lai P-H and Huang X (2022) Effect of Impaired Stereoscopic Vision on Large-Scale Resting-State Functional Network Connectivity in Comitant Exotropia Patients. Front. Neurosci. 16:833937. doi: 10.3389/fnins.2022.833937
Received: 12 December 2021; Accepted: 31 January 2022;
Published: 08 March 2022.
Edited by:
Yu-Chen Chen, Nanjing Medical University, ChinaReviewed by:
Xiuxiu Qin, Southern Medical University, ChinaWen-Qing Shi, Fudan University, China
Jyothilakshmi Vasavan, Algonquin College, Canada
Vijaya Prakash Krishnan Muthaiah, University at Buffalo, United States
Copyright © 2022 Jin, Chen, Zhong, Lai and Huang. This is an open-access article distributed under the terms of the Creative Commons Attribution License (CC BY). The use, distribution or reproduction in other forums is permitted, provided the original author(s) and the copyright owner(s) are credited and that the original publication in this journal is cited, in accordance with accepted academic practice. No use, distribution or reproduction is permitted which does not comply with these terms.
*Correspondence: Xin Huang, MjAxNzEwMzAyMDAzNUB3aHUuZWR1LmNu
†These authors have contributed equally to this work