 Guangjie Yuan
 Wenguang He4
 Guangyuan Liu
- 1College of Electronic and Information Engineering, Southwest University, Chongqing, China
- 2Institute of Affective Computing and Information Processing, Southwest University, Chongqing, China
- 3Chongqing Key Laboratory of Nonlinear Circuits and Intelligent Information Processing, Southwest University, Chongqing, China
- 4College of Psychology, Qufu Normal University, Qufu, China
- 5Key Laboratory of Cognition and Personality, Ministry of Education, Faculty of Psychology, Southwest University, Chongqing, China
Initial romantic attraction (IRA) refers to a series of positive reactions toward potential ideal partners based on individual preferences; its evolutionary value lies in facilitating mate selection. Although the EEG activities associated with IRA have been preliminarily understood; however, it remains unclear whether IRA can be recognized based on EEG activity. To clarify this, we simulated a dating platform similar to Tinder. Participants were asked to imagine that they were using the simulated dating platform to choose the ideal potential partner. Their brain electrical signals were recorded as they viewed photos of each potential partner and simultaneously assessed their initial romantic attraction in that potential partner through self-reported scale responses. Thereafter, the preprocessed EEG signals were decomposed into power-related features of different frequency bands using a wavelet transform approach. In addition to the power spectral features, feature extraction also accounted for the physiological parameters related to hemispheric asymmetries. Classification was performed by employing a random forest classifier, and the signals were divided into two categories: IRA engendered and IRA un-engendered. Based on the results of the 10-fold cross-validation, the best classification accuracy 85.2% (SD = 0.02) was achieved using feature vectors, mainly including the asymmetry features in alpha (8–13 Hz), beta (13–30 Hz), and theta (4–8 Hz) rhythms. The results of this study provide early evidence for EEG-based mate preference recognition and pave the way for the development of EEG-based romantic-matching systems.
Introduction
Finding an ideal partner is a prerequisite for achieving high-quality romantic relationships. However, finding an ideal partner in real life can be extremely challenging (Spielmann et al., 2013; Joel et al., 2017). Because mate selection is not only a multivariate process involving the integration and trade-offs of multiple preferences but is also influenced by many factors, such as gender, culture, and personal experience (Buston and Emlen, 2003; Thomas et al., 2020). However, opportunities always coexist with these challenges. This is precisely because of the challenge of this task, which has created a huge economic market for matchmaking services (Joel et al., 2017). In this market, matchmaking agencies strive to provide customers with “tailored” romantic matching services and earn huge returns on this. The success of such a business model hinges on finding key features from appropriate signals that can effectively identify a user’s initial romantic interest toward a potential partner, as this largely determines the effectiveness of a matching service and consequently whether a user is willing to pay for it (Joel et al., 2017).
The current mainstream approach taken by matchmaking companies is that when users register for romantic matching services, they are required to fill in a series of questionnaires about their own characteristics and preferences based on their subjective feelings; these answers will then be fed into the matching algorithm as features to match suitable potential partners for users. Many matchmaking companies claim that effective romantic pairing can be achieved in this manner (Joel et al., 2017). However, Joel et al. (2017) demonstrated that it was impossible to predict initial romantic desire using any combination of traits and preferences reported prior to dating. In other words, effective romantic pairing cannot be achieved using this method. For matchmaking companies that take this as the core selling point, this conclusion is undoubtedly very destructive. However, from the perspective of psychology, this conclusion is undoubtedly reasonable, because the self-reported data are easily affected by subjective consciousness and the surrounding environment, which makes many characteristics of the input matching algorithm invalid, thereby invalidating the matching algorithm (Lin et al., 2010; Alarcao and Fonseca, 2019).
The essence of initial romantic attraction (IRA) is a series of positive responses to potential ideal partners based on individual preferences, including positive emotional responses (such as feelings of exhilaration and craving for emotional union) (Fisher, 1998; Fisher et al., 2002, 2005; Gerlach and Reinhard, 2018; Yuan and Liu, 2021; Yuan et al., 2021). An individual’s internal emotional reaction can be revealed not only through subjective self-reports but also through internal expression (i.e., physiological signals) (Gunes et al., 2011; Alarcao and Fonseca, 2019). Moreover, physiological signals have many advantages over self-reported data, one of which is that they are less susceptible to subjective consciousness and environmental factors (Lin et al., 2010; Alarcao and Fonseca, 2019). Thus, these signals open up new possibilities for identifying users’ emotional responses and preferences for potential partners. For instance, Zhang et al. (2021) successfully identified participants’ initial romantic interest to potential partners based on the features extracted from electrocardiogram signals, while Lu et al. (2020) successfully detected participants’ initial romantic desire to potential romantic partners based on the information extracted from photoplethysmogram signals. These results demonstrate that IRA, as an important part of human emotion, can be recognized on the basis of periphery physiological signals (Lu et al., 2020; Zhang et al., 2021).
In addition to periphery physiological signals, signals captured from the central nervous system, such as EEG, functional magnetic resonance imaging, or positron emission tomography, have also been proved to provide informative information for emotion recognition (Lin et al., 2010; Alarcao and Fonseca, 2019). Furthermore, among the many biosignals recorded over the brain, EEG is considered to a preferred method in studying the brain’s response to emotional stimuli due to its characters of high temporal resolution, non-invasive, inexpensive and convenient (Niemic, 2004; Alarcao and Fonseca, 2019). Therefore, in the field of neurophysiology, some studies have begun to investigate brain activities associated with IRA based on EEG signals. For instance, using event-related potential source analysis, Yuan et al. (2021) found that the arousal of IRA will significantly enhance the activation intensity of emotional processing-related areas, including the orbital frontal cortex and insula; attention control-related areas, including the frontal eye field and cingulate cortex; visual processing-related areas; and social evaluation-related areas, including the left dorsolateral prefrontal cortex. In another study, Yuan and Liu (2021) used time–frequency (TF) decomposition technology and found that processing of individual face preferences that triggered IRA was associated with a decrease in power in the alpha and lower beta bands over the lateral occipital complex and vertex areas; they hypothesized that changes in alpha and beta power may reflect cortical activation related to emotional stimulus significance (Schubring and Schupp, 2019, 2021). In addition, numerous neuropsychological studies have demonstrated that the asymmetry between the two hemispheres of the frequency band (FB) (especially the alpha and beta bands) was correlated with emotional activities and preferences (Balconi and Mazza, 2009; Liu et al., 2011; Hadjidimitriou and Hadjileontiadis, 2012; Huang et al., 2012; Jatupaiboon et al., 2013; Alarcao and Fonseca, 2019).
In the field of neuroeconomics, although EEG signals have not been used to identify users’ emotional responses and preferences toward potential partners, they have been widely used to identify users’ emotional responses and preferences to other stimuli (Aldayel et al., 2020a,b,c, 2021; Khurana et al., 2021; Naser and Saha, 2021; Zheng et al., 2021). Among previous studies, many researchers have used frequency bands (FBs) as features (Aldayel et al., 2020c,2021; Khurana et al., 2021; Naser and Saha, 2021; Zheng et al., 2021). For example, Chew et al. (2016) measured the preference of virtual three-dimensional shapes using band power as a feature for two preference categories and obtained accuracies of up to 80%. Aldayel et al. (2020b) measured the preference of consumer using frequency bands features as the feature for two preference categories and obtained accuracies of up to 93%. Meanwhile, several studies on preference also used hemispheric asymmetry scores (ASs) as input features (Aldayel et al., 2020a,b; Naser and Saha, 2021). For instance, Hadjidimitriou and Hadjileontiadis (2013) measured the preference of music using band power and hemispheric ASs as features for two preference categories using the k-nearest neighbors to obtain accuracies of up to 86.52%. Moon measured the preference of visual stimuli using band power and hemispheric ASs as features for four preference categories, achieving accuracies of up to 97.39% (Moon, 2013; Chew et al., 2016).
Although EEG signals have been widely used to identify users’ emotional responses and preferences to other stimuli, and EEG activities associated with IRA have also been preliminarily understood, whether users’ emotional responses and preferences toward potential partners can be identified on the basis of EEG signals remains unclear. To clarify this, we simulated a mate selection platform similar to Tinder. Participants were asked to imagine that they used the platform to select potentially desirable partners. Their EEG signals were recorded when they viewed and rated the photographs of each potential partner according to their preferences. Specifically, during the EEG recording task, the heterosexual participants were asked to rate photos of opposite-sex potential partners on two dimensions: an four-point IRA rating scale (based on the question “How much would you like to date this person?”; response: “not at all,” “a little,” “somewhat,” or “very much”) as well as a three-point zero-acquaintance rating scale (based on the question “Have you ever seen the person in the photo before?”; responses: “no,” “not sure,” or “yes”) (Yuan and Liu, 2021; Yuan et al., 2021). The IRA scale was used to assess the romantic interest of participants toward potential romantic partners, because the desire for emotional union with potential partner is one of the main characteristics of initial romantic attraction arousal. The zero acquaintance scale was used to ensure that participants were at the same level of familiarity with the stimulus material. Numerous studies have demonstrated that the random forest classifier (RFC) performs well in preference classification tasks based on EEG signals; therefore, in this study, the RFC was used to classify and detect the users’ IRA toward potential partners based on features obtained through TF analyses.
Materials and Methods
Both the auxiliary experiment and the main experiment were approved by the Ethical Review Committee of Southwest University.
Auxiliary Experiment
Participants
Sixty student volunteers participated in the auxiliary experiment (30 women and 30 men; age: 21.4 ± 2.6 years). All participants reported normal or corrected-to-normal visual acuity and had no history of psychiatric or neurological disorders, as confirmed via a screening interview.
Experimental Procedure
The induction rate of IRA has been reported to be quite low (only a few percent) (Zsok et al., 2017), the IRA induction rate should be increased to obtain enough data to train the model (Yuan and Liu, 2021; Yuan et al., 2021). Numerous studies have shown that physical attractiveness is a good predictor of a an individual’s popularity (i.e., probability of being selected by the opposite sex) with the opposite sex (Asendorpf et al., 2011; Olderbak et al., 2017; Gerlach and Reinhard, 2018; Yuan et al., 2021). Therefore, in this study, we planned to increase the average induction rate of IRA by increasing the proportion of stimuli with high physical attractiveness (Yuan and Liu, 2021; Yuan et al., 2021).
To achieve this goal, we first assessed the attractiveness level of each stimulus. To assess the attractiveness level, we first focused on downloading thousands of high-resolution personal portrait photographs from a high-definition copyright commercial photograph library (i.e., Hummingbird1) and standardized them (face and hair only; size, 839 × 1,080 pixels). To control the interference factors, we then selected 1,600 photographs from the standardized portrait photograph library; the criteria for screening the photographs were similar orientation and expression of the face and comparable background complexity. Thereafter, the physical attractiveness level of each face was assessed using a nine-point Likert scale. Notably, the male participants rated only female faces, while the female participants rated only male faces. We then calculated the average attractiveness level of each face by averaging the ratings of the same face from 30 participants of the opposite sex. Finally, according to the average attractiveness level, these faces were divided into three categories: high attractiveness [mean = 6.9, standard deviation (SD) = 0.33], medium attractiveness (mean = 5.2, SD = 0.25), and low attractiveness (mean = 3.9, SD = 0.31).
In the natural environment, the proportion of individuals with high, medium, and low attractiveness should conform to the normal distribution. However, in this study, we deliberately increased the proportion of individuals with high attractiveness, reduced the proportion of stimuli with low attractiveness, and adjusted the ratio of high, medium, and low attractiveness to 0.25:0.6:0.15 to increase the average induction rate of IRA. The number of times each participant would need to be exposed to different stimuli was determined to be between 300 and 400 after the comprehensive trade-offs of induction efficiency and participant burden. Ultimately, 360 photographs were selected as the stimulus material for the main experiment for each sex from among 800 photographs of women and 800 photographs of men (Yuan and Liu, 2021; Yuan et al., 2021).
Main Experiment
Participants
Fifty student volunteers participated in the main experiment (all single; 25 women and 25 men; age: 21.2 ± 2.4 years). All participants reported normal or corrected-to-normal visual acuity and had no history of psychiatric or neurological disorders, as confirmed via a screening interview.
Experimental Procedure
The number of stimuli used in the main experiment was significantly reduced by the aforementioned strategy; however, processing of 360 stimuli was still a high-load task for the participants. Specifically, when the participants were asked to complete the task over a short period, they were more likely to experience aesthetic fatigue, which may interfere with the experimental effect. Therefore, to minimize the probability of or delay aesthetic fatigue, we first divided 360 photographs of women (or men) equally into two sessions based on their attractiveness level and stipulated that the interval between completing the two parts of the experiment should be at least 1 day (Figure 1A). Thereafter, the 180 photographs from each session were divided equally into three runs using the same rules, and a 5–6-min break was provided between every two runs. During the rest period, the participants viewed serene landscapes while listening to soothing music. Notably, the experiment was conducted in a dark and quiet environment to keep the participants focused on the stimulus.
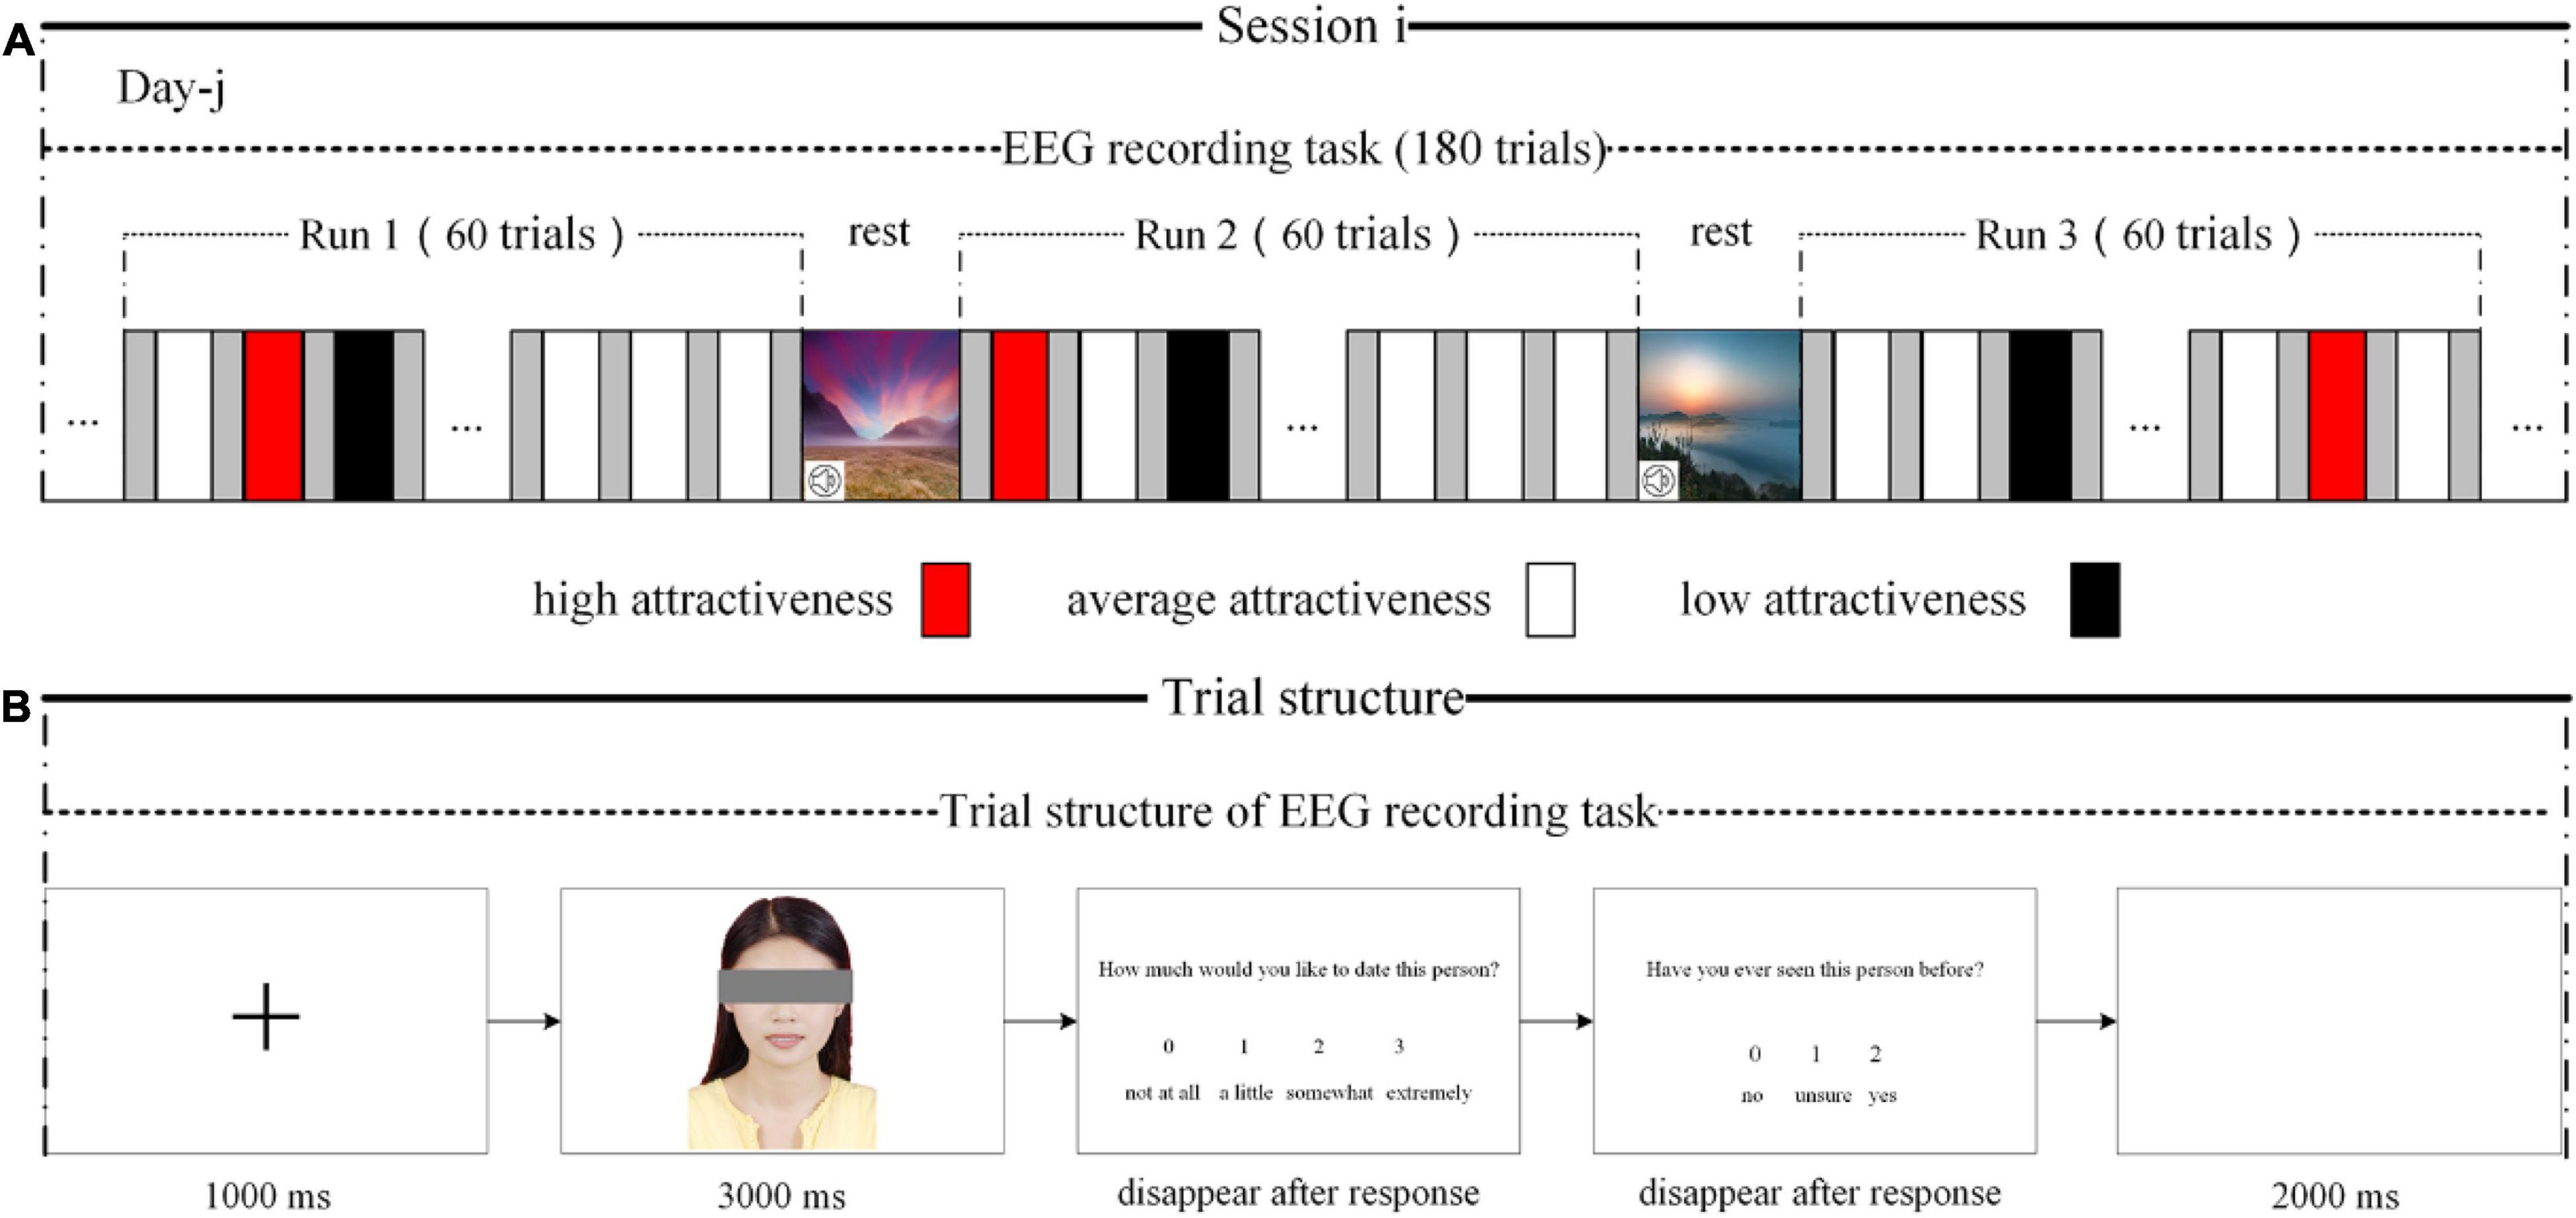
Figure 1. Experimental protocol and trial structure. (A) Experimental protocol. (B) Trial structure.
For each session, the trial structure of the EEG recording task is shown in Figure 1B. A black fixation cross appeared in the center of a white computer screen for 1,000 ms, followed by a photograph appearing for 3,000 ms. The participants were then asked to assess their romantic interest toward the potential partner based on the question, “How much would you like to date this person?” on a four-point rating scale (0 = not at all; 1 = little; 2 = somewhat; 4 = very much) (Finkel et al., 2007; Cooper et al., 2012; Gerlach and Reinhard, 2018; Yuan and Liu, 2021; Yuan et al., 2021). Thereafter, they were asked, “Have you ever seen the person in the photograph before?” (0 = no; 1 = not sure; 2 = yes). Finally, there was a 2,000-ms blank screen.
Data Acquisition and Processing
The EEG signals were recorded using the 128-channel BioSemi ActiveTwo system (BioSemi Inc., Heerlen, Netherlands) with a 24-bit analog-to-digital conversion. The 128 electrodes were equally spaced on an electrode cap and customized with an integrated primary amplifier (Figure 2). The data were filtered online at a 0.16–100-Hz band-pass filter and sampled at 512 Hz (Yuan and Liu, 2021; Yuan et al., 2021). After the completion of data acquisition, the continuous EEG signals were re-referenced offline to the average of all channels after rejecting bad segments and interpolating bad traces; the bandpass filter ranged from 0.1 to 50 Hz. An independent component analysis was used to correct electrooculography artifacts from eye movements and blinks. The preprocessed EEG signals were split into epochs from 200 ms before the presentation of the stimulus to 2,000 ms after the onset of the stimulus. EEG data analysis was conducted using the open-source MATLAB signal processing toolbox FieldTrip and in-house functions in MATLAB (Oostenveld et al., 2011).
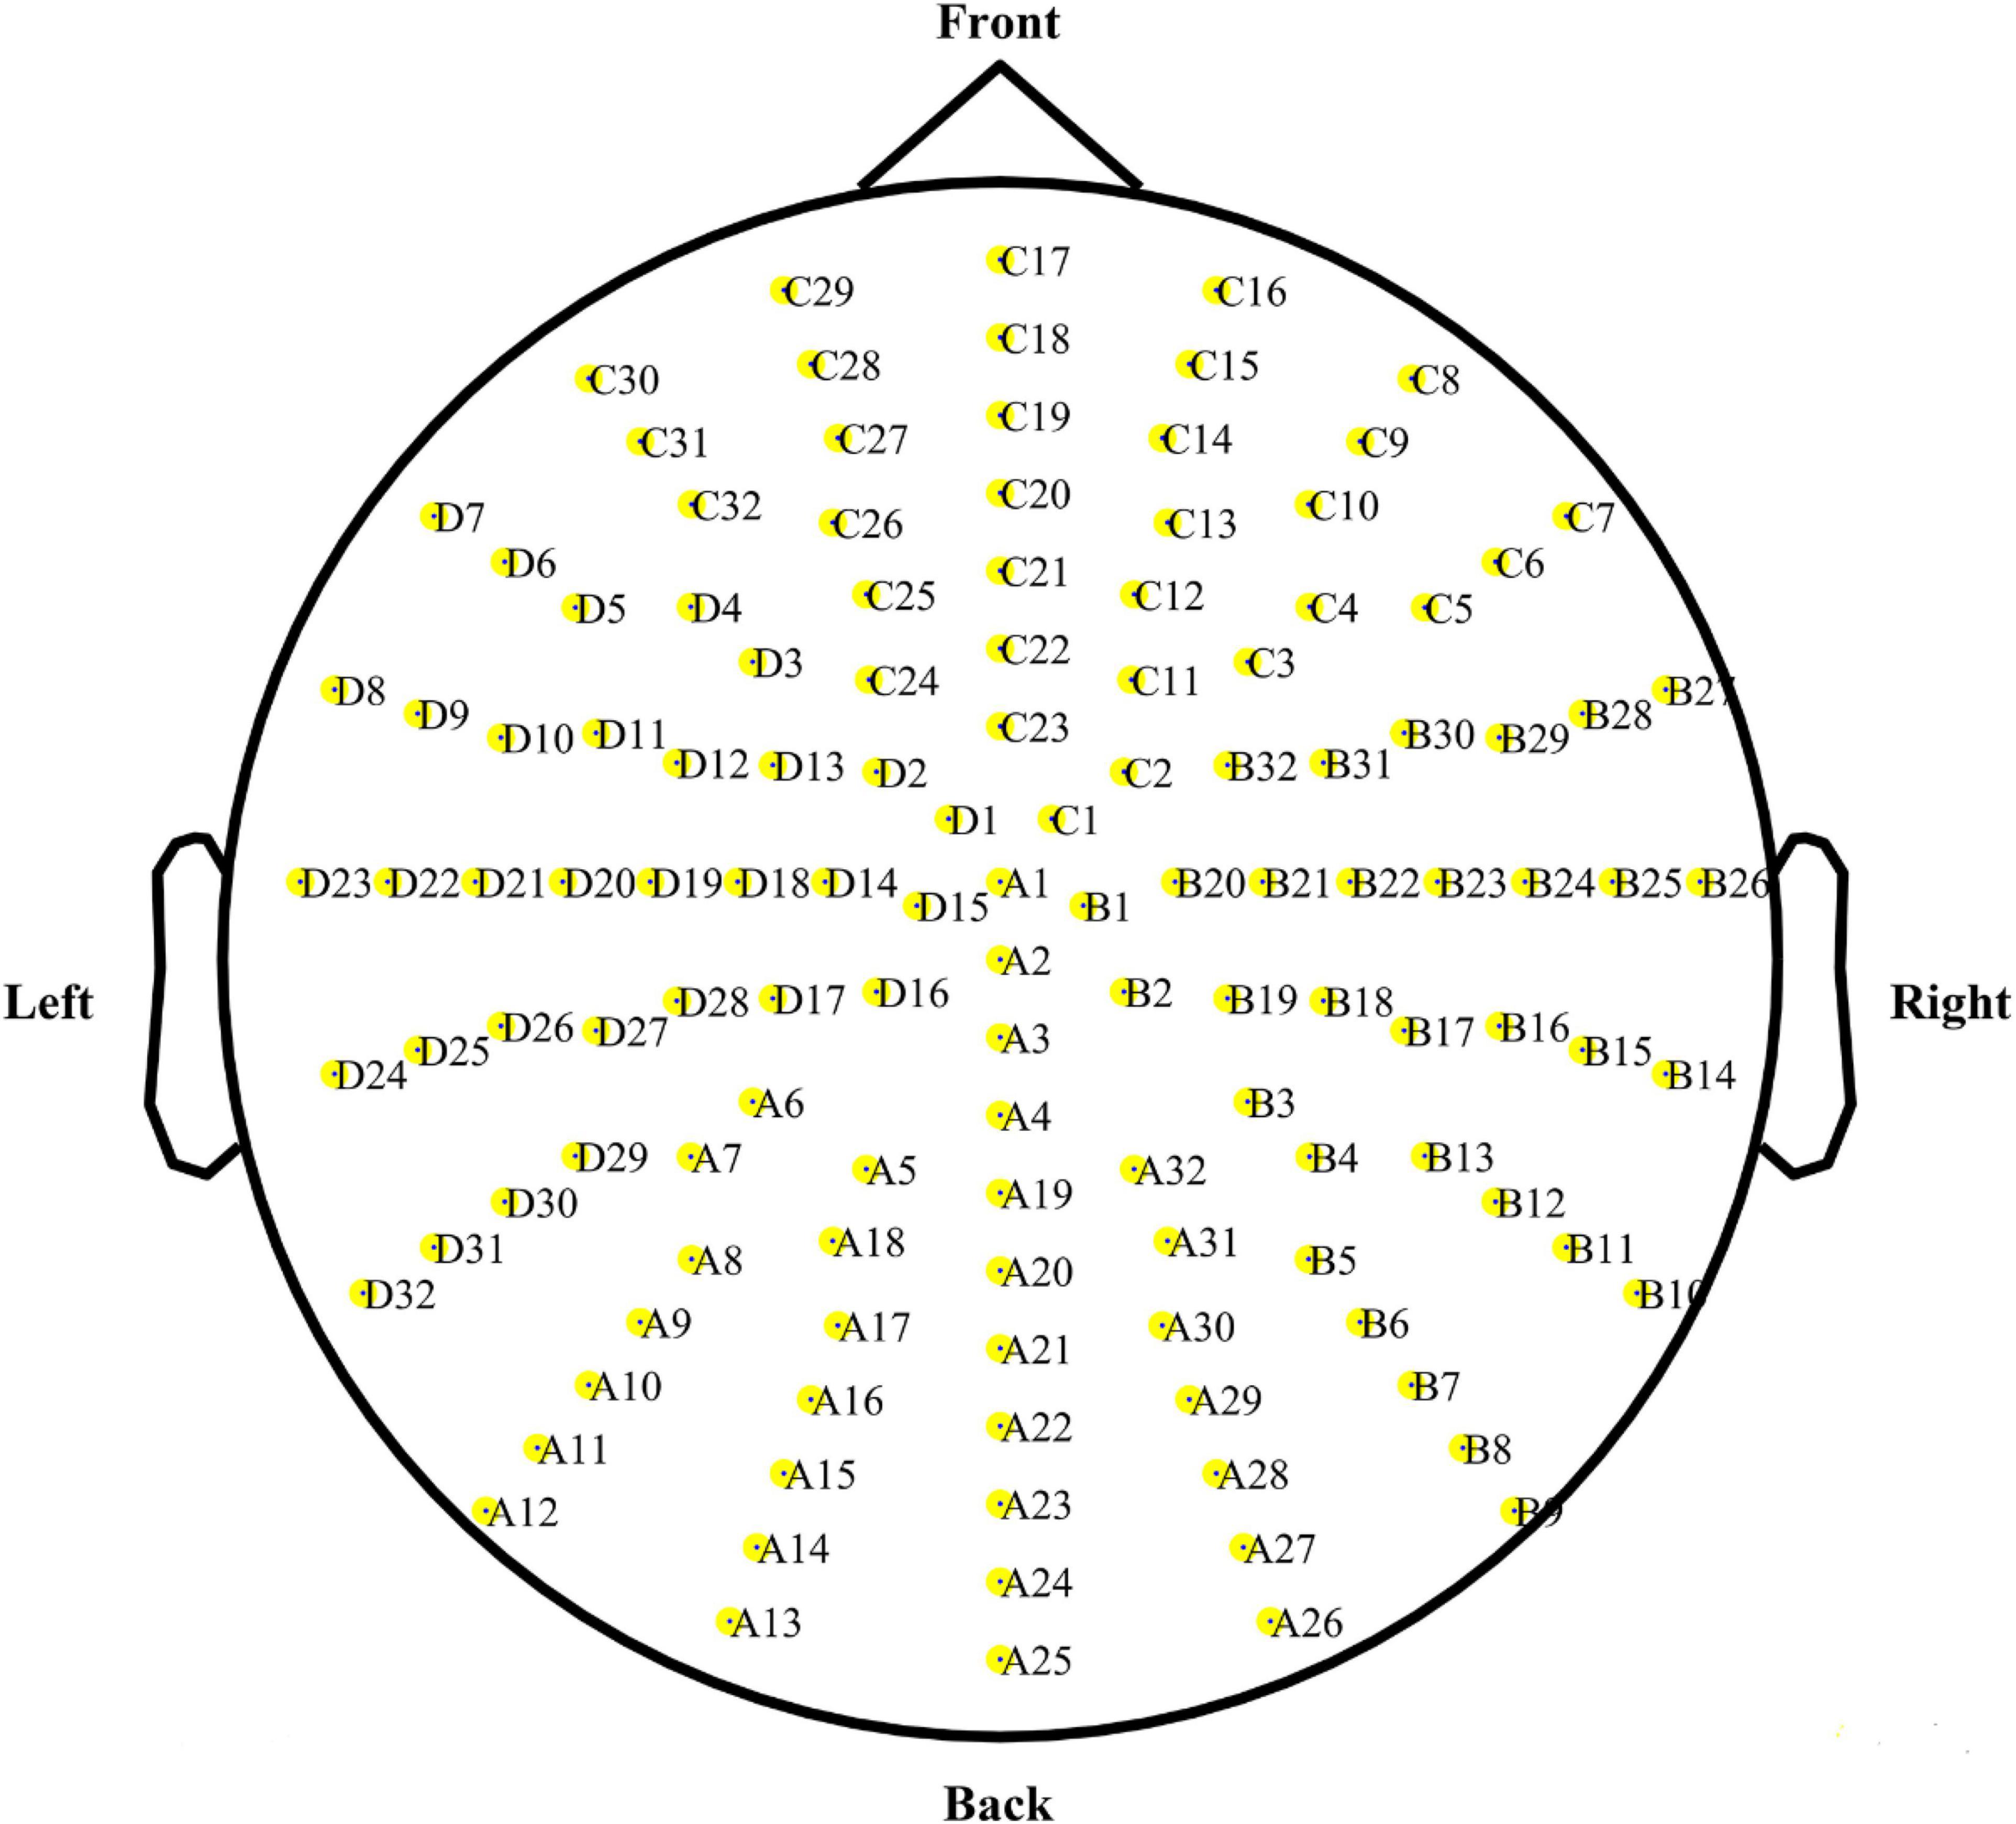
Figure 2. Electrode positions for the BioSemi activeTwo system.
According to the score for “How much would you like to date this person?,” the EEG epochs were divided into IRA engendered and IRA un-engendered (Fisher et al., 2005; Gerlach and Reinhard, 2018; Yuan and Liu, 2021; Yuan et al., 2021). The IRA engendered category comprised the epochs in which the participants rated their IRA for the potential partners as 3 (very much) or 2 (somewhat). The IRA un-engendered category comprised the epochs in which the participants rated their IRA for the potential partners as 0 (not at all). To minimize ambiguity, we excluded epochs with a rating score of 1. The number of acceptable epochs under the IRA engendered category was 1439, while the number of all acceptable data segments in the IRA un-engendered category was 15298. To solve the problem of serious mismatch in the number of samples between the two preference categories, we randomly selected a number of accepted samples under the IRA un-engendered category to match the number of accepted samples under the IRA engendered category.
Feature Extraction
To recognize the users’ discrete preferences, we used the wavelet transform (WT) with a sliding time-window approach for TF feature extraction based on the TF analysis (Lindsen et al., 2010; De Cesarei and Codispoti, 2011; Kang et al., 2015; Yuan and Liu, 2021). Specifically, the time–frequency representation (TFR) was obtained through a five-cycle complex Morlet WT. The sliding windows were advanced in 12-ms and 1-Hz increments to estimate the changes in power over time and frequency in the five FBs: delta (1–4 Hz), theta (4–8 Hz), alpha (8–13 Hz), beta (13–30 Hz), and gamma (30–49 Hz). The TF features of the EEG activities were calculated according to event-related oscillations (Pfurtscheller and Lopes da Silva, 1999; Hadjidimitriou and Hadjileontiadis, 2013; Liu et al., 2018; Yuan and Liu, 2021). In this study, two types of TF features were extracted: the power spectral feature (PSF) and the AS (i.e., difference in spectral power between the left and right hemispheres). For each epoch j and channel i, each PSF was computed as follows:
where V represents the quantity estimated during the photograph viewing (PV) period, and B represents the quantity estimated during the baseline state (BS) period. To obtain the quantity V, we averaged the TFR during the PV period over the constituent frequencies and time (2). Similarly, B was computed in the same manner as in PV, as shown in (3).
where [t, f] represents the discrete (time and frequency) points in the TF plane; TFRPV represents the obtained TFR during the PV period (Figure 3); and Nw, Nfb denote the number of sample points in the time window of 0–2 s and the number of frequency bins in each FB, respectively (Yuan and Liu, 2021). Similarly, TFRBS represents the obtained TFR during the BS period (Figure 3), and Nw, Nfb denote the number of sample points in the time window of −0.2–0 s and the number of frequency bins in each FB, respectively. Herein, a TFRBS was used to correct the emotional baseline of the TFRPV to exclude the confounding effects of other factors.
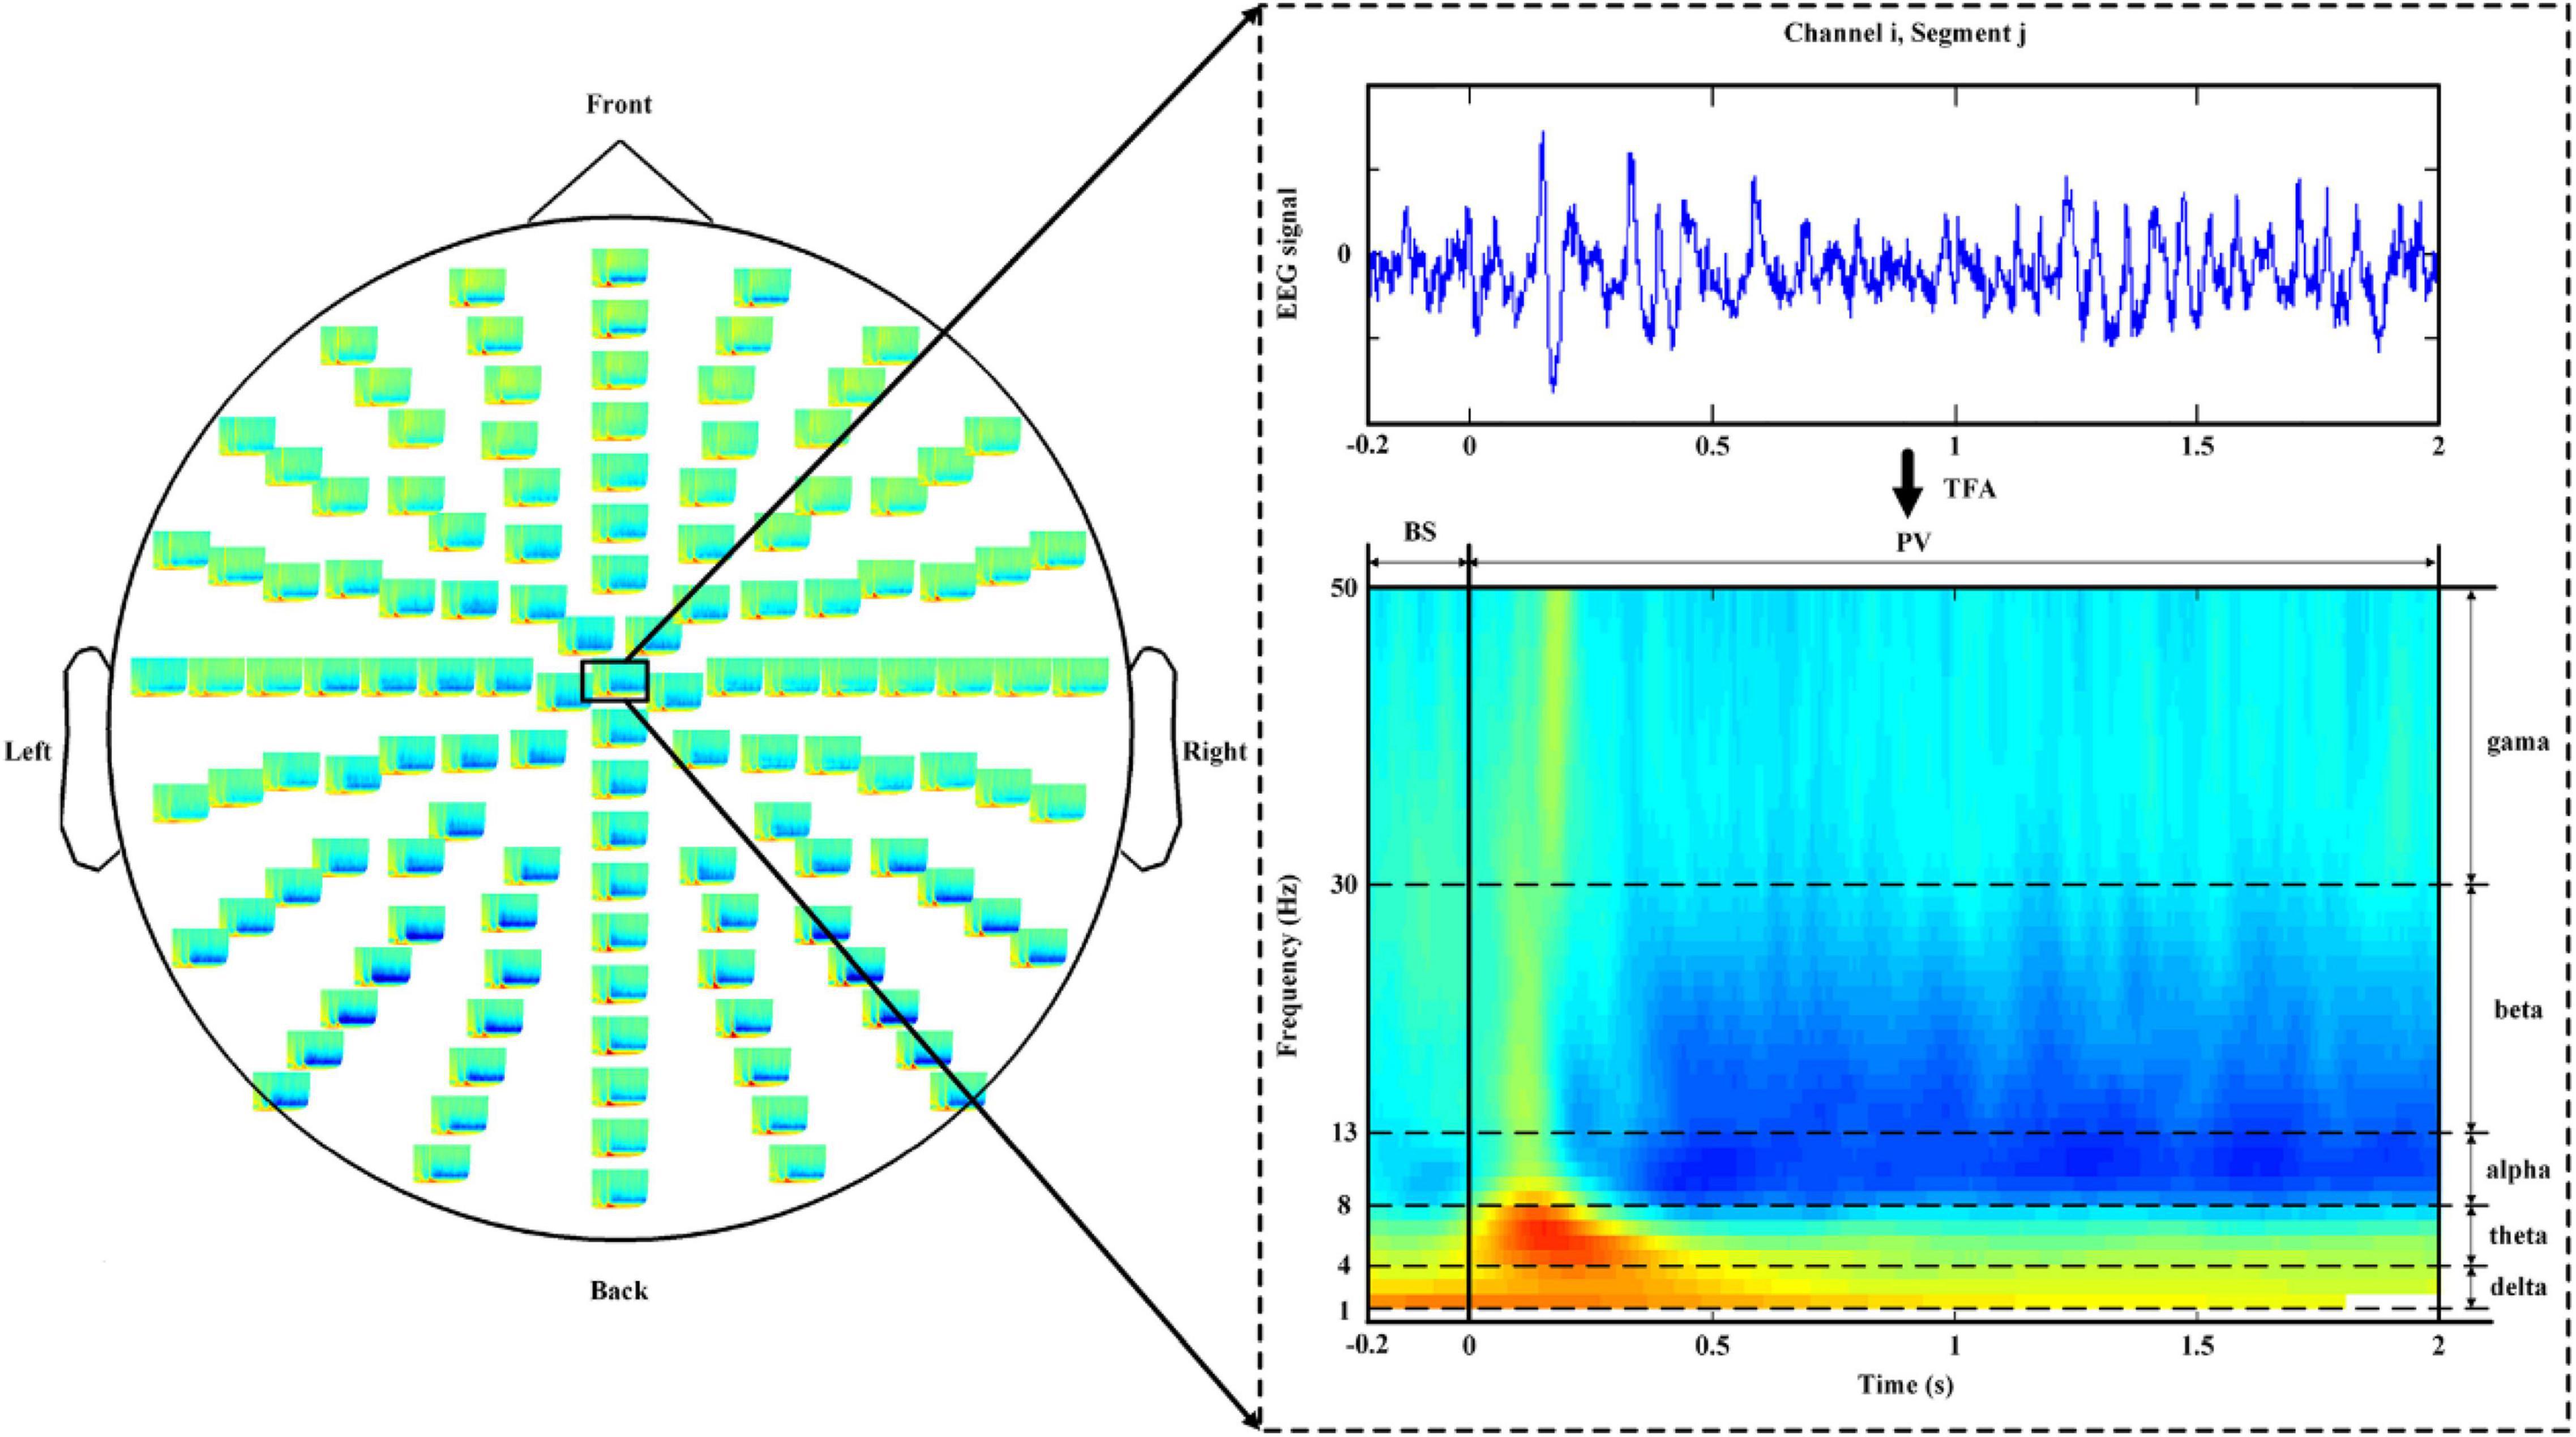
Figure 3. Time–frequency plane segmentation for the quantity estimation of B and V, from the TFP of the EEG signal corresponding to channel i and segment j. EEG, electroencephalogram. TFP, time–frequency representation.
In addition to the PSFs, the ASs of all 55 symmetrical pairs of electrodes on the left and right hemispheres in the five FBs were extracted to measure the possible lateralization of brain activity that might be caused by emotional stimuli (Liu et al., 2018; Yuan and Liu, 2021). In general, a total of 915 (640 PSFs and 275 ASs) EEG features were extracted.
Preference Recognition With Feature Selection
Nine hundred and fifteen features were extracted from the EEG signals on 128 electrodes, which is undoubtedly a high-dimensional dataset. To effectively analyze the data and save computational resources, we conducted necessary feature selection before classification (Lu et al., 2020; Zhang et al., 2021). The paired sample t-test was used to screen out the feature subsets with significant differences between the IRA engendered and IRA un-engendered categories. A total of 188 features with significant differences (p < 0.05) were identified. On this basis, the recursive feature elimination with cross-validation sequential forward feature selector (RFECV) was applied to conduct further feature selection.
To use the entire dataset to train and test the classifier, we used a nested 10-fold cross-validations to obtain reliable model estimates for feature selection and model training (Pourmohammadi and Maleki, 2020; Zhang et al., 2021). Specifically, the inner loop was responsible for selecting the optimal subset of features (Figure 4). In the outer loop and using the selected subset of features, the RFC was evaluated by unseen test data set via a subject-wise 10-fold cross-validation (Saeb et al., 2017). Thereafter, the confusion matrix was formed based on the true and predicted labels of sample in the each unseen test data set. Then, based on the confusion matrix, common metrics are calculated to assess performance of machine learning system, including classification accuracy (CA), sensitivity (SE), specificity (SP), area under curve (AUC), Jaccard index (JI), F-measure (FM), and polygon area metric (PAM) (Aydemir, 2020). The mathematical definitions are, respectively, given as follows:
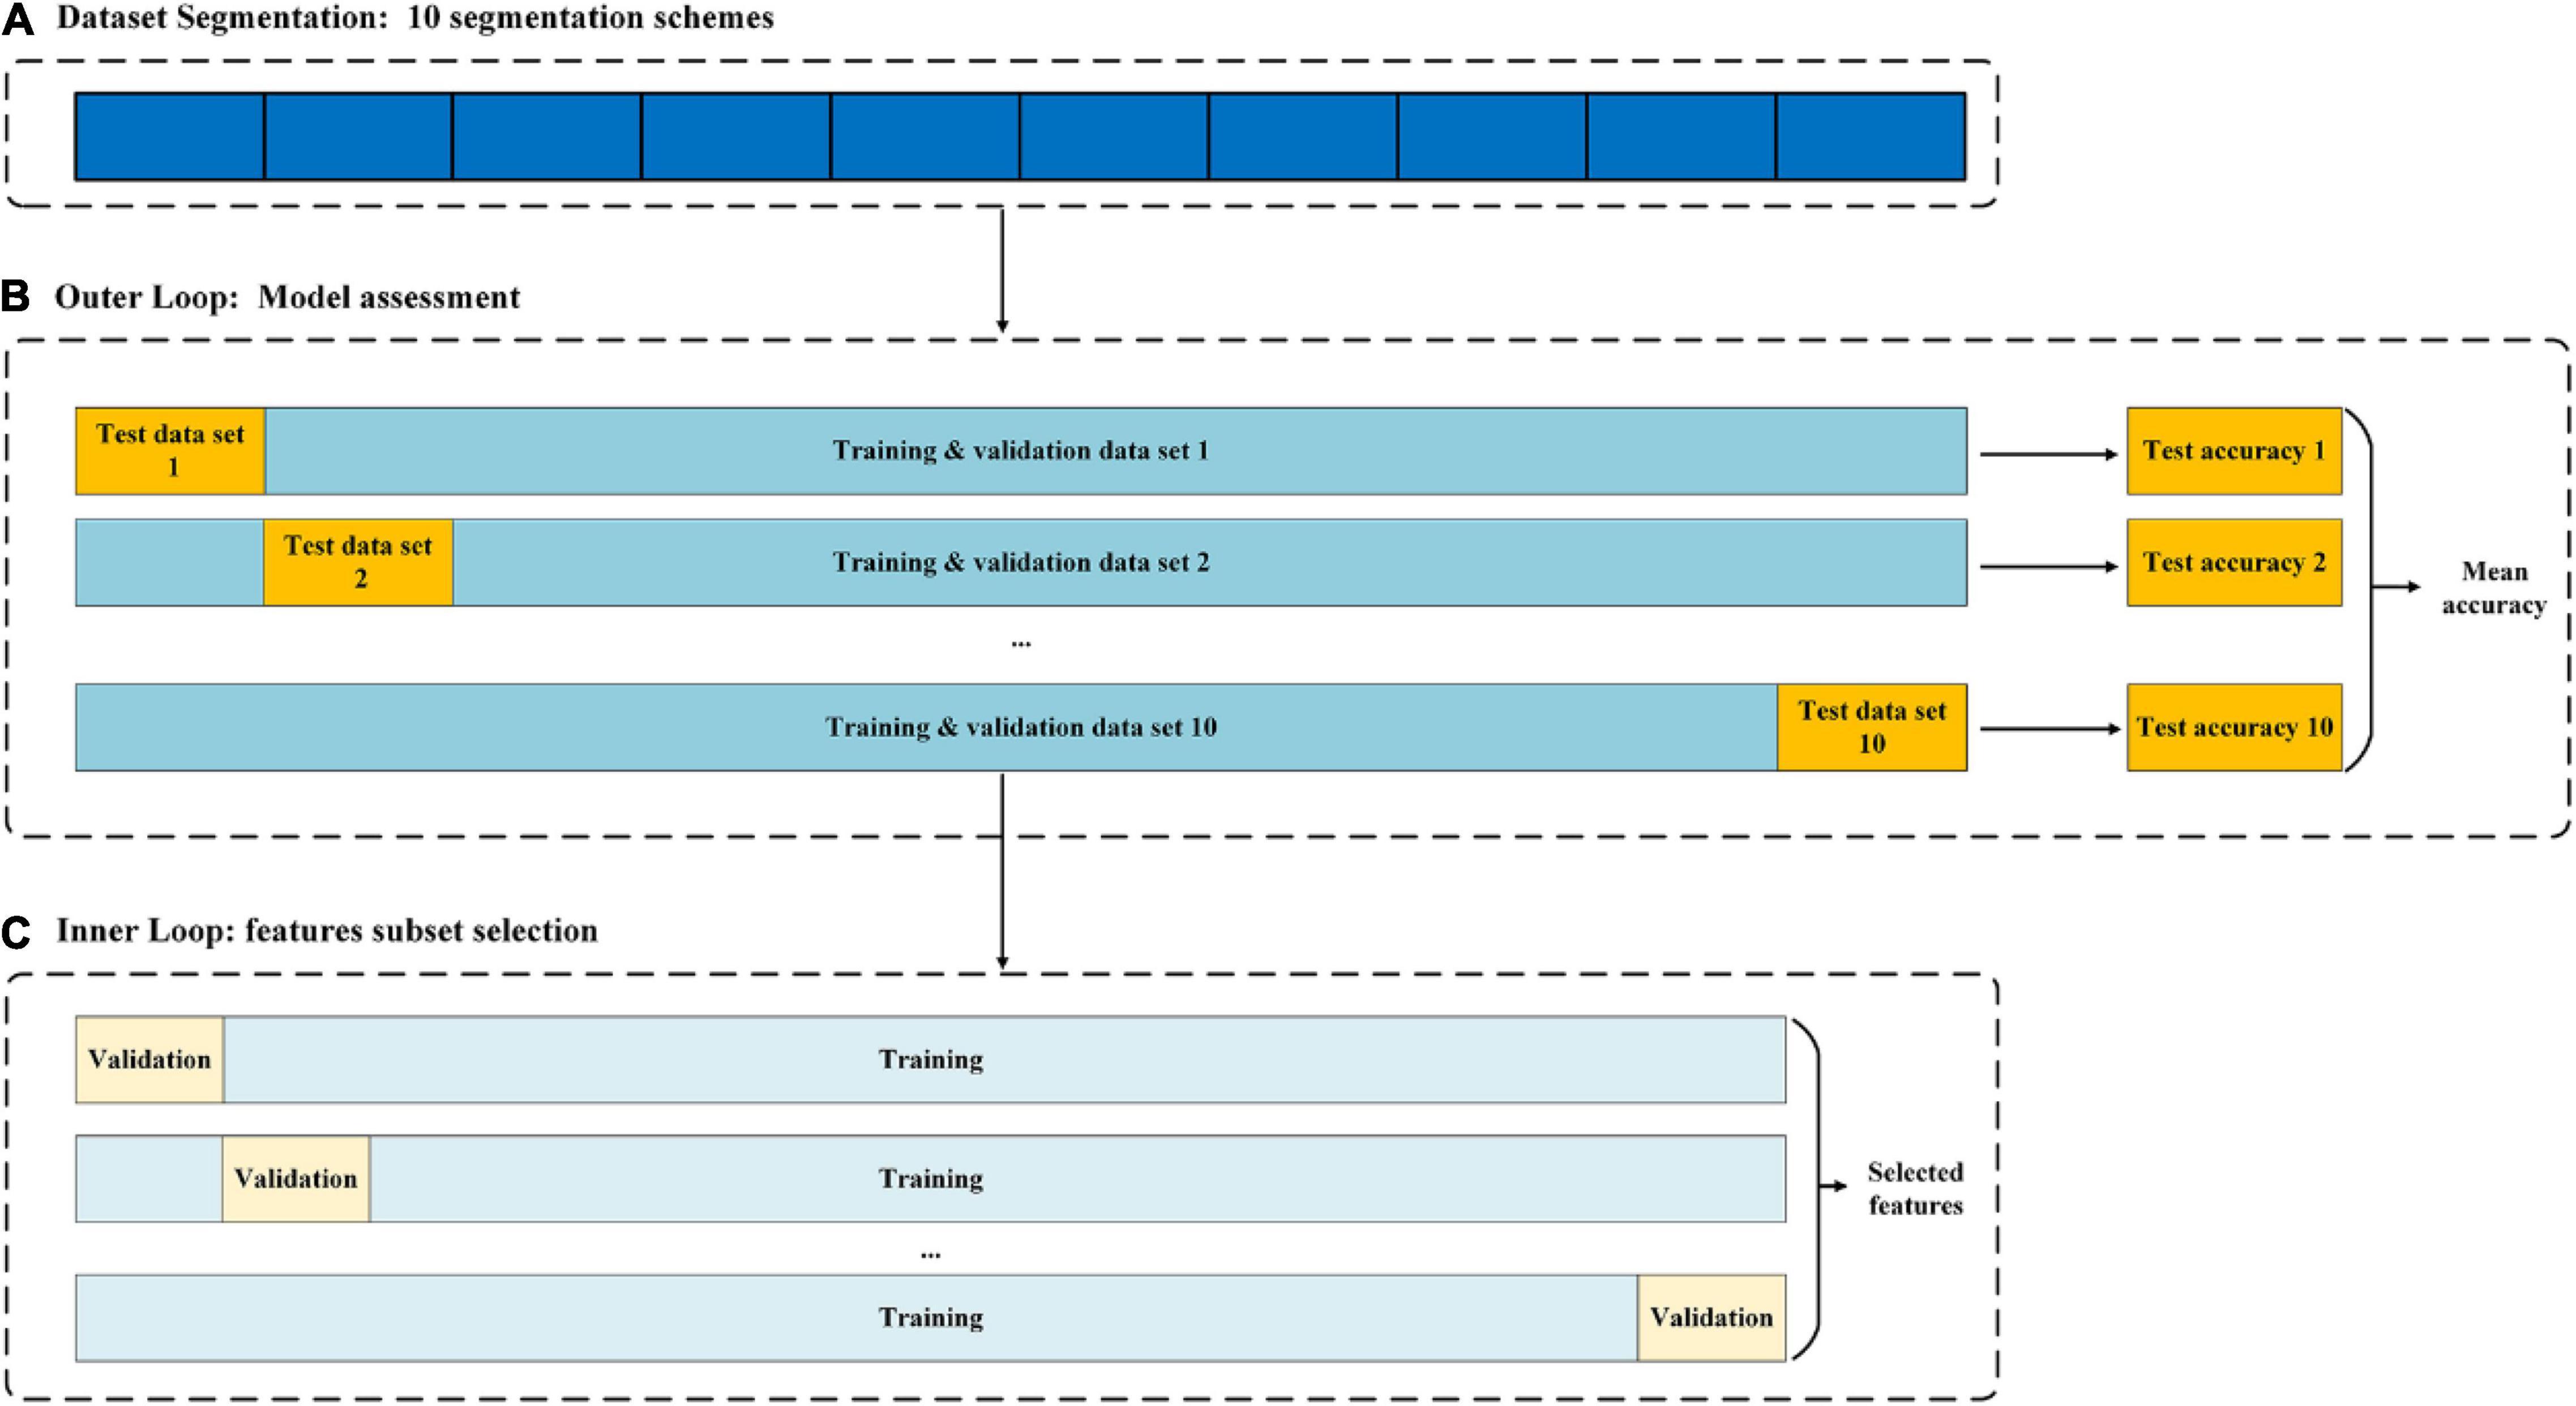
Figure 4. Nested cross-validation architecture used for feature selection and model assessment.
Where TP is the number of actual positive samples that were predicted to be positive, FN is the number of actual positive samples that were predicted to be negative, TN is the number of actual negative samples that were predicted to be negative, and FP is the number of actual negative samples that were predicted to be positive (Aydemir, 2020). The classifier selected in this study is a widely used classifier with good performance, namely, the RFC (Aldayel et al., 2020a,b). For the RFC, the Gini impurity was used as a function to measure the quality of a split; the maximum depth of the tree was set to 30; and the other super parameters were set to default.
Results and Discussion
The classification performance of the proposed EEG-based mate preference recognition algorithm was verified using a total of 2878 EEG samples (including 1439 samples of the IRA engendered category and 1439 samples of the IRA un-engendered category) collected from 50 participants. To obtain an optimal feature subset from 188 features with significant differences (p < 0.05) between the two categories, we used a nested 10-fold cross-validation scheme based on the RFECV-RFC algorithm for feature selection. The number of features varied from 1 to 188, and the best feature subset was selected in each step. Figure 5 displays the mean classification accuracies on the validation sets of each inner loop when selecting different numbers of features. As can be seen from Figure 5, the number of features of the optimal feature subset selected by each internal cycle is roughly the same (about 17, SD = 0.57). The performance of the model is evaluated on the corresponding test set based on the optimal feature subset selected in each inner loop. The results are shown in Tables 1, 2. It can be seen from Table 2 that the best mean CA value, mean PAM value, mean se value, mean SP value, mean AUC value, mean Ji value and mean FM value are 0.8528, 0.6990, 0.8566, 0.8486, 0.8540, 0.7439, and 0.8530, respectively.
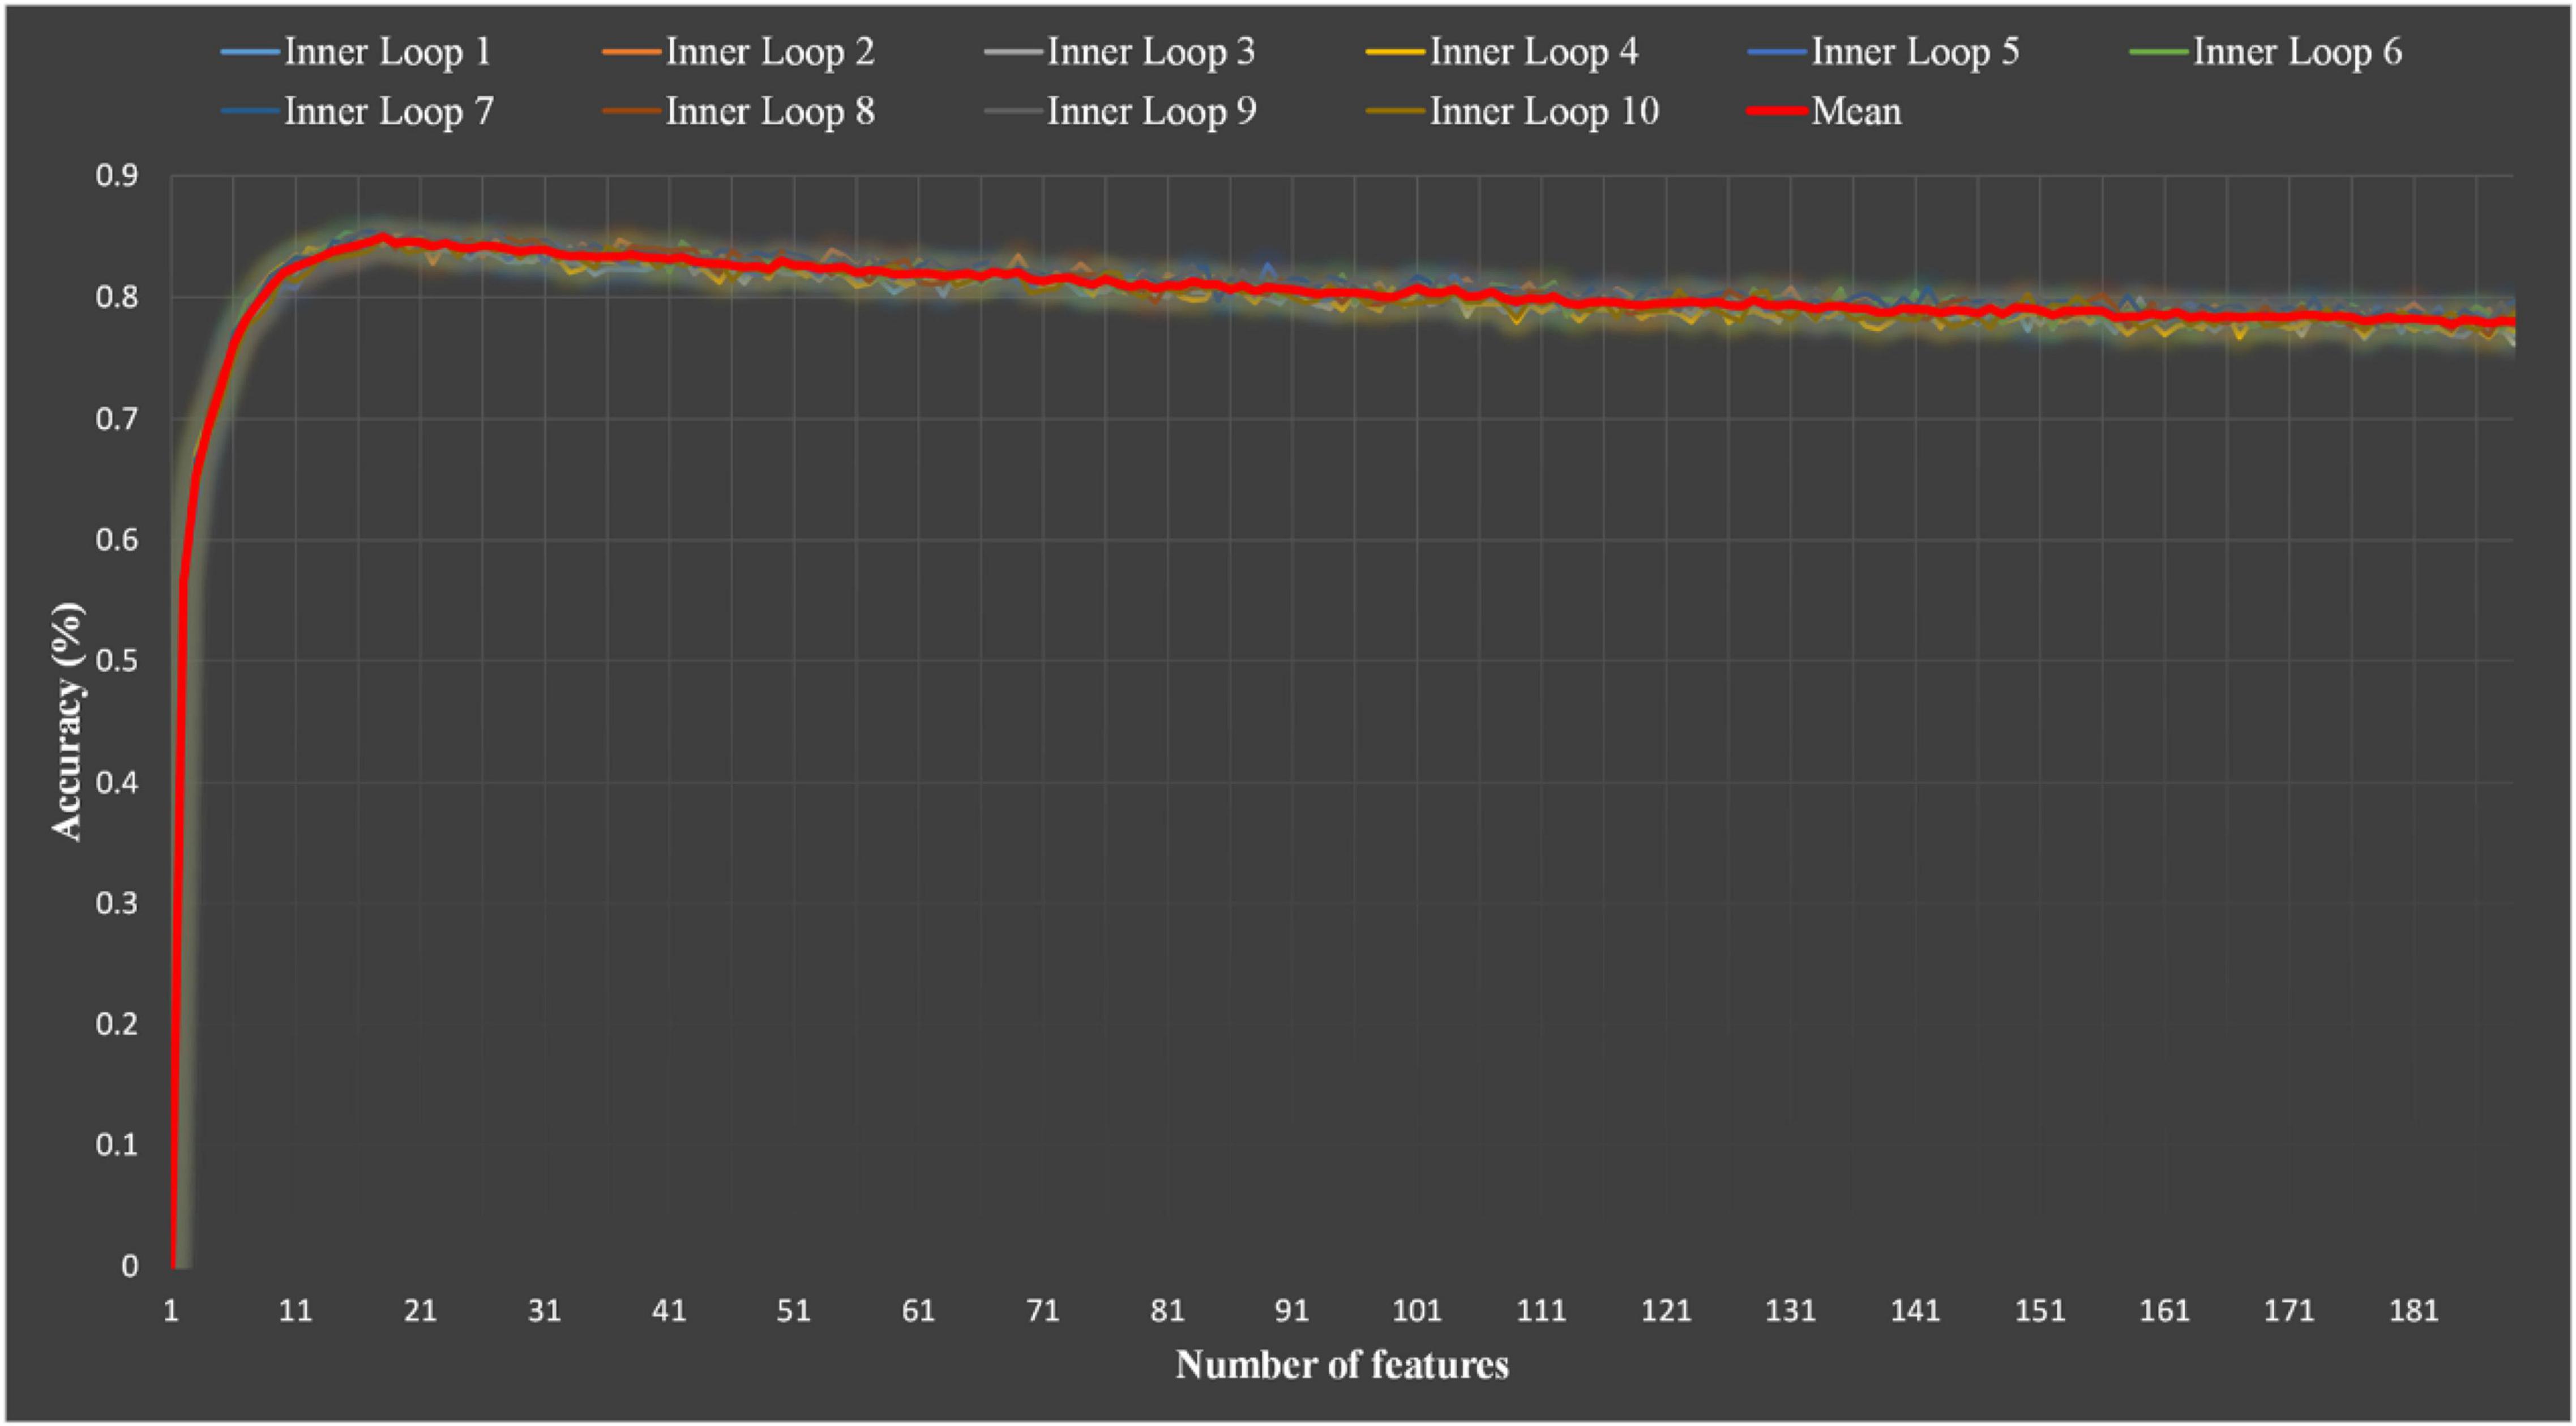
Figure 5. Classification accuracy using the RFC with different numbers of features. RFC, random forest classifier.
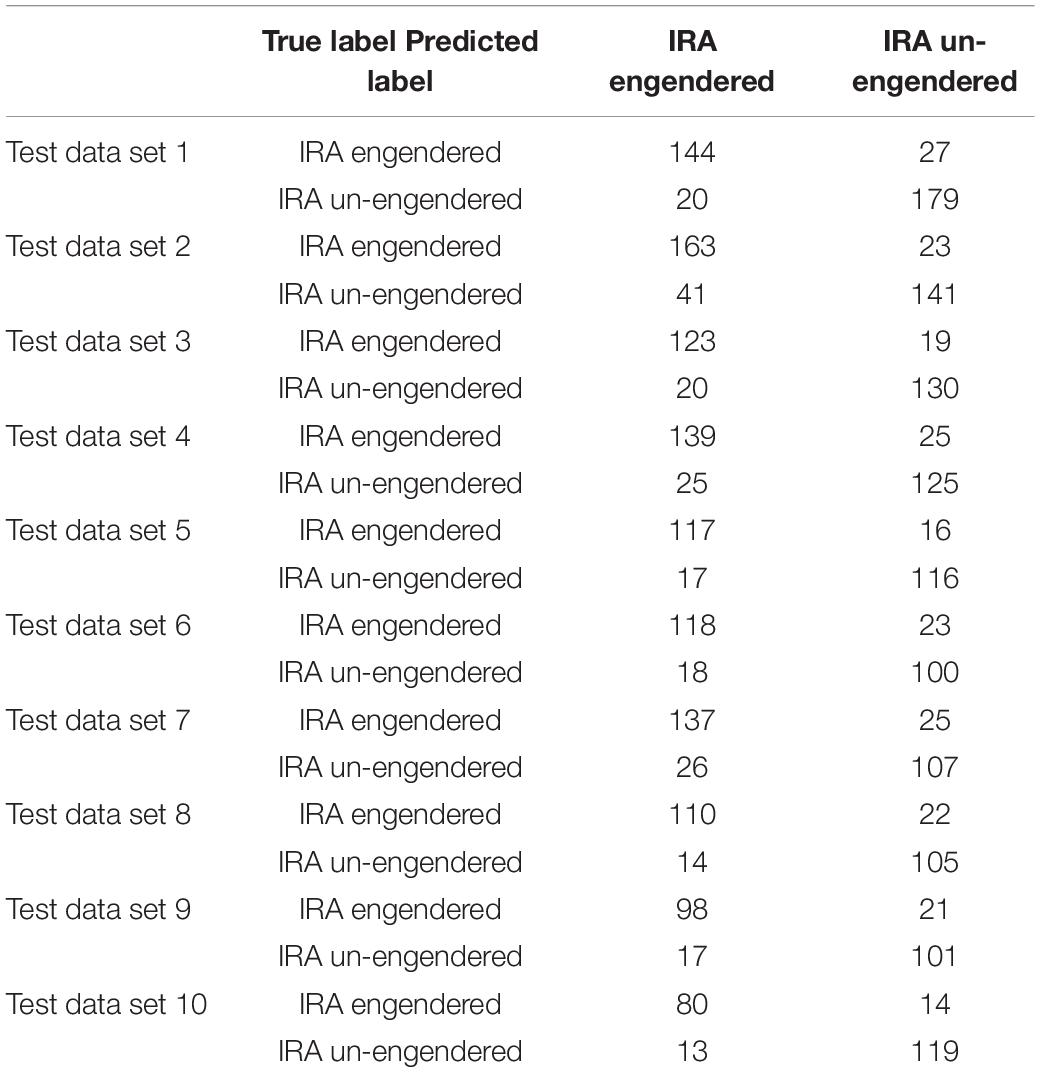
Table 1. Confusion matrix of each test data set.
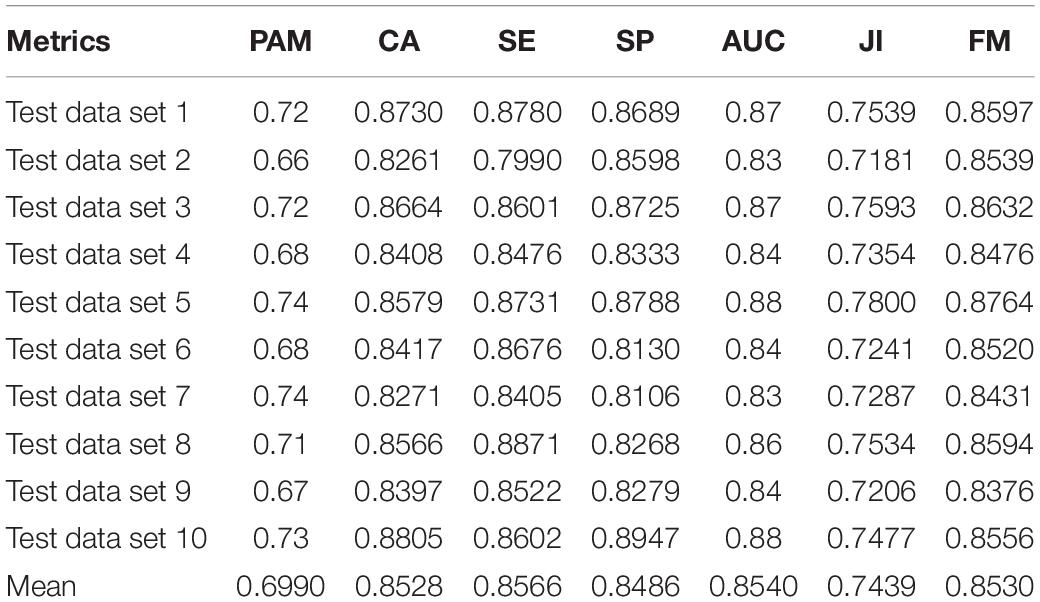
Table 2. The results of each test data set.
Figure 6 shows the union of the optimal feature subsets selected by each inner loop and the distribution of each feature. Based on the results shown in Figure 6, we found that the asymmetric features over the frontal and parietal lobes play an extremely important role in recognizing initial romantic interest because 15 of the 20 most discriminating features originated from these two regions. Moreover, 14 of these 15 features belonged to the alpha and beta bands. Previous studies have demonstrated that the frontal and parietal lobes are the most informative regions of emotional states, while the alpha and beta waves appear to be the most discriminative (Alarcao and Fonseca, 2019; Zheng et al., 2020). Yuan and Liu (2021) found that the changes in alpha and beta power on the sensors over the anterior regions play an important role in the generation and evaluation of IRA. In addition, numerous studies have demonstrated that frontal and parietal asymmetries in the alpha and beta FBs are observable for valence and arousal recognition (Cacioppo, 2004; Huang et al., 2012; Alarcao and Fonseca, 2019). In particular, Aldayel et al. (2020a,b) showed that the asymmetric features in alpha and beta frequencies over the frontal and parietal regions can effectively identify users’ emotional responses and preferences to market stimuli (Touchette and Lee, 2016; Liu et al., 2018; Ramsoy et al., 2018). In addition, Naser et al. showed that asymmetric features of alpha frequency on the frontal and parietal lobe regions could effectively identify users’ preference for music (Naser and Saha, 2021). We also found that the asymmetric features in the alpha, beta, and theta bands over the lateral occipital complex and the asymmetric features in the theta bands over the frontal and parietotemporal regions were sensitive in recognizing IRA. Previous studies have observed that the generation of IRA leads to desynchronization of alpha and beta bands in the lateral occipital complex region (Yuan and Liu, 2021). The theta FB over the frontal and parietotemporal areas was also considered to be an effective feature for identifying emotional states (Aftanas et al., 2001; Cartier et al., 2012).
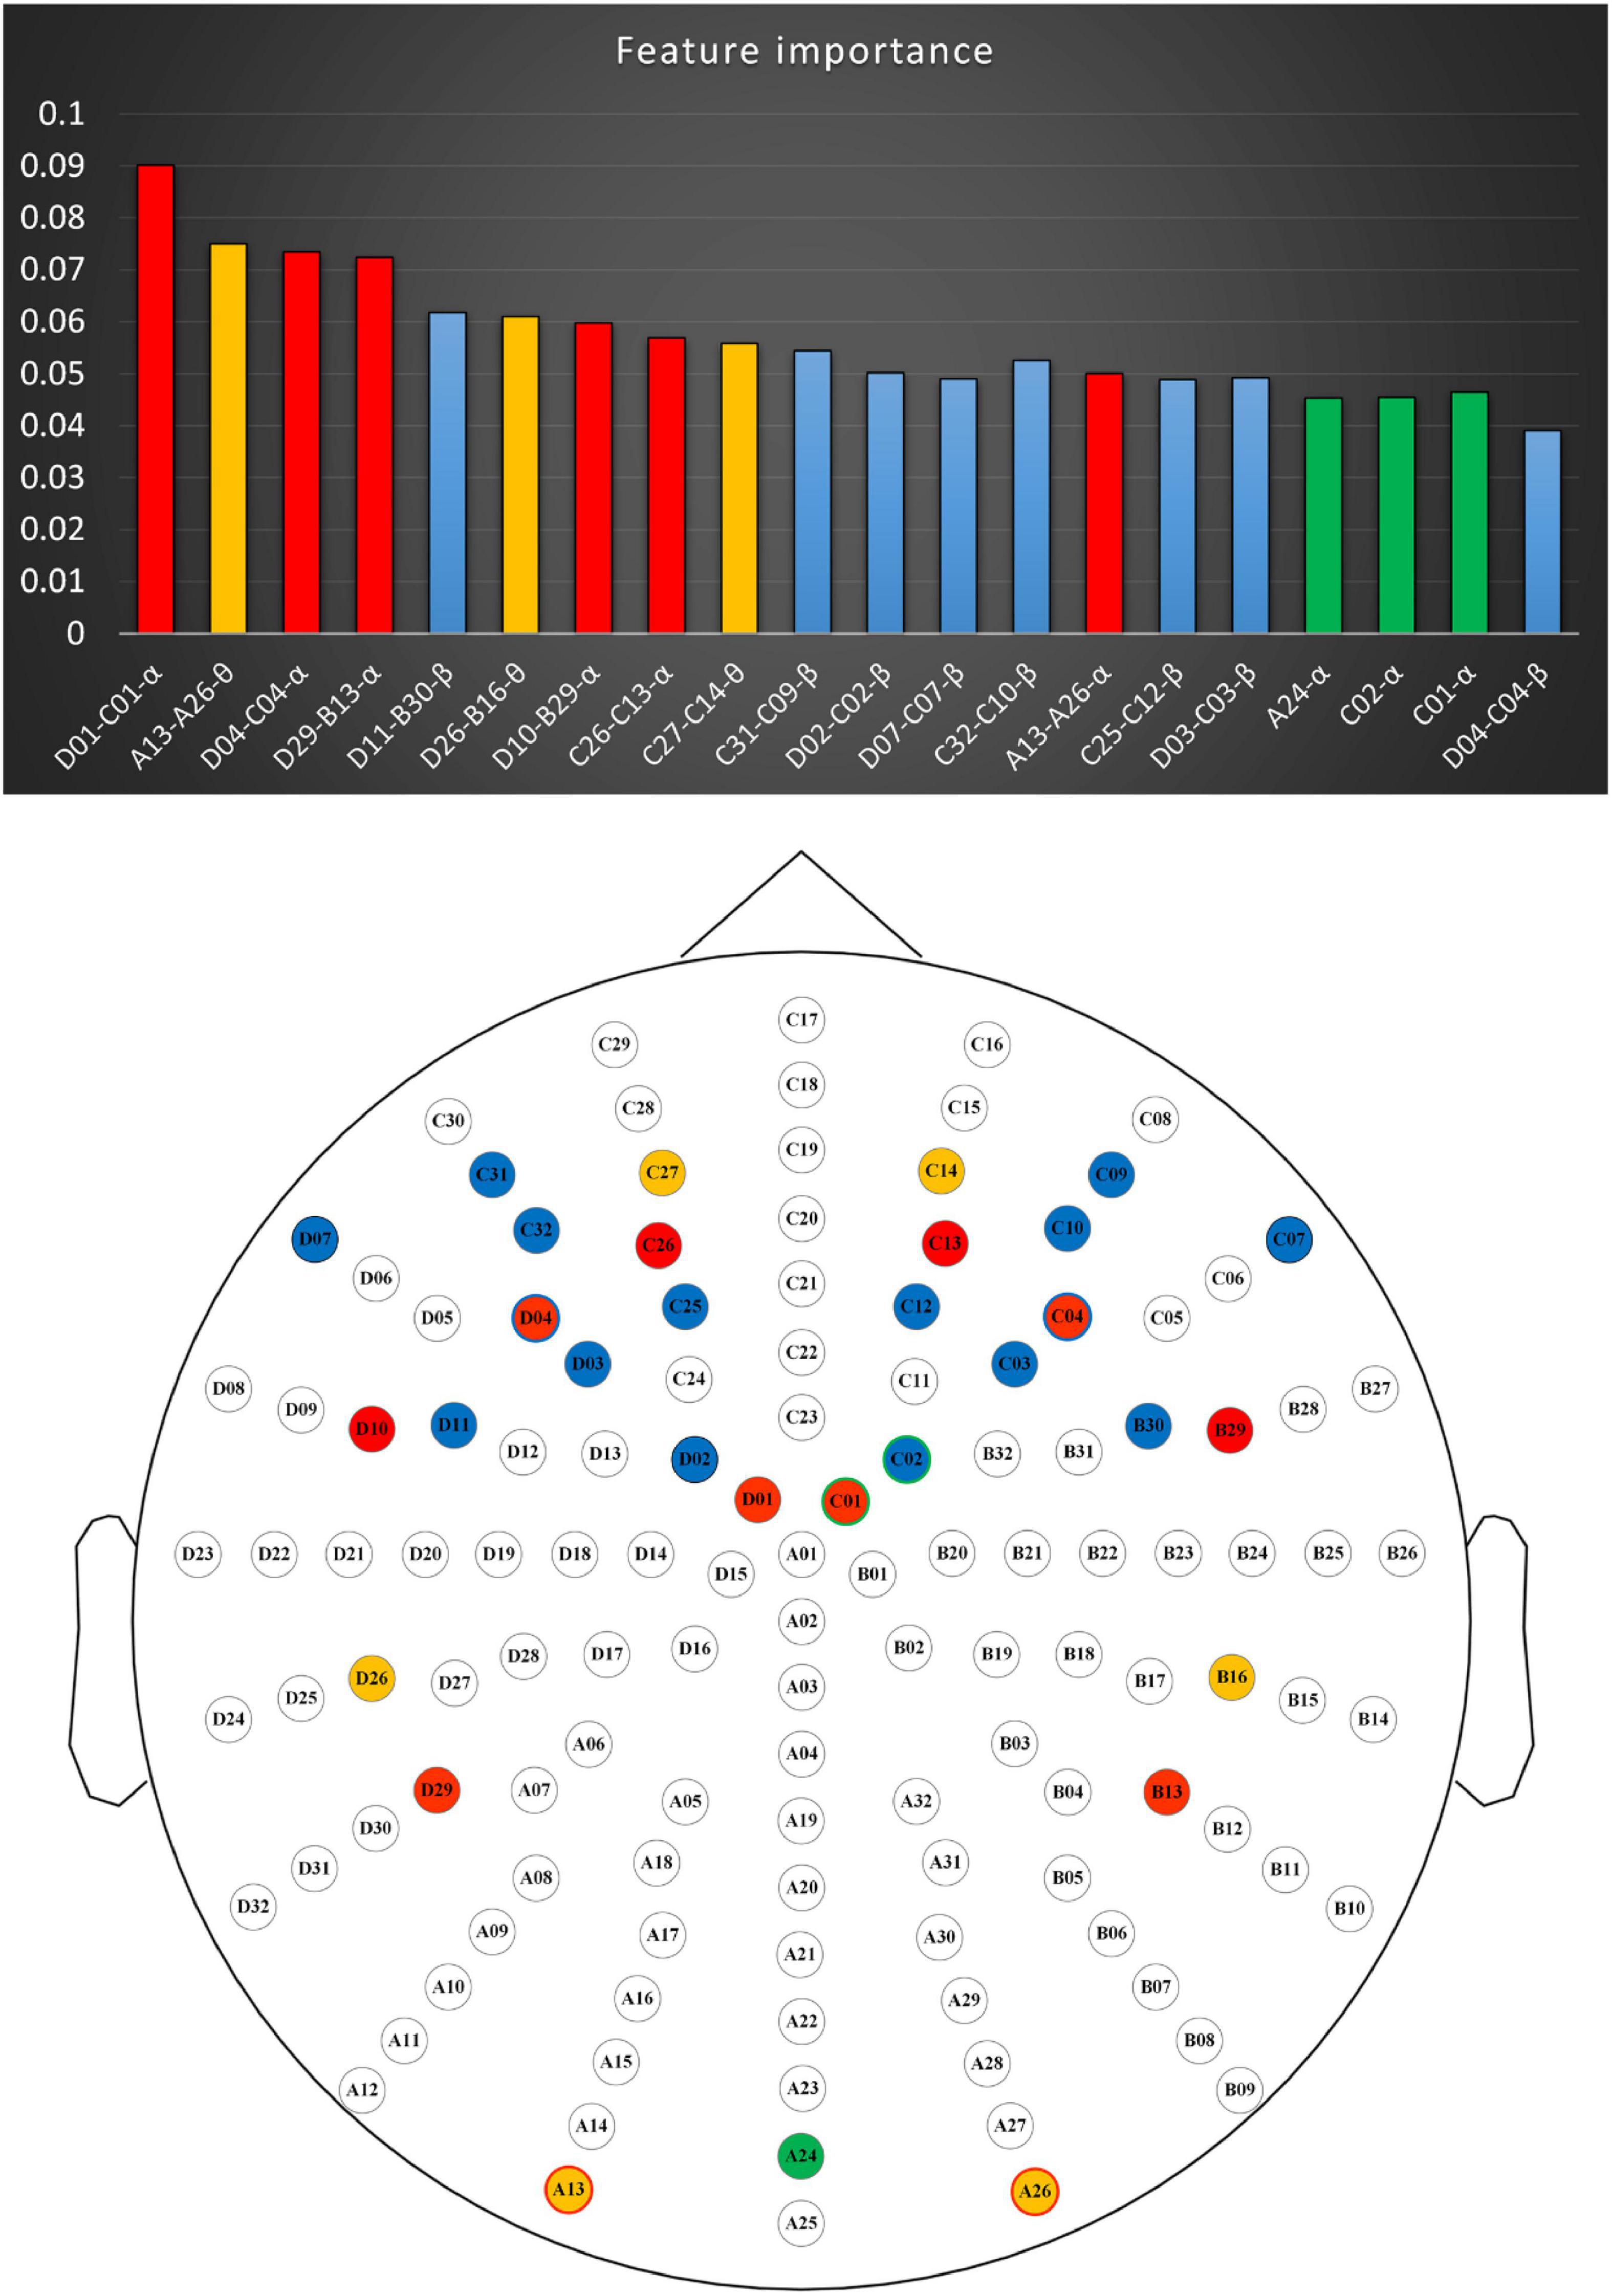
Figure 6. Optimal feature subsets of the RFC. Red, blue, and orange present the asymmetry features of the alpha, beta, and theta bands, respectively. Green represents the alpha band PSF. RFC, random forest classifier.
Taken together, these findings demonstrate that users’ preferences for potential romantic partners can be determined on the basis of EEG signals. Furthermore, the TF features from channels over the frontal, parietal, and occipital regions are informative and suitable for the identification of IRA toward potential partners.
Conclusion
The purpose of this experiment was to determine the possibility of using EEG signals to identify users’ aesthetic preferences for potential romantic partners. In this study, our system achieved a best accuracy of 85.2% (SD = 0.03) in recognizing the initial romantic interest. This result demonstrated that based on the information provided by users’ EEG signals, we can determine whether they are romantically interested in a potential partner. In addition, the best accuracy 85.2% (SD = 0.03) in this study was obtained mainly using the asymmetry features of the alpha, beta, and theta FBs on the sensors over the frontal lobe, parietal lobe, and lateral occipital complex. These results suggest that the TF features from channels over the frontal, parietal, and occipital regions are suitable for identifying human preferences for potential romantic partners. Therefore, in future work, we plan to extract features from different dimensions, such as the time domain and source domain, and explore how to use the minimum channels to optimize the classification accuracy through multi-dimensional feature integration.
In addition, as an exploratory study, this study used portrait photos rather than real people as stimuli to induce IRA based on feasibility considerations. The advantage of this approach is that by increasing the amount of stimulus, it can effectively solve the problem of insufficient trials in which IRA was successfully induced due to the low average induction rate. However, in real social scenes, initial romantic interest usually occurs in the environment that allows some meaningful interaction, but the types of stimuli used in the present study did not allow participants to interact effectively with potential partners in the photos (Yuan and Liu, 2021; Yuan et al., 2021). This is a problem that needs to be paid attention to and solved in the follow-up research. It is believed that in the near future, mate preference recognition and matching systems based on EEG signals will be applied to online or offline dating scenarios to assist individuals in finding their ideal partners.
Data Availability Statement
The raw data supporting the conclusions of this article will be made available by the authors, without undue reservation.
Ethics Statement
The studies involving human participants were reviewed and approved by Ethical Review Committee of Southwest University. The patients/participants provided their written informed consent to participate in this study. Written informed consent was obtained from the individual(s) for the publication of any potentially identifiable images or data included in this article.
Author Contributions
GY and GL conceived the study. GY designed and programmed the tasks, collected the data, analyzed the composite behavioral and EEG data, and wrote the manuscript. GY and WH interpreted the results. GL and WH revised the manuscript. All authors approved the final manuscript.
Funding
This work was supported in part by the National Natural Science Foundation of China (Nos. 61472330 and 61872301). This work was supported in part by the Natural Science Foundation of Shandong Province (No. ZR2019MC048). This work was supported in part by the Natural Science Foundation of Chongqing (No. cstc2021jcyj-msxmX0041).
Conflict of Interest
The authors declare that the research was conducted in the absence of any commercial or financial relationships that could be construed as a potential conflict of interest.
Publisher’s Note
All claims expressed in this article are solely those of the authors and do not necessarily represent those of their affiliated organizations, or those of the publisher, the editors and the reviewers. Any product that may be evaluated in this article, or claim that may be made by its manufacturer, is not guaranteed or endorsed by the publisher.
Acknowledgments
The authors thank all the researchers involved in the experiment.
Footnotes
References
Aftanas, L. I., Varlamov, A. A., Pavlov, S. V., Makhnev, V. P., and Reva, N. V. (2001). Affective picture processing: event-related synchronization within individually defined human theta band is modulated by valence dimension. Neurosci. Lett. 303, 115–118. doi: 10.1016/s0304-3940(01)01703-7
Alarcao, S. M., and Fonseca, M. J. (2019). Emotions recognition using EEG signals: a survey. IEEE Trans. Affect. Comput. 10, 374–393.
Aldayel, M., Ykhlef, M., and Al-Nafjan, A. (2020a). Deep learning for EEG-based preference classification in neuromarketing. Appl. Sci. 10:1525. doi: 10.3389/fnhum.2020.604639
Aldayel, M., Ykhlef, M., and Al-Nafjan, A. (2020b). Recognition of consumer preference by analysis and classification EEG signals. Front. Hum. Neurosci. 14:604639.
Aldayel, M. S., Ykhlef, M., and Al-Nafjan, A. N. (2020c). Electroencephalogram-based preference prediction using deep transfer learning. IEEE Access 8, 176818–176829.
Aldayel, M., Ykhlef, M., and Al-Nafjan, A. (2021). Consumers’ preference recognition based on brain–computer interfaces: advances, trends, and applications. Arab. J. Sci. Eng. 46, 8983–8997.
Asendorpf, J. B., Penke, L., and Back, M. D. (2011). From dating to mating and relating: predictors of initial and long-term outcomes of speed-dating in a community sample. Eur. J. Pers. 25, 16–30.
Aydemir, O. (2020). A new performance evaluation metric for classifiers: polygon area metric. J. Classif. 38, 16–26. doi: 10.1007/s00357-020-09362-5
Balconi, M., and Mazza, G. (2009). Brain oscillations and BIS/BAS (behavioral inhibition/activation system) effects on processing masked emotional cues. ERS/ERD and coherence measures of alpha band. Int. J. Psychophysiol. 74, 158–165. doi: 10.1016/j.ijpsycho.2009.08.006
Buston, P. M., and Emlen, S. T. (2003). Cognitive processes underlying human mate choice: the relationship between self-perception and mate preference in Western society. Proc. Natl. Acad. Sci. U.S.A. 100, 8805–8810. doi: 10.1073/pnas.1533220100
Cacioppo, J. T. (2004). Feelings and emotions: roles for electrophysiological markers. Biol. Psychol. 67, 235–243. doi: 10.1016/j.biopsycho.2004.03.009
Cartier, C., Bittencourt, J., Peressutti, C., Machado, S., Paes, F., Sack, A. T., et al. (2012). Premotor and occipital theta asymmetries as discriminators of memory- and stimulus-guided tasks. Brain Res. Bull. 87, 103–108. doi: 10.1016/j.brainresbull.2011.10.013
Chew, L. H., Teo, J., and Mountstephens, J. (2016). Aesthetic preference recognition of 3D shapes using EEG. Cogn. Neurodyn. 10, 165–173. doi: 10.1007/s11571-015-9363-z
Cooper, J. C., Dunne, S., Furey, T., and O’Doherty, J. P. (2012). Dorsomedial prefrontal cortex mediates rapid evaluations predicting the outcome of romantic interactions. J. Neurosci. 32, 15647–15656. doi: 10.1523/JNEUROSCI.2558-12.2012
De Cesarei, A., and Codispoti, M. (2011). Affective modulation of the LPP and alpha-ERD during picture viewing. Psychophysiology 48, 1397–1404. doi: 10.1111/j.1469-8986.2011.01204.x
Finkel, E. J., Eastwick, P. W., and Matthews, J. (2007). Speed-dating as an invaluable tool for studying romantic attraction: a methodological primer. Pers. Relationsh. 14, 149–166.
Fisher, A. A. H., Mashek, D. J., Li, H., and Brown, L. (2002). Defining the brain systems of lust, romantic attraction, and attachment. Arch. Sex. Behav. 31, 413–419. doi: 10.1023/a:1019888024255
Fisher, H. E. (1998). Lust, attraction, and attachment in mammalian reproduction. Hum. Nat. 9, 23–52. doi: 10.1007/s12110-998-1010-5
Fisher, H., Aron, A., and Brown, L. L. (2005). Romantic love: an fMRI study of a neural mechanism for mate choice. J. Comp. Neurol. 493, 58–62. doi: 10.1002/cne.20772
Gerlach, T. M., and Reinhard, S. K. (2018). “Personality and romantic attraction,” in Encyclopedia of Personality and Individual Differences, eds V. Zeigler-Hill and T. K. Shackelford (Cham: Springer), 1–6. doi: 10.1007/978-3-319-28099-8_717-2
Gunes, H., Schuller, B., Pantic, M., and Cowie, R. (2011). “Emotion representation, analysis and synthesis in continuous space: a survey,” in Proceedings of the IEEE International Conference on Automatic Face & Gesture Recognition, Santa Barbara, CA, 827–834.
Hadjidimitriou, S. K., and Hadjileontiadis, L. J. (2012). Toward an EEG-based recognition of music liking using time-frequency analysis. IEEE Trans. Biomed. Eng. 59, 3498–3510. doi: 10.1109/TBME.2012.2217495
Hadjidimitriou, S. K., and Hadjileontiadis, L. J. (2013). EEG-based classification of music appraisal responses using time-frequency analysis and familiarity ratings. IEEE Trans. Affect. Comput. 4, 161–172.
Huang, D., Guan, C., Kai Keng, A., Haihong, Z., and Yaozhang, P. (2012). “Asymmetric spatial pattern for EEG-based emotion detection,” in Proceedings of the 2012 International Joint Conference on Neural Networks (IJCNN), Brisbane, QLD, 1–7. doi: 10.1186/s12868-016-0283-6
Jatupaiboon, N., Pan-ngum, S., and Israsena, P. (2013). “Emotion classification using minimal EEG channels and frequency bands,” in Proceedings of the 2013 10th International Joint Conference on Computer Science and Software Engineering (JCSSE), Khon Kaen, 21–24.
Joel, S., Eastwick, P. W., and Finkel, E. J. (2017). Is romantic desire predictable? Machine learning applied to initial romantic attraction. Psychol. Sci. 28, 1478–1489. doi: 10.1177/0956797617714580
Kang, J. H., Kim, S. J., Cho, Y. S., and Kim, S. P. (2015). Modulation of alpha oscillations in the human EEG with facial preference. PLoS One 10:e0138153. doi: 10.1371/journal.pone.0138153
Khurana, V., Gahalawat, M., Kumar, P., Roy, P. P., Dogra, D. P., Scheme, E., et al. (2021). A survey on neuromarketing using EEG signals. IEEE Trans. Cogn. Dev. Syst. 13, 732–749.
Lin, Y. P., Wang, C. H., Jung, T. P., Wu, T. L., Jeng, S. K., Duann, J. R., et al. (2010). EEG-based emotion recognition in music listening. IEEE Trans. Biomed. Eng. 57, 1798–1806. doi: 10.1109/TBME.2010.2048568
Lindsen, J. P., Jones, R., Shimojo, S., and Bhattacharya, J. (2010). Neural components underlying subjective preferential decision making. Neuroimage 50, 1626–1632. doi: 10.1016/j.neuroimage.2010.01.079
Liu, Y., Sourina, O., and Nguyen, M. K. (2011). “Real-time EEG-based emotion recognition and its applications,” in Transactions on Computational Science XII: Special Issue on Cyberworlds, eds M. L. Gavrilova, C. J. K. Tan, A. Sourin, and O. Sourina (Berlin: Springer), 256–277. doi: 10.1007/978-3-642-22336-5_13
Liu, Y.-J., Yu, M., Zhao, G., Song, J., Ge, Y., and Shi, Y. (2018). Real-time movie-induced discrete emotion recognition from EEG signals. IEEE Trans. Affect. Comput. 9, 550–562. doi: 10.1109/taffc.2017.2660485
Lu, H., Yuan, G., Zhang, J., and Liu, G. (2020). Recognition of impulse of love at first sight based on photoplethysmography signal. Sensors 20:6572. doi: 10.3390/s20226572
Moon, J. (2013). Extraction of user preference for video stimuli using EEG-based user responses. ETRI J. 35, 1105–1114. doi: 10.4218/etrij.13.0113.0194
Naser, D. S., and Saha, G. (2021). Influence of music liking on EEG based emotion recognition. Biomed. Signal Process. Control 64:102251. doi: 10.1016/j.bspc.2020.102251
Niemic, C. (2004). Studies of emotion: a theoretical and empirical review of psychophysiological studies of emotion. J. Undergrad. Res. 1, 15–18.
Olderbak, S. G., Malter, F., Wolf, P. S. A., Jones, D. N., and Figueredo, A. J. (2017). Predicting romantic interest at zero acquaintance: evidence of sex differences in trait perception but not in predictors of interest. Eur. J. Pers. 31, 42–62. doi: 10.1002/per.2087
Oostenveld, R., Fries, P., Maris, E., and Schoffelen, J. M. (2011). FieldTrip: open source software for advanced analysis of MEG, EEG, and invasive electrophysiological data. Comput. Intell. Neurosci. 2011:156869. doi: 10.1155/2011/156869
Pfurtscheller, G., and Lopes da Silva, F. H. (1999). Event-related EEG/MEG synchronization and desynchronization: basic principles. Clin. Neurophysiol. 110, 1842–1857. doi: 10.1016/s1388-2457(99)00141-8
Pourmohammadi, S., and Maleki, A. (2020). Stress detection using ECG and EMG signals: a comprehensive study. Comput. Methods Programs Biomed. 193:105482. doi: 10.1016/j.cmpb.2020.105482
Ramsoy, T. Z., Skov, M., Christensen, M. K., and Stahlhut, C. (2018). Frontal brain asymmetry and willingness to pay. Front. Neurosci. 12:138. doi: 10.3389/fnins.2018.00138
Saeb, S., Lonini, L., Jayaraman, A., Mohr, D. C., and Kording, K. P. (2017). The need to approximate the use-case in clinical machine learning. Gigascience 6, 1–9.
Schubring, D., and Schupp, H. T. (2019). Affective picture processing: alpha- and lower beta-band desynchronization reflects emotional arousal. Psychophysiology 56:e13386. doi: 10.1111/psyp.13386
Schubring, D., and Schupp, H. T. (2021). Emotion and brain oscillations: high arousal is associated with decreases in alpha- and lower beta-band power. Cereb. Cortex 31, 1597–1608. doi: 10.1093/cercor/bhaa312
Spielmann, S. S., MacDonald, G., Maxwell, J. A., Joel, S., Peragine, D., Muise, A., et al. (2013). Settling for less out of fear of being single. J. Pers. Soc. Psychol. 105, 1049–1073. doi: 10.1037/a0034628
Thomas, A. G., Jonason, P. K., Blackburn, J. D., Kennair, L. E. O., Lowe, R., Malouff, J., et al. (2020). Mate preference priorities in the East and West: a cross-cultural test of the mate preference priority model. J. Pers. 88, 606–620. doi: 10.1111/jopy.12514
Touchette, B., and Lee, S.-E. (2016). Measuring neural responses to apparel product attractiveness. Cloth. Text. Res. J. 35, 3–15. doi: 10.1177/0887302x16673157
Yuan, G., and Liu, G. (2021). Mate preference and brain oscillations: initial romantic attraction is associated with decreases in alpha- and lower beta-band power. Hum. Brain Mapp. 43, 721–732. doi: 10.1002/hbm.25681
Yuan, G., Liu, G., and Wei, D. (2021). Roles of P300 and late positive potential in initial romantic attraction. Front. Neurosci. 15:718847. doi: 10.3389/fnins.2021.718847
Zhang, J., Yuan, G., Lu, H., and Liu, G. (2021). Recognition of the impulse of love at first sight based on electrocardiograph signal. Comput. Intell. Neurosci. 2021:6631616. doi: 10.1155/2021/6631616
Zheng, X., Liu, X., Zhang, Y., Cui, L., and Yu, X. (2020). A portable HCI system-oriented EEG feature extraction and channel selection for emotion recognition. Int. J. Intell. Syst. 36, 152–176.
Zheng, X., Yu, X., Yin, Y., Li, T., and Yan, X. (2021). Three-dimensional feature maps and convolutional neural network-based emotion recognition. Int. J. Intell. Syst. 36, 6312–6336.
Keywords: aesthetic preference, mate choice, physiological signals, frequency band, hemispheric asymmetries
Citation: Yuan G, He W and Liu G (2022) Is Mate Preference Recognizable Based on Electroencephalogram Signals? Machine Learning Applied to Initial Romantic Attraction. Front. Neurosci. 16:830820. doi: 10.3389/fnins.2022.830820
Received: 07 December 2021; Accepted: 24 January 2022;
Published: 11 February 2022.
Edited by:
Jane Zhen Liang, Shenzhen University, ChinaReviewed by:
Hugo F. Posada-Quintero, University of Connecticut, United StatesOnder Aydemir, Karadeniz Technical University, Turkey
Noor Kamal Al-Qazzaz, University of Baghdad, Iraq
Copyright © 2022 Yuan, He and Liu. This is an open-access article distributed under the terms of the Creative Commons Attribution License (CC BY). The use, distribution or reproduction in other forums is permitted, provided the original author(s) and the copyright owner(s) are credited and that the original publication in this journal is cited, in accordance with accepted academic practice. No use, distribution or reproduction is permitted which does not comply with these terms.
*Correspondence: Guangyuan Liu, bGl1Z3lAc3d1LmVkdS5jbg==