- 1Department of Neurology, Affiliated Lianyungang Hospital of Xuzhou Medical University, Lianyungang, China
- 2School of Biomedical Engineering, Health Science Center, Shenzhen University, Shenzhen, China
- 3Key Laboratory of Behavioral Science, Center for Brain Science and Learning Difficulties, Institute of Psychology, Chinese Academy of Sciences, Beijing, China
- 4Center for Brain Disorders and Cognitive Science, Shenzhen University, Shenzhen, China
- 5Lab of Digital Image and Intelligent Computation, Shanghai Maritime University, Shanghai, China
- 6School of Pharmacy, Health Science Center, Shenzhen University, Shenzhen, China
- 7Peng Cheng Laboratory, Shenzhen, China
- 8School of Biomedical Engineering, ShanghaiTech University, Shanghai, China
The complexity derived from resting-state functional magnetic resonance imaging (rs-fMRI) data has been applied for exploring cognitive states and occupational neuroplasticity. However, there is little information about the influence of occupational factors on dynamic complexity and topological properties of the connectivity networks. In this paper, we proposed a novel dynamical brain complexity analysis (DBCA) framework to explore the changes in dynamical complexity of brain activity at the voxel level and complexity topology for professional seafarers caused by long-term working experience. The proposed DBCA is made up of dynamical brain entropy mapping analysis and complex network analysis based on brain entropy sequences, which generate the dynamical complexity of local brain areas and the topological complexity across brain areas, respectively. First, the transient complexity of voxel-wise brain map was calculated; compared with non-seafarers, seafarers showed decreased dynamic entropy values in the cerebellum and increased values in the left fusiform gyrus (BA20). Further, the complex network analysis based on brain entropy sequences revealed small-worldness in terms of topological complexity in both seafarers and non-seafarers, indicating that it is an inherent attribute of human the brain. In addition, seafarers showed a higher average path length and lower average clustering coefficient than non-seafarers, suggesting that the information processing ability is reduced in seafarers. Moreover, the reduction in efficiency of seafarers suggests that they have a less efficient processing network. To sum up, the proposed DBCA is effective for exploring the dynamic complexity changes in voxel-wise activity and region-wise connectivity, showing that occupational experience can reshape seafarers’ dynamic brain complexity fingerprints.
Introduction
Entropy-Based Complexity of Brain Activity
Strong brain plasticity appears in the first few years of life, but various factors throughout adulthood still affect the morphology of brain structure and function. Occupation is a key factor that shapes our brain, which is closely related to our daily life, and exerts a subtle and persistent influence on brain plasticity changes (Wang N. et al., 2017, 2018; Dottori et al., 2020; Wei et al., 2020; Wu et al., 2020). Some studies have shown that the complexity of brain organization is an effective biomarker that reflects the individual’s brain health level (Goldberger et al., 2002), aging (Sokunbi et al., 2011), cardiovascular diseases (Richman and Moorman, 2000), the neural effects of drug use (Ferenets et al., 2007), etc. Recently, research shows that entropy, a useful measure of brain complexity, can be used to investigate the impact of diseases (Sokunbi et al., 2014; Wang B. et al., 2017; Lin et al., 2019) and aging (Sokunbi et al., 2015) on the human brain, implying that it is feasible to use entropy to explore the brain’s complexity changes caused by occupational factors (Wang N. et al., 2017, 2018; Wu et al., 2020). Since neural activity can be periodic, chaotic, or random (Gu et al., 2014; Yilmaz et al., 2016), the complexity level of brain signals will be different (Wang et al., 2014; DiNuzzo et al., 2017), where entropy can measure the signal randomness and predictability of a random process. Lower entropy indicates a low complex and more regular signal or system. Moreover, as the activity captured by the BOLD signal in brain areas over time is dynamical (Deco et al., 2008; Calhoun et al., 2014; Preti et al., 2017; Vidaurre et al., 2017; Lurie et al., 2020), the dynamical complexity is potential to characterize occupational neuroplasticity and is the main focus of this study.
Complex Network-Based Complexity of Brain Connectivity
Characterizing the human brain as a complex system can help to interpret the evolution of brain structure and function (Richman et al., 2004; Bullmore and Sporns, 2009; Avena-Koenigsberger et al., 2018). With the development of resting-state functional magnetic resonance imaging technology (rs-fMRI), it can provide the feasible solution for complex networks to assess the functional topology among different brain areas over time (Onias et al., 2014). Lahaye et al. (2003) indicated that the non-linear information of interactions between BOLD signals plays a key role in identifying important connections. The key difference is that the non-linear technique produced networks with scale-free degree distributions (van den Heuvel et al., 2008; Pritchard et al., 2014), and the network hubs dominated information processing in the brain network (Mears and Pollard, 2016). Regarding the construction of functional networks based on complex networks, the linear correlations between brain regions are usually used like Pearson correlation coefficient (PCC) (Achard et al., 2006; Hayasaka and Laurienti, 2010). For example, Jung et al. (2013) used the methods of voxel-based morphometry (VBM), linear functional connection, and graph theory analysis to explore the changes in brain structure and function associated with professional Baduk players. Furthermore, in an rs-fMRI study of Chinese chess players, Duan et al. (2014) also pointed out that compared to non-professional subjects, professional chess players showed stronger functional connectivity between learning and memory areas, as well as stronger small-worldness topology. However, human brain information processing functions exist at multiple levels of interaction and non-linear behavior, which may be affected by electrical, chemical, and physical components controlled by thresholds and saturation phenomena (Abásolo et al., 2006; Sokunbi et al., 2014). Moreover, studies have shown that after Gaussian smoothing of fMRI data, there are significant but few non-linear characteristics (Hartman et al., 2011; Hlinka et al., 2011). For example, Xie et al. (2008) found significant non-linear features in fMRI data when the non-linear methods were used. Additionally, previous studies showed the non-linear functional connectivity-based features were beneficial for the classification of schizophrenia (Su et al., 2013). Together, the complex network based on brain entropy sequences measured by sample entropy is an effective united model to perform the linear, non-linear, and scale-free analysis for brain functional networks.
Our Study
Based on the aforementioned discussion, brain activity has dynamical transitions and linear and non-linear features. Meanwhile, the entropy-based complexity and complex network-based complexity can be viewed as a typical measure of the human brain system. Further, the sample entropy is sensitive to both linear and non-linear analysis and is robust to the length of signal, which provides the potential strategy for revealing the complexity analysis of linear, non-linear, dynamics, and network topology.
Thus, in the current study, we hypothesize that professional seafarers might differ from non-seafarers on: (1) the dynamic complexity changes of brain functional plasticity, especially areas associated with motor coordination; (2) the global topological properties of a dynamical entropy-based complex network, according to previous evidence that long-term expertise training caused functional neuroplasticity changes. Using dynamic brain entropy mapping analysis and brain-entropy-based complex network analysis on the rs-fMRI dataset, we expect to detect changes in dynamic complexity and topological complexity features of brain activity driven by occupations in seafarers, for proposing a dynamic brain complexity analysis framework (DBCA) to decode brain activity by combing which was made up of dynamic brain entropy mapping analysis and brain-entropy-based complex network analysis. Moreover, we applied the proposed DBCA framework to explore the dynamic complexity and topological complexity changes of brain activity caused by occupation between the professional seafarers and non-seafarers based on the rs-fMRI dataset.
The remainder of this paper is organized as follows: The Material and Methods section related to the theory of DBCA framework, data acquisition, and processing will be presented first, followed by the experimental results section. Finally, the analysis is presented together with interpretations, discussion, and conclusions related to DBCA and complexity fingerprints of occupation-dependent brain functional networks in professional seafarers.
Materials and Methods
Data Acquisition and Preprocessing
All MRI data from subjects of 20 seafarers (all male, mean age of 49 years, right handed) and 20 education level-, gender-, and age-matched healthy control subjects (all male, mean age of 51 years, right handed) were collected from the Shanghai Key Laboratory of Magnetic Resonance. All participants were informed about the purpose of the study and signed a written consent form according to procedures approved by the IRB of East China Normal University (ECNU). For all subjects, no history of mental illness or neurological diseases were reported, and all seafarers have more than 10 years of sailing experience, and they work and live under strict militarized management on the sea. On the contrary, the recruited control subjects were from the land work position of university campus security guard without long-term sailing experience. For more details, please refer to Wang N. et al. (2017, 2018).
The scanning parameters were listed as follows: GE 3.0 Tesla with gradient echo EPI, slice number = 36, covering the whole brain area; sensitivity acceleration factor = 2.0, time of repetition (TR) = 2.0 s, scanning resolution = 80*80, in-plane resolution = 3.75 mm × 3.75 mm, slice thickness = 4 mm, time points = 160.
All data preprocessing was performed by DPARSF1, which is based on the SPM2 and REST3 toolbox. The preprocessing steps for rs-fMRI data of each subject in this study are as follows: (1) slice timing with the 39th slice as reference slice; (2) realignment; (3) normalization by EPI template (resampling voxel size = 3 mm × 3 mm × 3 mm); (4) spatial smooth by a Gaussian kernel with FWHM = 8mm.
Dynamical Brain Complexity Analysis Framework
Previous studies have shown the dynamic remodeling property in brain function during the task or task-free condition reflected by complexity (Sporns, 2011; Cole et al., 2013; Calhoun et al., 2014; Zalesky et al., 2014; Braun et al., 2015; Preti et al., 2017; Vidaurre et al., 2017; Shi et al., 2019; Fu et al., 2020; Lurie et al., 2020). In this section, the DBCA framework based on sample entropy (SampEn) was proposed for capturing the dynamical complexity, which is applied to measure the occupation-dependent complexity fingerprints of the professional seafarers. The DBCA framework was depicted in Figure 1, which was made up of dynamic brain entropy mapping analysis and brain-entropy-based complex network analysis, generating the dynamic complexity mapping of local brain areas and the topological complexity features of connectivity across the brain areas, respectively. Specifically, we firstly extracted BOLD signals from rs-fMRI data by the sliding window method and establish dynamic sample entropy mappings of seafarers and non-seafarers, and then analyze and discuss the results of the dynamic entropy maps. Further, we applied a SampEn-based approach to establish functional connections in complex network analysis between brain regions of the dynamical entropy map sequences, where the SampEn measurement was proved to be sensitive to both non-linear and linear correlations (Pritchard et al., 2014).
Formation of Dynamical Brain Entropy Mapping Analysis
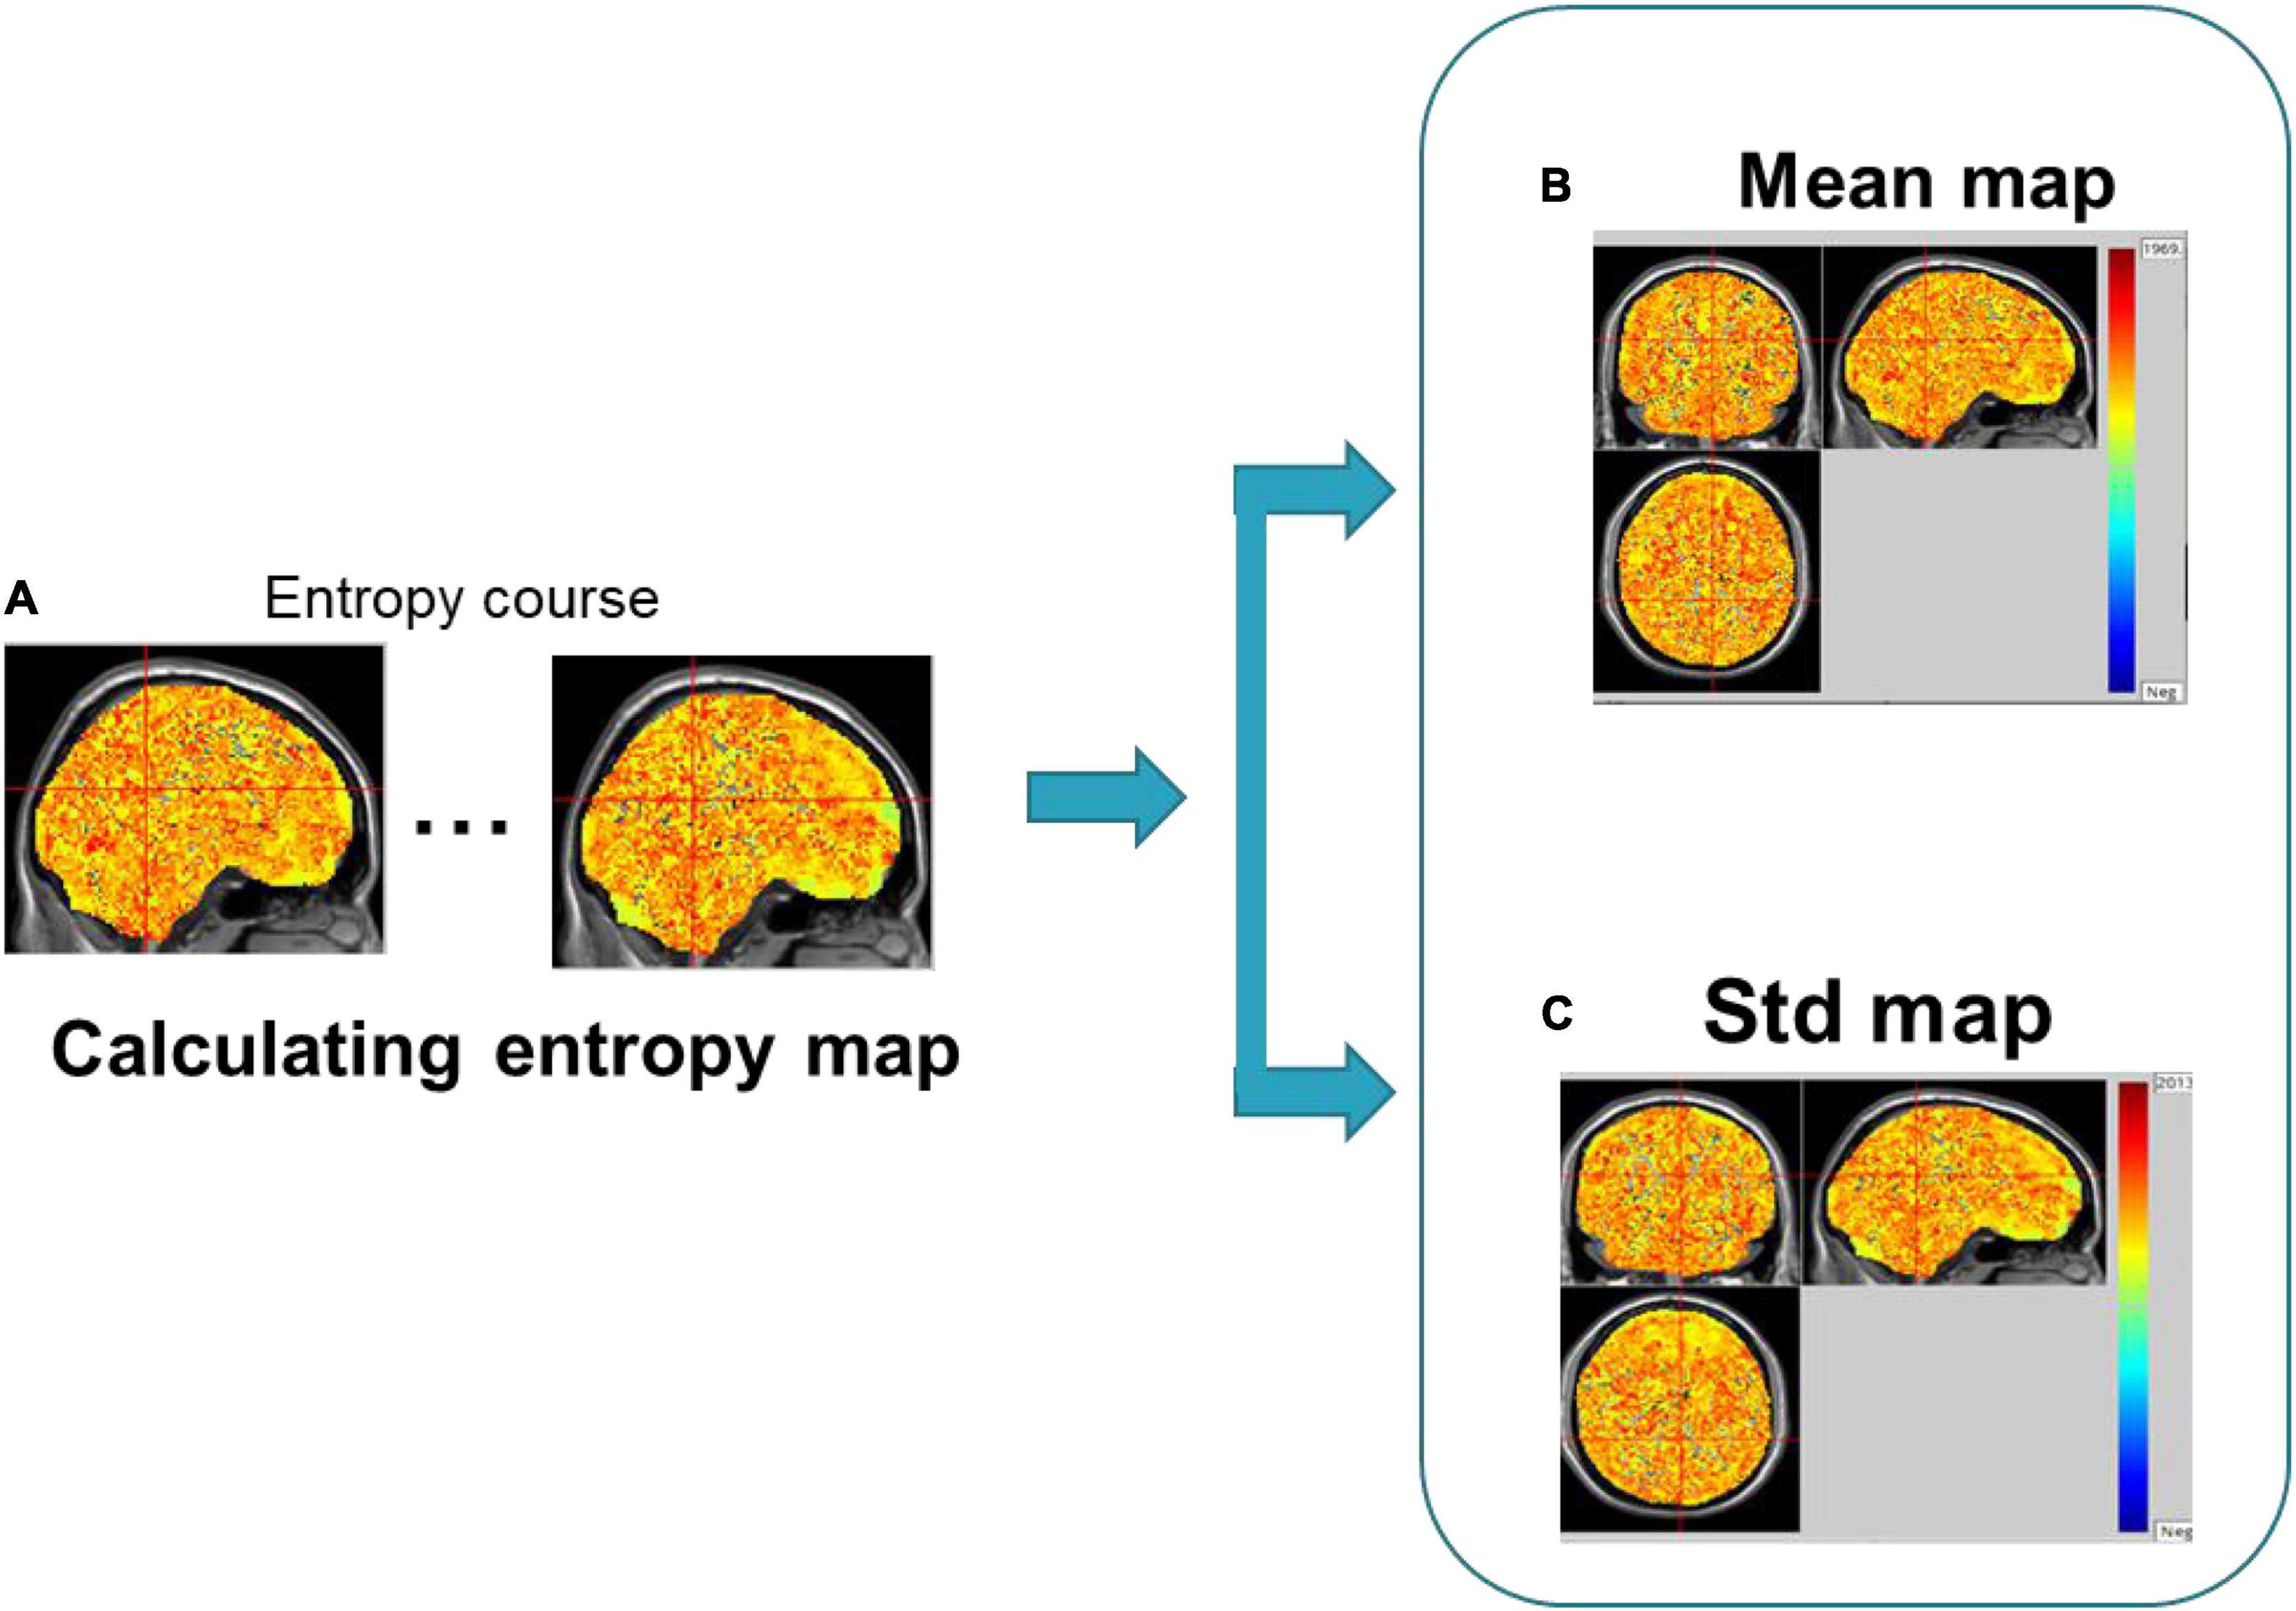
The sliding window method is used to slide a certain window length on the time axis in a given step to extract the BOLD signal within the window, thereby obtaining the time-varying BOLD signal in the brain region (Lindquist et al., 2014; Hindriks et al., 2016; Jia et al., 2017; Vergara et al., 2019). Studies have shown that the effect of data length (N) on SampEn is small when the data length gradually decreases from N = 128 to N = 85, accompanying the gradual increase of its noise (Sokunbi, 2014; Wang et al., 2014). Therefore, in order to achieve a relatively higher signal-to-noise ratio, in this paper, we chose a window length of 70 (80, 90) TRs, about 140–180 s. Then, the transient complexity map of brain activities was calculated by SampEn of the sliding window data. Finally, the brain imaging data of the seafarers and non-seafarers were analyzed based on the dynamic time series of the brain entropy maps (see Figure 1). The detailed procedures and formulation of dynamic brain entropy mapping analysis were presented as follows:
(1) With regard to the preprocessed fMRI images, using the sliding window method, the time window with a given window length of 70 (80, 90) TRs slides in steps of 1 TR, resulting in 81 (71, 61) windows. As mentioned earlier, the fMRI image sequence is represented by X1, X2, …., XN, and the given window length is Len, the fMRI image sequence contained in the ith window is Xi, Xi+1, …, Xi+Len−1; a total of M = N − Len + 1 time windows are obtained.
(2) In a given ith time window, with the seafarers and non-seafarers data described earlier, a brain entropy map based on SampEn was constructed for each of the subjects. For the calculation of SampEn, we set the parameter m (initial embedding dimension) equal to 2 based on preliminary investigations (Sokunbi, 2014). Following Wang et al. (2014), we set the parameter r (similarity criterion) equal to 0.3 of the average of standard deviation (SD) of each pair of the time series. In brief, let u and v represent two time series: u = [u(1), u(2), …, u(N)] and v = [v(1), v(2), …, v(N)], where N is the number of data points in each series. With m and r fixed (as defined earlier), we form two vector sequences xm and ym: xm(i) = [u(i), u(i + 1), …, u(i + m − 1)] and ym(i) = [v(i), v(i + 1), …, v(i + m − 1)]. Then, for each i ≤ N − m + 1, we define
Where j ranges from 1 to N − m(j ≠ i), and d(xm (i), ym(j)) is the distance function. is the distance within r. Then, let
Similarly, we extend to m + 1, and define and Am (r)as
Finally, we can calculate SampEn as
The formula 5 is used to calculate the complexity of the BOLD signal in several sliding windows, resulting in the sample entropy value Ei of the BOLD signal within the ith window.
(3) Calculate the average dynamic entropy maps (Mean-BEN) and the standard deviation of dynamic entropy maps (Std-BEN) of the dynamic entropy maps for each subject in the seafarer group and non-seafarer group, respectively.
(4) After the Mean-BEN and the Std-BEN were calculated, the REST software (Song et al., 2011) was used to perform a two-sample t-test between two groups of mean and standard entropy maps with AlphaSim correction (individual voxel p = 0.01, FWHM = 8 mm, and 1,000 iterations). The results were displayed and located by MRIcro software4 and wfu_pickatlas software (Maldjian et al., 2003, 2004), respectively.
The framework of dynamical brain entropy mapping analysis is displayed in Figure 2.
Dynamical Entropy Based Complex Network Analysis
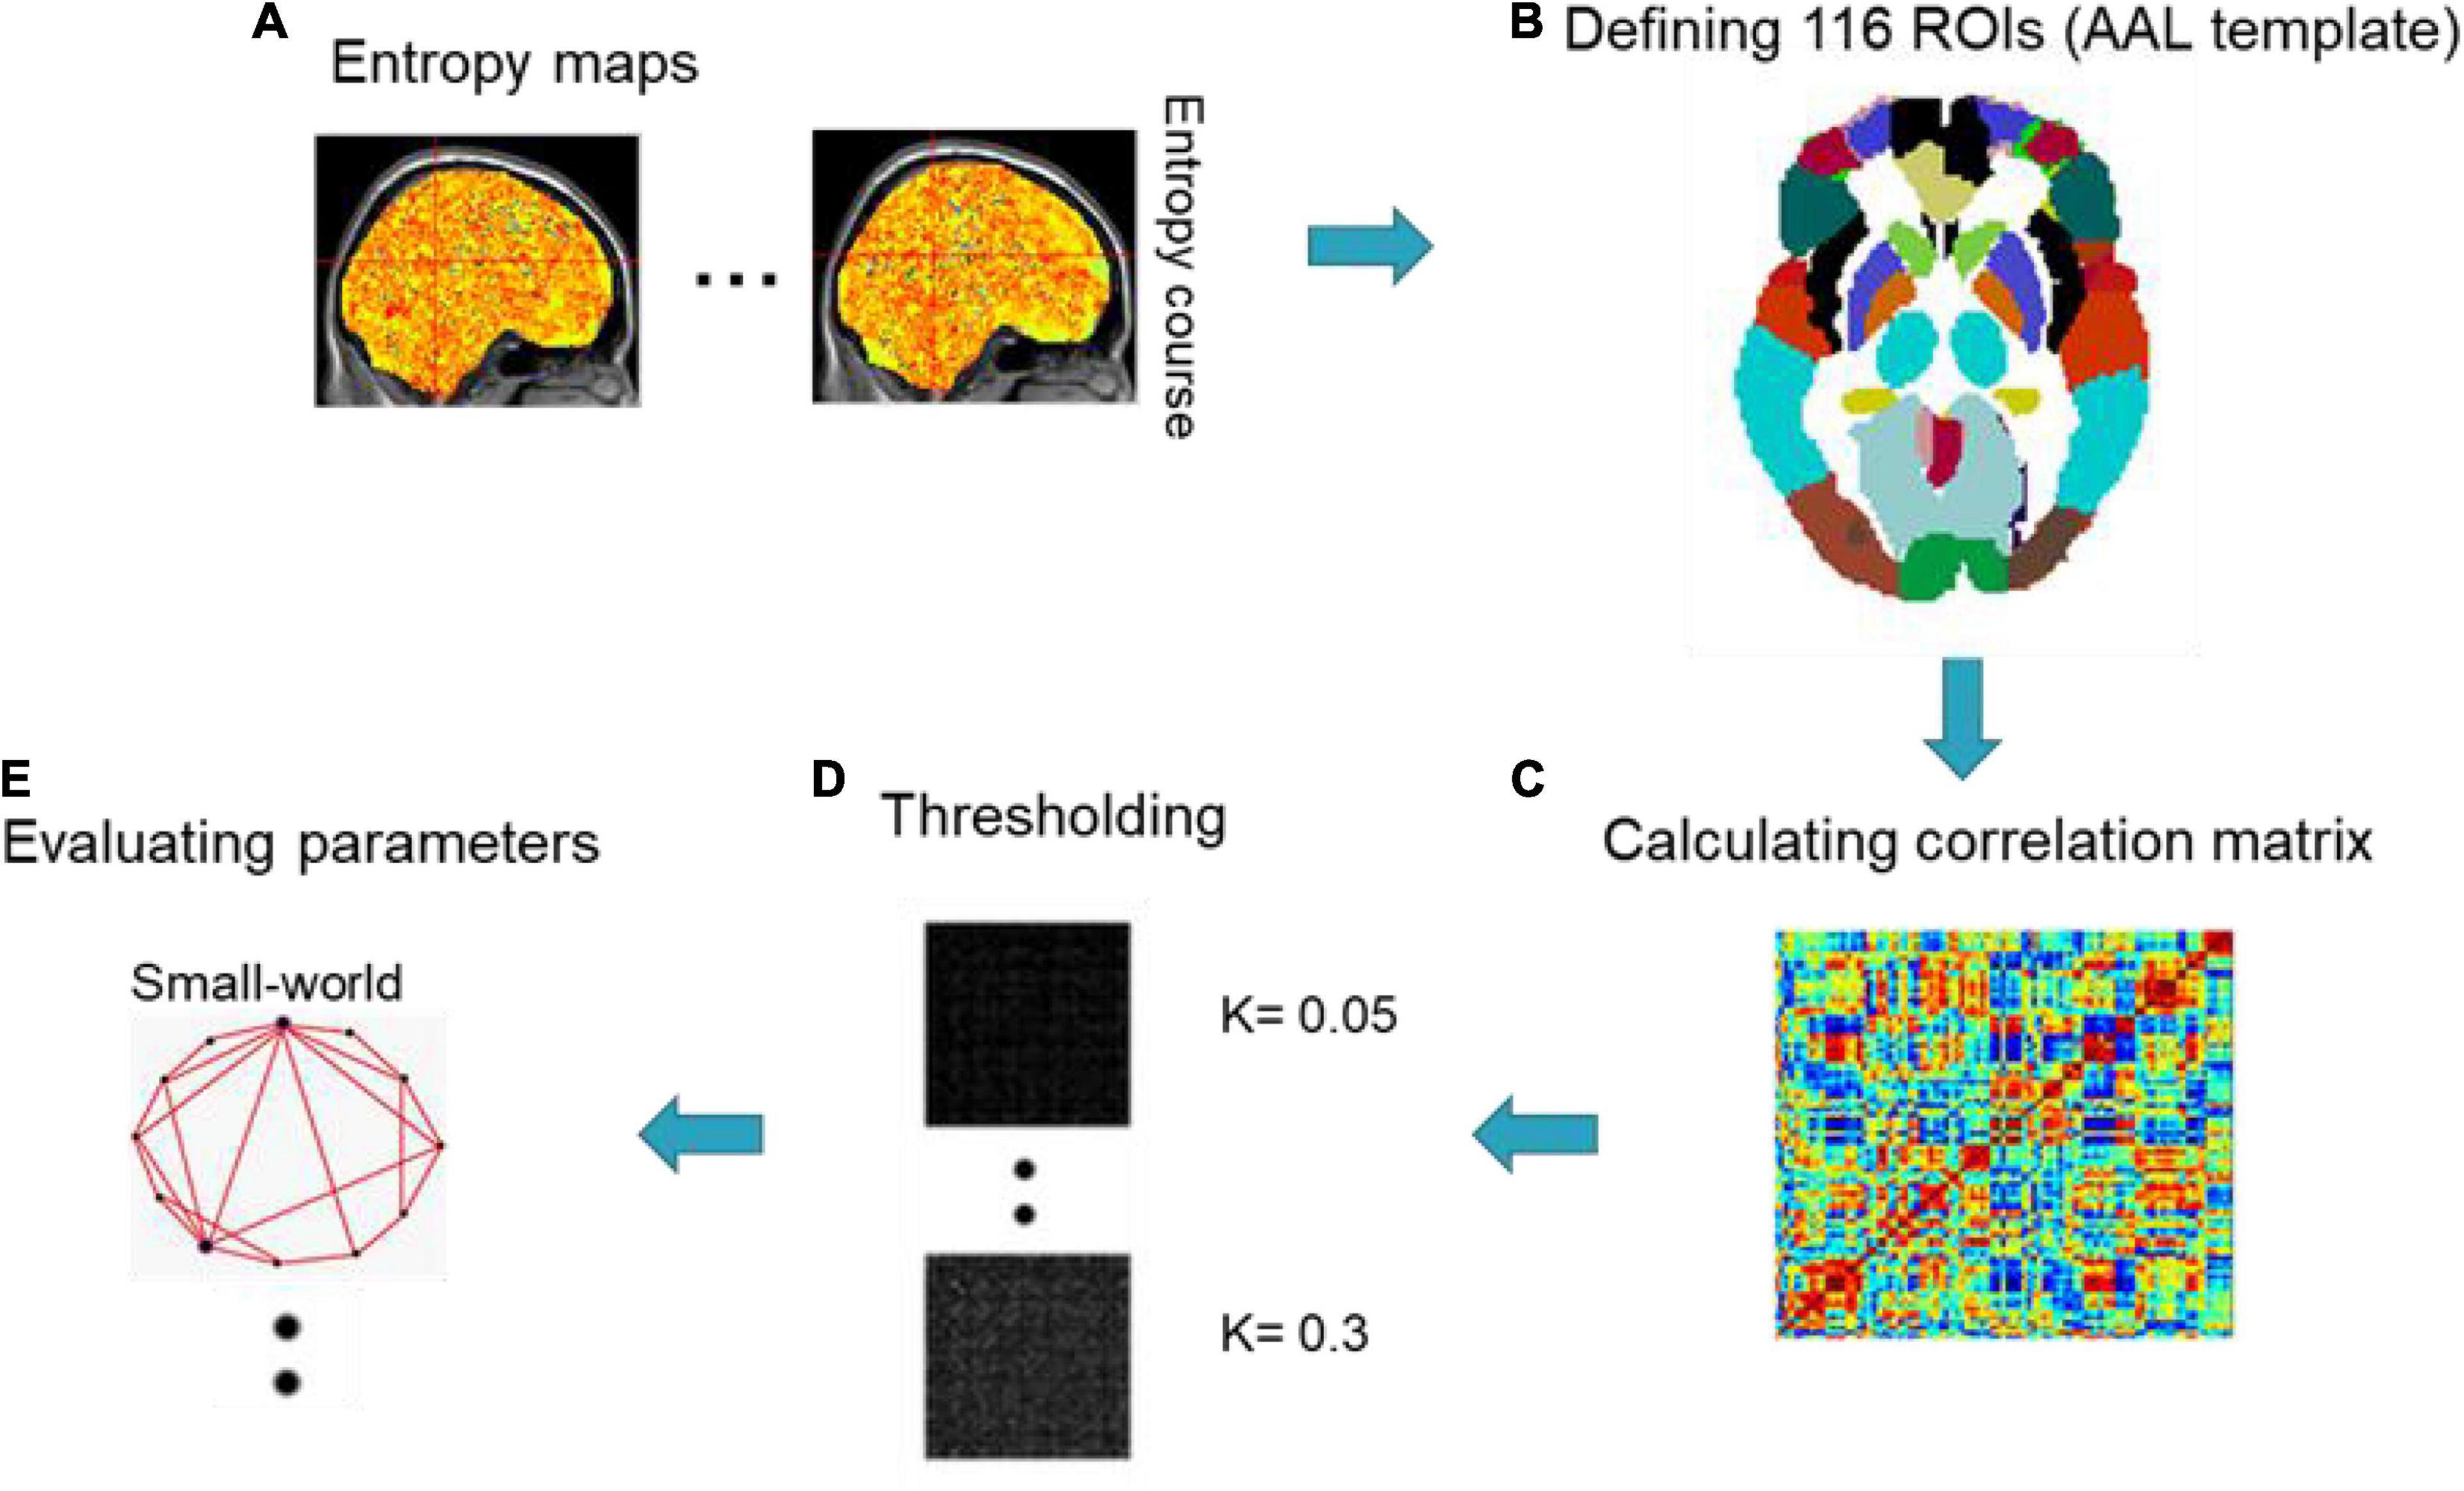
The connection patterns in the human brain have been characterized as various networks, from microscopic neurons (Yu et al., 2008; Bonifazi et al., 2009) to macroscopic whole-brain analysis (Achard et al., 2006; Hagmann et al., 2008; Hayasaka and Laurienti, 2010; Yao et al., 2013; Wang N. et al., 2015; Wang et al., 2016; Shi et al., 2018, 2021; Yang et al., 2019, 2020; Ou et al., 2020; Nie et al., 2021). In order to unveil the topological properties of functional networks caused by occupation between the seafarers and non-seafarers, we used different sliding window lengths to obtain dynamic brain entropy sequences and then applied Pearson correlation coefficients (PCC) and the Automated Anatomical Labeling (AAL) template (Tzourio-Mazoyer et al., 2002) to calculate the correlation of the whole brain interval, so as to calculate the whole brain network connectivity. After creating a correlation network, based on proportional thresholds (K), we calculated two interesting topological parameters based on complex network analysis for the seafarers and non-seafarers: small-worldness and efficiency (Wang J. et al., 2015). The framework of dynamical entropy-based complex network analysis is displayed in Figure 3.
Small-Worldness
Small-worldness is an important concept that characterizes the principles of organization. These principles are reflected in various social operations, business activities, and biological networks (Latora and Marchiori, 2001). The small-worldness is an important attribute of brain functional network, which describes the separation or integration of network functions.
A network with small worldness should meet two conditions: normalized clustering coefficient and normalized characteristic path length λ = Lp/Lrand ≈ 1, where Cp and Lp are the average clustering coefficient and average path length on all nodes in the target network, respectively (Watts and Strogatz, 1998); Crand and Lrand are the average clustering coefficient and average characteristic path length of the random network, respectively (Maslov and Sneppen, 2002). Generally, random networks have smaller clustering coefficients and shorter characteristic paths due to their randomness. Lower Lp indicates higher communication efficiency between the entire brain area (Kaiser and Hilgetag, 2006; Rubinov and Sporns, 2010). In order to avoid the influence of another network, the normalized Cp and Lp are calculated, respectively. Compared with random networks, small-world networks have similar Lp and higher Cp, so small-world networks can be quantified as .
Efficiency
Efficiency is an index that describes the brain network from the perspective of biological and functional information flow within the brain (Rubinov and Sporns, 2010). The efficiency of the whole brain network and the regional one can be evaluated.
Global efficiency: the shorter the shortest path length Li of a node, the faster the information transfer between the node and other nodes, which means the higher the global efficiency Eglob of the node (Rubinov and Sporns, 2010). We define it as
where dij denotes the shortest path length between nodes i and j.
Local efficiency: Local efficiency is the same attribute as global efficiency, but the calculation of local efficiency is performed in the neighborhood of a node in the network (Rubinov and Sporns, 2010). The formulation can be expressed as
where Eloc(Gi) is the local efficiency of Gi.
Experimental Results
Dynamical Entropy Maps Between Seafarers and Non-seafarers
The negatively activated brain areas using dynamical brain entropy mapping analysis under different window length (Len = 70, 80, 90 TRs) shown in Figure 4 indicates that the dynamical brain entropy value of seafarers is lower than that of the control group. The activated area is mainly concentrated in the cerebellum, especially the bilateral Cerebelum_8 brain area in the AAL brain atlas. The MNI coordinates and the corresponding areas are recorded in Tables 1–3, respectively.
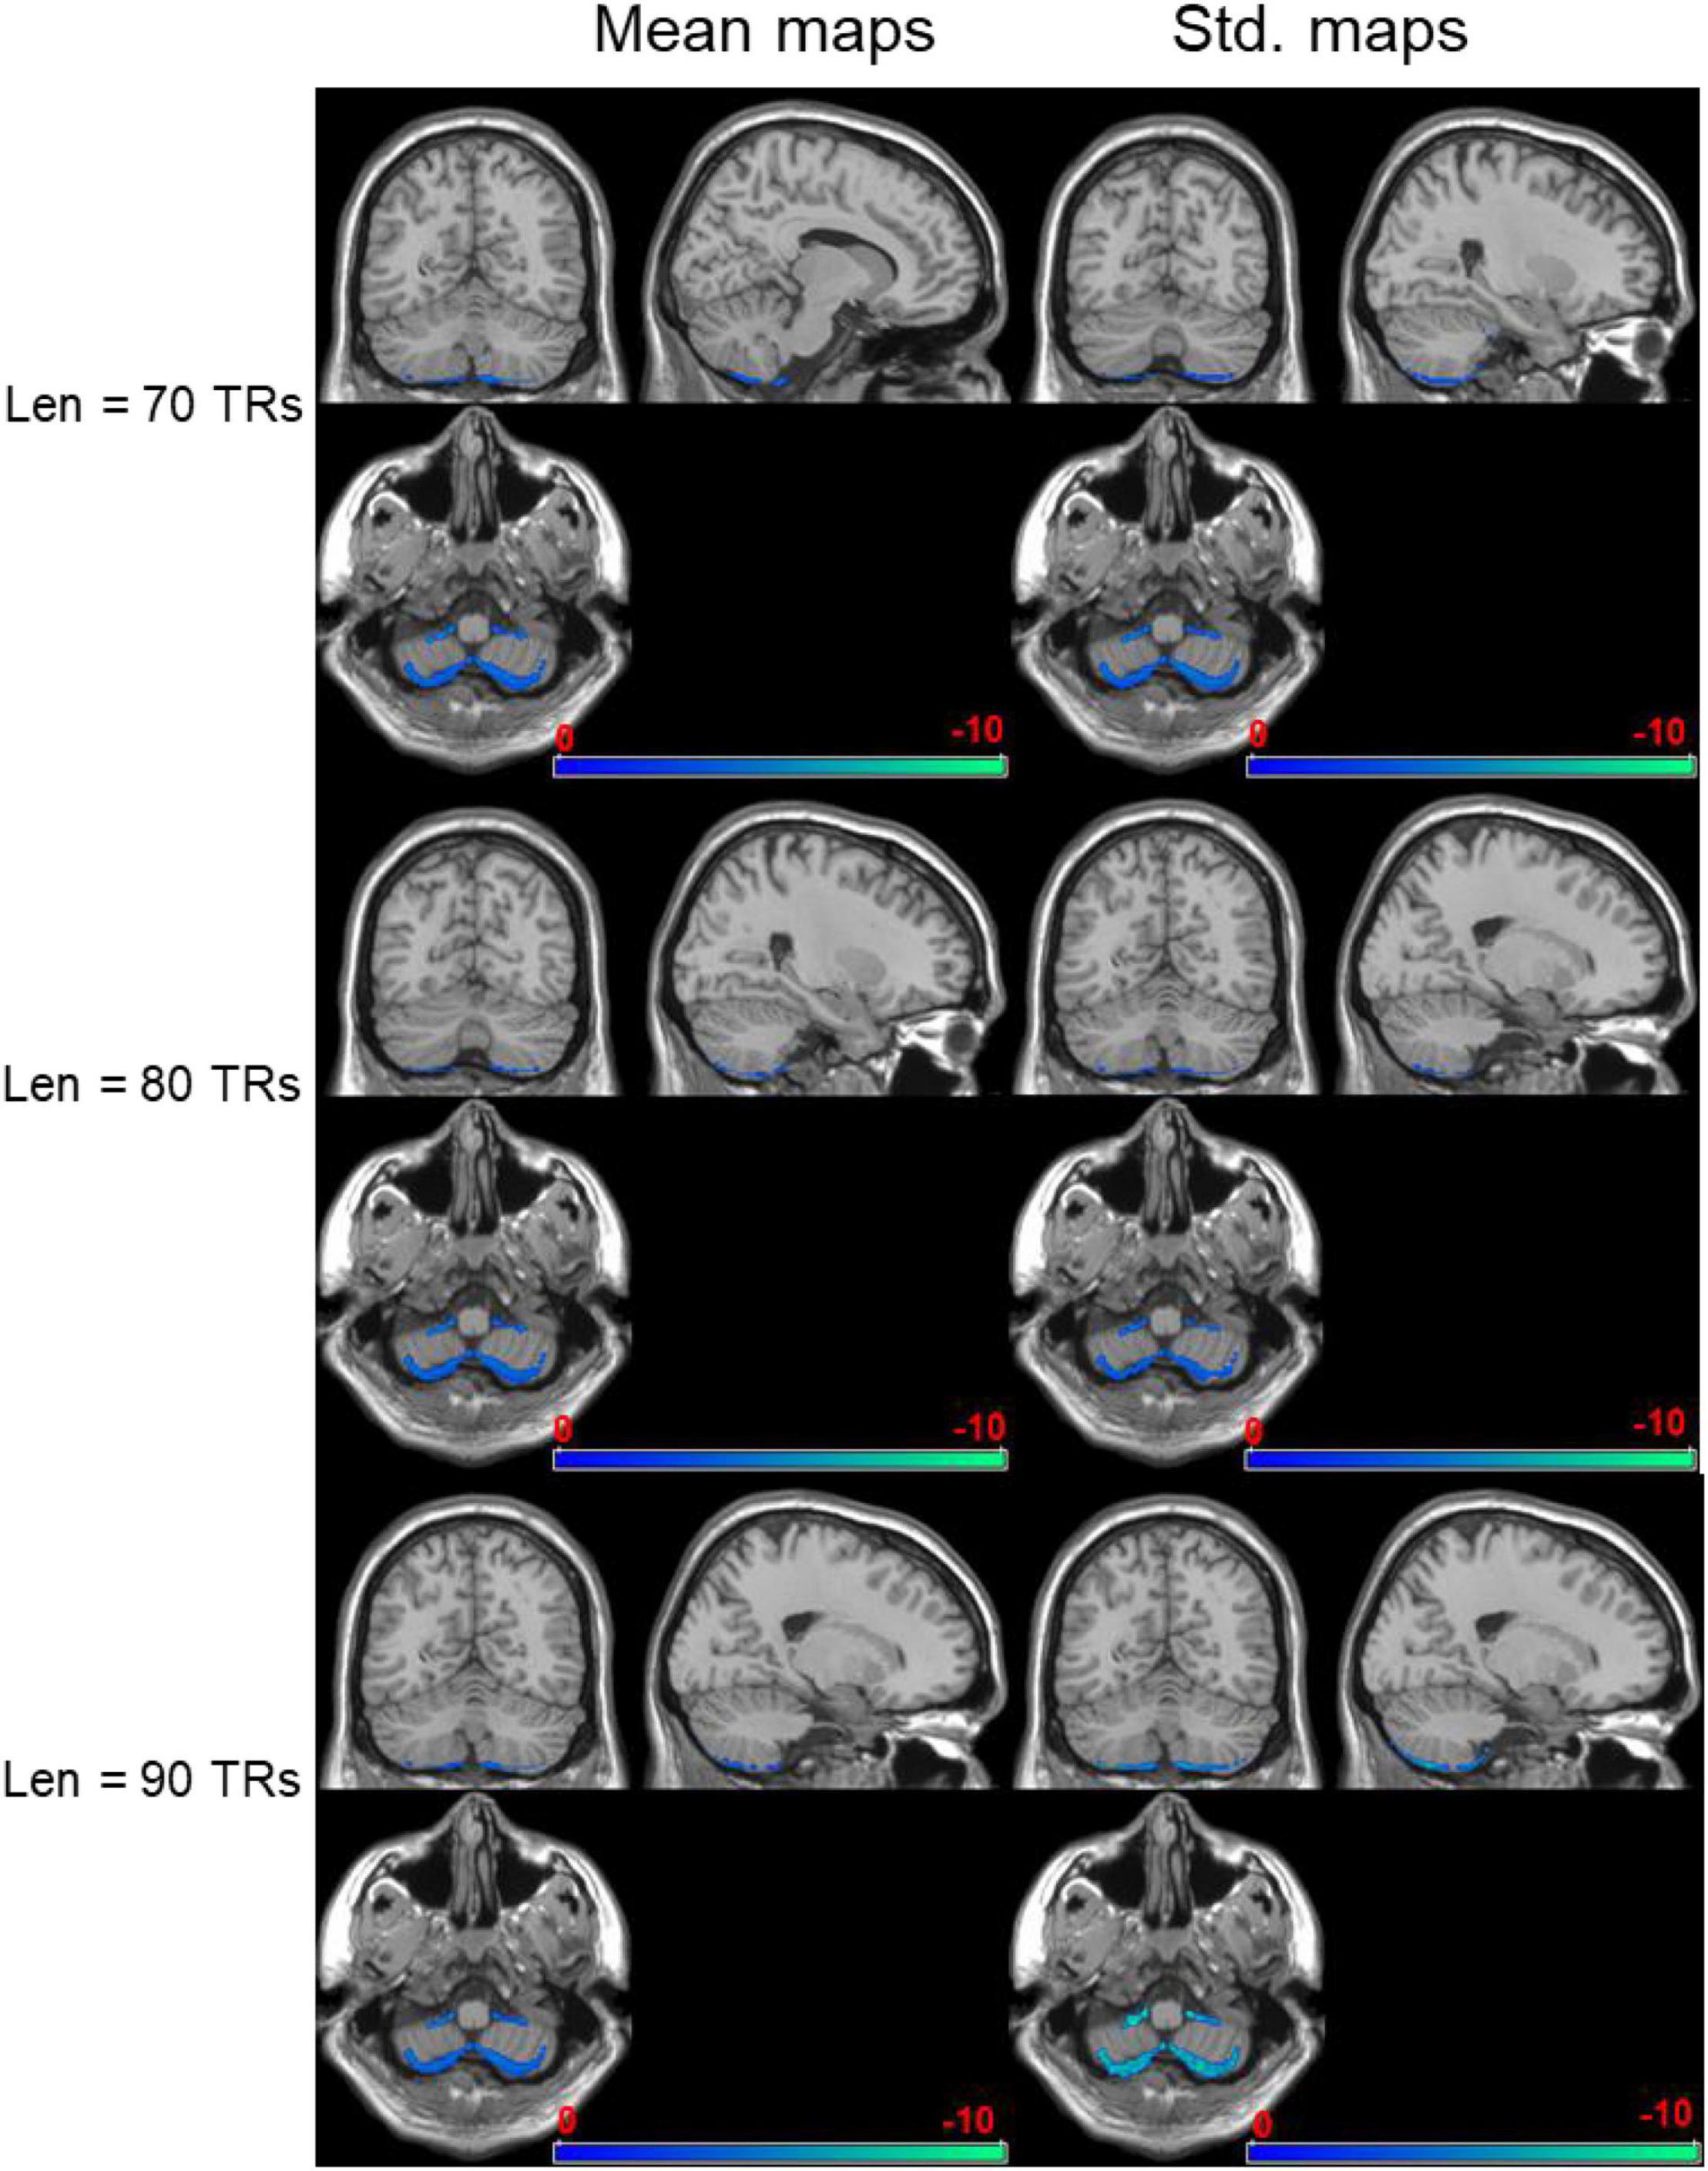
Figure 4. Negatively activated brain regions regarding dynamical brain entropy maps (seafarers’ entropy value < non-seafarers’ entropy value; AlphaSim correction, p < 0.05).

Table 1. MNI coordinates of negatively activated brain regions and related brain regions (seafarers’ brain entropy value < non-seafarers’ brain entropy value, Len = 70 TRs, AlphaSim correction, p < 0.05 with cluster size > 207 voxels).

Table 2. MNI coordinates of negatively activated brain regions and related brain regions (seafarers’ brain entropy value < non-seafarers’ brain entropy value, Len = 80 TRs, AlphaSim correction, p < 0.05 with cluster size > 210 voxels).

Table 3. MNI coordinates of negatively activated brain regions and related brain regions (seafarers’ brain entropy value < non-seafarers’ brain entropy value, Len = 90 TRs, AlphaSim correction, p < 0.05 with cluster size > 202 voxels).
The positively activated brain areas using dynamical brain entropy mapping analysis under different window length (Len = 70, 80, and 90 TRs) shown in Figure 5 indicates that the seafarer’s dynamic brain entropy value exceeds the expected value. The activation area is mainly concentrated in the fusiform gyrus, especially the brain area Brodmann area 20 (BA20), which involves the activated brain area, and the corresponding MNI coordinates are recorded in Tables 4–6, respectively.
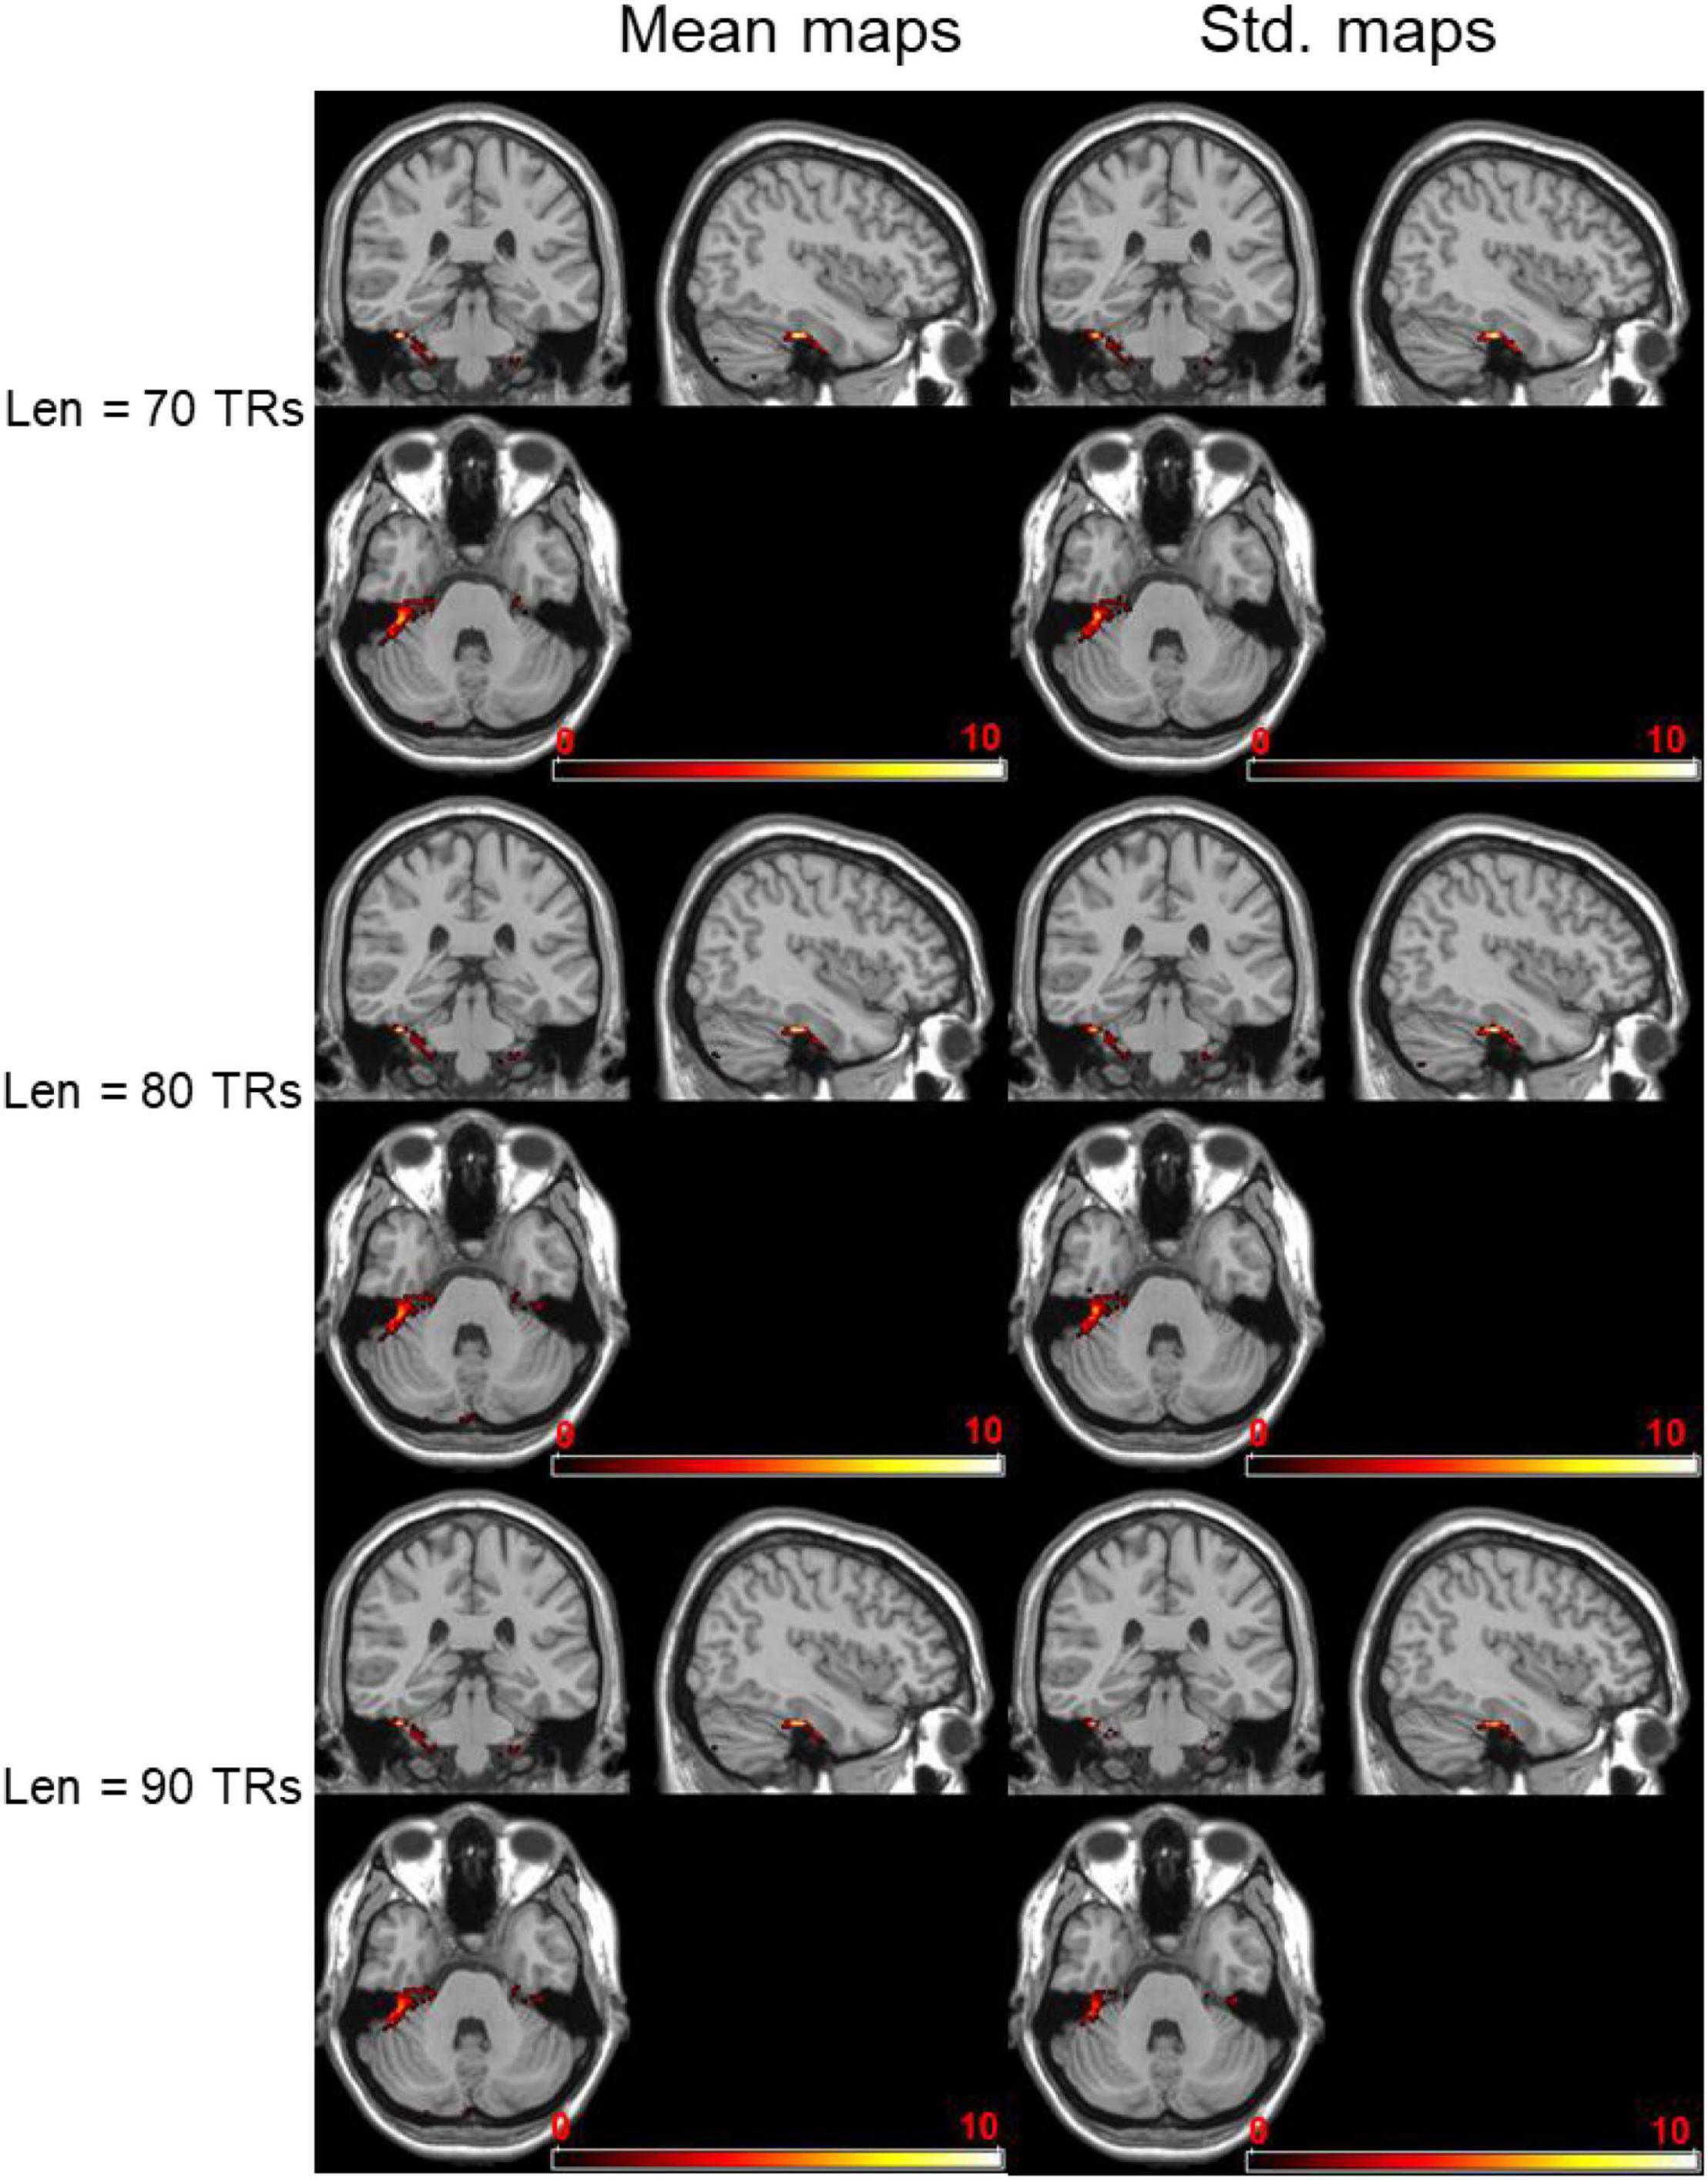
Figure 5. Positively activation brain regions regarding dynamic brain entropy maps (seafarers’ entropy value > non-seafarers’ entropy value; AlphaSim correction, p < 0.05).

Table 4. MNI coordinates of positively activated brain regions and related brain regions (seafarers’ brain entropy value > non-seafarers’ brain entropy value, Len = 70 TRs, AlphaSim correction, p < 0.05 with cluster size > 207 voxels).

Table 5. MNI coordinates of positively activated brain regions and related brain regions (seafarers’ brain entropy value > non-seafarers’ brain entropy value, Len = 80 TRs, AlphaSim correction, p < 0.05 with cluster size > 210 voxels).

Table 6. MNI coordinates of positively activated brain regions and related brain regions (seafarers’ brain entropy value > non-seafarers’ brain entropy value, Len = 90 TRs, AlphaSim correction, p < 0.05 with cluster size > 202 voxels).
Dynamical Entropy-Based Complex Network Analysis Between Seafarers and Non-seafarers
First, the average and variance of small world attributes (i.e., small world, feature path length, and clustering coefficient) and network efficiency (i.e., global efficiency and local efficiency) within the range of 0.05 ≤ K ≤ 0.3 (step size = 0.05) under different sliding window lengths were calculated for the seafarers and non-seafarers, and the results are shown in Figures 6–8, respectively. Second, the two groups compared across the proportional thresholds (K) by means of two-way analysis of variance (ANOVA), the details are listed in Tables 7–9, respectively.
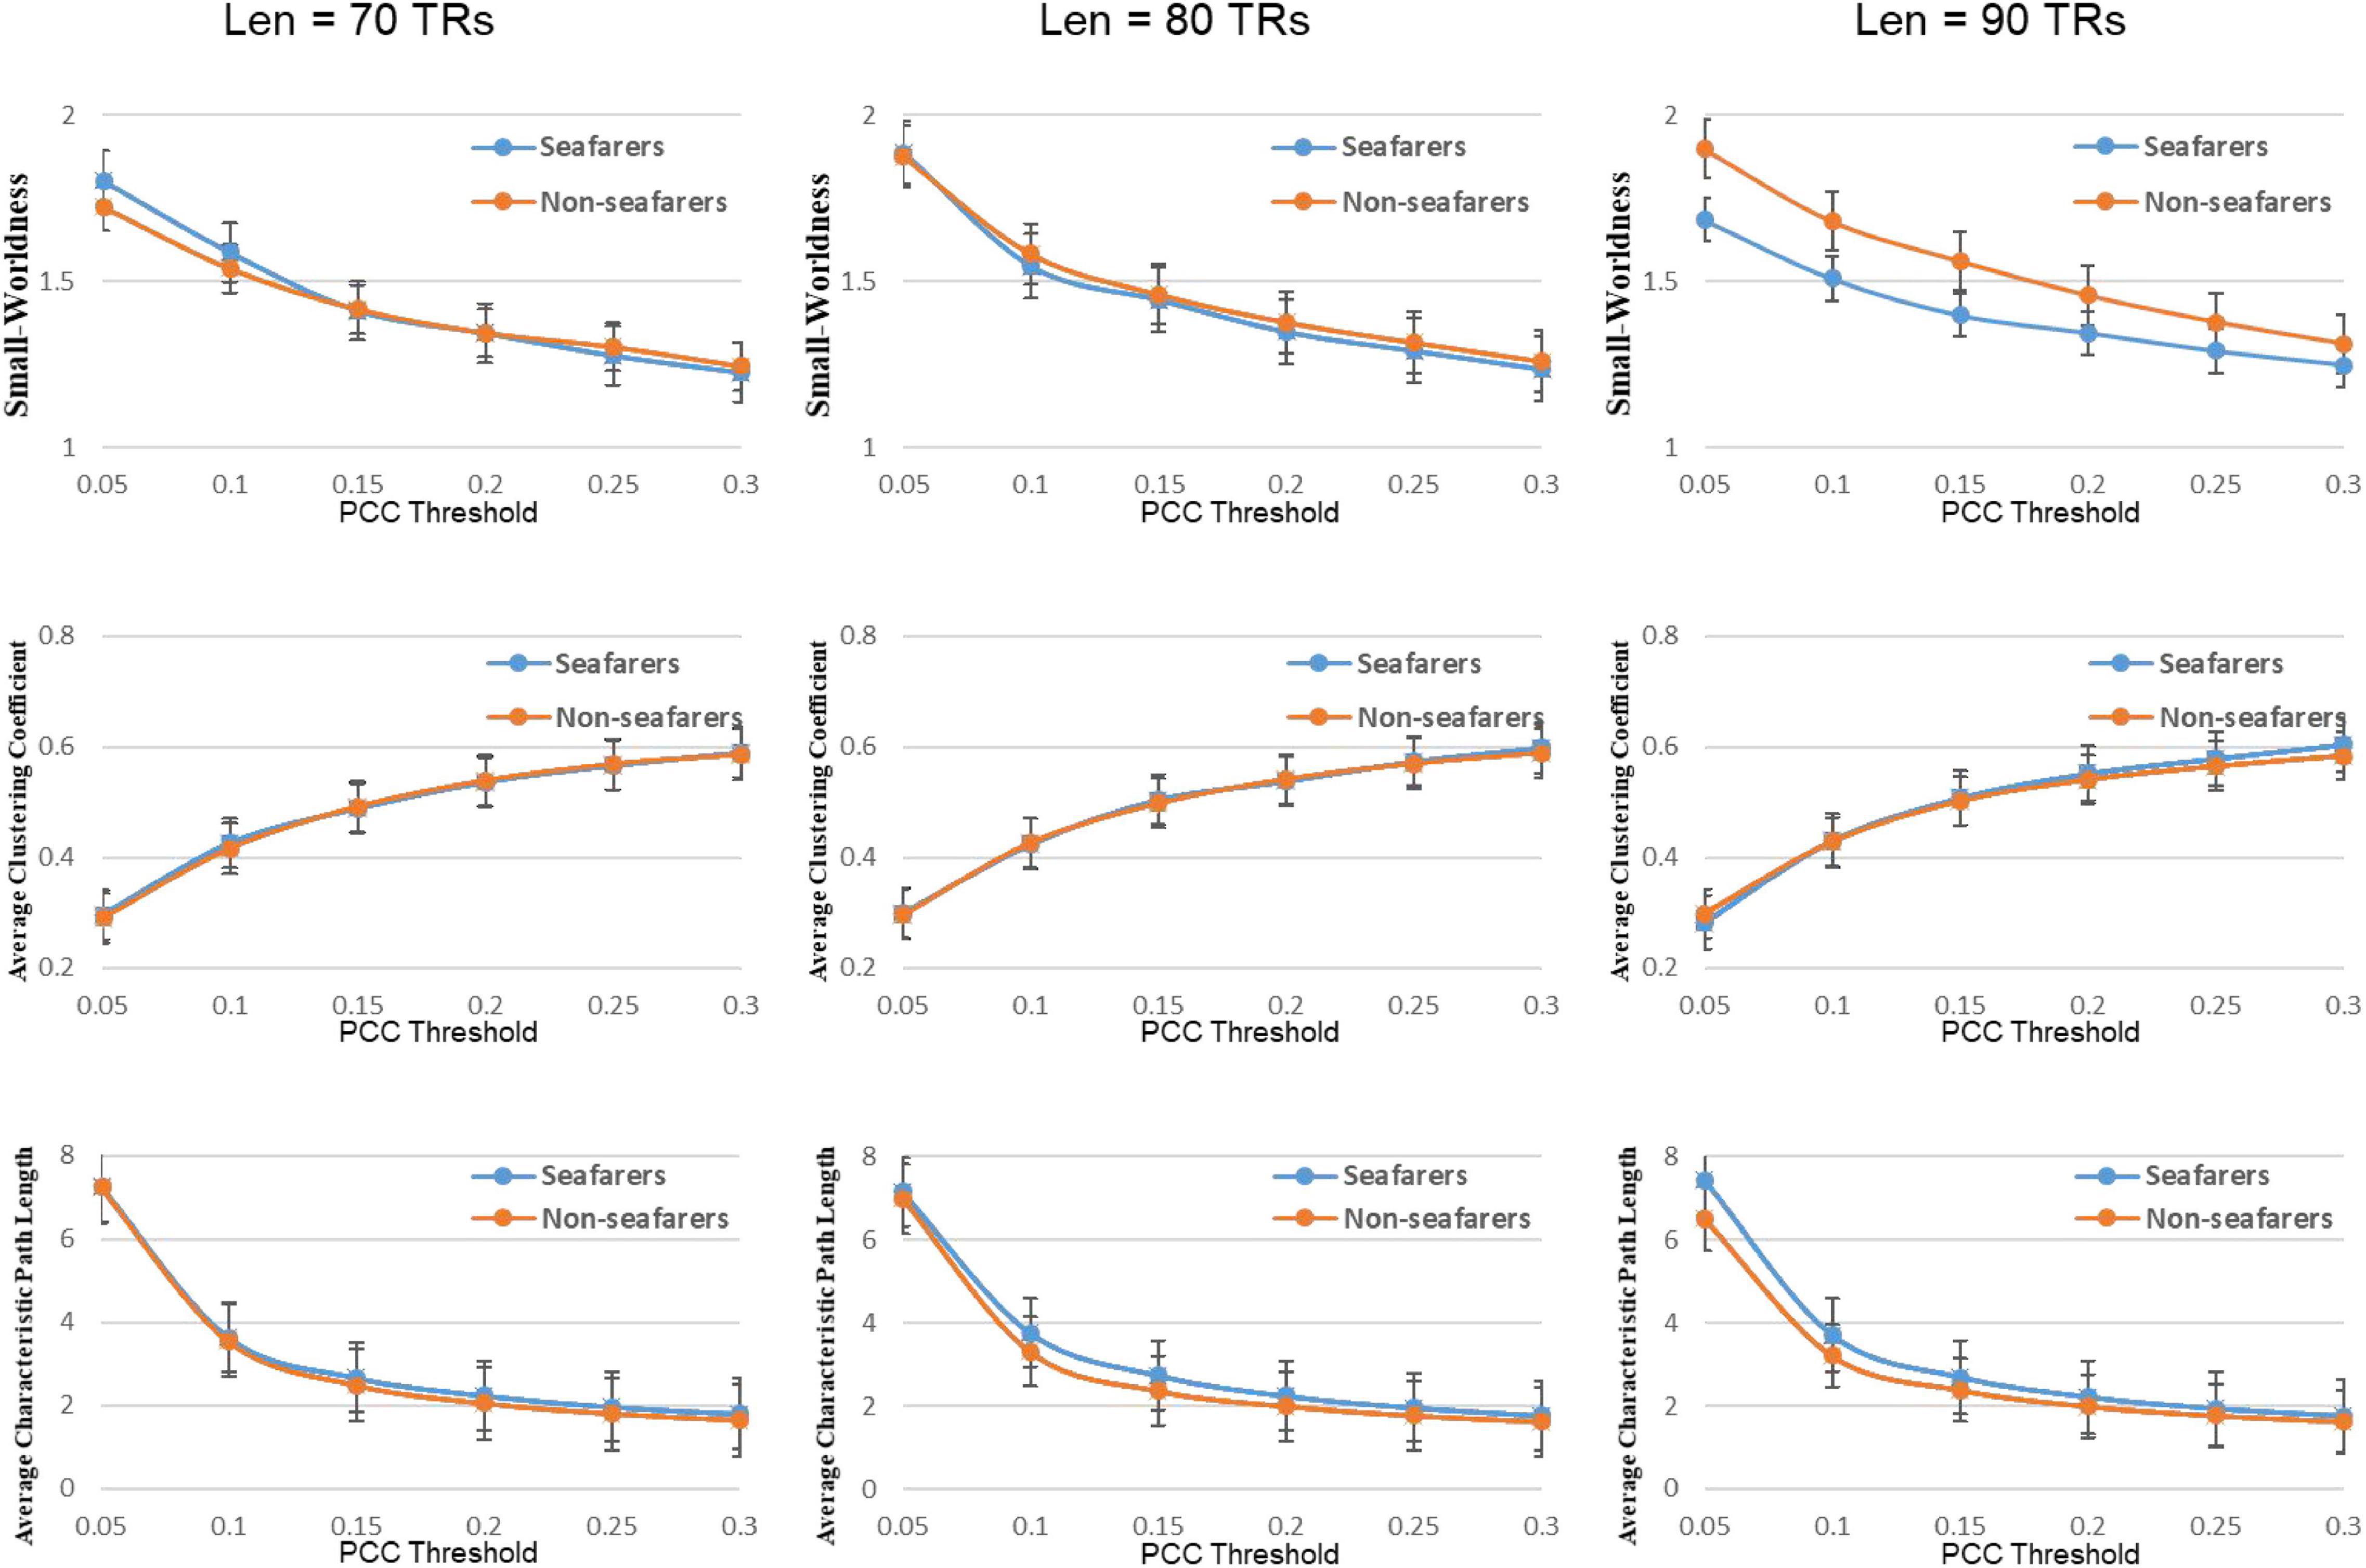
Figure 6. Average values of small world attributes and their parameters of the seafarers and non-seafarers based on brain entropy time series under different window lengths and different thresholds.
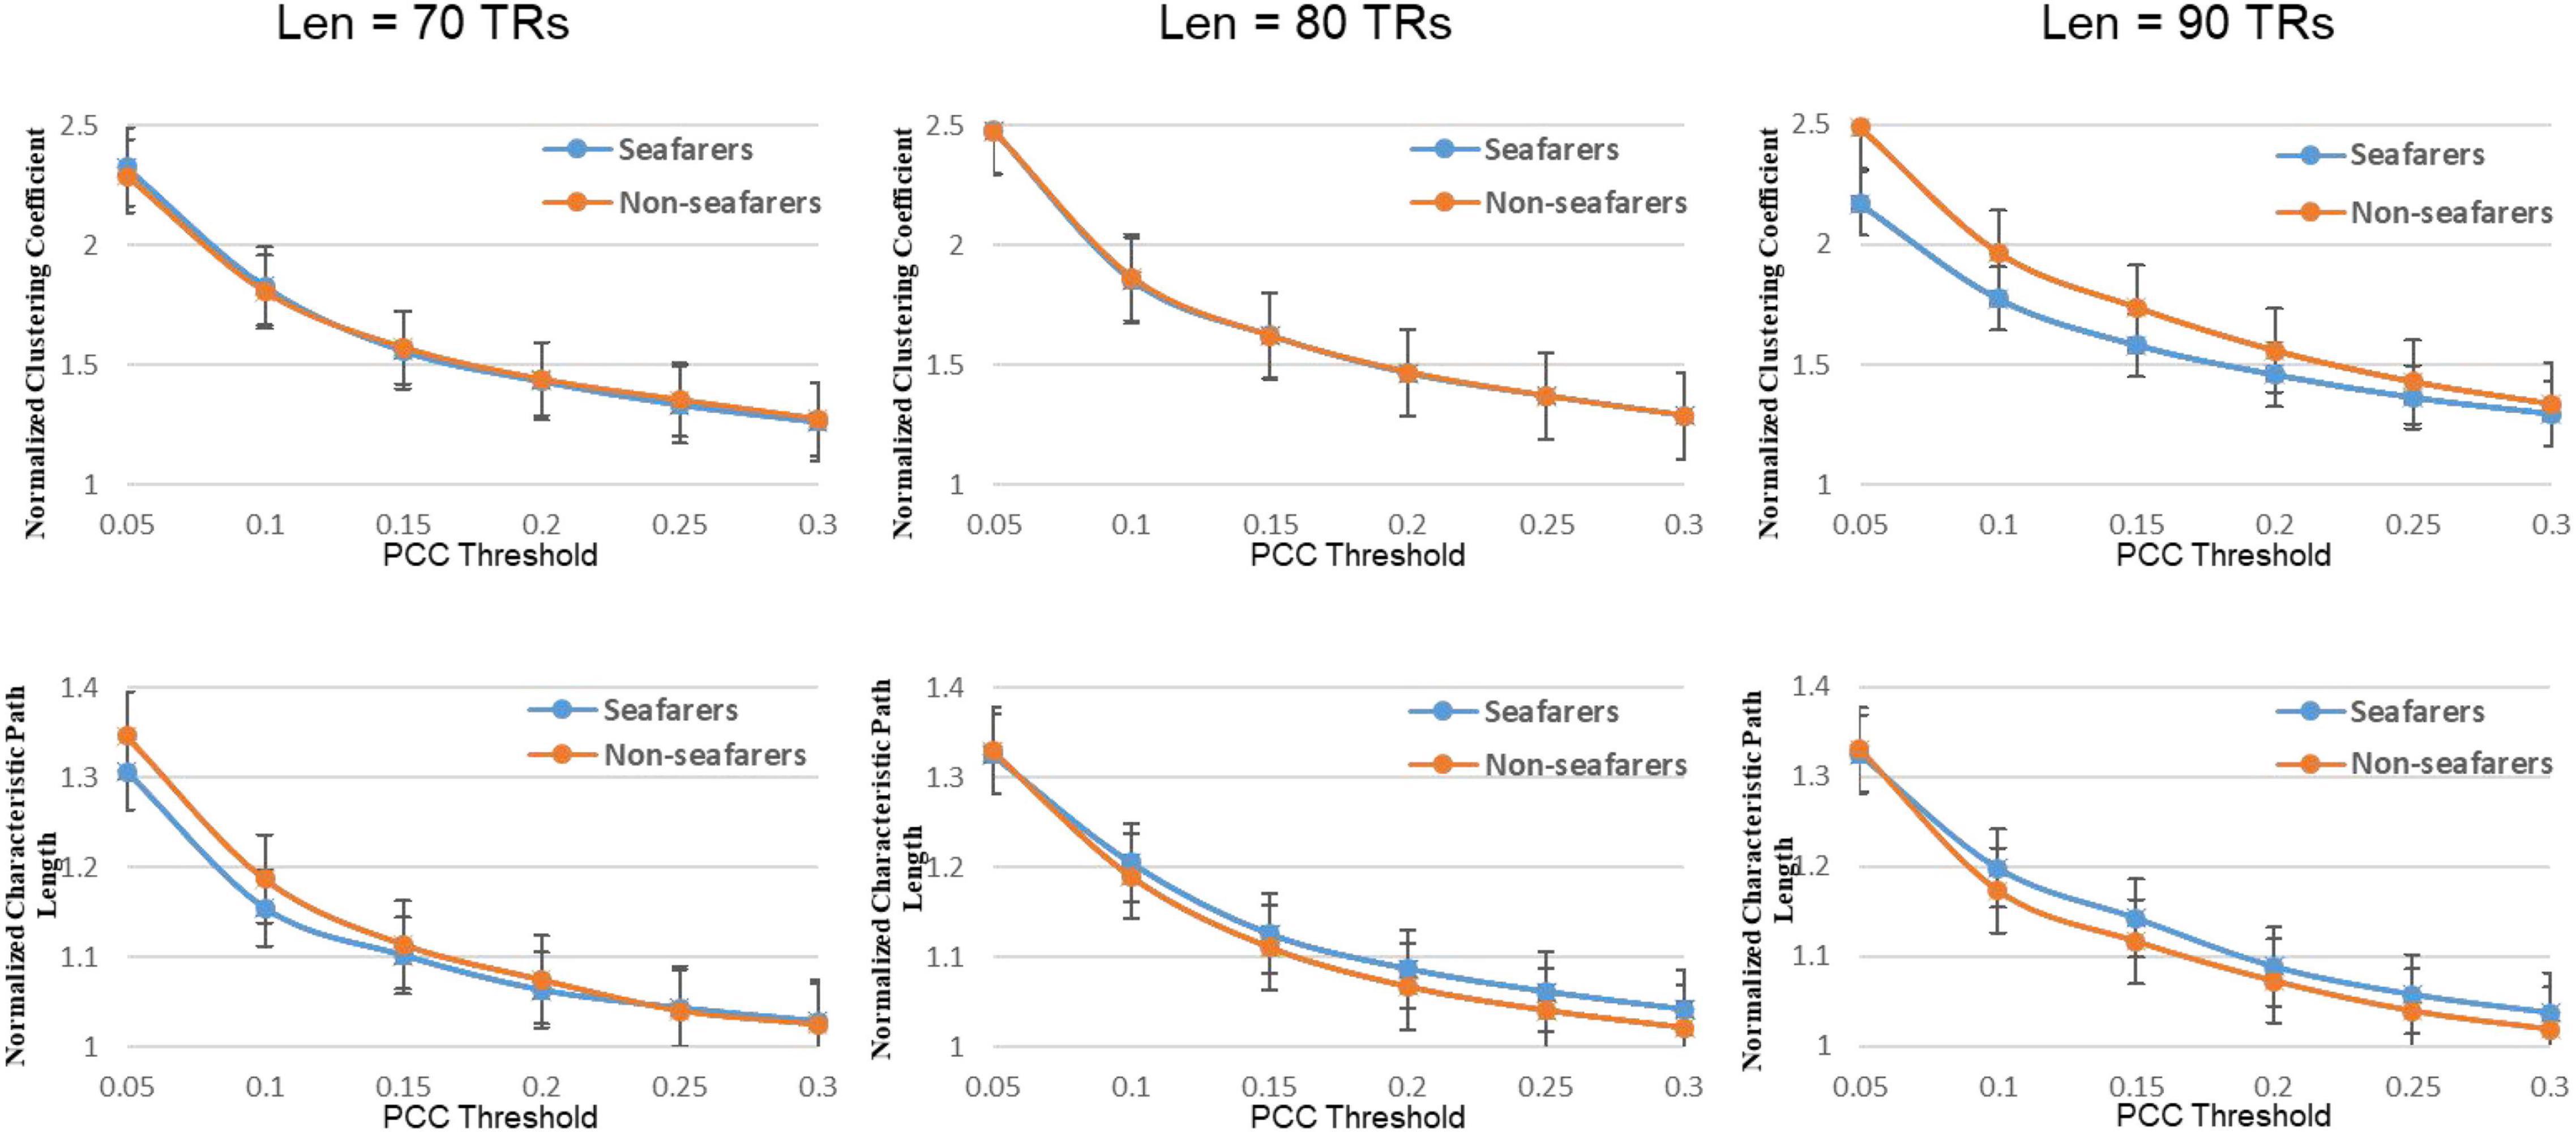
Figure 7. The average normalized path length and average normalized clustering coefficient of the seafarers and non-seafarers based on brain entropy time series under different window lengths and different thresholds.
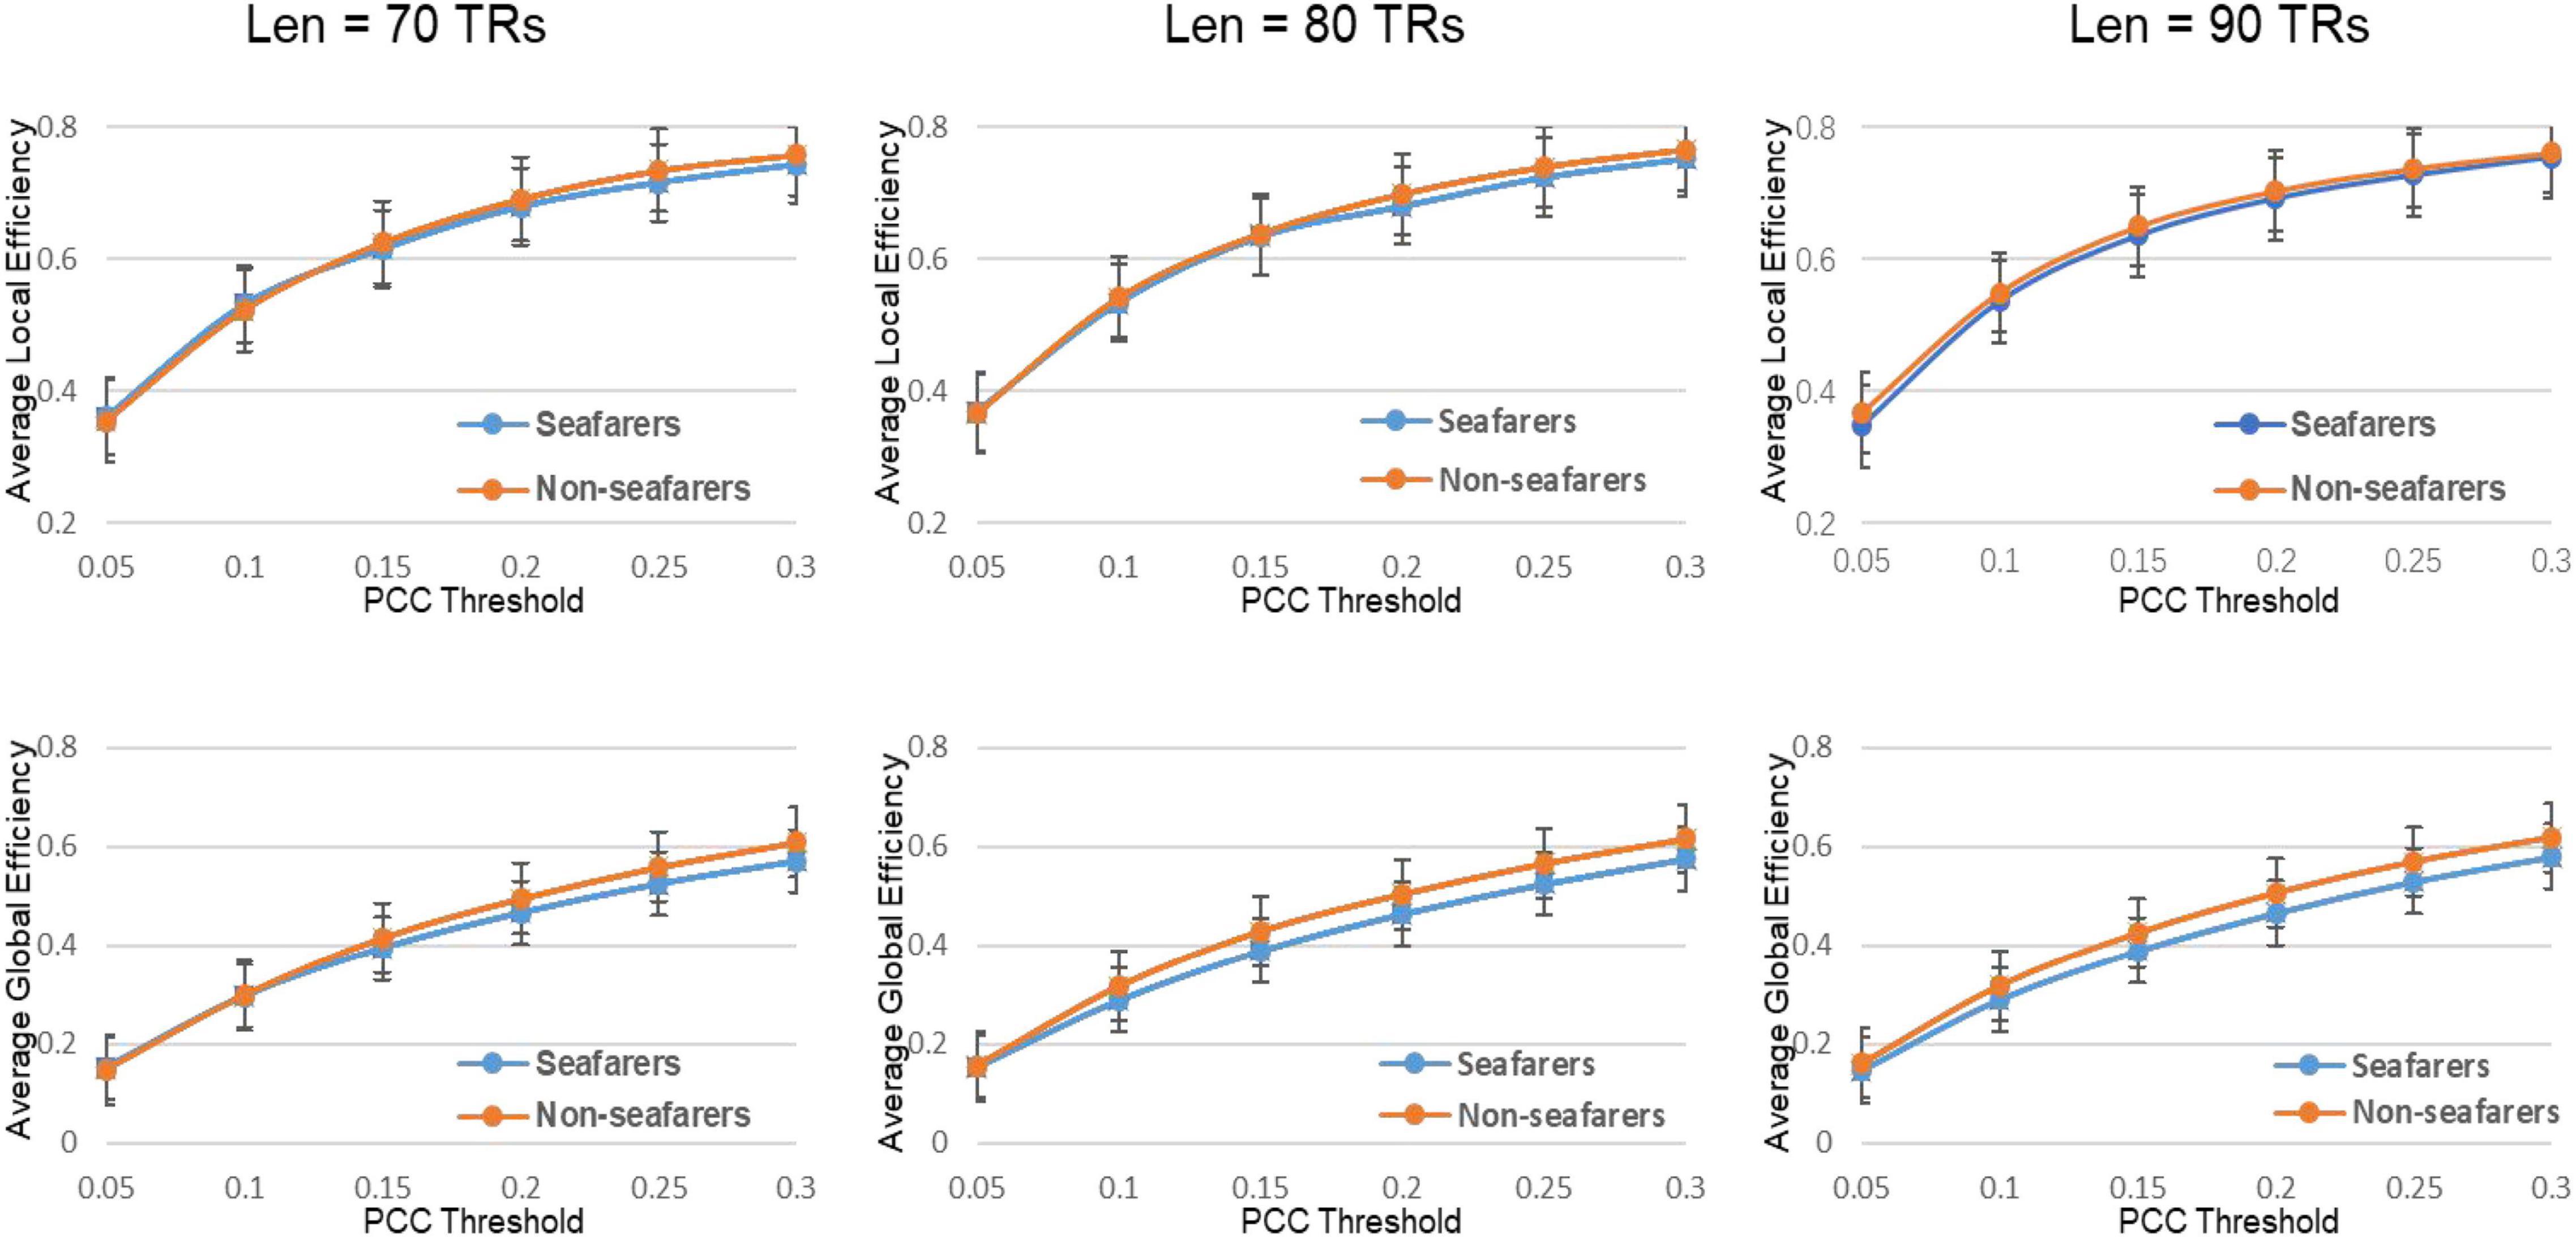
Figure 8. The average value of the efficiency attribute and its parameters of the seafarers and non-seafarers based on brain entropy time series under different window lengths and different thresholds.
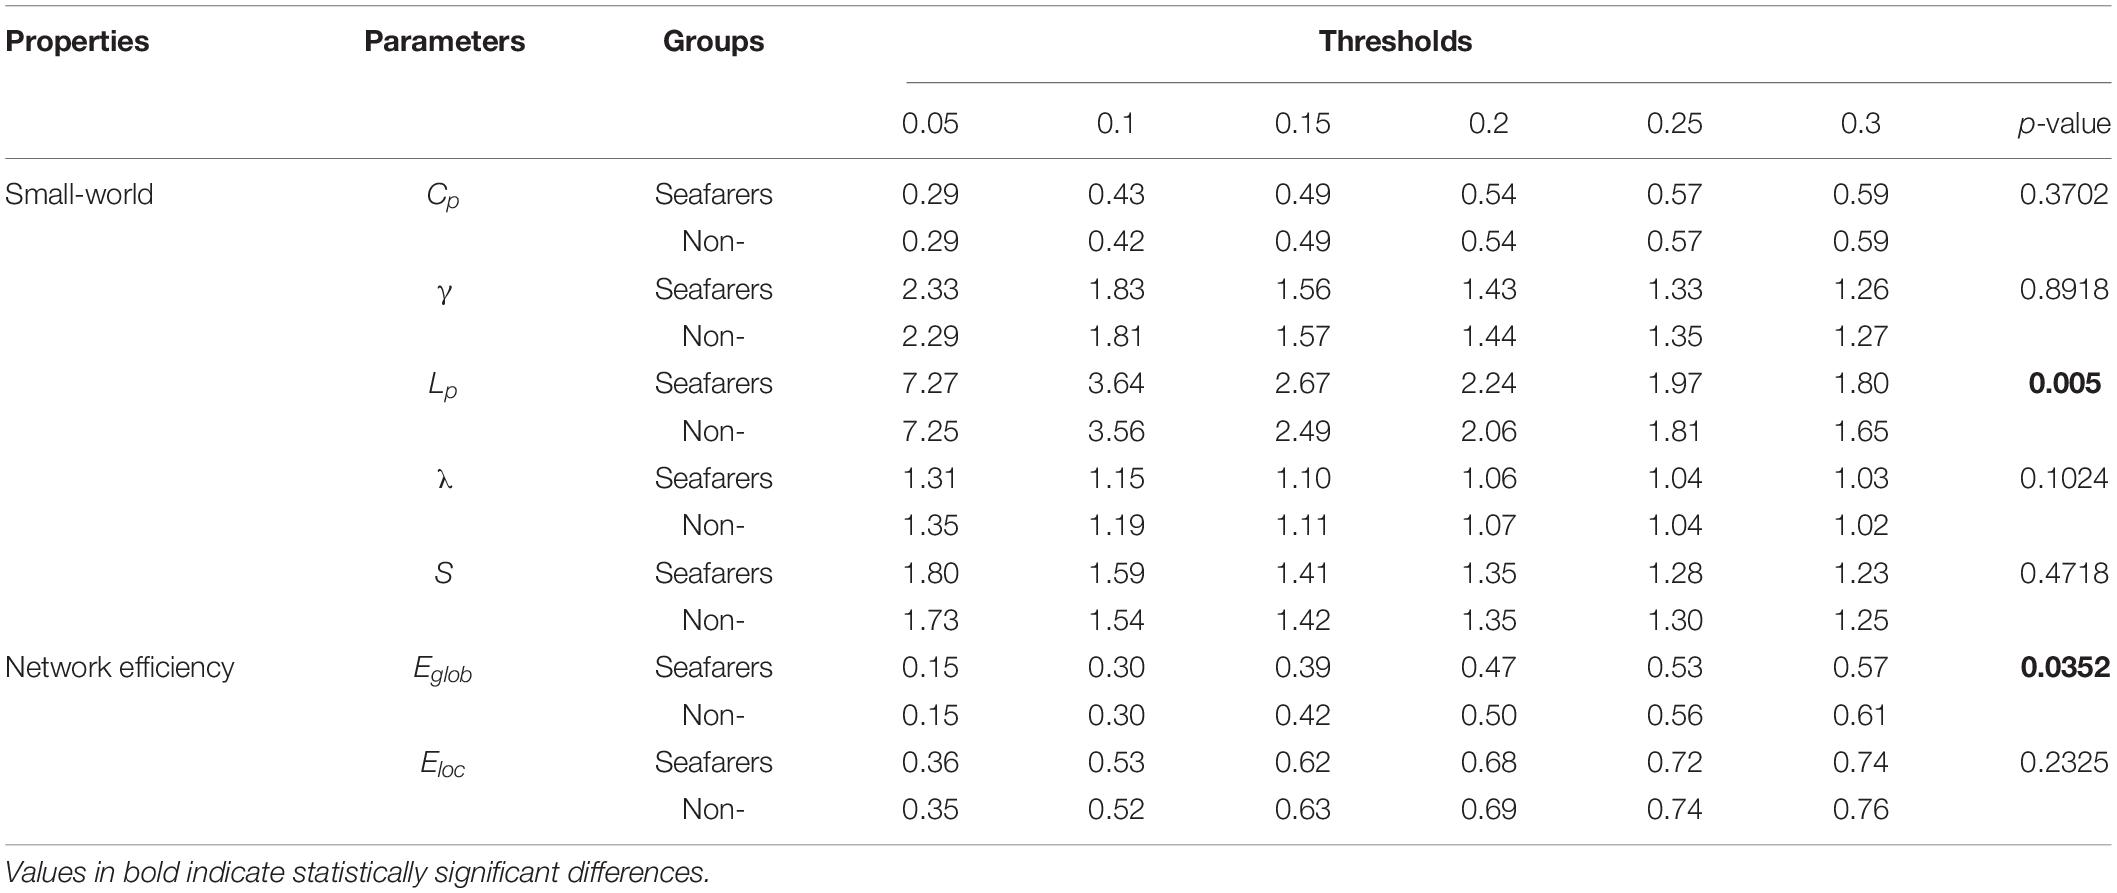
Table 7. The mean of all network parameters for seafarers and non-seafarers at Len = 70 TRs are presented, as well as the results of two-way ANOVA (p-value).
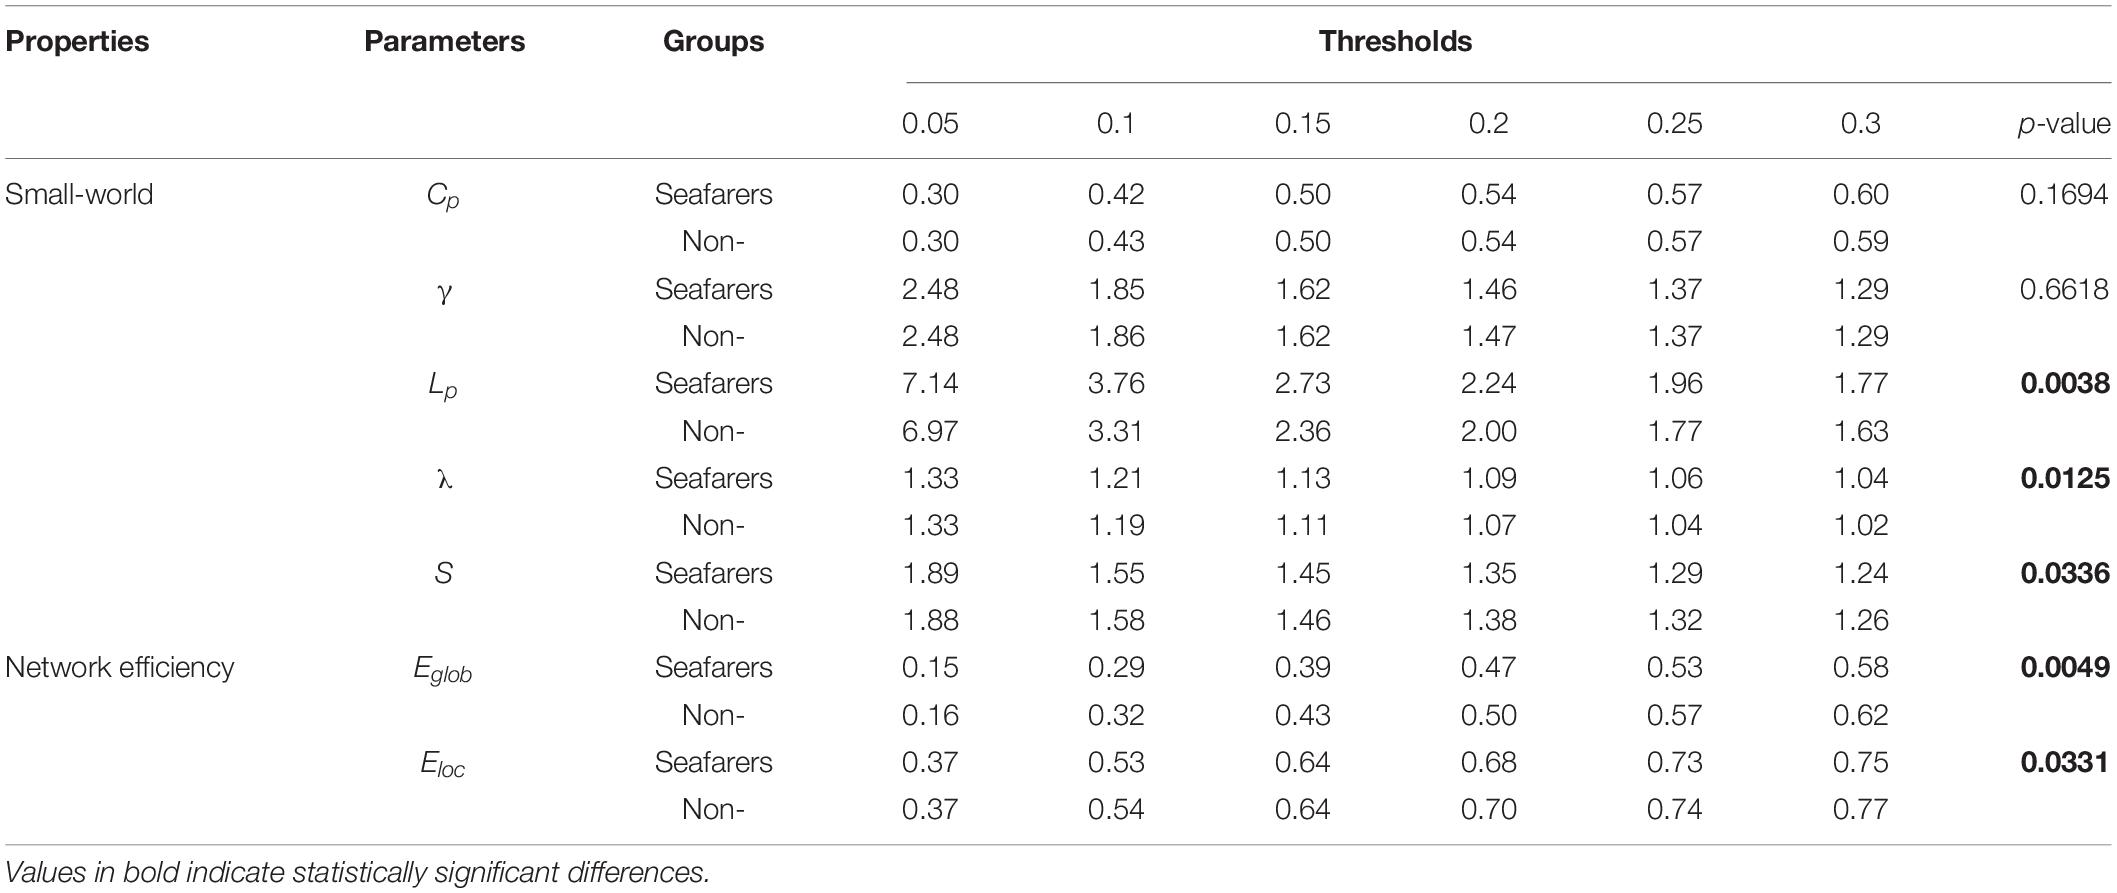
Table 8. The mean of all network parameters for seafarers and non-seafarers at Len = 80 TRs are presented, as well as the results of two-way ANOVA (p-value).
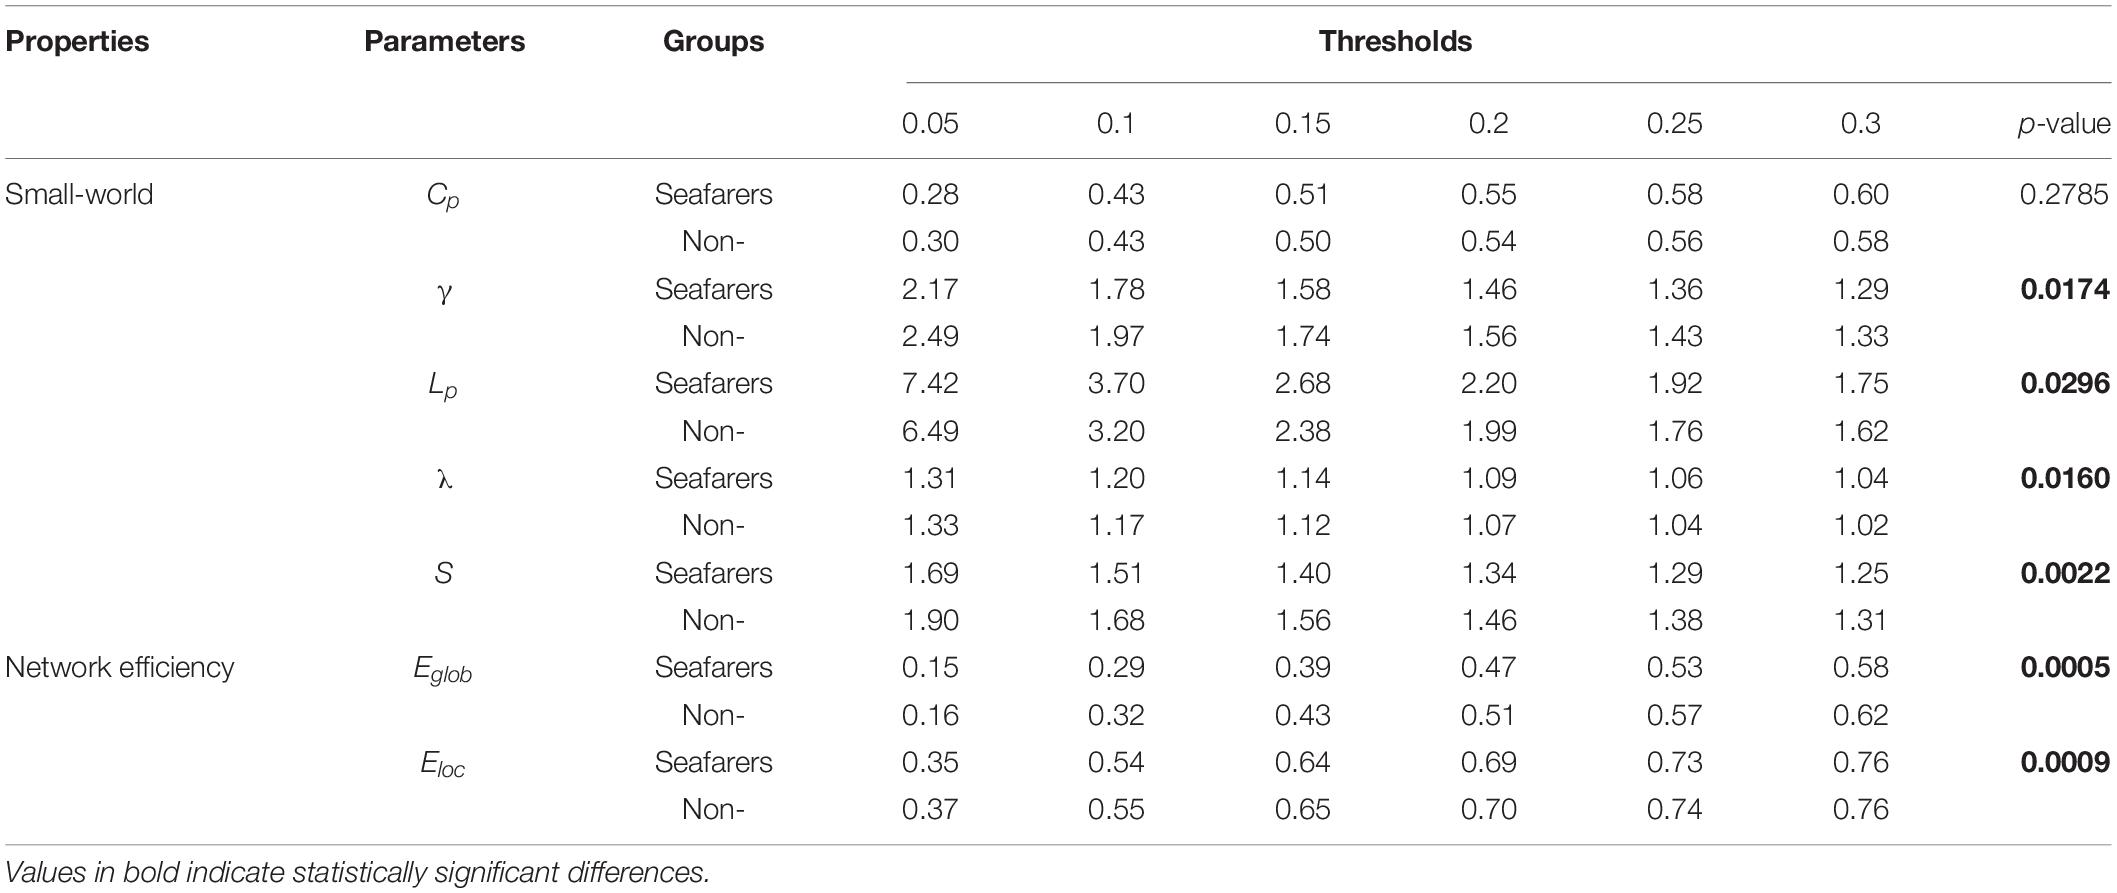
Table 9. The mean of all network parameters for seafarers and non-seafarers at Len = 90 TRs are presented, as well as the results of two-way ANOVA (p-value).
Discussion
In this work, we demonstrated a DBCA framework using sample entropy to explore the complexity fingerprints at both voxel level and brain connectivity topology levels, which was made up of dynamical brain entropy mapping analysis and brain entropy based on complex network analysis. Taking the seafarer as an exemplar, the DBCA simultaneously generated the dynamical brain entropy maps and related connectivity topology exhibiting the qualitative complexity differences, which suggested the long-term seafarer’s experience really reshaped the brain functional network, and provided the new evidence about the occupational neuroplasticity.
Local Activity Changes of Functional Neuroplasticity in Seafarers
The sliding window model has become a popular model for handling typical fMRI data (Allen et al., 2014). Studies have considered about the dynamic and non-linear changes of BOLD signal (Sokunbi, 2014; Niu et al., 2018; Zheng et al., 2020), which can be characterized by the complexity of the fMRI time series. As for us, under different window lengths, the brain complexity estimated by the sample entropy of seafarers and non-seafarers always showed significant results, indicating that the length of the sliding window is not sensitive to changes in brain complexity. Our result is estimated by computing brain entropy maps of entire subjects using a series of sliding windows.
Similar to the previous results of seafarers (Wang N. et al., 2018), the dynamic entropy values of the seafarer group in the cerebellum (Cerebelum_9_R/Cerebelum_8_R and Cerebelum_8_L) were significantly lower than those in the non-seafarer group, which is crucial for fine motor coordination. The findings indicated that the seafarers’ plasticity changes are stable and construct a regularity system in the cerebellum. Therefore, we can infer that the long-term offshore work has an obvious influence on the functional neuroplasticity of the human cerebellum, at least within the working life. However, it is not clear whether this change will disappear gradually after the seafarer retires or will accompany it for a lifetime.
On the other hand, in a relatively short period of time, the entropy value of the seafarer group in the fusiform gyrus (BA20) is higher than that of the non-seafarer group, which is also reflected in the previous brain entropy measurement (Wang N. et al., 2018). The fusiform gyrus (FG) is related to the ability of face processing (Ghuman et al., 2014); obviously, it is essential for social situations. Since the seafarer group has differential activation patterns in FG, we would like to infer seafarers suffering from social difficulties after experiencing a long voyage in isolating working conditions.
Interestingly, we did not find that the dynamic brain entropy results showed that the seafarer group had higher brain entropy value in the superior temporal gyrus and part of the frontal lobe (Rectus_L/Frontal_Sup_Orb), compared with the non-seafarer group. Sample entropy cannot show the same discrimination effect in dynamic evaluation and overall analysis. This difference can be attributed to its noise (i.e., physical motion), of which noise level at N = 90 (the data length of the dynamic analysis) is higher than N = 150 (the overall analysis of the data length) (Sokunbi, 2014). In our results, the peak intensity gradually decreased as the window length increases, while the noise level comes down.
Topological Changes of Functional Neuroplasticity in Seafarers
Characterizing complex systems like the human brain can help in understanding its structure and function; especially with the advantage of rs-fMRI, it can meet the basic requirement for using complex network strategies that assess different brain areas over time (Onias et al., 2014). To date, most brain network studies have used linear correlations between brain regions to construct and interpret brain networks, like PCC. However, the PCC and linear correlation are only sensitive to the linear component and may ignore the non-linear relationship between brain regions. We are considering the so-called non-linear measurement that refers to a method that is sensitive to both linearity and non-linearity, such as sample entropy. Furthermore, complex network analysis can extract feature indicators in the brain network, and graph theory is an important tool for describing network features. Recently, merging evidence suggests that functional connectivity networks change dynamically over time (Hutchison et al., 2013; Hindriks et al., 2016). Specifically, the dynamic connectivity networks constructed from the original fMRI time series demonstrate less discrimination and less robustness in terms of topological measures such as small-worldness and efficiency for classification between the seafarers and the control group than the dynamic entropy-based connectivity networks (see Supplementary Figures 1–3 and Supplementary Table 1). In addition, the dynamical complexity changes are the focus of this study. Therefore, we estimated dynamic connectivity networks based on brain entropy map sequences, in order to detect the topological changes of functional neuroplasticity in seafarers.
We also find that the difference between seafarers and non-seafarers becomes more significant as the window length increases. This may be because the sample entropy is less than 85 at the time point, where the entropy value calculation ignores the detailed information in the BOLD signal (Chen et al., 2009); meanwhile, in the shorter-length data, the sample entropy is insufficient in distinguishing ability (Sokunbi, 2014).
In our results, the seafarer group demonstrates longer path lengths across all thresholds, the average path length Lp of the seafarer group increased significantly (p = 0.0296 < 0.05, Len = 90 TRs). Similarly, we note that the difference in path length is significant at p <0.05 above threshold K = 0.1, as more edges are retained (see Supplementary Table 2). In the small-world brain network, a shorter path length indicates a small amount of intermediate transmission in the integration pathway, thereby consolidating the accurate and rapid transmission of information in integrated neural communication (Kaiser and Hilgetag, 2006). On the contrary, a large number of intermediate transmissions will result in greater signal loss, signal distortion, and slower processing speed. Therefore, the study shows that the increased path length can be explained by the weaker processing speed of the seafarers’ brain network. Although there is no significant difference in the average clustering coefficient Cp between the seafarer group and the non-seafarer group (p = 0.2785 > 0.05, Len = 90 TRs), the average normalized clustering coefficient γ was significantly lower than that of the non-seafarer group (p = 0.0174 < 0.05, Len = 90 TRs). However, we rarely found the difference in clustering coefficient across all thresholds (see Supplementary Table 2), which would indicate that there are no between-group differences in the ability to “modularize” information processing. Under different window lengths, both the seafarer group and the non-seafarer group have small-world network attributes (S 1), which indicates that the small-world network is an inherent attribute of the human brain regardless of occupation.
With regard to the efficiency, the network efficiency of the same seafarer group is relatively low. The average global efficiency Eglob (p = 0.0005 < 0.05, Len = 90 TRs) and average local efficiency Eloc (p = 0.0009 < 0.05, Len = 90 TRs) is significantly different with the non-seafarer group. Interestingly, the Supplementary Table 2 results of each threshold have shown that the difference in global efficiency is significant above threshold K = 0.15, while the results of local efficiency are not statistically significant. Therefore, combined with the prior results, we could infer the seafarer might be weak in the long distance information procedure of each brain region, but the processing capability within regions is as efficient as the averages.
Selection of Complexity Measures
Recently, many studies have shown that multi-scale entropy (MSE) (Costa et al., 2005) can measure the complexity of time series by taking into account different scales, where MSE is also proven to be effective in analyzing the rs-fMRI time series or physiologic data (Hu and Liang, 2012; Wang D. J. et al., 2018). However, the sample entropy of a time series corresponds to “scale 1” of the MSE analysis procedure (Costa et al., 2005; Sokunbi, 2014; Shafiei et al., 2019). Further, the aim of this study is to explore the dynamical complexity alteration caused by long-term occupational experience, which should be measured based on the continuous brain entropy time series. If the MSE with “scale 2” or “scale 3” is performed on original fMRI time series within the sliding windows, it generates the non-continuous brain entropy time series, which severely affects the decoding performance of the dynamical complexity of the brain. Thus, in this study, the sample entropy (i.e., MSE with scale 1) is chosen to estimate the entropy values in the proposed DBCA.
Limitations and Future Direction
This study demonstrates the capability of DBCA in rs-fMRI capturing the differences between seafarers and non-seafarers, presumably activated activity, and functional connectivity alteration related to the occupational factors. However, these findings of DBCA in seafarers are needed to validate on large-scale datasets in our future work. It can be verified that the information theory-based methods make a contribution on brain functional networks, and further research is needed to explore the linear and non-linear interactions among multiple occupations in brain functional network analysis.
Conclusion
In order to investigate the dynamical complexity fingerprints derived from the fMRI data, in this study, a novel DBCA framework was proposed to explore the dynamical complexity of brain activity and topological complexity changes of brain connectivity. Further, taking the professional seafarers as an exemplar, the complexity fingerprints related to occupational factors impacting functional neuroplasticity were explored, which validated the effectiveness of the proposed DBCA. On one hand, the dynamical brain entropy mapping analysis in DBCA showed that the seafarers with lower dynamical brain entropy values had stronger consistent brain activity in the cerebellum, which possibly contributed to the career performance in seafarers such as navigation skills, keeping balance, etc. On the other hand, based on the brain entropy-based complex network analysis, it was found that the occupational neuroplasticity was also supported by the complexity alteration of the functional connectivity of the seafarers, which likely meant that the processing network efficiency and modular processing capacity in seafarers were lower than those in the control group. In summary, the DBCA method is effective to explore the dynamic complexity changes at voxel-wise activity and region-wise connectivity, showing that occupational experience can reshape dynamic brain complexity fingerprints.
Data Availability Statement
The datasets presented in this article are not readily available because our research project is still going on. Requests to access the datasets should be directed to NW (d2FuZ25pemh1YW4xMTIwQGdtYWlsLmNvbQ==).
Ethics Statement
The studies involving human participants were reviewed and approved by the IRB of East China Normal University (ECNU). The patients/participants provided their written informed consent to participate in this study.
Author Contributions
HY and HW: conceptualization, methodology, validation, formal analysis, writing – original draft, and funding acquisition. YC: software and writing – review and editing. YY, MX and JZ: conceptualization, investigation, and writing – review and editing. WZ: investigation, writing – review and editing, and data curation. CC and NW: conceptualization, resources, writing – review and editing, supervision, funding acquisition, and project administration. All authors contributed to the article and approved the submitted version.
Funding
This work was supported by National Natural Science Foundation of China (Nos. 61971289 and 82001160), Project of “Six Talent Peaks” of Jiangsu Province (No. SWYY-017), Project of Huaguoshan Mountain Talent Plan—Doctors for Innovation and Entrepreneurship, Shenzhen Fundamental Research Project (No. JCYJ20170412111316339), and Shenzhen Talent Peacock Plan (No. 827-000083).
Conflict of Interest
The authors declare that the research was conducted in the absence of any commercial or financial relationships that could be construed as a potential conflict of interest.
Publisher’s Note
All claims expressed in this article are solely those of the authors and do not necessarily represent those of their affiliated organizations, or those of the publisher, the editors and the reviewers. Any product that may be evaluated in this article, or claim that may be made by its manufacturer, is not guaranteed or endorsed by the publisher.
Supplementary Material
The Supplementary Material for this article can be found online at: https://www.frontiersin.org/articles/10.3389/fnins.2022.830808/full#supplementary-material
Footnotes
- ^ http://rfmri.org/DPARSF
- ^ http://www.fil.ion.ucl.ac.uk/spm/software/
- ^ http://www.restfmri.net/forum/REST
- ^ https://people.cas.sc.edu/rorden/mricro/mricro.html
References
Abásolo, D., Hornero, R., Espino, P., Alvarez, D., and Poza, J. (2006). Entropy analysis of the EEG background activity in Alzheimer’s disease patients. Physiol. Meas. 27:241.
Achard, S., Salvador, R., Whitcher, B., Suckling, J., and Bullmore, E. D. (2006). A resilient, low-frequency, small-world human brain functional network with highly connected association cortical hubs. J. Neurosci. 26, 63–72.
Allen, E. A., Damaraju, E., Plis, S. M., Erhardt, E. B., Eichele, T., and Calhoun, V. D. (2014). Tracking whole-brain connectivity dynamics in the resting state. Cereb. Cortex 24, 663–676.
Avena-Koenigsberger, A., Misic, B., and Sporns, O. (2018). Communication dynamics in complex brain networks. Nat. Rev. Neurosci. 19, 17–33.
Bonifazi, P., Goldin, M., Picardo, M. A., Jorquera, I., Cattani, A., Bianconi, G., et al. (2009). GABAergic hub neurons orchestrate synchrony in developing hippocampal networks. Science 326, 1419–1424.
Braun, U., Schäfer, A., Walter, H., Erk, S., Romanczuk-Seiferth, N., Haddad, L., et al. (2015). Dynamic reconfiguration of frontal brain networks during executive cognition in humans. Proc. Natl. Acad. Sci. U.S.A. 112, 11678–11683.
Bullmore, E., and Sporns, O. (2009). Complex brain networks: graph theoretical analysis of structural and functional systems. Nat. Rev. Neurosci. 10, 186–198.
Calhoun, V. D., Miller, R., Pearlson, G., and Adalı, T. (2014). The chronnectome: time-varying connectivity networks as the next frontier in fMRI data discovery. Neuron 84, 262–274.
Chen, W., Zhuang, J., Yu, W., and Wang, Z. (2009). Measuring complexity using fuzzyen, apen, and sampen. Med. Eng. Phys. 31, 61–68.
Cole, M. W., Reynolds, J. R., Power, J. D., Repovs, G., Anticevic, A., and Braver, T. S. (2013). Multi-task connectivity reveals flexible hubs for adaptive task control. Nat. Neurosci. 16, 1348–1355.
Costa, M., Goldberger, A. L., and Peng, C. K. (2005). Multiscale entropy analysis of biological signals. Phys. Rev. E 71:021906.
Deco, G., Jirsa, V. K., Robinson, P. A., Breakspear, M., and Friston, K. (2008). The dynamic brain: from spiking neurons to neural masses and cortical fields. PLoS Comput. Biol. 4:e1000092. doi: 10.1371/journal.pcbi.1000092
DiNuzzo, M., Mascali, D., Moraschi, M., Bussu, G., Maraviglia, B., Mangia, S., et al. (2017). Temporal information entropy of the blood-oxygenation level-dependent signals increases in the activated human primary visual cortex. Front. Phys. 5:7. doi: 10.3389/fphy.2017.00007
Dottori, M., Hesse, E., Santilli, M., Vilas, M. G., Caro, M. M., Fraiman, D., et al. (2020). Task-specific signatures in the expert brain: differential correlates of translation and reading in professional interpreters. NeuroImage 209, 116519.
Duan, X., Long, Z., Chen, H., Liang, D., Qiu, L., Huang, X., et al. (2014). Functional organization of intrinsic connectivity networks in Chinese-chess experts. Brain Res. 1558, 33–43.
Ferenets, R., Vanluchene, A., Lipping, T., Heyse, B., and Struys, M. M. (2007). Behavior of entropy/complexity measures of the electroencephalogram during propofol-induced sedationdose-dependent effects of remifentanil. Anesthesiology 106, 696–706.
Fu, Z., Sui, J., Turner, J. A., Du, Y., Assaf, M., Pearlson, G. D., et al. (2020). Dynamic functional network reconfiguration underlying the pathophysiology of schizophrenia and autism spectrum disorder. Hum. Brain Mapp. 42, 80–94. doi: 10.1002/hbm.25205
Ghuman, A. S., Brunet, N. M., Li, Y., Konecky, R. O., Pyles, J. A., Walls, S. A., et al. (2014). Dynamic encoding of face information in the human fusiform gyrus. Nat. Commun. 5:5672.
Goldberger, A. L., Peng, C. K., and Lipsitz, L. A. (2002). What is physiologic complexity and how does it change with aging and disease? Neurobiol. Aging 23, 23–26.
Gu, H., Pan, B., Chen, G., and Duan, L. (2014). Biological experimental demonstration of bifurcations from bursting to spiking predicted by theoretical models. Nonlinear Dyn. 78, 391–407.
Hagmann, P., Cammoun, L., Gigandet, X., Meuli, R., Honey, C. J., Wedeen, V. J., et al. (2008). Mapping the structural core of human cerebral cortex. PLoS Biol. 6:e159. doi: 10.1371/journal.pbio.0060159
Hartman, D., Hlinka, J., Paluš, M., Mantini, D., and Corbetta, M. (2011). The role of nonlinearity in computing graph-theoretical properties of resting-state functional magnetic resonance imaging brain networks. Chaos 21:013119.
Hayasaka, S., and Laurienti, P. J. (2010). Comparison of characteristics between region-and voxel-based network analyses in resting-state fMRI data. Neuroimage 50, 499–508.
Hindriks, R., Adhikari, M. H., Murayama, Y., Ganzetti, M., Mantini, D., Logothetis, N. K., et al. (2016). Can sliding-window correlations reveal dynamic functional connectivity in resting-state fMRI? Neuroimage 127, 242–256.
Hlinka, J., Paluš, M., Vejmelka, M., Mantini, D., and Corbetta, M. (2011). Functional connectivity in resting-state fMRI: is linear correlation sufficient? Neuroimage 54, 2218–2225.
Hu, M., and Liang, H. (2012). Adaptive multiscale entropy analysis of multivariate neural data. IEEE Trans. Biomed. Eng. 59, 12–15.
Hutchison, R. M., Womelsdorf, T., Allen, E. A., Bandettini, P. A., Calhoun, V. D., Corbetta, M., et al. (2013). Dynamic functional connectivity: promise, issues, and interpretations. Neuroimage 80, 360–378.
Jia, Y., Gu, H., and Luo, Q. (2017). Sample entropy reveals an age-related reduction in the complexity of dynamic brain. Scientific reports 7:7990.
Jung, W. H., Kim, S. N., Lee, T. Y., Jang, J. H., Choi, C. H., Kang, D. H., et al. (2013). Exploring the brains of Baduk (Go) experts: gray matter morphometry, resting-state functional connectivity, and graph theoretical analysis. Front.Hum. Neurosci. 7:633. doi: 10.3389/fnhum.2013.00633
Kaiser, M., and Hilgetag, C. C. (2006). Nonoptimal component placement, but short processing paths, due to long-distance projections in neural systems. PLoS Comput. Biol. 2:e95. doi: 10.1371/journal.pcbi.0020095
Lahaye, P. J., Poline, J. B., Flandin, G., Dodel, S., and Garnero, L. (2003). Functional connectivity: studying nonlinear, delayed interactions between BOLD signals. NeuroImage 20, 962–974.
Latora, V., and Marchiori, M. (2001). Efficient behavior of small-world networks. Phys. Rev. Lett. 87:198701.
Lin, C., Lee, S. H., Huang, C. M., Chen, G. Y., Ho, P. S., Liu, H. L., et al. (2019). Increased brain entropy of resting-state fMRI mediates the relationship between depression severity and mental health-related quality of life in late-life depressed elderly. J. Affect. Disord. 250, 270–277.
Lindquist, M. A., Xu, Y., Nebel, M. B., and Caffo, B. S. (2014). Evaluating dynamic bivariate correlations in resting-state fMRI: a comparison study and a new approach. NeuroImage 101, 531–546.
Lurie, D. J., Kessler, D., Bassett, D. S., Betzel, R. F., Breakspear, M., Kheilholz, S., et al. (2020). Questions and controversies in the study of time-varying functional connectivity in resting fMRI. Netw. Neurosci. 4, 30–69.
Maldjian, J. A., Laurienti, P. J., and Burdette, J. H. (2004). Precentral gyrus discrepancy in electronic versions of the talairach atlas. Neuroimage 21, 450–455.
Maldjian, J. A., Laurienti, P. J., Burdette, J. B., and Kraft, R. A. (2003). An automated method for neuroanatomic and cytoarchitectonic atlas based interrogation of fMRI data sets. Neuroimage 19, 1233–1239.
Maslov, S., and Sneppen, K. (2002). Specificity and stability in topology of protein networks. Science 296, 910–913.
Mears, D., and Pollard, H. B. (2016). Network science and the human brain: using graph theory to understand the brain and one of its hubs, the amygdala, in health and disease. J. Neurosci. Res. 94, 590–605.
Nie, W., Zeng, W., Yang, J., Shi, Y., Zhao, L., Li, Y., et al. (2021). Extraction and analysis of dynamic functional connectome patterns in migraine sufferers: a resting-state fMRI study. Comput. Math. Methods Med. 2021, 6614520–6614520.
Niu, Y., Wang, B., Zhou, M., Xue, J., Shapour, H., Cao, R., et al. (2018). Dynamic complexity of spontaneous bold activity in Alzheimer’s disease and mild cognitive impairment using multiscale entropy analysis. Front. Neurosci. 12:677. doi: 10.3389/fnins.2018.00677
Onias, H., Viol, A., Palhano-Fontes, F., Andrade, K. C., Sturzbecher, M., Viswanathan, G., et al. (2014). Brain complex network analysis by means of resting state fMRI and graph analysis: will it be helpful in clinical epilepsy? Epilepsy Behav. 38, 71–80.
Ou, J., Li, W., Yang, Y., Wang, N., and Xu, M. (2020). Earlier second language acquisition is associated with greater neural pattern dissimilarity between the first and second languages. Brain Lang. 203:104740.
Preti, M. G., Bolton, T. A., and Van De Ville, D. (2017). The dynamic functional connectome: state-of-the-art and perspectives. Neuroimage 160, 41–54.
Pritchard, W. S., Laurienti, P. J., Burdette, J. H., and Hayasaka, S. (2014). Functional brain networks formed using cross-sample entropy are scale free. Brain Connect. 4, 454–464.
Richman, J. S., and Moorman, J. R. (2000). Physiological time-series analysis using approximate entropy and sample entropy. Am. J. Physiol. Heart Circ. Physiol. 278, H2039–H2049.
Richman, J. S., Lake, D. E., and Moorman, J. R. (2004). Sample entropy. Methods Enzymol. 384, 172–184.
Rubinov, M., and Sporns, O. (2010). Complex network measures of brain connectivity: uses and interpretations. Neuroimage 52, 1059–1069.
Shafiei, G., Zeighami, Y., Clark, C. A., Coull, J. T. Nagano-Saito, A., Leyton, M., et al. (2019). Dopamine signaling modulates the stability and integration of intrinsic brain networks. Cereb. Cortex 29, 397–409. doi: 10.1093/cercor/bhy264
Shi, Y., Zeng, W., and Guo, S. (2019). The occupational brain plasticity study using dynamic functional connectivity between multi-networks: take seafarers for example. IEEE Access 7, 148098–148107.
Shi, Y., Zeng, W., and Wang, N. (2021). The brain alteration of Seafarer revealed by activated functional connectivity mode in fMRI data analysis. Front. Hum. Neurosci. 15:656638. doi: 10.3389/fnhum.2021.656638
Shi, Y., Zeng, W., Wang, N., and Zhao, L. (2018). A new constrained spatiotemporal ICA method based on multi-objective optimization for fMRI data analysis. IEEE Trans. Neural Syst. Rehabil. Eng. 26, 1690–1699.
Sokunbi, M. O. (2014). Sample entropy reveals high discriminative power between young and elderly adults in short fMRI data sets. Front. Neuroinform. 8:69. doi: 10.3389/fninf.2014.00069
Sokunbi, M. O., Cameron, G. G., Ahearn, T. S., Murray, A. D., and Staff, R. T. (2015). Fuzzy approximate entropy analysis of resting state fMRI signal complexity across the adult life span. Med. Eng. Phys. 37, 1082–1090.
Sokunbi, M. O., Gradin, V. B., Waiter, G. D., Cameron, G. G., Ahearn, T. S., Murray, A. D., et al. (2014). Nonlinear complexity analysis of brain FMRI signals in schizophrenia. PLoS One 9:e95146. doi: 10.1371/journal.pone.0095146
Sokunbi, M. O., Staff, R. T., Waiter, G. D., Ahearn, T. S., Fox, H. C., Deary, I. J., et al. (2011). Inter-individual differences in fMRI entropy measurements in old age. IEEE Trans. Biomed. Eng. 58, 3206–3214.
Song, X. W., Dong, Z. Y., Long, X. Y., Li, S. F., Zuo, X. N., Zhu, C. Z., et al. (2011). REST: a toolkit for resting-state functional magnetic resonance imaging data processing. PLoS One 6:e25031. doi: 10.1371/journal.pone.0025031
Sporns, O. (2011). The non-random brain: efficiency, economy, and complex dynamics. Front. Comput. Neurosci. 5:5. doi: 10.3389/fncom.2011.00005
Su, L., Wang, L., Shen, H., Feng, G., and Hu, D. (2013). Discriminative analysis of non-linear brain connectivity in schizophrenia: an fMRI Study. Front. Hum. Neurosci. 7:702. doi: 10.3389/fnhum.2013.00702
Tzourio-Mazoyer, N., Landeau, B., Papathanassiou, D., Crivello, F., Etard, O., Delcroix, N., et al. (2002). Automated anatomical labeling of activations in SPM using a macroscopic anatomical parcellation of the MNI MRI single-subject brain. Neuroimage 15, 273–289.
van den Heuvel, M. P., Stam, C. J., Boersma, M., and Pol, H. H. (2008). Small-world and scale-free organization of voxel-based resting-state functional connectivity in the human brain. Neuroimage 43, 528–539.
Vergara, V. M., Abrol, A., and Calhoun, V. D. (2019). An average sliding window correlation method for dynamic functional connectivity. Hum. Brain Mapp. 40, 2089–2103.
Vidaurre, D., Smith, S. M., and Woolrich, M. W. (2017). Brain network dynamics are hierarchically organized in time. Proc. Natl. Acad. Sci. U.S.A. 114, 12827–12832.
Wang, B., Niu, Y., Miao, L., Cao, R., Yan, P., Guo, H., et al. (2017). Decreased complexity in Alzheimer’s disease: resting-state fMRI evidence of brain entropy mapping. Front. Aging Neurosci. 9:378. doi: 10.3389/fnagi.2017.00378
Wang, D. J., Jann, K., Fan, C., Qiao, Y., Zang, Y. F., Lu, H., et al. (2018). Neurophysiological basis of multi-scale entropy of brain complexity and its relationship with functional connectivity. Front. Neurosci. 12:352. doi: 10.3389/fnins.2018.00352
Wang, J., Wang, X., Xia, M., Liao, X., Evans, A., and He, Y. (2015). GRETNA: a graph theoretical network analysis toolbox for imaging connectomics. Front. Hum. Neurosci. 9:386. doi: 10.3389/fnhum.2015.00386
Wang, N., Wu, H., Xu, M., Yang, Y., Chang, C., Zeng, W., et al. (2018). Occupational functional plasticity revealed by brain entropy: a resting-state fMRI study of seafarers. Hum. Brain Mapp. 39, 2997–3004.
Wang, N., Zeng, W., and Chen, D. (2016). A novel sparse dictionary learning separation (SDLS) model with adaptive dictionary mutual incoherence constraint for fMRI data analysis. IEEE Trans. Biomed. Eng. 63, 2376–2389.
Wang, N., Zeng, W., Chen, D., Yin, J., and Chen, L. (2015). A novel brain networks enhancement model (BNEM) for BOLD fMRI data analysis with highly spatial reproducibility. IEEE J. Biomed. Health Inf. 20, 1107–1119.
Wang, N., Zeng, W., Shi, Y., and Yan, H. (2017). Brain functional plasticity driven by career experience: a resting-state fMRI study of the seafarer. Front. Psychol. 8:1786. doi: 10.3389/fpsyg.2017.01786
Wang, Z., Li, Y., Childress, A. R., and Detre, J. A. (2014). Brain entropy mapping using fMRI. PLoS One 9:e89948. doi: 10.1371/journal.pone.0089948
Watts, D. J., and Strogatz, S. H. (1998). Collective dynamics of ‘small-world’ networks. Nature 393, 440–442.
Wei, G., Si, R., Li, Y., Yao, Y., Chen, L., Zhang, S., et al. (2020). “No Pain No Gain”: evidence from a parcel-wise brain morphometry study on the volitional quality of elite athletes. Brain Sci. 10:459.
Wu, H., Yan, H., Yang, Y., Xu, M., Shi, Y., Zeng, W., et al. (2020). Occupational neuroplasticity in the human brain: a critical review and meta-analysis of neuroimaging studies. Front. Hum. Neurosci. 14:215. doi: 10.3389/fnhum.2020.00215
Xie, X., Cao, Z., and Weng, X. (2008). Spatiotemporal nonlinearity in resting-state fMRI of the human brain. Neuroimage 40, 1672–1685.
Yang, Y., Tam, F., Graham, S. J., Sun, G., Li, J., Gu, C., et al. (2020). Men and women differ in the neural basis of handwriting. Hum. Brain Mapp. 41, 2642–2655.
Yang, Y., Zuo, Z., Tam, F., Graham, S. J., Tao, R., Wang, N., et al. (2019). Brain activation and functional connectivity during Chinese writing: an fMRI study. J. Neurolinguistics 51, 199–211.
Yao, S., Zeng, W., Wang, N., and Chen, L. (2013). Validating the performance of one-time decomposition for fMRI analysis using ICA with automatic target generation process. Mag. Reson. Imaging 31, 970–975.
Yilmaz, E., Ozer, M., Baysal, V., and Perc, M. (2016). Autapse-induced multiple coherence resonance in single neurons and neuronal networks. Sci. Rep. 6:30914.
Yu, S., Huang, D., Singer, W., and Nikolić, D. (2008). A small world of neuronal synchrony. Cereb. Cortex 18, 2891–2901.
Zalesky, A., Fornito, A., Cocchi, L., Gollo, L. L., and Breakspear, M. (2014). Time-resolved resting-state brain networks. Proc. Natl. Acad. Sci. U.S.A. 111, 10341–10346.
Keywords: brain entropy, dynamical complexity, efficiency, graph theory, occupational neuroplasticity, seafarer, small-worldness
Citation: Yan H, Wu H, Chen Y, Yang Y, Xu M, Zeng W, Zhang J, Chang C and Wang N (2022) Dynamical Complexity Fingerprints of Occupation-Dependent Brain Functional Networks in Professional Seafarers. Front. Neurosci. 16:830808. doi: 10.3389/fnins.2022.830808
Received: 07 December 2021; Accepted: 24 January 2022;
Published: 18 March 2022.
Edited by:
Albert Yang, National Yang Ming Chiao Tung University, TaiwanReviewed by:
Shimin Cai, University of Electronic Science and Technology of China, ChinaFabio Baselice, University of Naples Parthenope, Italy
Copyright © 2022 Yan, Wu, Chen, Yang, Xu, Zeng, Zhang, Chang and Wang. This is an open-access article distributed under the terms of the Creative Commons Attribution License (CC BY). The use, distribution or reproduction in other forums is permitted, provided the original author(s) and the copyright owner(s) are credited and that the original publication in this journal is cited, in accordance with accepted academic practice. No use, distribution or reproduction is permitted which does not comply with these terms.
*Correspondence: Nizhuan Wang, d2FuZ25pemh1YW4xMTIwQGdtYWlsLmNvbQ==; Chunqi Chang, Y3FjaGFuZ0BzenUuZWR1LmNu
†These authors have contributed equally to this work
 Hongjie Yan
 Huijun Wu
 Yanyan Chen
 Yang Yang
 Min Xu
 Weiming Zeng
 Jian Zhang6
 Chunqi Chang
 Nizhuan Wang
